1
GEOTYCOON 2 – USER MANUAL – DRAFT ED07
GEOTYCOON 2
USER MANUAL
DRAFT ED07
www.geosoftliner.org
Page 1/39
GEOTYCOON 2 – USER MANUAL – DRAFT ED07
1 Introduction
GeoTycoon (*) is an experimental tool that can help you design, evaluate, reference and publish
large infrastructure networks (ground transportation, water supply and waste, power grids,
telecommunications, ...), from street to continental scales.
GeoTycoon applications span from design to implementation and maintenance of large
infrastructure networks.
(*) The name GeoTycoon is a wink to a family of management games.
GeoTycoon combines a Geographic Information System, a Geographic Infrastructure Network
Editor and an Application Server.
The Geographic Information System provide and display geographic information, it can to
customised to specific needs and can provide access to various kind of geographic information such
as:
•
Satellite Imagery (Blue Marble, LANDSAT, ...)
•
Terrain Elevation and Bathymetry (ETOPO1, GEBCO, ...)
•
Thematic Raster Cartography (Street maps, ...)
•
Thematic Vector Cartography (Administrative Boundaries, Geological Areas, ...)
Page 2/39
GEOTYCOON 2 – USER MANUAL – DRAFT ED07
•
Points of Interest (volcanoes, cities, ...)
More information on how to specify geographic information sources can be found at section 7
Geographic Information Sources, page 24.
The Geographic Infrastructure Network Editor allows to design and manage simple or complex
networks based on specific network models you can tailor. The network models are themselves
based on a fairly simple and generic network model consisting of the following base objects:
•
node: a geographic place where some kind of processing takes place, e.g. a warehouse, a
manufacturing plant, a power plant, an oil well, a refinery...
•
route position: a geographical route which interconnects nodes and is defined by geographic
way points and the interconnected nodes.
•
route: a geographical route which is defined by a sequence of route position and
intermediate nodes to go through.
•
line: a featured path in the network.
More information on the definition of network models can be found at section 6 Network Model
Definition, page 18.
More information on how to edit a network can be found at section 3 User Application Sofware –
GUI Basics, page 6.
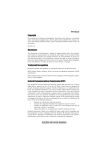
1.1 Organisation of the application
The application is organised around three entities:
–
The Users (you), accessing the GeoTycoon functionality through the User Application
software running on their personal computer.
–
The Collaboration Center, which enables teamwork and delivers online support.
–
The Geographic Information Sources, which are delivered by third parties and enable the
Users to design their network around the geographic information.
Page 3/39
GEOTYCOON 2 – USER MANUAL – DRAFT ED07
User
Application
Collaboration
Center
USER
INTERNET
Geographic
Information
Sources
1.1.1 User Application and Configuration
The User (you) interfaces with GeoTycoon through a local software application "User Application"
that is installed on the user's computer.
The basic role the the "User Application" is to enable the user to edit the geographic network over
geographical information, and to publish network reports.
This User Application is customisable to various type of networks and geographic information
sources. This customisation is provided under a dedicated "User Configuration" file set-up by the
user.
1.1.2 Collaboration Center
At one end of the GeoTycoon application is the "Collaboration Center" that enable the user to
teamwork with other GeoTycoon users. The User Application requires to sign in the Collaboration
Center to deliver full functionality.
1.1.3 Geographic Information Source
A Geographic Information Source delivers various kind of geographic information such as
•
Satellite Imagery (Blue Marble, LANDSAT, ...)
•
Terrain Elevation and Bathymetry (ETOPO1, GEBCO, ...)
•
Thematic Raster Cartography (Street maps, ...)
•
Thematic Vector Cartography (Administrative Boundaries, Geological Areas, ...)
•
Points of Interest (volcanoes, cities, ...)
Page 4/39
GEOTYCOON 2 – USER MANUAL – DRAFT ED07
2 User Application Software Installation
The GeoTyccon user application runs on a PC with Microsoft Windows® XP, Vista or 7. The
minimum recommended configuration requires 2 Gbytes RAM and a good Internet access (512
kbit/s minimum).
To install the user application on your computer please follow the steps below:
•
Download the application setup file from the GeoTycoon web site.
•
Run the application setup file
•
Follow the registration steps (only in case of first installation)
•
Link the software application to a configuration file (²)
•
enjoy ....
2.1 User Application Registration Process
To be drafted. Please follow the instructions displayed by the User Application.
Page 5/39
GEOTYCOON 2 – USER MANUAL – DRAFT ED07
3 User Application Sofware – GUI Basics
The GUI enables:
•
to build an infrastructure network on top of geographic maps supported by the display of
geographic information corresponding to the mouse cursor position on the map, and
•
to collaborate with other selected users through the Collaboration Center.
3.1 Top Menu Bar
The top menu bar provides access to top level functions such as loading and saving a network file
(File sub-menu), global configuration settings (Tools sub-menu) and provide information on
internet connectivity.
Page 6/39
GEOTYCOON 2 – USER MANUAL – DRAFT ED07
Internet connectivity status:
The ping bullet gives an indication on Internet connection quality (ping response time). A green
bullet indicates the internet connectivity is good, a red bullet indicates the internet connectivity
could not be established. In the later case you should check your network access and possibly
configure the parameters of the possible network proxy required by your network to access the
Internet. To configure the network proxy parameters click on the Tools in the top menu bar.
Collaboration Center status:
A green bullet indicates the User Application has succesfully signed into the collaboration center.
An amber bullet indicates the user Application could not sign in because of Internet connectivity
issue, but it is still in the allowed Collaboration Center offline time period.
A red bullet indicates the User Application could not sign in because the registration process has to
be run again, or the allowed offline time period has expired.
The color bullet is followed by the user e-mail used for the registration in the Collaboration Center,
the date of expiry when the user will have to register again into the Collaboration Center to continue
using the application, and into parenthesis the Internet offline time limit allowed.
3.2 Network Display Area
The Network Display Area is the area where the user can create, position and interconnect tthe
network objects on the map.
There are four tabs to access different editor functionalities:
GEOMAP tab: it is the main geographic network editor of the User Application.
EDIT CONF tab: to edit functional network configurations based on sets of geographic network
objects with different functional relationships.
Web Map tab: to display the network on top of Google maps in a web browser.
WW tab: to display the network on a WorldWind globe.
Page 7/39
GEOTYCOON 2 – USER MANUAL – DRAFT ED07
3.2.1 GEOMAP tab
The GEOMAP tab selects the fully functional network editor based on a Mercator projection of the
WGS84.
The top menu bar allows some actions on the editor, and the construction of the network on the map
is performed through the mouse:
a mouse right click on the map will open a contextual menu to create, delete, (dis-)connect,
network objects, and perform other map actions depending on the position of the mouse cursor on
the map.
Page 8/39
GEOTYCOON 2 – USER MANUAL – DRAFT ED07
3.2.2 EDIT CONF tab
Page 9/39
GEOTYCOON 2 – USER MANUAL – DRAFT ED07
3.2.3 WEB MAP tab
Page 10/39
GEOTYCOON 2 – USER MANUAL – DRAFT ED07
3.2.4 WW tab
3.3 Objects outline view
The objects outline view lists all network objects in a group hierachical structure defined by the
User.
The object selected in the outline view (left mouse click) is detailled in the object properties view,
and some of its properties can be modified in this view. The color of the object on the map will also
change to facilitate its localisation on the map.
A double mouse click on an object in the outline view will center the corresponding object in the
network map display.
3.4 Object properties view
This view shows the properties of the object selected in the outline view and allow modifying some
of them.
Page 11/39
GEOTYCOON 2 – USER MANUAL – DRAFT ED07
3.4.1 Properties common to all objects
a
History
Tracks creation and modifications of the objects (date and author)
b
Local Name
Edit the local name of the object. The full name of the object is constructed from the
sequence of the enclosing group names and the local name, in a similar way as a file name in a
computer system.
3.4.2 Properties of route position objects
a
Connections
List of all the node objects connected to route positions.
b
Route Position List
Edit the route position coordinates.
Page 12/39
GEOTYCOON 2 – USER MANUAL – DRAFT ED07
c
Route Profile
Display the route elevations profile as a graph.
Page 13/39
GEOTYCOON 2 – USER MANUAL – DRAFT ED07
3.4.3 Properties of node objects
a
Coordinates
b
Connections
Page 14/39
GEOTYCOON 2 – USER MANUAL – DRAFT ED07
4 Network Configurations
A Network Configuration extends the basic geographic network setup by defining additional
relationship over the nodes and routes, by defining lines, and configuration arrangements. It also
provides schematic views of the geographic network.
Page 15/39
GEOTYCOON 2 – USER MANUAL – DRAFT ED07
5 User Software Configuration
The configuration of the user software allows to define custom network models and custom
geographic layers to underlay the network display.
The configuration is defined through a text file passed by the user to the user application: the
Content Definition File.
The file is passed to the user application at the end of the user application registration process.
It is also possible to change the configuration file through the user interface. On the top bar menu
select Tools , Configuration and Content Definition File. Click on the Select button to change the
current Content Definition File.
The Content Definition File contains a list of definitions. The syntax of the each definition is a set of
"identier = value" pairs:
identifier1 = value1
identifier2 = value2
….
the values (value1, value2, …) are described in JSON syntax.
For the user application there are only two predefined identifier entries:
•
network.javascript: this entry indicates the location of the network models to be used by
the application (cf. Network Model Definition). The value of this entry shall be a JSON
array of strings. Each string in the array is an URL to a Network Model Definition
javascript. The URL can be located on a remote server accessible via http (e.g.
'http://www.models.org/mymodel.js'), or located on the local computer
('file:///C:\models\mymodel.js'). The use of a '$' at the beginning of the URL refers to the
base URL of the Content Definition File, so the location of the Network Model Definition
can be provided relatively to the configuration file location ('$./mymodel.js'). For instance, if
the configuration file is located at 'http://www.models.org/myconf.cfg', the location
'$./mymodel.js' is translated into 'http://www.models.org/mymodel.js'.
•
map.layers: this entry indicates the geographic information sources to be used and
Page 16/39
GEOTYCOON 2 – USER MANUAL – DRAFT ED07
displayed by the application (cf Geographic Information Sources). The value of this entry
shall be a JSON array of strings. Each string in the array is a reference to a geographic layer
identifier, which shall itself be declared inside the configuration file.
Page 17/39
GEOTYCOON 2 – USER MANUAL – DRAFT ED07
6 Network Model Definition
The GeoTycoon editor can be tailored to specific applications by defining one or more network
models. The network models are passed to the editor application through the configuration file.
A GeoTycoon network is basically composed of four classes of objects:
–
the node, is a geographic place where transport is initiated, terminated, processed or
commuted. Nodes can be interconnected by route positions.
–
the route position, is a geographic path from one node to another defined by a list of
consecutive geographical route positions (way points). Route positions can be connected
with nodes.
–
the route, is a geographic route from one node to another defined by a list of consecutive
route positions and intermediate nodes. The purpose of this type of object is to describe a
route between two nodes by reusing a set of existing route position segments.
–
the line, is a connection between two nodes and which follows a geographic path based on
defined routes, route positions and intermediate nodes.
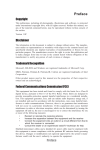
To give an example with a school bus network: the nodes can be compared to bus stops, road
crossings, round-abouts and bus depot, the route positions can be compared to roads, and the lines
can be compared to the fixed transit lines between the depot and the school.
Peter's Farm
John's Hamlet
B. Franklin School
T. Edison School
node
Bus Depot
route position
line
The network model is defined by a javascript file that describe the object classes which are part of
the network model. The object classes are specified in the javascript object notation (JSON). The
javascript shall contain a function Network() that returns the network object class of the model.
6.1 Geo Object Classes
6.1.1 geo.object
geo.object is an abstract object that super class all other GeoTycoon objects. This means that all
attributes and methods of geo.object are implemented by all other GeoTycoon objects.
Attribute Summary
Page 18/39
GEOTYCOON 2 – USER MANUAL – DRAFT ED07
String
id
the identifier of the object class.
String
base
define the base class and is one amongst geo.network, geo.node,
geo.routePosition, geo.route, geo.line.
String
uiname
the name of the class to be presented by the user interface (network
editor, reports ...).
String
uinickname
the short version of the name of the class to be presented by the user
interface (network editor, reports ...).
Object[]
objects
the list of subordinate object classes contained under the object class.
{
outline
boolean create;
define the behaviour in the outline window: if create is true the objects
boolean display;
of the class can be created by an action in the outline window. If display
}
is true the objects of the class are displayed in the outline window. The
default value is { create : true; display : true;}
ConfReport
report
define the way the object is handled by the configuration report manager.
InfoAttribute[]
attributes
the list of user information attributes attached to the object. These
attributes are not operated by the application, but are accessible for
editing through the graphical user interface and are reported in the
configuration reports.
6.1.2 geo.network
geo.network is a root container for a set of objects that are interconnected. There is only a single
instance of this class under the GeoTycoon network editor.
Attribute Summary
displayMaskSet
TBD
Page 19/39
GEOTYCOON 2 – USER MANUAL – DRAFT ED07
6.1.3 geo.node
geo.node is a geographic place where transport is initiated, terminated, processed or commuted.
Nodes can be interconnected by route positions.
Attribute Summary
String
displayImage
The URL of an image that will be displayed on the GEOMAP and
WWMAP of the editor.
Attributes from geo.object
id, base, uiname, uinickname, objects, outline, attributes
Attributes from GenericGraphic
icon16, icon32, displayScale, displayMask, displayLayer, svggraphics, webgraphics
6.1.4 geo.routePosition
geo.routePosition is a geographic path from one node to another defined by a list of consecutive
geographical route positions (way points). Route positions can be connected with nodes.
Attributes from geo.object
id, base, uiname, uinickname, objects, outline, attributes
6.1.5 geo.route
geo.route is a geographic place where transport is initiated, terminated, processed or commuted.
Nodes can be interconnected by route positions.
Attributes from geo.object
id, base, uiname, uinickname, objects, outline, attributes
6.1.6 geo.line
geo.line is a connection between two nodes and which follows a geographic path based on defined
routes, route positions and intermediate nodes.
Attributes from geo.object
Page 20/39
GEOTYCOON 2 – USER MANUAL – DRAFT ED07
id, base, uiname, uinickname, objects, outline, attributes
6.2 Object class naming
Each network model shall be identified to by a unique identifier, and all object classes defined
under this network shall have the identifier of the network at the root of their own identifier. For
instance if the network model identifier is mytest.mymodel, the object classes under the model
shall be identified as mytest.mymodel.myobject.
6.3 Auxiliary Object Interfaces
6.3.1 InfoAttributes
Attribute Summary
InfoAttribute[]
attributes
The list of information attributes (see section 6.3.2)
6.3.2 InfoAttribute
Attribute Summary
String
id
The identifier of the attribute.
String
classz
The class of the attribute, either "string", "integer" or "real".
String|Double
defaultz
The default value of the attribute, in a formpat compatible with the
classz.
6.3.3 GenericGraphics
Attribute Summary
String
icon16
The URL of a 16x16 pixels image that represents the objet in the editor
outline and the action menu items.
String
icon32
The URL of a 32x32 pixels image.
Double[]
displayScale
An array of scaling factors that are applied to the display graphic
depending on the zoom level of the earth globe. First value in the array
corresponds to zoom level 0, second value to zoom level 1 etc... A
scaling factor of 1 is applied to the display graphic when the zoom level
is beyond the size of the array.
Page 21/39
GEOTYCOON 2 – USER MANUAL – DRAFT ED07
Integer
displayMask
This allows the user to hide/ unhide the graphic according to the
displayMask rank. When the displayMask value is higher than the
display mask set by the user on the editor toolbar the display graphic is
hidden.
Integer
displayLayer
The displayLayer value indicate if the display graphic lays on the front
or on the back of other displayImage objects. A display graphic with a
high displayLayer value is displayed on top of other display graphics
with lower value.
WebGraphics
webgraphics
Describes the display of the object in the WebMap editor.
SvgGraphics
svggraphics
Describes the display of the object in the Network Configuration editor.
6.3.4 WebGraphics
Attribute Summary
xxxxxx
.
6.3.5 SvgGraphics
Attribute Summary
SvgElement[]
elements
List of the SVG elements. If the SvgGraphic is attached to a geo.route,
geo.routePosition or a geo.line object, one of the elements shall be an
SVG "polyline".
{
Double x,
Double y
}
connectionPoint
This attribute is used only for nodes. It indicates in the relative
coordinate system of the SvgGraphic the point where routes are
connected to the node.
6.3.6 SvgElement
Attribute Summary
String
element
The type of element. Refer to SVG specification 1.1 for the possible
values. The basic shapes have the following value: "rect", "circle",
"ellipse", "line", "polyline", "polygon".
Page 22/39
GEOTYCOON 2 – USER MANUAL – DRAFT ED07
SvgAttribute[]
attributes
The list of attributes associated with the element.
6.3.7 SvgAttribute
Attribute Summary
String[3]
[0] The first value is a context switch that indicates in which context the
attribute is applicable.
Temporal context:
• "$t==past" the attribute is applicable to objects which are marked
as past objects in the selected configuration filter.
• "$t==present" the attribute is applicable to objects which are
marked as present objects in the selected configuration filter.
• "$t==future" the attribute is applicable to objects which are
marked as future objects in the selected configuration filter.
Orientation context:
• "$o==north"
• "$o==northeast"
• "$o==east"
• "$o==southeast"
• "$o==south"
• "$o==southwest"
• "$o==west"
• "$o==northwest"
[1] The second value is the SVG attribute identifier.
[2] The third value is the attribute value.
6.3.8 ConfReport
attribute Summary
Boolean
routeMark
When listing a route position, the report manager indicates for each
position interval the uinickname of the surrounding (preceding and
succeding) nodes for which the routeMark is set to true.
Page 23/39
GEOTYCOON 2 – USER MANUAL – DRAFT ED07
7 Geographic Information Sources
The geographic information sources provide information relatively to geographic coordinates,
which can be displayed as underlays to the network diagram, and which are used to feed the
network configuration reports.
The layered sources are defined by the entry map.layers in the Content Definition File:
map.layers= [layerId1, layerId2, layerId3]
Each of the layerId listed shall itself be referenced in the Content Definition File, with a reference to
predefined layer types at its root value:
The different types of geographic information sources are:
•
dted: digital terrain elevation data; meant for delivering terrain elevation for given latitute/
longitude coordinates.
•
tiles: raster tile images to be displayed on the map. Starting from zoom level z=0, the world
map is divided at each zoom level in 2^2z images, each image covering an area of 360°/2^z in
longitude by 180°/2^z in latitude.
•
mazetiles: raster images to be displayed on the map.
•
areas
•
polylines
•
locations
As an example, if layerId1 is of the dted type, the Content Definition File shall have the following
entry:
layerId1='dted'
7.1 dted
A dted source provides information on terrain elevation according to latitude/ longitude coordinates.
The terrain elevation information shall be structured as a set of sub-sources for given granularity
levels. Each sub-source contains binary files, each file containing the elevation information for a
specific lat/lon rectangle area on the sphere, each rectangle being of equal size (e.g. 30x30 degrees
each). Subject to the given lat/lon granularity of the sub-source(the lat/lon granular step value), the
files provide an elevation value for a square granular surface inside the area. The finest lat/lon
granular step value for a file is 1 arc second, so a file can contain up to one elevation value for each
1 arc second granular square in the area.
A file is structured as a java array of short integer (short[] elevation) in the sequence of
elevation<lon0, lat0>, elevation<lon0, lat1>, ..., elevation<lon0, latN>
elevation<lon1, lat0>, elevation<lon1, lat1>, ..., elevation<lon1, latN>
...
elevation<lonN, lat0>, elevation<lonN, lat1>, ..., elevation<lonN, latN>
Page 24/39
GEOTYCOON 2 – USER MANUAL – DRAFT ED07
where <lon0, lat0> is the top-left coordinate of the rectangle elevation area, and <lonN, latN> is the
bottom-right coordinate, and where latX+1 – latX = lonX+1 – lonX = granular angle step.
To define the layer layerId as of type dted, set the following entry:
layerId= 'dted'
To define the icon of the layer activation button in the GEOMAP display, set the following entry:
layerId.icon= url of an image of size 16x16 pixels
ex: layerId.icon= '$./physics/dted/elev.gif'
To define the tool tip text of the layer activation button (when mouse hovers it) in the GEOMAP
display, set the following entry:
layerId.tooltip= "tool tip text"
To reference the source and credit the author/owner of the layer , set the following entry:
layerId.source= "reference of source author/ owner"
To indicate the different resolutions provided by the source, set the following entry:
layerId.resolutions= [integer value set]
ex: layerId.resolutions= [480, 240, 120, 30]
where each integer value is the granular angle step in arc seconds of a sub-source.
Each each sub-source structure is further specified by the layerId followed by the granular angle
step in seconds of the sub-source:
layerId.nbSeconds={url: 'FormatString(%1$d , %2$d)', width:
longitudeWidthInDegrees, height: latitudeHeightInDegrees}
ex: layerId.480={url: '$./physics/dted/r16/geoz_16_%2$dx%1$d.bin',
width: 30, height: 30}
ex: layerId.240={url: '$./physics/dted/r8/geoz_8_%2$dx%1$d.bin',
width: 30, height: 30}
where the url indicates the location of the files containing the elevation data according to an xy tile
index, the width indicates the number of longitude degrees covered by each file, and the height
indicates the number of latitude degrees covered by each file. Both width and height shall be a
divider of 180°.
The url of the files shall contain two indexes, one for the longitude (%1$d) and one for the latitude
(%2$d). The longitude index ranges from [0 to 360/longitudeWidthInDegrees[, and the latitude
index ranges from [0 to 180/latitudeHeightInDegrees[.
7.2 tiles
A tiles source provide images of the globe surface according to a zoom level. For a given zoom
Page 25/39
GEOTYCOON 2 – USER MANUAL – DRAFT ED07
level z, the earth is divided in 4^z equally sized tiles of (360°/2^z) longitude width and (180°/2^z)
latitude height.
When the GEOMAP will display a specific earth area, the application will fetch the image tiles
covering the area for the associated zoom level by calling a user defined javascript function that will
return tiles url according to tile selected tileset, zoom level, x and y coordinates of the tiles. The x
coordinate corresponds to the longitude index of the tile and y coordinate coresponds to the latitude
index of the tile in the [0; 360°/2^z[, [0; 180°/2^z[ earth tiles division.
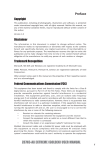
As an exemple, for the zoom level z=2, we will have the following earth tile division in x;y indexes:
Zoom level =
2
latit
udes
longitudes
-180°
-90°
0°
90°
-90°
0;0
1;0
2;0
3;0
-45°
0;1
1;1
2;1
3;1
0°
0;2
1;2
2;2
3;2
+45°
0;3
1;3
2;3
3;3
180°
+90°
To define the layer layerId as of type tiles, set the following entry:
layerId= 'tiles'
To define the icon of the layer activation button in the GEOMAP display, set the following entry:
layerId.icon= url of an image of size 16x16 pixels
ex: layerId.icon= '$./physics/dted/elev.gif'
To define the tool tip text of the layer activation button (when mouse hovers it) in the GEOMAP
display, set the following entry:
layerId.tooltip= "tool tip text"
ex: layerId.tooltip= "Map Tiles"
To define the javascript to be invoked to retrieve the list of possible tile sets and the tiles urls, set
the following entry:
layerId.javascript= url of the javascript file
ex: layerId.javascript='$./tiles/maptiles.js'
The javascript shall contain the two following functions:
function sourceList() {
return 'tileset1 tileset2 … tilesetN';
}
function getURL(tileset,zoom,tx,ty) {
return url(tileset,zoom,tx,ty);
}
The getURL function shall return the url of an image in gif, png or jpeg format for display on the
map. The javascript functions can refer to the javascript value scriptBaseURL to reference tile files
Page 26/39
GEOTYCOON 2 – USER MANUAL – DRAFT ED07
relatively to the javascript location.
var scriptBaseURL;
function bluemarble(zoom,tx,ty) {
var url = scriptBaseURL +
'/BM/z'+zoom+'/y'+ty+'/z'+zoom+'y'+ty+'x'+tx+'.jpg';
return url;
}
7.3 mazetiles
A mazetile source provides globe surface images to be displayed on the GEOMAP. The User
Application calls a javascript function specified by the User
getURLs(map,zoom,north,west,south,east) which shall return a list of images in gif, jpeg or png
format for display. Each image is returned with the following parameters:
–
url: the location of the image
–
north: the top latitude boundary of the image
–
west: the left longitude boundary of the image
–
south: the bottom latitude boundary of the image
–
east: the right longitude boundary of the image
To define the layer layerId as of type tiles, set the following entry:
layerId= 'mazetiles'
To define the icon of the layer activation button in the GEOMAP display, set the following entry:
layerId.icon= '$./physics/dted/elev.gif'
To define the tool tip text of the layer activation button (when mouse hovers it) in the GEOMAP
display, set the following entry:
layerId.tooltip= "Map MazeTiles"
To define the javascript to be invoked to retrieve the list of possible mazetile sets and the image
urls, set the following entry:
layerId.javascript='$./tiles/mazemaptiles.js'
The javascript shall contain the two following functions:
function sourceList() {
return 'tileset1 tileset2 … tilesetN';
}
function getURLs(tileset,zoom,north,west,south,east) {
…
return "[ { url: url1.jpg, north: n1, west: w1, south: s1, east:
e1 }, { url: url2.jpg, north: n2, west: w2, south: s2, east:
e2 }, ... ]";
Page 27/39
GEOTYCOON 2 – USER MANUAL – DRAFT ED07
}
7.4 areas
An area is a surface of the globe delimited by a set of geographic coordinates (latitude, longitude).
The area can be associated with attributes such as the country name, population density, soil type...
to refer to a few examples.
An areas layer comprises a superposed sets of areas, each set consisting in areas of a particular type.
A set of areas consists in areas associated with the same category of information and which do not
overlap. For instance areas delimiting countries where the information associated with an area is the
country name. For a given area layer, the User Application fetch area information for a given
coordinates point from the first area set, if no area set enclose the coordinates point, it looks at the
next area set, etc until an area corresponds to the coordinates and its attributes are associated to the
coordinates.
To define the layer layerId as of type areas, set the following entry:
layerId= 'areas'
List the areas set from top to bottom by setting the layerId.areas entry:
layerId.areas= ['areaId1','areaId2','areaId3']
Define the name of the layer by setting the layerId.name entry. This name will be used by the
report function of the User Application to identify the area information associated with network
objects, route positions and route crossings.
layerId.name= "Political Boundaries"
Define the default information when a coordinates point is outside all areas.
layerId.outside= "international"
To define the icon of the layer activation button in the GEOMAP display, set the following entry:
layerId.icon='$./politics/boundaries.gif'
To define the tool tip text of the layer activation button (when mouse hovers it) in the GEOMAP
display, set the following entry:
layerId.tooltip='Administrative Boundaries'
For each area set listed in the layerId.areas entry, the following entries shall de defined:
The type of input data that define the areas and their attributes is determined by the entry type. The
type shapefile identifies an ESRI® shapefile.
areaId1.type= shapefile
To define the name of the area set as it will appear on the Application user interface:
areaId1.name= "Country"
To define the name of the area set as it will appear in the reports:
Page 28/39
GEOTYCOON 2 – USER MANUAL – DRAFT ED07
areaId1.sname= "CNTRY"
To credit the source of the information:
areaId1.source= "United Nations"
To set the color of the area contour (RGB in hexadecimal format):
areaId1.linecolor= "B2A170"
To set the location of the ESRI® shapefile:
areaId1.shape='$./politics/areas/total_area090110104237.shp'
To set the location of the associated ESRI® attributes database in the dBASE format:
areaId1.data= '$./politics/areas/total_area090110104237.dbf'
To set the names of the attributes to report on the user interface and the network configuration
reports (for the attributes of interest in the attributes database). These attribute names are not
necessarily those of the database header.
areaId1.attributesName = [ 'name', 'sovereign']
To indicate the attribute index associated with each attribute name in the database, starting with 0 as
the index of the first attribute:
areaId1.attributesIndex = [ 1, 2]
In this example the attribute 'name' is the second attribute in the attribute list, and the attribute
'sovereign' is the third attribute.
7.5 polylines
7.6 locations
Locations are points of interest on the map.
To define the layer layerId as of type areas, set the following entry:
layerId= 'locations'
List the locations set from top to bottom by setting the layerId.locations entry:
layerId.locations= ['layerId0','layerId1','layerId2']
To define the icon of the layer activation button in the GEOMAP display, set the following entry:
layerId.icon= '$./politics/cities.gif'
To define the tool tip text of the layer activation button (when mouse hovers it) in the GEOMAP
display, set the following entry:
layerId.tooltip= "Cities"
To define the structure of the layerId0 location database set the following entry, the currently
supported type is csv (comma-separated value):
Page 29/39
GEOTYCOON 2 – USER MANUAL – DRAFT ED07
layerId0.type= 'csv'
To set the name of the layerId0, set the following entry:
layerId0.name= "Cities"
To credit the source of the information of layerId0, set the following entry:
layerId0.source= "Unknown"
To set the color of the square icon representing the location on the map, set the following entry in
hexadecimal RGB format:
layerId0.locationColor= "FF0000"
To set the color of the name of the location on the map, set the following entry in hexadecimal RGB
format:
layerId0.nameColor = "00FF00"
To set the database URL, set the following entry:
layerId0.data='$./politics/cities1.csv'
The database records shall include a 'name' (a character string) attribute displayed with the square
icon. To set the index of the 'name' attribute in the database set the following entry:
layerId0.data.name=0
The database records shall include a 'scale' (an integer) attribute that indicates from which zoom
scale the location is displayed on the map. To set the index of the 'scale' attribute in the database set
the following entry:
layerId0.data.scale=6
The database records shall include a 'latitude' and 'longitude' (both real numbers) for the
geographical coordinates of the location. To set the indexes of the 'latitude' and 'longitude' attributes
in the database, set the following entries:
layerId0.data.latitude=5
layerId0.data.longitude=4
Page 30/39
GEOTYCOON 2 – USER MANUAL – DRAFT ED07
8 Network Configuration Reports
The User Application allows to export geographic network information into configuration reports.
This functionality is accessible from the Network Configuration Editor (3.2.2 EDIT CONF tab).
The currently support report format is Microsoft Excel.
The User Application takes a Report Model as an input and issue a report based on such input
model for the selected configuration.
Configuration Editor
Report Model
Generated Report
8.1 Report sheets
8.1.1 LINES
This sheet lists all the network lines defined under the network configuration. The lines are listed
with the following attributes:
a
Line identification attributes
Ref: a unique integer number to identify the line.
Class: the class name of the line as defined by the id of the line object in the network model (cf
chapter 6 Network Model Definition).
Type: the type (or category) of the line as defined by the uinickname of the line object in the
network model (cf chapter 6 Network Model Definition).
Name: the local name of the line given par the User.
b
Connectivity attributes (line terminating nodes, tapping)
EndARef: the reference to the node where the line starts (the unique integer number referencing the
node).
Page 31/39
GEOTYCOON 2 – USER MANUAL – DRAFT ED07
EndAType: the type of the node where the line starts (as defined by the uinickname of the node
object in the network model (cf chapter 6 Network Model Definition)
EndAName: the local name of the node given by the User, where the line starts.
EndZRef: same a EndARef for the node where the line ends.
EndZType: same a EndAType for the node where the line ends.
EndZName: same a EndAName for the node where the line ends.
TapRef: optionally, the reference to a line which the line taps into.
TapName: optionally, the name of the tapped line.
c
Contruction attributes
Length: the geographic length of the line
Construct: TRUE/ FALSE, this indicates if it is part of the actual network (TRUE) or if it is a past,
future or external reference (FALSE)
d
Specific object model attributes
AttributeId1, AttributeValue1, AttributeId2, AttributeValue2 ... AttributeIdN, AttributeValueN:
The sequence of information attributes identifiers and values as declared by the object model (cf
section 6.1.1 geo.object , attributes).
e
Specific report model formulas
The report model may contain the definition of additional attributes calculated by means of
formulas applied to other cells of the report. The additional attribute identifiers and formulas are
defined by the following report model parameters:
LINES_CUSTOM_COLUMN_TITLE,
LINES_CUSTOM_COLUMN_FORMULA and,
LINES_CUSTOM_COLUMN_FORMULA2
as further described in section 8.2 Report parameters.
8.1.2 VALUES
TBD
8.1.3 NODES
a
Node identification attributes
Ref: a unique integer number to identify the node.
Class: the class name of the node as defined by the id of the node object in the network model (cf
chapter 6 Network Model Definition).
Type: the type (or category) of the node as defined by the uinickname of the node object in the
network model (cf chapter 6 Network Model Definition).
Page 32/39
GEOTYCOON 2 – USER MANUAL – DRAFT ED07
Name: the local name of the node given par the User.
b
Node geographic attributes
c
Connectivity attributes
d
Contruction attributes
Construct: TRUE/ FALSE, this indicates if the node is part of the actual network (TRUE) or if it is
a past, future or external reference (FALSE)
e
Specific object model attributes
AttributeId1, AttributeValue1, AttributeId2, AttributeValue2 ... AttributeIdN, AttributeValueN:
The sequence of information attributes identifiers and values as declared by the object model (cf
section 6.1.1 geo.object , attributes).
f
Specific report model formulas
The report model may contain the definition of additional attributes calculated by means of
formulas applied to other cells of the report. The additional attribute identifiers and formulas are
defined by the following report model parameters:
NODES_CUSTOM_COLUMN_TITLE,
NODES_CUSTOM_COLUMN_FORMULA and,
NODES_CUSTOM_COLUMN_FORMULA2
as further described in section 8.2 Report parameters.
8.1.4 DIAGRAM
The DIAGRAM sheet contains the schematic of the reported network configuration and the route
elevation profile for each route position list (RPL).
Page 33/39
GEOTYCOON 2 – USER MANUAL – DRAFT ED07
8.1.5 rpli
The report contains one or more sheets (rpl0, rpl1 ... rplN) reporting information on the route
position lists.
The route position lists are established from the lines specified in the network configuration (ending
nodes) and the route taken by the lines.
The first line of the network configuration determines the first sheet of route position list (starting
node, ending node and route positions of the line). The second line determine the second sheet etc...
Route postions that have been reported in a rpl sheet are not reported in the subsequent sheets.
When a line take a portion of route which has already been reported, the associated rpl report is
limited to the rpl which has not yet been reported.
a
Position geographic attributes
Latitude, Longitude: Geographic coordinates of the position in degree.
Sphere Distance: The distance from the first position in the list measured at the surface of the
WGS-84 spheroid.
Terrain Distance: The distance from the first position in the list measured following the terrain
elevations.
Elevation: The distance between the terrain and the surface of the WGS-84 spheroid as provided by
Page 34/39
GEOTYCOON 2 – USER MANUAL – DRAFT ED07
the geographic information source specified under the User Application configuration file.
b
Inter Position (Span) geographic attributes
Sphere Span: The distance between two contiguous positions in the list, measured at the surface of
the WGS-84 spheroid.
Terrain Span: The distance between two contiguous positions in the list, measured following the
terrain elevations.
c
Area information
An attribute is associated with each of the geographic information source of the category 'area'
specified in the content definition file (chapter 7 - Geographic Information Sources). The identifier
of the attribute is the name provided to identify the type of areas (eg "Political Boundaries") and the
values for each position are a combination the value of the attributes of the area enclosing the
position preceded by the type of area short name (sname): sname areaAttribute1 (areaAttribute2), eg
CNTRY Puerto Rico (United States of America).
d
Connectivity attributes
The connectivity attributes indicate if a route position is connected to a node.
ConnectionRef: the reference to the connected node, as referenced under the NODES sheet.
ConnectionType: the type of the node as as defined by the uinickname of the node object in the
network model (cf chapter 6 Network Model Definition).
ConnectionName: the local name of the node given par the User
InterConnection: a combination of the types of the nodes inter connected by the route segment to
which the route position belongs.
e
Conveyed lines attributes
ShortestLine: indicates the length in km of the shortest line conveyed through the position.
LongestLine: indicates the length in km of the longest line conveyed through the position.
LineCount: indicates the number of lines conveyed through the position.
LineList: lists the line reference numbers of the lines conveyed through the position.
Line1 ... lineN: An attribute is associated with each of the conveyed lines. The attribute identifier is
the line reference. A TRUE/FALSE attribute value indicates wether the line is conveyed through the
position or not.
Construct: TRUE/ FALSE, this indicates if the node is part of the actual network (TRUE) or if it is
a past, future or external reference (FALSE)
f
Specific report model formulas
The report model may contain the definition of additional attributes calculated by means of
formulas applied to other cells of the report. The additional attribute identifiers and formulas are
Page 35/39
GEOTYCOON 2 – USER MANUAL – DRAFT ED07
defined by the following report model parameters:
RPL_CUSTOM_COLUMN_TITLE,
RPL_CUSTOM_COLUMN_FORMULA and,
RPL_CUSTOM_COLUMN_ONLYFOR
as further described in section 8.2 Report parameters.
8.1.6 srpli
The srpli sheet is a shorter version of its sibling sheet rpli. The positions are provided only for the
main route positions defining the route and specific events such as area crossings, elevation
contours, .... It does not contain all the intermediate route positions interpolated from the report
parameter RPL_MAXSPAN.
8.2 Report parameters
The Excel file report model shall contain a worksheet named "PARAMETERS".
This worksheet shall contain the parameters described below. The parameters identifiers shall be
provided in the first column of the worksheet (column 'A'). For some parameters, the identifier is
followed by a number in the second column (column 'B') that indicates the number of values (DIM)
making up the parameter.
DIAGRAM_SIZE: indicates the size of the diagram images reported under the "DIAGRAM"
worksheet.
A
DIAGRAM_SIZE
B
C
D
DIM height width
2
450
1500
RPL_MAXSPAN: this parameter indicates the maximum span in kilometers to interpolate positions
between two route positions in the reporting of the route positions in worksheets 'rpli' (cf section
8.1.5 page 34). For instance if two subsequent route positions are distant for more than
RPL_MAXSPAN kilometers, then intermediate route positions are reported at consecutive distances
of RPL_MAXSPAN kilometers.
A
RPL_MAXSPAN
B
C
DIM SPAN (km)
1
1
ELEVATION_CONTOUR: this parameter forces the reporting of crossings of the routes with the
specified elevation contours. The route positions of the crossings are reported in the corresponding
rpli worksheet (cf section 8.1.5 page 34) with the attribute ConnectionType set to the value
'CONTOUR'.
Page 36/39
GEOTYCOON 2 – USER MANUAL – DRAFT ED07
A
B
C
D
E
F
G
DIM ELEVATION1 ELEVATION2 ELEVATION3 ELEVATION4 ELEVATION5
ELEVATION_CONTOUR
5
1000
2000
3000
0
-1000
NodeClassId, which must be the identifier of a node object (e.g. geo.network.oil.refinery). This
parameter forces the reporting of route positions at specific kilometric distances from all
interconnected node objects of the type NodeClassId.
A
NodeClassId
B
C
D
E
DIM DISTANCE1 DISTANCE2 DISTANCE3 ...
3
10
20
100
...
You can define the format of the cells in the rpli and srpli worksheet (cf section 8.1.5 page 34).
There are three parameters to define the formats:
RPL_TITLE_FORMAT to set the formats of the title (header) of the list; the formated cell can also
contain a number which indicates the width of the column in number of characters. If this number is
zero the column will be hidden.
RPL_POINT_FORMATS to set the formats of the reported positions as geographic points.
RPL_SPAN_FORMATS to set the formats of the reported positions inter spans.
A
RPL_TITLE_FORMATS
RPL_POINT_FORMATS
RPL_SPAN_FORMATS
B
Format
column 'A'
C
Format
column 'B'
20
D
Format
column 'C'
E
Format
column 'D'
...
...
10
You can also specify your own columns in the rpli and srpli worksheet (cf section 8.1.5 page 34):
RPL_CUSTOM_COLUMN_TITLE, to set the titles (header) of your own RPL columns in the
report.
RPL_CUSTOM_COLUMN_FORMULA, to set the content of the column for each point or span of
the RPL. It is an Excel formula which should refer to other cells of the report.
RPL_CUSTOM_COLUMN_ONLYFOR, indicates is the column shall be applied to points or
spans. The value of this parameter shall be either POINT or SPAN.
You can define your own columns in the 'lines' worksheet (Cf section 8.1.1 LINES page 31);
Page 37/39
GEOTYCOON 2 – USER MANUAL – DRAFT ED07
LINES_CUSTOM_COLUMN_TITLE, to set the titles (header) of your own columns in the lines
report.
LINES_CUSTOM_COLUMN_FORMULA, to set the content of the cells in the column. It is an
Excel formula which should refer to other cells of the report.
LINES_CUSTOM_COLUMN_FORMULA2, to set the content of the cells in the second row (each
line has two rows, this enables to implement the Excel database functions). It is an Excel formula
which should refer to other cells of the report.
You can define your own columns in the 'nodes' worksheet (Cf section 8.1.3 NODES page 32);
NODES_CUSTOM_COLUMN_TITLE, to set the titles (header) of your own columns in the nodes
report.
NODES_CUSTOM_COLUMN_FORMULA, to set the content of the cells in the column. It is an
Excel formula which should refer to other cells of the report.
NODES_CUSTOM_COLUMN_FORMULA2, to set the content of the cells in the second row
(each node has two rows, this enables to implement the Excel database functions). It is an Excel
formula which should refer to other cells of the report.
Page 38/39
GEOTYCOON 2 – USER MANUAL – DRAFT ED07
9 Lexical Index
Index lexical Global
Collaboration Center............................................................................................................................2
Content Definition File..............................................................................................................3p., 9p.
Page 39/39