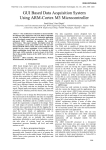
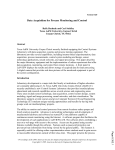
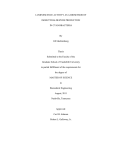
1
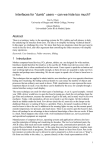
A Prototype Design and Implementation of an
Information Storage and Retrieval System (ISRS) for a
Mobile Wireless Data Acquisition System
GRADUATE PROJECT REPORT
Submitted to the Faculty of
the Department of Computing and Mathematical Sciences
Texas A&M University-Corpus Christi
Corpus Christi, Texas
in Partial Fulfillment of the requirements for the Degree of
Master of Science in Computer Science
by
Sudhir Arora
Fall 2005
Committee Members
Dr. Carl Steidley
Committee Chairperson
__________________________________
Dr. David Thomas
Committee Member
__________________________________
Dr. Ray Bachnak
Committee Member
__________________________________
ABSTRACT
The goal of this project is to develop a prototype, proof-of-concept Information
Storage and Retrieval System (ISRS) for a Mobile Wireless Data Acquisition System to
store and retrieve water quality data such as temperature, salinity, and pH value, along
with depth at different GPS coordinates. This prototype has the capability for the user to
choose from among three different Database Management System (DBMS) platforms:
MS-Access, Oracle and MySQL to store the water quality data. The ISRS was also
distributed over the Internet to give remote access to the users of the system. The
LabVIEW Virtual Instrument Software System was used to develop a user friendly frontend for data query, and for data analysis. Currently, a Mobile Wireless Data Acquisition
System is not operational therefore TCOON data was used for simulation of data
acquisition.
ii
TABLE OF CONTENTS
Abstract.................................................................................................................……… ii
Table of Contents ...................................................................................................……. iii
List of Figures ..........................................................................................................…… v
List of Tables............................................................................................................…… vi
1. Introduction and Background…………………………………..……………..……….1
1.1 Introduction ………………………………………….………….…..……….1
1.2 Current Data Query System…………………………………….…..……..….2
1.3 Advantages of the New System.…………………………………..…..….…. 3
2. Information Storage And Retrieval System..………………………………...…..…….5
2.1 Overview……..………………….…..……………….…………………....….5
2.2 Features of ISRS……………………………………….……………….…….5
2.3 Description of User Interface……………………..……..…………….……...6
2.3.1Main Page………….…………………………………..……………….........7
2.3.2 Mobile Station Selection Page…………………………………………..…..8
2.3.3 Query and Database Selection Page…………………………………..…….9
2.3.4 Query Parameters Page…………………………………………………….11
2.3.5 Query Locations Page…………………………………………….………..14
2.4 Remote Access……………………………………………………………….17
3. System Design...………….........……………………………………………..…….....18
3.1 System Analysis....…………………………………………………..……….18
3.2 System Requirements………………………………………………..……….20
iii
3.2.1 LabVIEW…………………………………………………….…….20
3.2.1.1 Data Acquisition with LabVIEW…………….………….20
3.2.1.2 Data Analyses with LabVIEW……………….……….…21
3.2.1.3 Data Presentation with LabVIEW……………......…..….21
3.2.2 Data Management System................................................................22
3.3 Database Design and Implementation...............................…………..……....22
3.3.1 Table Implementation.........................…………………….…….…23
3.4 Connecting LabVIEW with the Databases………………………………..…24
3.4.1 Setting up a Database through Open database Connectivity….…...25
3.5 System Architecture and Overview......………………………………….......27
3.6 Design of User Interface..................................................................................29
3.6.1 Main Page (isrs.vi)............................................................................29
3.6.2 Mobile Station Selection page (station.vi).......................................30
3.6.3 Query Type and Database Selection Page (query_database.vi).......31
3.6.4 Query Parameters Page (query_parameter.vi)..................................32
3.6.5 Query Locations Page (query_locations.vi).....................................34
4. Evaluation and Results....…………………………………………….…………….…37
5. Future Work...................................……………………………….………………...... 40
6. Conclusion.....................................................................................................................41
Bibliography and References……………………………………………………..……...42
Appendix A Data File........................................................................................................44
Appendix B Source Code...................................................................................................45
iv
LIST OF FIGURES
Figure 2.1 The User Interface Map………………………………….………………….6
Figure 2.2 Main Page………………………………………….. ……………………....7
Figure 2.3 Mobile Station Selection Page……………….……………………………...8
Figure 2.4 Query and Database Selection Page..………….…………………………….9
Figure 2.5 Query Parameters Page……………………………………………..……...11
Figure 2.6 All Latitude and Longitude Values…………………………………….. ....12
Figure 2.7 Output Result……………………….……………………………………...13
Figure 2.8 Depth level with GPS Coordinates………………………………………...14
Figure 2.9 Query Locations Page……………………………………………………...15
Figure 2.10 All Locations with Same Depth...…………………………………….…..16
Figure 2.11 System Viewed Over Internet……………………..………………….…..17
Figure 3.1 Screen Shot of a Populated Table.......………………………………….…..24
Figure 3.2 Communication between LabVIEW Application and a Database.....……....25
Figure 3.3 ODBC Administrator Window.……………………………………………..26
Figure 3.4 System Architecture...................................................……..………………...28
Figure 3.5 Block Diagram of isrs.vi................................................... ………………….29
Figure 3.6 Block Diagram of station.vi..............................................…………………..30
Figure 3.7 Block Diagram of query_data.vi..................... ……………………………...32
Figure 3.8 Block Diagram of query_parameters.vi.…..............………………………...33
Figure 3.9 Block Diagram of query_locations.vi......................... …..………..………...35
Figure 4.1 Query Result for a Selected Coordinate……………………………………..37
Figure 4.2 Query Result for a Selected Parameter value………………………………..38
v
LIST OF TABLES
Table 3.1 Table Description……………………………………………………………...23
vi
1. INTRODUCTION AND BACKGROUND
1.1 Introduction
Researchers at the Division of Nearshore Research (DNR) of Texas A&M
University-Corpus Christi (A&M-CC) currently collect water quality data in the Texas
Coastal Ocean Observation Network (TCOON) system in areas with a water depth of 3ft.
or more by a manually-controlled boat [Lohachit 2003].
TCOON is the first
measurement system installed by Conrad Blucher Institute for Surveying and Science
(CBI) which initially provided real-time water-level and meteorological information to
the City of Corpus Christi to assist local officials with preparations for incoming
hurricanes and tropical storms. With the Texas General Land Office and the Texas Water
Development Board started contracting CBI to provide similar information for other
areas along the Texas coast, the TCOON expanded from an initial three stations in
Corpus Christi in 1989 to over forty stations by 1992. TCOON system has the capability
to collect data for fixed stations. Hence, there was a need for a Mobile System which
would have the capability of collecting data for mobile stations.
Researchers at the Division of Nearshore Research (DNR) of Texas A&M
University-Corpus Christi (A&M-CC), in cooperation with Department of Computing
and Mathematical Sciences (CAMS), have developed a prototype remotely controlled
boat with which researchers can collect water quality data such as temperature, salinity,
and pH value in real-time and navigate the boat to a test area of interest [Steidley 2003].
After the boat is developed there was a requirement for the Database System which could
be used to store the data collected by the newly developed remotely controlled boat and a
Data Query System to present appropriate query results to the users. An Information
1
Storage and Retrieval System (ISRS) for a Mobile Wireless Data Acquisition System is a
proof-of-concept that can be utilized by the remotely controlled boat to store the water
quality data in a database and present appropriate query results.
1.2 Current Data Query System
The data collected by TCOON has the capability of acquiring data for a fixed
TCOON station. For areas not covered by a fixed TCOON Station, researchers at DNR,
in cooperation with A&M-CC’s Department of Computing and Mathematical Sciences
(CAMS), have developed a remotely controlled boat which can be easily steered to
collect data. With the remotely controlled boat, researchers are able to easily navigate the
boat to a test area of interest and collect the data in real-time [Steidley 2003]. The current
data query system used by DNR was developed for querying water quality data for each
fixed TCOON station. It can not be utilized with the data collected by the newly
developed remotely controlled boat. Also, the current data query system displays the
query results in 2D graphs which are less informative than the 3D Graphs used in the
ISRS. The current TCOON system only uses one database to store the data whereas ISRS
uses three different Database Management Systems. The current data query system
doesn’t have the option of querying for locations having same water quality parametric
value whereas ISRS includes the option of querying for locations having the same value
of any available water quality parameters. All the above mentioned features were main
reasons for the development of the ISRS.
2
1.3 Advantages of the New System
The ISRS uses LabVIEW version 7.1. LabVIEW is a graphical development
environment especially designed for data acquisition, instrument control, measurement
analysis, and data presentation [NI 1998] and it has become a standard in data
acquisition.
ISRS allows for a new database to be created to store the GPS coordinates of
mobile stations and water quality data collected by the remotely controlled boat over its
planned acquisition path. Three different Database Management System (DBMS)
platforms: MS-Access, Oracle and MySQL were used to store the data. The system
provides full freedom to the user for choosing any of the databases for storing data
depending upon the user's and DBMS availability. The new query system displays all the
GPS coordinates depending on the data acquisition path of a mobile station selected by
the user. The user can select one of these simulated GPS coordinates to query water
quality data at a particular location of a selected mobile station. The system also provides
a data query option with which the user can find all locations at a mobile station that have
the same depth or temperature or any other water quality parameter. The user friendly
front-end forms have been developed with user-friendliness in mind. The new system is
also distributed over the internet for the users to access it anytime and from anywhere.
Any number of users can view the system at the same time.
The following chapters discuss the project’s implementation from both the user’s
and programmer’s view. Chapter 2 gives a detailed description of the user interface.
Different screen-shots are used to aid in understanding the interface design. Chapter 3
gives the system design. This section describes the analysis, design of the interfaces,
3
design of the database and implementation of the design to achieve the results. Chapter 4
describes the evaluation and results of the system. Chapter 5 discusses the possible future
work and finally, Chapter 6 gives the conclusion of the project.
4
2. INFORMATION STORAGE AND RETRIEVAL SYSTEM (ISRS)
2.1 Overview
The main goal of this project is to design and implement an online system for the
retrieval of environmental data stored in different databases that will be used by the
researchers at DNR of Texas A&M-CC. The system allows researchers to make two
types of queries: view different water quality parameters at one location, and all locations
in a given area with same water quality parameter value. The system is equipped with a
user-friendly interface. Different interfaces are developed in LabVIEW 7.1 to query data
depending on the choice specified by the user. Because the remotely controlled boat is
not operational therefore the simulation of data acquisition was done by gathering
TCOON data. Providing proper security features and making the system compatible and
easy to maintain in various environments were some of the main issues taken into
consideration while developing the system.
2.2 Features of ISRS
The application supports the following tasks:
•
allows users to select from different mobile stations
•
allows users to choose from among three database platforms to store the data
•
allows users to select from three different databases for query purposes
•
allows users a choice of making different queries on data depending on their
requirements
•
allows multiple users to view information simultaneously
5
2.3 Description of User Interface
An effort was made to design a user friendly interface which will help the user of
the system to start using this application without any manual or training. Figure 2.1,
shows the screens the user sees as he/she navigates through the system.
Figure 2.1 The User Interface Map
To access ISRS the user has to go to the designated system's URL, which takes
him to the Main Page having links to the Mobile Station Selection Page. When the
mobile station is selected at the Mobile Station Selection Page, the user will be
prompted with the Query Type and Database Selection Page where the user selects the
6
type of query he wants to run on the data and the database from where the data will be
retrieved. After selecting query type and database, the query page will be activated to
select different parameters to make the query and present appropriate results to the user.
The user can query the database for depth, salinity, temperature, and pH value by giving
the values of longitude and latitude in the data retrieval page. There are two data query
pages. The first one is designed to find depth, salinity, temperature, and pH value at a
particular location and the second, to find different locations, which have the same depth,
salinity, temperature, or pH value.
2.3.1 Main Page
The user can enter the system by typing the designated URL in a Web browser
such as Internet Explorer or Netscape Navigator, which takes the user to the Main Page
of the system. Figure 2.2 depicts a screen shot of the Main Page.
Figure 2.2 Main Page
7
As shown in Figure 2.2, the Main Page introduces the system to the user with the
name and general information about the system. Upon activating the Click To Continue
button, the user will be prompted with the Mobile Station Selection Page.
2.3.2 Mobile Station Selection Page
Figure 2.3 depicts the Mobile Station Selection Page. The page has links for the
three simulated mobile stations for which the user can query data. The user can select the
mobile station by activating the button with the name of the required station.
Figure 2.3 Mobile Station Selection Page
8
2.3.3 Query and Database Selection Page
This page allows the user to select the type of data he/she wants to view. Either
the user can query for different parameters like depth, salinity, temperature and pH value
at a fixed location in a mobile station or he/she can query for all the locations in a mobile
station which have the same water quality parameter value. Figure 2.4 depicts the Query
and Database Selection Page.
Figure 2.4 Query and Database Selection Page
The page has two types of control on it: a combo box, and buttons. The Query
and Database Selection Page asks the user to choose two items: type of query he/she
9
wants to perform and database from which he/she wants to access information. The
Select Query Type combo box control allows user to select one out of two query types.
The first query type is Query for Parameters and the second query type is Query for
Locations. Initially, when the page is loaded the buttons are disabled but when the user
chooses either of two query types the buttons are enabled. The three buttons: MS-Access,
Oracle, and MySql allows the user to select any of the three available databases. The
three choices are given to the user because the data is stored in three different DBMS
platforms. Upon activating any of the available buttons, the user will be prompted with
either Query for Parameters Page or Query for Locations Page depending on the item
selected in Select Query Type combo box control.
10
2.3.4 Query Parameters Page
The Query Parameters Page is designed for the user to query Depth, Salinity,
Temperature, and pH Value at a fixed location in a mobile station. Figure 2.5 depicts
the screen shot of Query Parameters Page.
Figure 2.5 Query Parameters Page
As shown in Figure 2.5 the page has a data-grid to display all the Latitude and
Longitude values for a selected mobile station. The user needs to activate the Load
Coordinates button to display the values in a datagrid. Figure 2.6 shows all the
latitudinal and longitudinal values in a datagrid for a mobile station selected in a Mobile
Station Selection Page.
11
Figure 2.6 All Latitude and Longitude values
These values show all the GPS coordinates of the path of a selected mobile station
for which the simulated data is already collected in a database. To select a GPS
coordinate for which the user wants to query water quality parameters he needs to click
on the desired row in a datagrid. After selecting a particular row in a datagrid, the latitude
and longitude values will be shown in Latitude and Longitude output text-boxes. The
listbox shows Depth, Salinity, Temperature and pH Value; four water quality
parameters. The user can select any combination of parameters shown in the list-box to
make the data query. The Ctrl key on the keyboard needs to be pressed for selecting
12
multiple values in a listbox. Once the required parameters are selected, the user can
activate the Data Query button to view the selected parameter values in output boxes.
Figure 2.7 shows the output result with the values of depth, salinity, temperature, and pH
value in Depth, Salinity, Temperature, and pH Value output boxes.
Figure 2.7 Output Result
The 3D Curve Graph with all the values of water depth at a selected mobile
station is also presented to the user. This graph will help the user to study depth at
different locations in a given area. The user can repeat the process for querying different
water quality parameters for any set of latitude and longitude values. The user can
activate the Exit button anytime to go back to the previous page where he can choose to
do different query type. Figure 2.8 presents a graph representing the integrated data of
GPS coordinates and depth level. The plot represents the depth at the collected locations.
13
Figure 2.8 Depth Level with GPS Coordinates
2.3.5 Query Locations Page
This page allows the user to query for all locations at a mobile station in a given
area that have the same water quality parameter value selected by her/him. Figure 2.9
depicts the Query Locations Page.
14
Figure 2.9 Query Locations Page
The user needs to activate the Load Water Quality Data button to display all the
values of different parameters at a mobile station. The user can select any value shown in
datagrid to find all GPS locations which have the same value. To select the parameter and
a particular value of that parameter there are two drop-down boxes provided on the frontend. The user can select any of the four available parameters by activating the drop-down
box. After selecting a parameter, the system will load all the values of that parameter
15
from the database into a Select Value drop-down box where the user can select a value
by activating it. Once both the parameter and a value are selected, the Data Query button
can be activated to display all the GPS locations. When the user activates the Data
Query button, the system queries all the GPS locations from a database where the
parameter is equal to the Select Parameter and its value is equal to the Select Value
control. Figure 2.10 shows all the locations for selected values.
Figure 2.10 All Locations with same Depth
16
2.4 Remote Access
The system is distributed over the Internet to make the collected information
available to the remote users. Figure 2.11 shows the screen shot of the system viewed
remotely by the user with any web browser. The user can access the application anytime
and from anywhere. The system allows multiple users to access the application
simultaneously but only one user can control it at a time. To access the application over
the internet the user needs to enter the designated URL address into the web browser.
Figure 2.11 System Viewed Over the Internet
17
3. SYSTEM DESIGN
3.1 System Analysis
The Design and Analysis Phase of the project to develop the Information Storage
and Retrieval System (ISRS) for a Mobile Data Acquisition System started with the
following steps: 1. Discussed with Dr. Chandrika Rao the type of features needed for ISRS. The features
discussed included user interface, database design, and data presentation.
2. Designed a framework of what the user interface would look like, proposed, and
analyzed the design with Dr. Carl Steidley, Dr. Ray Bachnak, and Dr. Chandrika Rao.
Dr. Carl Steidley provided me with the resource material that gave me enough idea to
get started with the project. Dr. Ray Bachnak helped me with the background
information for the existing system. Dr. Chandrika Rao explained to me the need for
this new system and the projected scope of this project.
3. Designed and developed a relational schema for the database based on E-R model
components including entities, attributes, and relationships between the entities.
4. Researched various Graphical Development Systems to choose which software to use
in the development of ISRS.
5. Discussed with Dr. Ray Bachnak the advantages of using the latest Graphical
development system, LabVIEW 7.1.
6. Held a meeting with Mr. Scott Duff, Systems Programmer II to discuss the current
database used by the researchers at DNR to store the data. He also helped me with the
technical details of the current data stored in the database system.
18
ISRS is a Windows-based application; the main issues that came up during the design
process were to provide good user interface, and data presentation.
•
User Interface: The reason for developing the ISRS is to provide a user-friendly
environment to access water quality data. The users of this system will need this
information to study the Coastal environment. To design a good and user-friendly
interface became a vital component in system design so that the user should have no
problems in using the system in navigating through the various pages. Providing
proper documentation and help features also formed an integral part of the user
interface.
•
Data Presentation: It is very important to present or display the results to the user in a
fashion which can be read and understood very easily. The system uses the output
boxes to display the results of the queries performed by the users and also the 3D
Curve graphs to compare similar data.
•
Database Integrity: The design of any database system has issues of data integrity
related to it. The various data integrity features that have been used while developing
the ISRS are: handling improper data, updating proper rows in a table and mapping
standard DBMS error messages.
The following steps were taken to complete the development and testing of the ISRS:
-
Implemented the system using LabVIEW, Oracle, MySQL, and MS-Access.
-
Installed and tested the system with active data.
-
Developed user manual.
19
3.2 System Requirements
The system requirements for the ISRS are described in this section. The
application needed the LabVIEW software to implement the user interface. To access the
database objects LabVIEW Database Connectivity Toolset was also downloaded and
installed. After storing the data, the LabVIEW 3D Curve Graph was used to analyze and
present the acquired data. MySQL, MS-Access, and Oracle were also needed to store the
data. Oracle and MySQL drivers were also downloaded to provide connectivity with
LabVIEW.
3.2.1 LabVIEW
LabVIEW is the graphical development environment for data acquisition,
measurement analysis, and data presentation. It is developed by National Instruments.
LabVIEW is used by developers to interface with voltage signals from sensors to analyze
data for meaningful information, and to share results and applications. LabVIEW makes
development fast and easy for all users [NI 1998].
3.2.1.1 Data Acquisition with LabVIEW
LabVIEW is an open environment designed to make interfacing with any
measurement hardware simple. With interactive assistants, code generation, and
connectivity to thousands of devices, LabVIEW makes gathering data as simple as
possible [NI 1998].
With LabVIEW, signals can be quickly acquired and generated from plug-in
boards, USB devices, and Ethernet-based systems. These I/O capabilities, combined with
special data types and measurement analysis virtual instruments, are specifically designed
20
to get the measurement needed from physical sensors as quickly and easily as possible.
Once the application is fully developed, the DNR researchers can acquire the water
quality data from a remotely-operated boat and can see the output presented by this
application.
3.2.1.2 Data Analysis with LabVIEW
LabVIEW has more than 450 built-in functions designed specifically for
extracting useful information from any set of acquired data and for analyzing
measurements and processing signals. LabVIEW includes a variety of measurement
analysis tools, such as curve fitting, signal generation, peak detection, and probability and
statistics. LabVIEW analysis tools are easy to use. A set of built-in measurement
functions are available which accepts real-world, time-domain signals directly from
hardware devices and provides results ready for charting, graphing, or signal processing.
The advanced virtual instruments further reduce the complexity of implementing
measurement analysis in the application through interactive configuration dialogs in
which analysis results can be previewed immediately [NI 1998].
3.2.1.3 Data Presentation with LabVIEW
LabVIEW provides tools for data visualization, user interface design, Web
publishing, report generation, data management, and software connectivity.
LabVIEW includes a wide array of visualization features, including tools for
charting and graphing and built-in 2D and 3D visualization, so that data can be presented
on the user interface of the application. The attributes of the data presentation, such as
21
colors, font size, and graph types can be reconfigured, as well as dynamically rotate,
zoom, and pan these graphs with no programming [NI 2004]. The 3D Curve Graph was
used on the Query Parameters Page to present the water level at a mobile station.
3.2.2 Database Management System (DBMS)
The system used three DBMS tools: Oracle, MySQL, MS-Access to store the
data. Each DBMS tool required a different ODBC driver to connect to LabVIEW. For
MySQL MySQL ODBC 3.51 Driver, for MS-Access Microsoft Access Driver will be
used, and for Oracle Oracle ODBC Drivers for Oracle 9.0.1 were downloaded and
installed.
3.3 Database Design and Implementation
The database for the ISRS is built-in Oracle, and MySQL relational database
systems running under the Unix/Linux operating system and MS-Access running under
windows environment. The database design is done keeping in mind any future
expansions in the ISRS system and to maintain the data integrity of the system. The
database used the relational model, minimizing data redundancy. The database for the
ISRS consists of only one table named Table1.
22
3.3.1 Table Implementation
Table 3.1 shows the description of the table used in the system. It gives the brief
description of all the attributes of a table.
Attribute
Description
SID
Station ID. Unique for each station
Latitude
Latitude Information
Longitude
Longitude Information
Depth
Depth at each Latitude Longitude position
Salinity
Salinity at each Latitude Longitude position
Temperature
Temperature at each Latitude Longitude position
pH Value
pH value at each Latitude Longitude position
Table 3.1 Table Description
The table was created using a Create Table SQL command in Oracle and
MySQL. The table consists of seven fields: SID, Latitude, Longitude, Depth, Salinity,
Temperature, and pH Value. It has more than one attribute to uniquely identify an entity
of a table Table1. Each instance of the entity Table1 can be uniquely identified only by a
composite key composed of SID, Latitude, and Longitude. Currently, the remotely
controlled boat is not operational and real data was required to test the performance of the
system therefore simulation of data acquisition was done by gathering data from the
TCOON system. The data was first downloaded to a text file tdata.txt and the Control file
data.ctl was written to import the data from text file to different databases. The details of
23
the format of the data.ctl file are given in Appendix A. Figure 3.2 shows the screen shot
of table with all the fields.
Figure 3.1 Screen Shot of a Populated Table
3.4 Connecting LabVIEW with the Databases
The LabVIEW Database Connectivity Toolset was installed to connect LabVIEW
to the databases used in the ISRS. The LabVIEW Database Connectivity Toolset is a set
of easy-to-use tools with which Virtual Instruments (VI) can be quickly connected to
local and remote databases and perform many common database operations without
having to perform structured query language (SQL) programming. It readily connects to
popular databases, such as Microsoft Access, MySQL, SQL Server, and Oracle. For
advanced database functionality and flexibility, the Database Connectivity Toolset offers
complete SQL capabilities [NI 2001]. Figure 3.3 depicts the communication path
between LabVIEW application and a database using LabVIEW Database Connectivity
Toolset.
24
Figure 3.2 Communication between LabVIEW Application and a Database.
3.4.1 Setting up a Database through Open Database Connectivity (ODBC)
One can open the Control Panel from the Start menu and open the 32-bit ODBC
Administrator. Figure 3.1 shows the ODBC Data Source Administrator window.
25
Figure 3.3 ODBC Administrator Window
The ODBC Administrator window has several tabs running along the top. The
User DSN or Data Source Name tab configures data sources that can be used by only the
current user of the computer. System DSN tab configures data sources that can be used
by any user that logs in to that specific machine. File DSN tab configures data sources
that can be used by any user on your network that has the same drivers. The Drivers tab
lists all of the installed drivers on the current computers. It also provides information on
the driver’s version, manufacturer, file name, and the date the driver was compiled. All of
the driver files are stored in the Windows System directory. The Tracing tab allows you
to produce a log file that contains all of the SQL calls that pass through the driver.
In this application System DSN will be used. To configure a new DSN, complete
the following steps:
26
1. Click the Add button. A window with a listing of all the available drivers
appears.
2. Select the driver for the database you want to connect to and click Finish. For
MySQL, MySQL ODBC 3.51 Driver, for MS-Access, Microsoft Access
Driver will be used, and for Oracle, Oracle ODBC Driver will be used. The
drivers for Oracle and MySQL are required to be installed because the drivers
provided by Microsoft don’t work with LabVIEW.
3. Configure the datasource in the window that appears. This window is database
specific and looks different based on which database driver was selected.
It will ask the developer to name the data source and provide the path to the
database. This path can be local, or it can be the path to another computer on
local network.
4. Once this is done, developer will use the name he defined in step 3 to connect
to the database from LabVIEW [NI 2001].
3.5 System Architecture & Overview
The ISRS architecture consists of three tiers: the user interface in the client
browser, the Web server, and the database server. Figure 3.4 shows a graphical
representation of the architecture. The functional description of each tier in the
architecture is given below:
•
First Tier: This comprises of the user interface also called Remote Front Panels
(RFP) as viewed on the client’s Web browser. Using RFP, the client can view and
control the LabVIEW Front Panels from a web browser.
27
•
Second Tier: The second tier consists of a LabVIEW Web server. The LabVIEW
Web server is used to execute Virtual Instruments (VIs) which process the user input,
generate SQL queries to access the database and then process the output.
•
Third Tier: The third tier consists of the database server that receives requests from
the VIs to execute SQL statements. The database server executes the SQL statements
and sends the queried data back to the VIs. The server accesses the database files to
retrieve the stored data.
USER
-
CLIENT
WEB
BROWSER
REMOTE
FRONT
PANEL
Tier I
HTTP
Request
Server
Response
HTML
DATABASE
SERVER
LABVIEW
WEB
SERVER
Output
VI
em Architecture
VIRTUAL
INSTRUMENT
tual Instrument
Tier II
SQL
Queries
Get
VI
DBMS
Database
Server
Response
Tier III
Figure 3.4 System Architecture
An overview of the system is as follows: The user enters the URL to access the
ISRS in his/her Web browser. The browser sends a request to the LabVIEW Web server
28
to fetch a VI. A VI uses SQL queries to access the ISRS database tables and has links for
the other VIs to navigate through the ISRS.
3.6 Design of the User Interface
The front-end pages are developed using LabVIEW development software. This
section contains the description of the front-end pages. The functionality and design of
each front-end page is represented using a series of block diagrams in this section.
3.6.1 Main Page (isrs.vi)
Input: Activate Click to Continue button.
Function: The isrs.vi script displays the Main Page that introduces the system to the
user with the name and general information about the system. The isrs.vi script also
displays a Click To Continue control button. When the user activates the Click To
Continue control button it takes the user to Mobile Station Selection Page. Figure 3.6
shows the functioning of Click to Continue control button. The user will be directed to
the Mobile Station Selection Page upon activating the control button.
Input
Main Page
isrs.vi
Output
Action
Click To Continue
Mobile Station Selection
Page
station.vi
Figue 3.5 Block Diagram of isrs.vi
Figure 3.5 Block Diagram of isrs.vi script.
Output: A Mobile Station Selection Page that contains the list of mobile stations.
29
3.6.2 Mobile Station Selection Page (station.vi)
Input: Activate Mobile Station button for query to be performed.
Function: The station.vi script displays the link to all the simulated mobile stations. The
user can select the mobile station of his choice from the available mobile stations by
activating the name of the station. When the user selects the name of the mobile station, it
assigns a unique value to the station id sid. Figure 3.7 shows the block diagram of
station.vi, in which unique value is assigned to global variable sid when Mobile Station
was selected and when the user activates the button the script opens the Query Type and
Database Selection Page. Similarly, the sid will store different values for different
mobile stations. The variable sid will later be used in the application to retrieve the
corresponding data from the database for the selected mobile station. The user can go
back to the previous screen by clicking on the Exit button.
Input
Output
Select Mobile Stations
1) Mobile Station 1
2) Mobile Station 2
Assigns
unique
value to
sid
Query Type
and Database
Selection Page
3) Mobile Station 3
station.vi
query_database.vi
Figure 3.6 Block Diagram of station.vi
Output: A Query and Database Selection Page that will let the user select what type of
query he\she wants to perform for the selected Mobile Station.
30
3.6.3 Query and Database Selection Page (query_database.vi)
Input: Select Query Type from two available types and activate Database button from
the three available databases.
Function: The query_database.vi script allows the user to select a type of query and
select the database from where he/she wants to perform selected type of query. The
Select Query Type drop-down control box has two options: Query for Parameters and
Query for Locations. Query for Parameters allows the user to perform query for all
the water quality parameters corresponding to the GPS coordinate of a mobile station
selected on the Mobile Station Selection Page. Query for Locations allows the user to
perform query for all the locations or GPS coordinates of a Mobile Station selected on the
Mobile Station Selection Page having the same water quality parameter value. Figure
3.8 shows the block diagram of the query_database.vi script. When the page is loaded for
the first time, all the three database buttons are disabled and the buttons become enabled
when the user selects the query type. The value of the database button selected by the
user is stored in a global variable which will be used in the next page to query appropriate
data from the database selected. The user can also select the Exit button to go back to
Mobile Station Page and select different mobile station.
31
Input
Output
Select Query Type:
1) Query Water Quality
Parameters
2) Query Locations
Query
Parameters Page
query_parameter.vi
Select Database:
1) MS-Access
2) Oracle
3) MySql
Action
save database name
in global variable
Query Locations
Page
query_locations.vi
Figure 3.7 Block Diagram of query_database.vi
Output: The appropriate query page where the user can perform different queries.
3.6.4 Query Paramteres Page (query_parameter.vi)
Input: Activate Load Co-ordinates button, select Latitude and Longitude value,
choose any combination of parameters, and activate the Data Query button.
Function: The query_parameter.vi script allows the user to perform a query on different
water quality parameters for the different pairs of Longitude and Latitude values. When
the page is loaded for the first time, the Data Query button is disabled. This will prevent
the user from performing queries until he\she selects all the required fields. To view all
the available GPS coordinates at a mobile station which was selected earlier on a Mobile
Station Page, activate the Load Coordinates button. The query_parameters.vi script
will use two global variables: sid and name of the database to perform Load Coordinates
action. Figure 3.9 shows the action of Load Coordinates button.
32
Output
Input
Load
Coordinates
Select
Parameters
Depth
Data
Query
1) Depth
2) Salinity
3) Temperature
4) pH Value
Salinity
Temperature
pH Value
Figure 3.8 Block Diagram of query_paramter.vi
In Figure 3.9, the Load Coordinates action opens the database connection using
the database name from the Query Type and Database Selection Page stored in a global
variable and queries all the simulated Latitude and Longitude values corresponding to the
selected mobile station from the Mobile Station Page using the following query:
"Select Longitude and Latitude from Table1 where sid =
station id;"
Once all the Latitude and Longitude values are loaded into the data-grid, the user
needs to select a row of Latitude and Longitude values for which he\she wants to perform
a query. After the user selects a row from the data-grid, the corresponding values will
show in the Latitude and Longitude output boxes. After performing this action, the user
needs to select from the water quality parameters: Depth, Salinity, Temperature or pH
Value, or select the different combinations of the parameters in which he/she is
interested. Selecting the parameters enables the Data Query button. While selecting
different parameters, and Latitude and Longitude values, the user creates a query
described below:
33
"Select [Depth | Salinity | Temperature | pH Value]
from TABLE where Latitude = [value from the Latitude
box] and Longitude = [value from the Longitude box];"
When the user activates the Data Query button, the system uses the above query
to connect to the database and retrieve the record corresponding to the selected fields.
After retrieving all the data requested by the user, the system displays the results in the
appropriate output boxes. The system also displays the Depth value of all the Latitude
and Longitude values shown in the data-grid in a 3D Graph. After presenting the results
to the user, the system closes the connections with the database. The user can query for
different Latitude and Longitude values by repeating the same procedure. The user can
also click on the Exit button anytime to go to the Query Type and Database Selection
Page and select to perform different query type.
Output: Results for the selected water quality parameters in output boxes and 3D Graph
of the Water Level.
3.6.5 Query Locations Page (query_locations.vi)
Input: Activate Load Water Quality Data button, select parameter, select the value of
the parameter, and activate Data Query button.
Function: The query_locations.vi script allows the user to perform a query for all the
locations of a mobile station having the same water quality parameter value. When the
page is loaded for the first time, the Data Query button is disabled. This will prevent the
user from performing queries until he/she selects all the required fields. Figure 3.10
shows the block diagram of query_locations.vi script.
34
Output
Select
Parameters
Input
Load
Water
Quality
Data
1) Depth
2) Salinity
3) Temperature
4) pH Value
Select
value of a
Parameter
Data
Query
Latitude
Longitude
Figure 3.9 Block Diagram of query_locations.vi
To view all the available values of water quality parameters acquired by a mobile
station, activate the Load Water Quality Data button. The query_locations.vi script will
use two global variables: sid and name of the database to perform Load Water Quality
Data action. The script will open the database connection using the database name from
the Query Type and Database Selection Page and queries all the values for Depth,
Salinity, Temperature, and pH Value, corresponding to the selected mobile station
from the Mobile Station Page. Once all the values for Depth, Salinity, Temperature,
and pH Value are loaded into the data-grid, the user needs to select a parameter from the
Select Parameter drop-down control for which he/she wants to perform a query. When
the user selects a parameter, the script performs another query to the database and
retrieves all the values of the selected parameter and inserts them into the Select Value
drop-down control. The user then needs to select a value from the Select Value dropdown control to instruct the database as to which value of the selected parameter, he/she
wants to find all the GPS coordinates having the same value. This action also enables the
Data Query button which will allow the user to perform query generated from the
35
selections made by him. The generated query is mentioned below:
"Select Longitude, Latitude from the Table where
[parameter selected from the Select Parameter] =
[value selected from the Select Value];"
When the user activates the Data Query button, the system uses the above query
to connect to the database and retrieve the records corresponding to the selected fields
from the table. After retrieving all the data requested by the user, the system displays the
results in the output data-grid. After presenting the results to the user, the system closes
the connections with the database. The user can query for different parameters by
repeating the same procedure. The user can also hit the Exit button anytime to go to the
Query Type and Database Selection Page and select to perform different query type.
Output: All the Latitude and Longitude values matching the selected parameter value.
36
4. EVALUATION AND RESULTS
The prototype, proof-of-concept Information Storage and Retrieval System
(ISRS) for a Mobile Wireless Data Acquisition System was tested and evaluated. The
evaluation had two purposes: to examine how well the project was implemented, and to
analyze the integration of the system with the remotely controlled boat.
The results of testing and evaluation of the user interface prompted improvement
of ISRS by setting up new options. Figure 4.1 shows the results of the query performed
by the user on Query Parameters Page.
Figure 4.1 Query Result for a Selected Coordinate
In Figure 4.1, the user selected Longitude 28.4073 and Latitude 96.7122 by
clicking on the second row in the data-grid. After selecting the Longitude and Latitude
values, he selected Depth, Salinity, temperature and pH Value in the list-box to
37
perform query. Once both the Select Coordinate and Select Parameters fields were
selected, the Data Query button was activated to display Depth 1.74 meters, Salinity
30.4 psu, Temperature 31.2 degC and pH Value 8.19 units in the appropriate output
boxes. The 3D Curve graph displayed the water level at all the Longitude and Latitude
values. Figure 4.2 shows the results of the query performed by the user on Query
Locations Page.
Figure 4.2 Query Result for a Selected Parameter Value
38
In Figure 4.2, the user selected Depth in a Select Parameter drop-down control
box. After selecting the parameter, all the Depth values from the data-grid was loaded
into the Select Value drop-down control box. The user selected Depth value 1.75 from
the available list. Once both the Select Parameter and Select Value fields were selected,
the Data Query button was activated to display all the Longitude and Latitude values in
the output data-grid.
Overall the implementation of the project was found to be largely as planned, with
some changes made to address changed circumstances or in response to lessons learned
during implementation. The design of the Query Parameters Page was changed to add
more functionality to it. Instead of entering values of Latitude and Longitude into the
text boxes, data-grid was used to display and select a Latitude and Longitude value
from among all the available values. List Box was added on the Query Parameters Page
to allow the user to perform a query for a particular parameter. The design of Query
Locations Page was also changed to make it more user-friendly. Two drop-down boxes
were included on the page for selecting the parameter and its value from the available list.
The simulation technique of data acquisition was changed to test the system with realistic
data. Instead of manually saving the unrealistic values into the database, the real data
from TCOON was imported from the text file to a database management system.
The prototype, Information Storage and Retrieval System (ISRS) for a Mobile
Wireless Data Acquisition System will be used as a proof-of-concept to develop a
software system for the remotely controlled boat.
39
5. FUTURE WORK
The prototype, proof-of-concept Information Storage and Retrieval System
(ISRS) for a Mobile Wireless Data Acquisition System was successfully designed and
implemented. Since the data acquisition boat is being concurrently developed, ISRS uses
static data from three TCOON stations as input. As the boat is developed, ISRS system
can be integrated with the hardware system where the data will be collected in real-time.
Likewise, in the future, more stations can be added on the Mobile Station
Selection Page to accommodate various data acquisition expeditions. Depending on the
water quality parameters collected by the boat, more parameters can be added to the user
interface where the user is required to select parameters to perform a query on the stored
data. A control file data.ctl was written and executed manually to import data from text
file to different databases, in future, when the remotely controlled boat will start
collecting data a scheduled task will be required to execute control file data.ctl
automatically on regular intervals to import updated data from text file to different
databases. The ISRS used 3D Curve Graph to present the water level graphically, in
future, other water quality parameters can also be included on the 3D Curve Graph
depending on the needs of the users.
40
6. CONCLUSION
The proof-of-concept Information Storage and Retrieval System (ISRS) for a
Mobile Wireless Data Acquisition System was successfully designed and implemented.
The ISRS will provide a data storage and query tool for the researchers utilizing shallowdraft data acquisition vehicle at DNR. The system provides the functionality for the user
to select from among three DBMS products to store and retrieve data acquired by a
shallow-draft vehicle. Two types of query pages were implemented: query water quality
data at one location, and query all locations with same water quality parameter value. The
system also includes a tool to generate the visual presentation of the water level at all
locations. The system was made available on the Internet for remotely accessing the
information in the database. Once the boat starts collecting the real-time data and the
system is integrated with the hardware device to store data into the database, this system
will provide the real-time presentation of the collected data. The ISRS system was
developed with utmost care. LabVIEW and Database Connectivity Tool Kit were the
major tools used in this project.
41
BIBLIOGRAPHY AND REFERENCES
[Adcock 2001] Adcock, E., Bartlett, J., Culliton, W., Jordan, T., Mau, J., Bare, E.A.,
Florance, J., and Kahng, S. An embedded wireless data acquisition system for
wind tunnel model applications. Instrumentation in Aerospace Simulation
Facilities, 2001, 19th International Congress on ICIASF 2001, 27-30 Aug. 2001,
Pages: 327 – 336.
[DNR 2003] Division of Nearshore Research. Texas Coastal Ocean Observation Network
Home Page. Available from http://lighthouse.tamucc.edu/TCOON/HomePage
(visited Nov. 24, 2004).
[Kodosky 2004] Kodosky, J. Is LabVIEW a general purpose programming language?
Available from www.ni.com/devzone/lvzone/view_archived1.htm (visited Nov.
25, 2004).
[Adams 2003] Adams, A., Bachnak, R., Duff, S., Lohachit, W., and Steidley, C. Wireless
Data Acquisition and Logging in Shallow Water Environments. 2003 IEEE
International
Symposium
on
Intelligent
Control, 2003
Pages: 980 – 984.
[Merral 2003] Merral, G. PHP and MySQL Tutorial (Jan 2001). Available from
www.hotwired.lycos.com/webmonkey (visited Nov. 24, 2004).
[Mihura 2001] Mihura, B. LabVIEW for Data Acquisition. Prentice-Hall, Inc., Upper
Saddle River, NJ., 2001.
[MySQL
2002]
MySQL
Resources.
Available
www.mysql.com/products/myodbc/manual.html (visited Nov.22, 2004).
from
[Nagel 2003] Nagel, J.E., and Walker, C.F. Design and implementation of a wireless data
acquisition system. IEEE Region 5, 2003 Annual Technical Conference, 11 April
2003, Pages: 7 – 10.
[NI 1998] National Instruments Corporation. LabVIEW User Manual. Austin, TX
2001.
[NI 2001] National Instruments Corporation. Database Connectivity Toolset User
Manual. Available from www.ni.com/pdf/manuals/321525c.pdf (visited Nov. 24,
2004).
[NI 2004] National Instruments Corporation. Present Data with LabVIEW. Available
from www.ni.com/aap/present.htm (visited Nov. 22, 2004).
42
[Rosson 2002] Rosson, B.M., and Carroll, M.J. Usability Engineering. Morgan
Kaufmann, San Francisco, 2002.
[Steidley 2003] Steidley, C., Lohachit, W., Bachnak, R., Michaud, P., Duff, S., and
Adams, A. A Remotely-Operated Shallow-Water Boat for Wireless Data
Logging. Proceeding of 49th International instrumentation Symposium, System
and Automation Society, Orlando, FL. (May 2003).
[Sugiura, 2000] Sugiura, M., Ito, S., Atsumi, M., Adachi, A., Fujiwara, T., Watanabe, T.,
and Mizushina, S. Wireless data acquisition for post-earthquake lifeline
performance monitoring. Microwave Conference, 2000 Asia-Pacific, 3-6 Dec.
2000, Pages: 1598 – 1601.
43
APPENDIX A- DATA FILE
data.ctl
LOAD DATA
INFILE tdata
APPEND
INTO TABLE Table1
(longitude position (01:20) DECIMAL EXTERNAL,
latitude position (21:41) DECIMAL EXTERNAL,
depth position (42:47) DECIMAL EXTERNAL,
temperature position (48:53) DECIMAL EXTERNAL,
salinity position (54:59) DECIMAL EXTERNAL,
ph position (60:65) DECIMAL EXTERNAL,
sid position (66:70) INTEGER EXTERNAL)
44
APPENDIX B- SOURCE CODE
1. isrs.vi
2. list_station.vi
45
3. query_database.vi
3.1 Select Query Type Function
3.2 Select Database Function
46
4. query_parameters.vi
4.1 Load Coordinates Function
4.2 Select Coordinate Function
47
4.3 Select Parameters Function
4.4 Data Query Function
48
4.4.1 3D Graph Function
4.5 Exit Function
49
5. query_locations.vi
5.1 Load Water Quality Data Function
5.2 Select Parameter Function
50
5.3 Select Value Function
5.4 Data Query Function
51
5.5 Exit Function
52