1
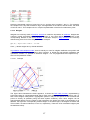
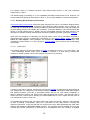
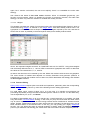
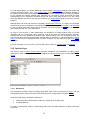
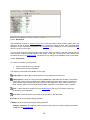
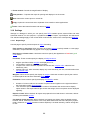
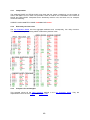
4.4.1
Interpretation
At the bottom, the table shows two options, Car1 and Car2, described by the qualitative values
assigned to the six basic attributes of the tree.
These values then aggregated from bottom to the top of the tree of attributes according to the
structure of the tree and defined utility functions. In this way, intermediate evaluation results are first
obtained and assigned to the attributes PRICE, COMFORT and TECH.CHAR. (see the table at the
top). Finally, the values of PRICE and TECH.CHAR. are aggregated into CAR, giving the overall
evaluation of both cars.
4.5
Some Car Option Analyses
These examples show some option analysis reports obtained from the Car Evaluation Model. These
reports can be created by commands of the Analysis Menu or corresponding buttons on the
Evaluation Page.
4.5.1
Plus-minus-1 analysis
The first example shows results of Plus-minus-1 analysis for the option Car2 and the aggregate
attribute CAR. The column Car2 displays the current values of Car2. The column –1 displays the
values of the attribute CAR when each corresponding lower-level attribute's value changes by one
step down (independently of other attributes). Similarly, the column +1 shows the effects of increasing
the value by one step up. Empty fields denote no effect, and the brackets '[' and ']' indicate that the
attribute value cannot be decreased or increased, respectively.
50