1
D352
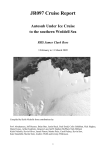
Final Report
2nd June-26th June 2010
Celtic Sea Physics and
Biogeochemistry
Jonathan Sharples
University of Liverpool
D352 cruise report / 1
Contents:
Personnel
3
1. Introduction
4
2. Cruise map
5
3. D352 cruise narrative
6
4. D352 CTD Acquisition and Processing
16
5. D352 Scanfish
31
6. Microstructure turbulence observations
41
7. Vessel Mounted ADCPs
50
8. Lowered ADCPs
54
9. Temperature-Chlorophyll Chain
68
10. Moorings
74
11. Meteorological stations
91
12. Nutrient analyses
93
13. RAS sampling
103
14. 15-N labeled nitrate and ammonium experiments
109
15. Water-column carbon dynamics
111
16. Phosphorus dynamics
118
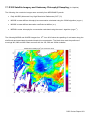
17. D352 satellite imagery and underway chlorophyll sampling
123
18. Phytoplankton taxonomy and photophysiology
128
19. SurfMet data
135
D352 cruise report / 2
Personnel:
Jonathan Sharples
University of Liverpool, School of Environmental Sciences: PS
John Kenny
National Oceanography Centre (Liverpool)
Mike Smithson
National Oceanography Centre (Liverpool)
Jeff Polton
National Oceanography Centre (Liverpool)
Jo Hopkins
National Oceanography Centre (Liverpool)
Claire Mahaffey
University of Liverpool, School of Environmental Sciences
Anna Hickman
University of Liverpool, School of Environmental Sciences
Lucy Abram
University of Liverpool, School of Environmental Sciences
Clare Davis
University of Liverpool, School of Environmental Sciences
Anouska Bailey
University of Liverpool, School of Environmental Sciences
Charlotte Williams
University of Liverpool, School of Environmental Sciences
Mark Moore
University of Southampton, School of Ocean & Earth Sciences
Yueng Djern Lenn
Bangor University, School of Ocean Sciences
Chris Old
Bangor University, School of Ocean Sciences
Ben Lincoln
Bangor University, School of Ocean Sciences
Holly Pelling
Bangor University, School of Ocean Sciences
Ben Powell
Bangor University, School of Ocean Sciences
Tom Millgate
Bangor University, School of Ocean Sciences
Fionn Farrell
Irish Observer
D352 cruise report / 3
1. Introduction.
RRS Discovery cruise D352 was supported as part of a NERC Responsive Mode research
project (“A Thermocline Nutrient Pump”, NE/F002432/1) awarded to Bangor University (Dr. Tom
Rippeth) and the Proudman Oceanographic Laboratory (Prof. Jonathan Sharples, now at the
University of Liverpool).
The focus of the project, and the cruise, is on the effects of wind stress at the sea surface
driving inertial oscillations, and so causing shear and mixing across the thermocline of
seasonally-stratified shelf seas. The inertial shear is thought to interact with shear set up by the
tidal currents, leading to pulses of mixing at the base of the thermocline. The project also aims
to investigate the mixing in the context of supplying nutrients to the sub-surface layer of
phytoplankton commonly seen within the shelf seas in summer, and to assess any possible
shifts in the phytoplankton ecology as a response to the supply of nutrients.
The cruise was planned around the use a free-fall turbulence profilers (Bangor University’s
VMP500 and NOC’s VMP750) to measure rates of turbulent dissipation, moored
instrumentation (ADCPs, temperature and chlorophyll loggers, McLane RAS water samplers,
and meteorological sensors), long transects using Scanfish and the vessel hull-mounted
ADCPs, and experiments on the water column biogeochemistry.
The cruise was very successful. Initially calm weather allowed all of the moorings to be
deployed easily, and then 2 strong wind events (generally northerly force 7) passed through the
region allowing intense work with the turbulence profilers to make the key measurements of the
vertical turbulent mixing. While both profilers eventually succumbed to damage as a result of
recoveries during poor sea states, the data collected was of very high quality and clearly
showed the spikes in thermocline mixing that we were looking for. The parallel biogeochemistry
experiments showed a response in the nutrient distributions, in particular with the nitracline
being raised within the thermocline as a result of the mixing and a reduction in primary
production (i.e. wind events tend to be cloudy).
D352 cruise report / 4
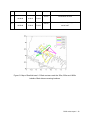
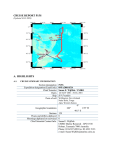
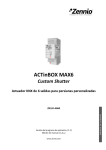
2. Cruise Map.
Detail of the cruise track within the Celtic Sea.
D352 cruise report / 5
3. D352 Cruise Narrative.
All times are ship time (BST)
2nd June
(Wednesday)
0900
Depart King George V dock, Clyde.
Begin steam to Liverpool Bay.
1415
Shake-down CTD, CTD001.
All sensors look fine. Sampled for salinities.
1615
Muster and boat drill.
3rd June
(Thursday)
0330
CTD002 Liverpool Bay
SAPS, Day grabs, bongo net hauls.
0845
Begin steam to western Irish Sea.
1315
Begin mooring deployment in western Irish Sea
1324
Surface torroid in water.
1330
Torroid anchor away at 53° 45.08’N, 05° 29.92’W, depth=105m
1338
ADCP lander away at 53° 45.18’N, 05° 29.70’W, depth=104m
1410
CTD003, sampled for full nutrient profile.
1445
Begin steam to Celtic Sea IM1 position
Weather: flat calm, sunny.
4th June
(Friday)
1630
CTD004 at IM2. Not sampled.
Head for IM1.
1730
CTD005
1830
IM1 mooring deployment starts
2011
Toroid anchor away 49° 25.31’N, 08° 58.88’W, d=140m
2025
ADCP lander away 200m from toroid
D352 cruise report / 6
Heave-to – wait for pre-dawn CTD.
Weather: wind 5-10 knots S’ly, slight swell, sunny.
5th June
(Saturday)
0330
CTD006 pre-dawn IM1
SAPS, grabs, bongos. [SAPS wire found to be marked at 25m rather than
20m intervals, so both SAPS likely sampling below thermocline].
1115
IM1 mooring deployment continues – 2 guard buoys and 1 sub-surface
ADCP (1136: 49° 25.1’N, 08° 59.2’W).
NB: depths are all significantly deeper than inferred from the chart.
1145
IM1 complete. Steam to IM2.
1415
IM2 toroid anchor away: 49 27.92’M, 08 49.96’W, d=149m.
1423
IM2 ADCP lander away: 49 27.86’N, 08 50.10’W, d=148m
Steam to IM3
1618
Toroid anchor away: 49 22.34’N, 08 54.77’W, d=136m
1627
ADCP lander away: 49 22.24’N, 08 55.02’W, d=137m
1649
Guard buoy away.
Steam to 49 14.0’N, 09 17.7’W to begin Scanfish.
1900
Begin Scanfish deployment.
1915
Scanfish in water, paying out cable.
1945
Undulating to 100m.
T and S obviously incorrect – likely cal file problem.
Weather: wind < 5 knots, slight swell.
6th June
(Sunday)
0010
Scanfish recovered.
Steam to IM1.
0330
CTDs 007, 008, 009.
0740
CTD009 complete.
0950
CTD010 for Scanfish calibration
D352 cruise report / 7
Scanfish lowered vertically (file: Scanfish_calib_1).
1040
Scanfish recovered.
CTD011 for Scanfish calibration.
1135
T-Chl chain deployed.
1150
Vessel on NE-ward course past mooring IM1.
1500
Turn to tow SW-ward back to IM1.
1845
VMP first cast.
Weather: NW 10-15 knots, sunny, am. Decreasing SW 5 – 10 knots pm.
7th June
(Monday)
0530
VMP paused for CTD012.
VMP continues.
1610
CTD013
2320
CTD014
Weather: SSW 25-30 knots, rain. Wind reduces to 15-20 knots, cloud
clearing during morning. Wind shifting the W’ly during evening.
8th June
(Tuesday)
Overnight patchy communication problems with the VMP.
0515
CTD015
2100
VMP finished.
2135
CTD016
Tow T-Chl chain IM1-IM3-IM2-IM1
Weather: W’ly 10-15 knots, moderate swell, showers, am. W’ly 5 knots ,
moderate swell, increasingly sunny pm.
9th June
(Wednesday)
0330
CTD017 IM1, SAPS (3), grabs, bongos.
D352 cruise report / 8
0830
T-Chl chain recovered.
1230
CTD018 to 60m to collect DCM and surface water.
1315
Subs ADCP released.
1330
Subs ADCP recovered. ADCP swapped.
1430
Subs ADCP redeployed.
1700
CTD019
1800
VMP deployed.
Weather: N’ly 10 knots, slight swell, sunny am; N’ly 15-20 knots pm; NE’ly
15-20 knots, slight swell evening.
10th June
(Thursday)
0200
CTD020
0530
CTD021
1315
CTD022
2100
VMP failure. Poor data and communication problems.
VMP recovered for investigation.
Station suspended. NOC VMP to be set up and Bangor VMP to be taken
apart and checked (found some water had got in and shorted the power
supply).
2315
CTD023
Weather: NNE’ly 15-20 knots, slight swell, mainly cloudy am; NNE’ly 25
knots, moderate sea midday; NNE’ly 25-30 knots, rough sea pm
11th June
(Friday)
NOC VMP750 set up, along with NOC hydraulic power unit and line thrower.
1100
CTD024
1200
VMP profiling begins with NOC VMP750
2115
CTD025, including 2 minute stops for ADCP data during upcast.
D352 cruise report / 9
Weather: N’ly 15-20 knots, moderate sea am; N’ly 20 knots, moderate sea
pm; N’ly 15 knots, slight/moderate sea, evening.
12th June
(Saturday)
0250
VMP750 recovered
0330
CTDs 026, 027, 028 for water collection.
0900
Scanfish deployed.
Towing though: 49 20.0’N, 10 12.7’W
48 58.68’N, 10 00.0’W
to SW3.
Weather: N’ly 20 knots, slight sea, patchy sun am; N’ly 10-15 knots, slight
sea, sunny pm.
13th June
(Sunday)
0200
Scanfish recovered.
0330
CTD029 Pre-dawn, SAPS, grabs, bongos.
1230
CTD030 to collect water from thermocline.
1330
Scanfish deployed to run: 49 20.0’N, 10 12.7’W to 49 21.0’N, 09 49.0’W to
SW3.
2200
Recover Scanfish.
2300
CTD031
Weather: WNW’ly 15-20 knots, slight/moderate sea, cloudy am; NW’ly 25-30
knots, rough sea pm; NW’ly 35 knots, rough evening.
14th June
(Monday)
0000
VMP station begins. Try Bangor VMP first. Fails.
NOC VMP deployed. Good profiles, but on recovery prior to vessel reD352 cruise report / 10
positioning VMP takes a big knock against the vessel. Conductivity cell
crushed. Water also leaked into the pressure housing.
No more VMP work likely. Both instruments have taken in a small amount of
water which appears to have blown a main sensor board.
0900
CTD032
1100
CTD033
1230
CTD034
1400
CTD035
1530
CTD036
1700
CTD037
1815
Scanfish deployed.
1845
On survey course. Heading through:
48° 28.7’N, 09° 04.0’W
48° 58.4’N, 08° 19.0’W
49° 45.7’N, 09° 28.7’W
49° 36.0’N, 09° 43.7’W
49° 00.3’N, 08° 49.1’W to IM1.
Weather: N’ly 25-30 knots, rough sea am; N’ly 20-25 knots, rough sea pm;
15th June
(Tuesday)
0930
IM3 mooring spotted. IM1 visible on radar.
1020
Pass close to IM1 toroid.
Weather: NE’ly 20-25 knots, rough sea, sunny am; N’ly 15 knots, slight sea,
sunny pm.
16th June
(Wednesday)
0130
Scanfish recovered.
0330
CTD038
D352 cruise report / 11
0430
CTD039
Steam to NE2
0745
CTD040 at NE2
0950
CTD041 at NE3
1150
CTD042 at NE4
1400
CTD043 at NE5
1600
CTD044 at NE6
1815
CTD045 at NE7
Steam back to IM1.
Weather: N’ly 10 knots, clear skies, calm sea am; NE’ly 10-15 knots, calm
sea, clear skies pm.
17th June
(Thursday)
0430
CTD046 at IM1
0800
Begin deployment of pump hose to 50 metres.
1020
Begin sampling from pump at 45 metres. Sample every 1 metre, waiting 7
minutes each time for flow to get through hose length.
1630
End pump sampling.
1800
Deploy Scanfish at IM1 to tow through 49° 09.5’ N, 08° 02.0’ W, NE2, to IM1
overnight.
Weather: N’ly 10-15 knots, slight sea am; N’ly 10 knots, sunny, slight sea pm.
18th June
(Friday)
Scanfish recovered
0600
CTD047 at IM1
0800
IM2 mooring recovery begins.
0915
Toroid recovered.
0945
All toroid mooring on deck.
1055
ADCP lander recovered.
1150
IM3 toroid on deck
D352 cruise report / 12
1445
IM3 ADCP lander recovered.
1710
Heave to by IM1 for the night.
Weather: NW’y 10 knots, slight sea and swell, sunny am; NW’ly 10 knots,
slight sea and swell, hazy cloud pm.
19th June
(Saturday)
0600
CTD048
0745
CTD049
0830
Begin IM1 mooring recoveries.
Guard buoys recovered first.
1130
Sub-surface ADCP on deck.
1315
ADCP lander on deck,
1345
Toroid on deck.
1500
Recoveries complete.
Steam for SW2.
2130
CTD050 at SW2
2320
CTD051 at SW3
Weather: N’ly 10 knots, slight sea and swell, cloudy am; NNE’ly 15-20 knots,
slight/moderate sea, sunny pm;
20th June
(Sunday)
0120
CTD052 at SW4
0330
CTD053 at SW5 (pre-dawn)
0510
CTD054 at SW5
SAPS, bongos
1315
CTD055 at SW6
1545
CTD056 at SW7
1850
Begin T-Chl chain tow back across towards shelf edge.
D352 cruise report / 13
Weather: NE’ly 5 knots, sunny, calm sea, slight swell; wind < 5 knots, smooth
sea, slight swell, sunny pm.
21st June
(Monday)
0530
T-Chl chain recovered.
0600
CTD057
1100
Scanfish deployed. Data drops during deployment, but appears fine once the
winch has finished veering cable out – assume a problem with the slip rings.
Weather: light winds, calm seas, mostly sunny all day.
22nd June
(Tuesday)
0000
Make turn onto final long transect.
0530
Cross shelf edge.
2030
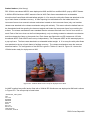
Short service held to put ashes of Michael Eric Glasher into the sea.
2345
Scanfish loses communication.
Scanfish recovered 50° 38.0’N, 07° 06.0’W – likely re-termination required.
Continue towards the Irish Sea.
Weather: S’ly 10 knots, sunny am; S’ly 10 knots, patchy cloud pm.
23rd June
(Wednesday)
1500
Heave to off Fishguard to get TV reception for the England-Slovenia match
and fix Scanfish.
2130
Continue steam to Irish Sea site 53° 0.0’N, 05° 11.0’W.
Weather: SW’ly 10-15 knots, cloudy, calm/slight sea.
D352 cruise report / 14
24th June
(Thursday)
0330
CTD058, SAPs, bongos, grabs.
1015
CTD059 to 60 metres only for a PAR profile.
1115
Scanfish deployed. Towing back through:
51° 55.0’N, 05° 52.0’W
51° 19.0’N, 06° 10.0’W
to
50° 38.0’N, 07° 06.0’W
Weather: W’ly 10 knots, calm sea, patchy cloud am; SW’ly 10 knots, sunny,
slight swell pm.
25th June
(Friday)
0500
Scanfish recovered.
Begin steam back to Avonmouth. Dolphins all over the place.
Weather: S’ly 5 knots, hazy sun, calm am;
D352 cruise report / 15
4. D352 CTD Acquisition and Processing (Jo Hopkins and Dave Teare)
A Seabird electronics 911 plus CTD (SBE 9 instrument, 11 plus deck unit), attached to a rosette
with 24 x 10 litre Niskin bottles was deployed throughout the cruise. The CTD system comprised
of the following equipment: Seabird 911+ CTD with dual pumped temperature and conductivity
sensor pairs; a Seabird SBE43 dissolved oxygen sensor; Seabird SBE32 carousel with twentyfour OTE, externally sprung, ten litre water bottles; upward and downward looking TRDI 300
KHz workhorse ADCPs; Chelsea Instruments’ Alphatracka transmissometer (10cm path length)
and Aquatracka (fluorometer); a Tritech P200 altimeter; upward and downward looking 2 pi par
light sensors (PML design); an IOS 10 KHz pinger and a Sonardyne location beacon. The
secondary pair of temperature\conductivity sensors were mounted on the stabilisation vane the
other pair, with the oxygen sensor, were mounted conventionally onto the CTD body. After the
third cast the 300 KHz ADCPs were removed and a single downward looking high frequency
ADCP fitted. See elsewhere in the report for information on this.
The CTD was interfaced with: a Chelsea Aquatracka 3 fluorometer to measure chlorophyll
concentration; a Chelsea transmissometer for beam attenuation and transmission; a SeaBird 43
optode for oxygen concentration and saturation; and upward and downward looking PAR
sensors designed and made by Plymouth Marine Laboratory.
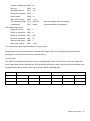
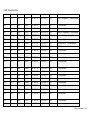
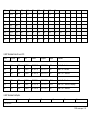
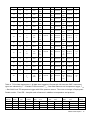
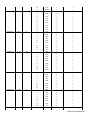
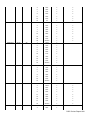
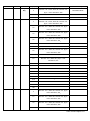
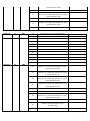
In total 59 casts were taken on cruise D352. Dates, times and locations of each cast can be
found in the table of station listings and maps of cast locations.
Station List
Depths are nominal and as recorded by CTD operator. Latitude and longitude are as recorded
in the .cnv files and are taken from the NMEA feed. Time (GMT) as recorded in .cnv file.
CTD station
Date
Time (GMT)
Nominal Depth (m)
Latitude
Longitude
ctd001
02-Jun-10
13:11:47
100
55 27.58 N
005 01.92 W
ctd002
03-Jun-10
02:15:57
48
53 36.32 N
003 50.96 W
ctd003
03-Jun-10
13:06:16
105
53 45.31 N
005 29.82 W
ctd004
04-Jun-10
15:31:21
129
49 29.00 N
008 53.79 W
ctd005
04-Jun-10
16:36:44
137
49 25.58 N
008 58.47 W
ctd006
05-Jun-10
02:38:15
137
49 25.11 N
008 59.47 W
D352 cruise report / 16
ctd007
06-Jun-10
02:31:40
142
49 25.12 N
008 58.16 W
ctd008
06-Jun-10
04:40:44
146
49 24.27 N
008 59.16 W
ctd009
06-Jun-10
06:19:12
137
49 24.00 N
009 00.34 W
ctd010
06-Jun-10
08:47:36
137
49 24.70 N
009 00.43 W
ctd011
06-Jun-10
09:41:02
137
49 25.00 N
009 00.63 W
ctd11a
06-Jun-10
09:58:54
137
49 25.09 N
009 00.67 W
ctd012
07-Jun-10
04:55:00
125
49 27.31 N
008 58.44 W
ctd013
07-Jun-10
15:06:38
133
49 25.80 N
008 59.63 W
ctd014
07-Jun-10
22:21:32
127
49 26.34 N
008 58.71 W
ctd015
08-Jun-10
04:12:44
127
49 26.80 N
008 58.15 W
ctd016
08-Jun-10
20:31:47
139
49 24.50 N
009 00.41 W
ctd017
09-Jun-10
02:35:24
135
49 25.55 N
008 59.73 W
ctd018
09-Jun-10
11:30:02
136
49 25.07 N
008 59.72 W
ctd019
09-Jun-10
15:50:11
137
49 25.57 N
009 00.32 W
ctd020
10-Jun-10
01:09:21
144
49 24.42 N
008 59.26 W
ctd021
10-Jun-10
04:24:08
136
49 26.05 N
008 57.35 W
ctd022
10-Jun-10
12:13:08
133.5
49 25.83 N
008 59.68 W
ctd023
10-Jun-10
22:09:54
133.5
49 25.53 N
009 00.88 W
ctd024
11-Jun-10
09:58:49
142
49 24.64 N
008 58.33 W
ctd025
11-Jun-10
20:04:10
134
49 25.88 N
009 00.04 W
ctd026
12-Jun-10
02:19:49
146.5
49 24.59 N
008 59.15 W
ctd027
12-Jun-10
04:30:44
137
49 24.91 N
008 57.84 W
ctd028
12-Jun-10
05:56:54
133
49 24.33 N
008 57.62 W
ctd029
13-Jun-10
02:28:23
159
49 06.94 N
009 27.42 W
ctd030
13-Jun-10
11:30:42
159.5
49 03.84 N
009 28.93 W
ctd031
13-Jun-10
22:03:40
159.5
49 07.05 N
009 29.07 W
ctd032
14-Jun-10
08:07:15
161
49 06.25 N
009 29.63 W
ctd033
14-Jun-10
10:04:53
157
49 06.22 N
009 25.73 W
ctd034
14-Jun-10
11:24:28
157
49 06.53 N
009 27.22 W
ctd035
14-Jun-10
12:59:15
158.5
49 06.93 N
009 28.46 W
ctd036
14-Jun-10
14:33:25
158.5
49 07.57 N
009 28.10 W
ctd037
14-Jun-10
15:59:43
161
49 07.90 N
009 27.68 W
ctd038
16-Jun-10
02:27:39
137
49 24.72 N
008 59.96 W
ctd039
16-Jun-10
04:22:53
122
49 25.98 N
009 02.06 W
ctd040
16-Jun-10
06:43:56
139
49 36.80 N
008 41.79 W
ctd041
16-Jun-10
08:48:07
143
49 47.40 N
008 24.95 W
ctd042
16-Jun-10
10:46:30
130
49 58.25 N
008 08.13 W
ctd043
16-Jun-10
12:56:52
99.5
50 08.93 N
007 52.13 W
ctd044
16-Jun-10
15:01:59
100
50 19.68 N
007 35.17 W
ctd045
16-Jun-10
17:10:41
106
50 31.02 N
007 17.94 W
D352 cruise report / 17
ctd046
17-Jun-10
03:53:29
132
49 25.16 N
009 00.49 W
ctd047
18-Jun-10
06:57:24
137
49 25.52 N
009 00.52 W
ctd048
19-Jun-10
04:59:23
134
49 25.33 N
009 00.69 W
ctd049
19-Jun-10
06:32:13
122
49 26.05 N
009 02.22 W
ctd050
19-Jun-10
20:32:27
147
49 16.24 N
009 12.89 W
ctd051
19-Jun-10
22:20:16
147
49 06.81 N
009 27.34 W
ctd052
20-Jun-10
00:18:06
167
48 57.32 N
009 42.39 W
ctd053
20-Jun-10
02:26:24
189
48 46.98 N
009 58.00 W
ctd054
20-Jun-10
04:10:30
191
48 46.82 N
009 58.58 W
ctd055
20-Jun-10
12:14:00
558
48 37.29 N
010 13.20 W
ctd056
20-Jun-10
14:47:10
1844
48 26.89 N
010 27.71 W
ctd057
21-Jun-10
05:12:00
156
48 57.41 N
009 42.61 W
ctd058
24-Jun-10
02:34:24
104
52 59.96 N
005 10.96 W
ctd059
24-Jun-10
09:21:15
120
53 06.96 N
005 12.69 W
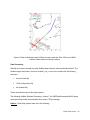
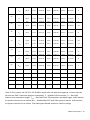
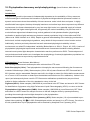
Figure 4.1 Location of casts 1-3 and 58-59. Black contours mark the 150m, 500m and 1000m
isobaths.
D352 cruise report / 18
Figure 4.2 Map of Celtic Sea CTD casts. Black contours mark the 150m, 500m and 1000m
isobaths.
Data Acquisition
CTD casts were recorded using the SeaBird data collection software SeaSave-Win32. The
software output four files in the form ctdnnn (nnn= cast number) with the following extension:
•
.hex (raw data file)
•
.CON (configuration file)
•
.bl (a record of bottle firing locations)
•
.hdr (header file)
These were backed up onto the ships network.
Data Processing
The following SeaBird Software Processing, Version 7.18c (SBEDataProcessing-Win32) steps
were performed.
D352 cruise report / 19
DatCnv: A conversion routine to read in the raw CTD data file (.hex) containing data in
engineering units output by the CTD hardware. Calibrations as appropriate through the
instrument configuration file (.CON) are applied.
Data Setup options were set to the following:
Process scans to end of file: yes
Scans to skip: 0
Output format: ascii
Convert data from: upcast and downcast
Create file types: both bottle and data
Source of scan range data: bottle log .BL file
Scan range offset: -2.5 seconds
Scan range duration: 5 seconds
Merge separate header file: no
Selected output variables were:
•
Scan count & Time elapsed (secs)
•
Pressure, digiquartz (db)
•
Primary and secondary temperature (ITS-90 °C) & temperature difference (2-1). (n.b.
Primary and secondary sensors refer to CTD package instruments)
•
Primary and secondary conductivity (S/m) & conductivity difference (2-1)
•
Oxygen voltage, SBE 43 (V), oxygen concentration (ml/l), oxygen concentration
(umol/kg), oxygen saturation (%)
•
Beam attenuation (1/m) & beam transmission (%)
•
Fluorescence (ug/l)
•
Primary and secondary salinity (PSS-78)
D352 cruise report / 20
•
Density (kg/m3) and sigma theta (kg/m3)
•
PAR/irradiance -up and down-welling (voltage channels 4 and 5 respectively)
A hysteresis correction using a window size of 2 seconds was made to the Oxygen. Two output
files are generated: ctdnnn.cnv, a file including both the up and down casts, and ctdnnn.ros, a
bottle file containing information from the instant each bottle was fired.
The header in each .cnv file was checked to ensure that the Station Number and Depth had
been recorded. Any missing information was filled in.
Bottle Summary: Creates a file ctdnnn.btl with average, standard deviation, min and max
values at bottle firings.
Data Setup options were set as follows:
Output min/max values for averaged variables: yes
Select Averaged Variables: All except time elapsed, scan counts and PAR
Select Derived Variables: Oxygen, salinity and density already selected in DatCnv so no
others added
WildEdit: A program to remove pressure spikes. The data in ctdnnn.cnv is scanned twice and
the standard deviation of a set number of scans is calculated. Values outside a set number of
standard deviations of the mean are marked as bad.
The following settings were used:
Scan range: 100 scans
Standard deviation, pass 1: 2
Standard deviation, pass 2: 20
Exclude scans marked as bad: yes
Select WildEdit variables: pressure only
Output written to ctdnnn_We_.cnv.
D352 cruise report / 21
Filter was run on the pressure channel to smooth out high frequency data (Low pass filter time
constant set to 0.15 seconds).
Output written to ctdnnn_We_Ft.cnv.
AlignCTD was used for oxygen alignment. Through testing of casts 12, 50 and 56 (deep cast)
for corrections of +2, +5, +6, +7 and +8 seconds a +7 second adjustment was determined to be
optimal and applied to all casts.
Since the SBE deck unit was set to advance both the primary and secondary conductivity by
+1.75 scans (equivalent to 0.073 seconds at 24Hz) no alignment was performed for
conductivity.
Output written to ctdnnn_We_Ft_Al.cnv.
CellTM: The Cell Thermal Mass program removes the effect of thermal ‘inertia’ on the
conductivity cells. The thermal anomaly amplitude α was set to 0.03 and the thermal anomaly
time constant 1/β to 7 for both cells.
Output written to ctdnnn_We_Ft_Al_Ctm.cnv.
Loopedit: Flagging of scans where pressure slows down or reverses and identification and
flagging of the surface soak.
Minimum velocity type: Fixed minimum velocity
Minimum CTD velocity: 0 m/s
Remove surface soak: Yes
Use deck pressure as pressure offset: No
Exclude scans marked as bad: Yes
The surface soak depth, minimum surface soak and maximum surface soak were determined
from visual inspection of the data.
Output written to ctdnnn_We_Ft_Al_Ctm_Le.cnv.
n.b. No soak was removed from cast 11a. Recording began at approx. 2.5 db, the CTD was
held at this depth for 40 seconds and then lowered.
D352 cruise report / 22
Derive: This is run once all the adjustments to the data have been made. The final oxygen,
salinity and density values etc are determined.
Derived variables selected:
Oxygen concentration (ml/l), oxygen saturation (%), oxygen concentration (umol/kg)
Salinity primary and secondary (PSS-78)
Density (kg/m3) & Density (sigma-theta, kg/m3)
Output written to ctdnnn_We_Ft_Al_Ctm_Dr.cnv (original channels remain).
BinAverage: This program was run to average the 25Hz data into 1db and 2db bins. This was
output to ctdnnn_We_Ft_Al_Ctm_Dr_1db.cnv and ctdnnn_We_Ft_Al_Ctm_Dr_2db.cnv
Bin Type
Pressure, db
Bin Size
1 or 2
Include No. of scans per bin
No
Exclude scans marked as bad Yes
Scans to skip over
0
Cast to process
Up and down
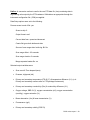
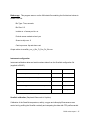
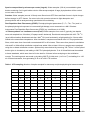
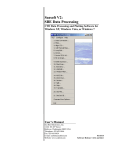
CTD Problems
During the data processing a problem with the quality of CTD data was noted. Large spikes in
the temperature profile were seen as the CTD passed through the pycnocline (Figure 4.3). This
was a feature of both the primary and secondary sensors and a feature also noted in the
conductivity.
D352 cruise report / 23
Figure 4.3 Primary and secondary temperature sensors both recording large warm anomalies
through the thermocline.
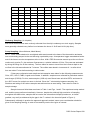
The spikes appear to be associated with a decrease in the decent rate of the CTD package (see
figure 4.4) and are therefore likely associated with inefficient flushing of the CTD package. This
is similar problem to that encountered on cruise CD173 (Charles Darwin 2005). As the veer rate
on the winch slows ‘old’ water is pushed back passed the sensors out the base of the rosette.
As the rate of decent increases again ‘new’ water is flushed back passed the sensors.
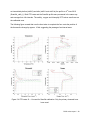
Given that these spikes disrupt at times up to 2 m of the profile averaging over 1db pressure
bins will not always remove the signal (Figure 4.5). Interpretation of these features and those
appearing in the salinity profile should therefore be treated with caution.
D352 cruise report / 24
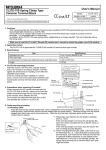
Figure 4.4. Time vs temperature, conductivity and pressure through the thermocline. Note the
temperature and conductivity spiking at times when the CTD decent rate has slowed/stopped.
Figure 4.5. 24Hz temperature and salinity profiles (blue) and 1db averaged (red) data.
Further observations: The fluorescence channel on casts 58 and 59 is very noisy suggesting a
problem with the sensor.
D352 cruise report / 25
Calculation of derived variables
•
Salinity and density were calculated using formulas from ‘N.P Fofonoff and R.C. Millard.
UNESCO technical papers in marine science #44, 1983’.
•
Oxygen (ml/l) and oxygen percent saturation were calculated as described in
‘Application Note 64: SBE 43 Dissolved Oxygen Sensor’.
•
Oxygen (um/kg) was calculated as follows:
Oxygen [um/kg] = ( 44660 / (sigma-theta + 1000) ) * oxygen [ml/l]
•
Beam attenuation (c) was calculated from the light transmission (%) as follows:
c = -(1/z) * ln (light transmission [decimal]),
where light transmission [decimal] is light transmission (%) divided by 100. See ‘SBE
Application Note 7: Calculation of Calibration Coefficients for Sea Tech, Chelsea
(Alphatracka), and WET Labs Cstar Transmissometers’.
Instrument Configuration- Calibration
Instrument calibration dates and serial numbers taken from the CTD configuration file (supplied
to BODC).
Sensor
Serial Number
Calibration date
SeaBird 9 temperature sensor (1)
4151
27 February 2010
SeaBird 9 temperature sensor (2) – mounted on the vane
4872
31 March 2010
SeaBird 9 conductivity sensor (1)
3272
25 February 2010
SeaBird 9 conductivity sensor (2) – mounted on the vane
3258
31 March 2010
D352 cruise report / 26
Digiquartz pressure sensor with TC
90573
20 October 2008
SeaBird 43 Oxygen sensor – mounted on the CTD
1624
9 April 2010
Fluorometer, Chelsea Aqua 3
88-2050-095
19 January 2009
PAR/Irradiance (1) upwelling
07
11 October 07
PAR/Irradiance (2) downwelling
06
26 October 07
Transmissometer, Chelsea
161050
7 November 2005
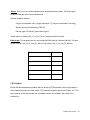
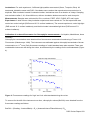
Salinity Calibration
Water samples for salinity calibration were collected by NMF at most sites. A total of 107
samples were analyzed using a Guildline Autosal salinometer (S/N 68958) against standard
seawater. Using all 107 samples, the mean and standard deviation of residuals for the primary
and secondary sensors are 0.0057 ± 0.016 and 0.020 ± 0.017 respectively.
Figure 4.6 Residual salinity (Bottle - CTD) for primary (blue) and secondary (red) sensors. Lines
mark ½ a standard deviation above and below the mean residual for each sensor.
D352 cruise report / 27
Removing outliers ½ a standard deviation above or below the mean residuals leaves 97 data
points. The new means and standard deviations are 0.0062 ± 0.0021 (primary) and 0.021 ±
0.0036 (secondary). The raw CTD salinities from the primary and secondary sensors therefore
require offsets of 0.0062 and 0.021 respectively. These have been applied to the processed
data provided to BODC.
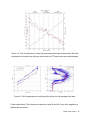
Chlorophyll Calibration
Details of the calibration of the on-board fluorometer and drift correction applied to readings can
be found in the report provided by Anna Hickman and Mark Moore.
Two different calibrations have been applied to the CTD chlorophyll readings; one for the shelf
edge (casts 53-56) and one for the Celtic Sea shelf water. Samples at all depths from pre-dawn
CTD casts were used in the calibration. If a cast was taken during daylight hours only samples
from 50m or deeper were included.
Figure 4.7. CTD raw chlorophyll vs. bottle samples for Celtic Sea water (left) and shelf edge
water (right)
Based on the regressions shown above the following calibrations have been applied:
D352 cruise report / 28
At the shelf-edge
CTDchl = 0.77 × BOTchl -0.023
therefore,
CHLcalib = 1.30 × CTDchl + 0.03
µg/l
In the Celtic Sea
CTDchl = 0.40 × BOTchl -0.022
therefore,
CHLcalib = 2.5 × CTDchl + 0.06
µg/l
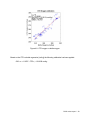
Oxygen Calibration
Oxygen concentrations recorded by the SeaBird 43 Oxygen sensor at the times of bottle firings
(in .btl file) were converted from ml/l to um/kg as follows:
CTDoxy [um/kg] = ( 44660 / (sigma-theta + 1000) ) * CTDoxy [ml/l]
Oxygen concentrations from bottle measurements were converted from um/l to um/kg as
follows:
oxygen[um/kg] = (1000 * botoxy [um/l] ) / (sw_dens0(salinity , botoxytemp)) ,
The routine sw_dens0 calculates the density at atmospheric pressure (i.e. sigma-t + 1000)
using the salinity recorded at the time of bottle firing (salinity) and the oxygen fixation
temperature of the sample (botoxytemp).
D352 cruise report / 29
Figure 4.8. CTD oxygen vs bottle oxygen
Based on the CTD vs bottle regression [um/kg] the following calibration has been applied:
OXYcalib = 1.0873 * CTDoxy – 19.8039 um/kg
D352 cruise report / 30
5. D352 Scanfish (Jo Hopkins and Dave Teare)
The Scanfish towed undulator consists of the following systems:
The manufacturer’s (G.M.I.) underwater vehicle, flight control software and hardware; an
instrumentation package based around the Seabird SBE911+ CTD system. The manufacturer’s
equipment controls all aspects of the flight control of the vehicle including the logging of flight
parameters. The Seabird system comprised of the following equipment: SBE911+ CTD and
deck unit; a single temperature and conductivity pair, mounted externally on the port wing
cheek; a SBE43 oxygen sensor and a Chelsea instruments Aquatracka fluorometer.
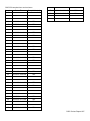
A total of seven surveys runs were completed with approximately five and a half days of time
spent in the water. The following problems were encountered. On survey six a number of data
drop outs occurred, this culminated in the eventual failure of the underwater termination, after
some thirty six hours of the survey. The cable was re-terminated and the survey run was
completed at the end of the cruise.
Scanfish tows
Date
Start
End
Distance
Lat/Lon
Lat/Lon
towed
Jun 05 2010
49.20 N,
49.62 N,
18:57
8.67 W
9.34 W
Jun 12 2010
49.42 N,
49.12 N,
08:55
8.94 W
9.46 W
Jun 13 2010
49.11 N,
49.14 N,
13:37
9.46 W
9.52 W
Jun 14 2010
49.17 N,
49.42 N,
18:04
9.48 W
9.03 W
Jun 17 2010
49.42 N,
49.42 N,
17:59
9.01 W
9.03 W
Jun 21 2010
48.31 N,
50.07 N,
11:15:00
9.60 W
8.99 W
Tow
(start of tow)
1
2
3
4
5
6
69 km
245 km
Description
Short initial tow on shelf from the 150m
isobath.
A tow of 4 legs turning at: (49.72 N, 8.55
W) , (49.82, 8.73 W) , (48.96 N, 10.01 W) .
Along shelf tow over approx. 150m of
127 km
water. Turns at: (49.35 N, 9.80 W), (49.35
N, 10.22 W)
467 km
186 km
479 km
Long tow of 6 legs crossing multiple rises.
Water depths 100-170 m.
Triangular tow turning at: (49.16 N, 8.02
W), (49.62 N, 8.72 W)
Initial section of tow along the shelf-break
followed by a transect across the shelf
D352 cruise report / 31
from 48.25 N, 10.74 W to 50.07 N, 8.00 W.
7
8
Jun 22 2010
50.07 N,
50.58 N,
18:09:49
8.00 W
7.19 W
Jun 24 2010
53.09 N,
50.63 N,
10:52:49
5.20 W
7.10 W
83 km
312 km
Continuation of tow 6
Final tow south north joining up with the
end of tow 7
Figure 5.1 Map of Scanfish tows 1-5. Black contours mark the 150m, 500m and 1000m
isobaths. Black dots are mooring locations.
D352 cruise report / 32
Figure 5.2 Map of Scanfish tows 6-8. Black contours mark the 150m, 500m and 1000m
isobaths. Black dots are mooring locations.
Data Processing
Scanfish tows were recorded using the SeaBird data collection software SeaSave-Win32. The
software output three files in the form Scanfish_run_n (nnn= tow number) with the following
extension:
•
.hex (raw data file)
•
.CON (configuration file)
•
.hdr (header file)
These were backed up onto the ships network.
The following SeaBird Software Processing, Version 7.18c (SBEDataProcessing-Win32) steps
were performed (further routine details found under CTD processing).
DatCnv: Data Setup options were set to the following:
D352 cruise report / 33
Process scans to end of file: yes
Scans to skip: 0
Output format: ascii
Convert data from: upcast and downcast
Create file types: create converted data file only (.cnv)
Selected output variables were:
•
Scan count & Time elapsed (secs)
•
Latitude and Longitude (deg)
•
Pressure, digiquartz (db)
•
Temperature (ITS-90 °C)
•
Conductivity (S/m)
•
Oxygen voltage, SBE 43 (V)
•
Fluorescence (ug/l)
•
Decent rate (m/s)
•
Salinity (psu)
A hysteresis correction using a window size of 2 seconds was made to the Oxygen. One output
file is generated: Scanfish_run_n.cnv.
Section: This module was run on Scanfish runs 4 and 6 following advise by SeaBird. The Filter
module necessary to remove high frequency noise in the pressure channel was unable to cope
with large file sizes. Therefore, runs 4 and 6 were split into 3 and 2 subsections respectively
based on scan number. File names were appended with A, B or C (e.g. Scanfish_run_4C.cnv).
The table below shows the scan numbers used to split the files.
D352 cruise report / 34
Scanfish_run_4
Scanfish_run_6
Scanfish_run_nA.cnv
0 970,000
0 1,084,700
Scanfish_run_nB.cnv
970,000 1,721,700
1,084,700 2,668,104
Scanfish_run_nC.cnv 1,721,700 2,750,393
WildEdit: The following settings were used:
Scan range: 100 scans
Standard deviation, pass 1: 2
Standard deviation, pass 2: 20
Exclude scans marked as bad: yes
Select WildEdit variables: pressure only
Output written to scanfish_run_n_We.cnv.
Filter was run on the pressure channel to smooth out high frequency data (Low pass filter time
constant set to 0.15 seconds).
Output written to scanfish_run_n_We_Ft.cnv.
AlignCTD was used to align the oxygen sensor. The Scanfish calibration cast
(Scanfish_calib_1) was tested for corrections of +2-8 seconds. A +4 second was chosen as the
optimal adjustment.
D352 cruise report / 35
Figure 5.3 (Left) Temperature vs oxygen voltage for the Scanfish calibration cast before oxygen
aligment. (Right) Temperature vs oxygen voltage after a 4 second adjustment.
Output written to scanfish_run_n_We_Ft_Al.cnv.
CellTM: The thermal anomaly amplitude α was set to 0.03 and the thermal anomaly time
constant 1/β to 7.
Output written to scanfish_run_n_We_Ft_Ctm.cnv.
Loopedit is used for the calibration cast only (Scanfish_calib_1). Settings are the same as for
the CTD processing.
Derive: Derived variables selected:
Oxygen concentration (ml/l), oxygen saturation (%), oxygen concentration (umol/kg)
Salinity (psu),
Density (kg/m3),Density (sigma-theta, kg/m3)
Output written to scanfish_run_n_We_Ft_Ctm_Dr.cnv.
D352 cruise report / 36
BinAverage: This program was run on the 24Hz data file containing the final derived values to
create a 2Hz file.
Bin Type: Time, seconds
Bin Size: 0.5
Include no. of scans per bin: no
Exclude scans marked as bad: yes
Scans to skip over: 0
Cast to process: Up and down cast
Output written to scanfish_run_n_We_Ft_Ctm_Dr_2Hz.cnv.
Instrument configuration
Instrument calibration dates and serial numbers taken from the Scanfish configuration file
(supplied to BODC).
Sensor
Serial Number
Calibration date
SeaBird 9 temperature sensor - wing cheek mounted
4782
12 February 2010
SeaBird 9 conductivity sensor - wing cheek mounted
2450
10 February 2010
Digiquartz pressure sensor with TC – mounted internally
110557
26 April 2009
SeaBird 43 Oxygen sensor – mounted internally
0621
20 March 2010
Fluorometer, Chelsea Aqua 3
088126
2 January 2007
Scanfish calibration (Stephanie Bates and Jo Hopkins)
Calibration of the Scanfish temperature, salinity, oxygen and chlorophyll fluorescence was
carried out by profiling the Scanfish vertically and comparing the data with CTD profiles carried
D352 cruise report / 37
out immediately before (ctd010) and after (ctd011 and ctd011a) the profile on 6th June 2010
(Scanfish_calib_1). Both CTD casts and the Scanfish profile were processed in the same way
and averaged into 1db intervals. The salinity, oxygen and chlorophyll CTD values used here are
the calibrated ones.
The following figure reveals that over the time taken to complete the four casts the position of
the thermocline change by approx. 10 db, suggesting the passage of an internal wave.
Figure 5.4 CTD casts 10 – 11a used for Scanfish calibration. Only the primary channels have
been used.
D352 cruise report / 38
The mean difference between Scanfish and the mean of the three CTD casts in regions of the
water column where conditions were homogeneous was used to calibrate the temperature,
salinity and oxygen. Only the primary sensor on the CTD cast, and measurements made on the
downcast were used.
Using data over 50-76 db the mean offsets are:
For temperature:
mean (Scanfish – CTD) = 0.0019 ± 0.00273°C
For salinity:
mean (Scanfish – CTD) = -0.0072 ± 0.0009
For oxygen:
mean (Scanfish - CTD) = 0.025 ± 0.0040 ml/l
n.b. calibrated CTD data was used for the above Scanfish calibrations.
Figure 5.5 Temperature, salinity and oxygen offsets (Scanfish - CTD) in the bottom mixed
region of the water column (50-76 db).
The Scanfish chlorophyll was calibrated by comparing the data collected through the subsurface
maximum from CTD casts 10-11a with the vertical Scanfish cast. Pairs of chlorophyll values
(Scanfish-CTD) were selected based on the water temperature (9.8-12°C, in increments of
0.1°C), rather than depth. This was necessary given the large vertical displacements of the
thermocline. The mean measurement from the three CTD casts was used.
D352 cruise report / 39
Figure 5.6 Regression of CTD chlorophyll concentration vs. Scanfish chlorophyll. Black dots are from the
subsurface maximum and are used in the regression. Open red circles at lower concentrations are values
outside the peak and NOT used in the regression.
CHLSF = 0.3029 × CHLCTD
r2 = 0.48, rms error = 0.24
The regression was forced through zero so as to avoid large numbers of negative values.
Using the regression above the Scanfish chlorophyll measurements are calibrated as follows:
CHLSFcal = 3.3019 × CHLSF mg.m3 ,
where CHLSF is the raw chlorophyll measured by Scanfish.
The rms error about this regression is 0.24 mg.m3. As the calibration was performed using the calibrated
CTD chlorophyll concentration, the total error in Scanfish chlorophyll estimates is (0.102+0.242)1/2 = 0.26
mg.m3 (using the rms error from the Celtic Sea regression).
D352 cruise report / 40
6. Microstructure turbulence observations (Yueng-Djern Lenn)
Turbulence Team
Bangor University personnel:
Yueng-Djern Lenn8, Ben Lincoln12, Chris Old4, Ben Powell4, Tom Millgate12, Holly Pelling8.
NOC personnel:
Jeff Polton12
[superscripts correspond to the start of the 4-hour watches. Watch leaders: YDL, BL and CO].
Instruments & set-up:
The principal instrument used during the cruise was the Bangor University VMP500. The NOC VMP750
and accessories were also brought along as a back-up. The VMP- 500, winch and line-puller was set up to
be deployed from the back deck in order to tow the instrument during profiling. The block was hung from
the starboard crane which was also used to help deploy and recover the instruments during repositioning
exercises. Both the VMP500 and VMP750 winches were run off the dedicated pumps instead of ships
hydraulics.
VMP profiling during each time series was confined to 4-mile diameter circle centered on the IM1 mooring.
Tow speeds ranged from 0.4-1.5 knots depending on the winds and tides. Each time-series was interrupted
by time taken to reposition the ship or conduct a CTD cast to resolve the nutrient structure and provide
calibration for the VMP Seabird data. While profiling with the VMP500, the instrument was deployed in free
fall mode until it reached the bottom before being recovered to the surface whereupon it was promptly
redeployed. While profiling with the VMP2000, more care was taken to try and keep the instrument off the
bottom as is preferred by Matt Palmer (NOC Liverpool).
Observations:
Initial cruise plan was to include several 60-hour long VMP time-series at the central Celtic Sea mooring
location to resolve at least 4 inertial periods. Each time-series was to be timed to coincide with
springs/neaps and the mid-tidal cycles and preferably a wind event. This was amended based on the
incidence of weather fronts across the sampling region.
We completed one 50-hour VMP-500 time-series when the first front passed through the mooring locations,
breaking for a day before commencing a second time-series in anticipation of a second weather front. A
couple of bad profiles after 24 hours instigated a re-termination, following which we had to stop the timeseries due bad data from the micro-temperature and shear probes. This was eventually traced to a small
leak in the VMP-500 pressure case that damaged the PCB to which the shear and micro-temperature
probes were connected.
D352 cruise report / 41
A third 15-hour time-series was completed in the remaining time allotted to the second time-series in the
central Celtic Sea using the VMP750, while repairs on the VMP500 were attempted. All together the central
Celtic Sea turbulence data showed a lot of interesting features and were successful at resolving the
dissipation due to shear-spiking.
Following the conclusion of the central Laptev Sea observations we proceeded to a midway point between
the moorings and shelf-edge to make new observations relating to the progression of the internal tide from
the shelf edge. Upon arrival at the mid-point location, we tested the now-dry VMP500. The poor data
streams from T1,T2, S1 and S2 confirmed the permanent damage to the PCB and we switched over to
using the VMP750.
After 40 minutes of profiling with the VMP750, the instrument was recovered for repositioning. During
recovery, the VMP750 sustained a serious collision with the ship that resulted in obvious external damage
to the Seabird conductivity cell, as well as the Seabird thermistor. Further investigation showed that the
VMP750 had developed a leak due to a failure of the pressure case in a manner similar to the VMP500.
Tests showed that the VMP750had sustained damage to the same PCB as the VMP500. Regrettably, this
meant the conclusion of further turbulence profiling as repair was not possible at sea. An e-mail discussion
between Ben Powell (Bangor technician extraordinaire) and the manufacturer about the source of the
problem and necessary repairs is appended at the end of this document.
Minor operational issues:
The placement of the crane/block was critical to the ease of repeat profiling. First it was imperative to place
the block in line between the winch and line-puller. The optimum set-up was with the block set quite high up
with the crane at a 90-degree angle so the arm holding the block was parallel to the deck. If the crane arm
was inclined towards the deck, the crane had a tendency to slip resulting in the block drifting out of
alignment. This caused the occurrence of standing waves in the wire between the block and line-puller
during the downcasts that tended to push the wire o_ the yellow line-puller pulley, and also compounded
spooling onto the winch during upcasts.
Throughout the VMP500 profiling, we experienced loss of communications between the VMP500 and
laptop on a semi-regular basis. The pop-up error message would say that the USB device had unmounted
from the laptop and the data feed would cease. We suspected that this was due to problems at the
utrans/laptop end of things, and appeared to be rectified by unplugging all the USB connections (VMP,
serial nav stream, external hard drive) and restarting the ODAS software and plugging everything back in.
As the profiling progressed we noticed more frequent Bad Buffer notices. Eventually when the VMP500
profiling was halted due to the leak, we found that the black Utrans box was also no longer functioning and
concluded that this had been the source of the communications issues.
Preliminary results:
D352 cruise report / 42
Drift during each time-series in the vicinity of the IM1 mooring is shown in Fig. 6.1. Comparison of the
Seabird conductivity cells is not good, in particular the VMP750 appeared to values far fresher than is
realistic for the Celtic Sea. The two Seabird thermistors also appear to have different calibrations (Fig. 6.2).
Clearly the Seabird data from each instrument will have to be calibrated to the independent CTD
observations before the data is finalised.
Figure 6.1: salinity at 50 m depth versus position in the vicinity of IM1 (left) and midway between
IM1 and the shelf edge (right).
The microstructure shear profiles have been despiked and processed to produce dissipation ( ε ) estimates.
Results from the two shear (orthogonally aligned) channels compared well with each other in terms of
magnitude and temporal variability for each of the VMP500 and VMP2000 instruments..
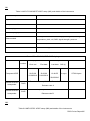
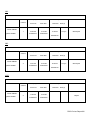
Table 1: First VMP500 time-series, 50 hours, 249 good pro_les.
Date and time
Comments
Latitude & Longitude
06-Jun-2010 17:38:00
start VMP profiling
49° 26.43'N 8° 59.25'W
06-Jun-2010 22:47:00
break for repositioning
49° 23.63'N 8° 59.51’W
07-Jun-2010 00:00:00
recommence VMP profiling
49° 26.97'N 8° 57.97'W
07-Jun-2010 03:39:00
break for repositioning and CTD012
49° 24.25'N 9° 0.87'W
07-Jun-2010 05:40:00
recommence VMP profiling
49° 27.32'N 8° 58.26'W
07-Jun-2010 12:44:00
break for repositioning
49° 23.46'N 8° 59.26'W
07-Jun-2010 13:51:00
recommence VMP profiling
49° 26.91'N 8° 58.13'W
07-Jun-2010 15:04:00
break for repositioning and CTD013
49° 25.83'N 8° 59.58'W
07-Jun-2010 15:55:00
recommence VMP profiling
49° 25.27'N 9° 0.29'W
07-Jun-2010 17:00:00
break for repositioning
49° 24.13'N 9° 2.07'W
07-Jun-2010 18:17:00
recommence VMP profiling
49° 27.00'N 8° 58.19'W
07-Jun-2010 21:59:00
break for CTD014
49° 25.64'N 8° 59.97'W
07-Jun-2010 23:12:00
recommence VMP profiling
49° 26.58'N 8° 58.07'W
08-Jun-2010 01:17:00
break to sort out bad tangle and reboot laptop
49° 25.94'N 8° 58.99'W
08-Jun-2010 01:53:00
recommence VMP profiling
49° 25.69'N 8° 59.37'W
08-Jun-2010 02:41:00
break for retermination of VMP cable, CTD015
49° 25.28'N 9° 0.20'W
08-Jun-2010 05:01:00
recommence VMP profiling
49° 26.12'N 8° 59.23'W
D352 cruise report / 43
08-Jun-2010 06:30:00
break for repositioning
49° 24.63'N 9° 2.68'W
08-Jun-2010 08:03:00
recommence VMP profiling
49° 26.46'N 8° 58.71'W
08-Jun-2010 15:57:00
break for repositioning
49° 23.66'N 9° 0.48'W
08-Jun-2010 17:07:00
recommence VMP profiling
49° 26.80'N 8° 58.18'W
08-Jun-2010 20:03:00
conclude VMP time-series and CTD016
49° 23.24'N 9° 1.54'W
Table 2: Second VMP500 time-series, 24 hours, 153 pro_les
Date and time
Comments
Latitude & Longitude
09-Jun-2010 17:06:00
start VMP profiling
49° 25.44'N 9° 0.57'W
09-Jun-2010 23:29:00
break for repositioning
49° 26.08'N 8° 57.23'W
10-Jun-2010 00:11:00
recommence VMP profiling
49° 24.20'N 9° 1.01'W
10-Jun-2010 01:09:00
break for repositioning
49° 24.42'N 8° 59.29'W
10-Jun-2010 01:53:00
recommence VMP profiling
49° 24.77'N 8° 58.62'W
10-Jun-2010 04:11:00
break for CTD017
49° 26.15'N 8° 57.33'W
10-Jun-2010 05:06:00
recommence VMP profiling
49° 25.82'N 8° 57.57'W
10-Jun-2010 09:24:00
break for repositioning
49° 26.27'N 8° 57.92'W
10-Jun-2010 10:11:00
recommence VMP profiling
49° 24.39'N 9° 1.14'W
10-Jun-2010 12:02:00
break for repositioning, retermination, CTD018
49° 25.68'N 8° 59.71'W
10-Jun-2010 13:44:00
recommence VMP profiling
49° 23.66'N 8° 59.88'W
10-Jun-2010 17:26:00
break for repositioning
49° 26.96'N 8° 57.08'W
10-Jun-2010 18:17:00
recommence VMP profiling
49° 24.52'N 9° 1.76'W
10-Jun-2010 19:19:00
halt VMP500 profiling due to instrument failure
49° 24.82'N 9° 1.35'W
Table 3: Third VMP time-series with VMP2000, 12 hours, 95 good profiles
Date and time
Comments
Latitude & Longitude
11-Jun-2010 11:10:00
start VMP profiling
49° 24.26'N 9° 0.87'W
11-Jun-2010 14:15:00
break for repositioning
49° 26.43'N 9° 0.38'W
11-Jun-2010 15:05:00
recommence VMP profiling
49° 23.29'N 8° 57.98'W
11-Jun-2010 18:27:00
break for new heading
49° 25.24'N 9° 1.58'W
11-Jun-2010 18:33:00
stop for CTD
49° 25.27'N 9° 1.50'W
11-Jun-2010 20:06:00
break for repositioning
49° 25.86'N 9° 0.06'W
11-Jun-2010 21:13:00
recommence VMP profiling
49° 25.96'N 9° 0.67'W
12-Jun-2010 00:08:00
break for repositioning
49° 26.37'N 8° 57.45'W
12-Jun-2010 00:48:00
recommence VMP profiling
49° 23.65'N 8° 57.70'W
12-Jun-2010 02:12:00
end of VMP time-series
49° 24.57'N 8° 59.23'W
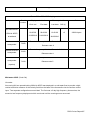
Table 4: Fourth time-series with VMP500/VMP2000 midway to shelf edge.
Date and time
Comments
Latitude & Longitude
14-Jun-2010 00:31:00
begin test casts with VMP500
49° 2.33'N 9° 22.87'W
14-Jun-2010 03:51:00
stop test casts with VMP500, recover
49° 0.92'N 9° 21.63'W
14-Jun-2010 02:50:00
begin VMP2000 profiling
49° 2.33'N 9° 22.87'W
14-Jun-2010 03:51:00
break for repositioning
49° 0.92'N 9° 21.63'W
D352 cruise report / 44
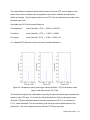
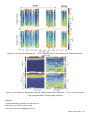
Comparisons of dissipation resolved by the different instruments was also good (Fig. 6.3). There is clear
evidence of tidal modulation of the bottom boundary layer, as well as intermittent appearance of high
dissipation events at different depths within diffuse thermocline of the water column (Fig. 6.3). Only some of
these mid-water events were isolated events without strong relation to either surface mixed layer or bottom
boundary layer processes.
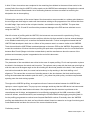
A summary of the 6 good VMP2000 profiles at the mid-way point between IM1 and the shelf edge are
shown in Fig. 6.4. This location is characterised by a warm surface mixed layer approximately 20m deep
below which lies a salty intrusion itself about 20 m thick. The turbulent environment is characterised by high
dissipation in the surface mixed-layer and below 80-m depth. The highest dissipation was observed at the
base of the surface-mixed layer for at last 4 profiles from 0300 onwards.
Figure 6.2: time-series of temperature (top) and salinity (bottom) from the seabirds on the 2 VMP profilers.
D352 cruise report / 45
Figure 6.3: time-series of dissipation ( ε , W m-3) from the shear 1 (top) and shear 2 (bottom) channels.
Figure 6.4: time-series of temperature (top left), salinity (bottom left), dissipation ( ε , W m-3) from the shear
1 (top right) and shear 2 (bottom right) channels.
Appendix
||{ Original Message ||{ Subject: Re: VMP500 sn21
Date: Sun, 20 Jun 2010 15:08:04 +0000
From: Ben Powell <[email protected]>
D352 cruise report / 46
To: Rolf Lueck <rolf@rocklandscienti_c.com>
CC: peter@rocklandscienti_c.com, 'Dave Cronkrite' <dave@rocklandscienti_c.com>, 'Fabian
Wolk' <fabian@rocklandscienti_c.com>
Hi Rolf,
Thanks for your reply, I checked the inside of the nose cone and it was completely dry, however, I want to replace the
cables on that side as the cables insulation is slightly frayed
(caused by scraping when attaching probes) and this is what we think caused our previous
noise problem. I would also like to replace the cables / hockey puck for the MC probe. I
have connected to the instrument using a good UTRANS box via the winch tether (about
500m) and had no buffer errors I so hope that the RTRANS board is OK. The reason I
suspected the ASTP board is because (as you guessed) there were splashes of water on the
board.
I guess the next step is to remove all the known problems (the smc cables, the hockey
pucks and the utrans box) and then conduct the tests you described.
I am still currently on a ship but will be back on land next week, as such I can't raise
a purchase order at the moment. Would it be possible for you to invoice us a total once
we know the full extent of the damage? Don't worry if this is a problem, we'll just wait
till I get back, however we hoped to use the instrument again in July so it would be nice
to get it fixed asap. If possible could you please send to Bangor the following :
1 x UTRANS box
5 x SMC Probe Cable with Straight Connector (18 in)
5 x SMC Probe Cable with Rt. Angle Connector (18 in)
2 x Hockey Puck
Thanks,
Ben
On 17/06/2010 20:12, Rolf Lueck wrote:
Ben,
You did a good job of describing the symptoms and this narrows the range of possible
problems.
Bad signals on T1, T2, sh1 and sh2 but not on P, P dP and the accelerometers indicates
that the ASTP board is very likely in good order. The shear probes and thermistors are
on the front of the nose cone. A bulkhead separates the nose cone from the pressure case
so that, in the unlikely event that water should enter the nose cone (possibly because of
a leaky probe or an incorrectly installed o-ring), then this water cannot enter the main
pressure case and ruin the electronics.
You found a back-door entrance for water into the pressure. When the instrument is
oriented vertically and nose down, the lowest point inside of the pressure case is the dry
side of the feed-through pins in the front bulkhead. Therefore the cables to the thermistors
and shear probes got wet at the point of feed through. Even after you dry out everything,
remnant salt crystals will remain in the coaxial cables and cause noise, particularly for
the shear probe signals. The pressure transducer and accelerometers are elevated slightly
above the bulkhead and it takes more water to cause trouble with these sensors. The fact
D352 cruise report / 47
that you are getting sensible signals from these sensors indicates that they did not get
wet and that (most probably) the ASTP board also remained dry. However, you should
inspect everything carefully with a magnifying glass. Sometimes water will splash onto
components when handling an instrument that is wet on its inside.
Before I describe what should be done, let me remind you to also check for evidence
of water penetration into the nose cone. The symptoms you describe will also occur if
water enters the nose cone. Also, a quick test of the system is obtained by disconnecting
the shear probe cables at the ASTP board. Push some heat shrink tubing over the cables
or insulate them by other means so that the cable ends do not touch anything electrical.
Use the calibration option to look at the statistics of the channels. The shear probe mean
should be within about 100 counts of zero and its standard deviation should be under 30,
particularly if the board is shield by the pressure case or a sheet of aluminum foil that has
been grounded to the analog ground of the ASTP board (usually, the black test points). To
test the thermistors requires inserting a 3k-ohm resistor into the connector on the ASTP
board. This may be difficult to do, so dont bother if you do not have a short SMC cable
with a 3 k-ohm resistor soldered to its end. The mean would also be within 100 counts of
zero and the standard deviation small.
You have to replace the coaxial cables. There is no way to clean them assuredly.
Replacing the cables is a bit of fiddle but it can be done by a competent techno-person.
To solder new cables to the dry side of the feed through pins (the units are usually called
hockey pucks because of their shape), you must push the hockey pucks forward and out
of their holes. There is not much free real estate between the pins. A 2 mm blunt rod
will usually work. If the puck has been installed for a while, the o-ring grease is dry and
the push may have to be strong. Once the puck is out, you can push new cables through
the hole from the dry side and then solder them on to the old puck, if it looks OK, or on
to a new puck. Follow the pin pattern that we used and be sure that shield on one side
connects to the corresponding shield on the other side, dido for the inner conductors, etc.
Also put heat shrink on as was done original (if it was done originally). Finally, be sure
to remove residual ux and other contaminants from the soldering operation. Very lightly
grease the o-ring(s) on the hockey puck and push it back into its hole. Your instrument
probably has two hockey pucks and you have to service both of them.
You blew the UTRANS but it is also likely that you damaged the RSTRANS (or
RTRANS), because this too connects to the signal lines in the tether and will have seen
excessive voltage. The RSTRANS is repairable. The RSTRANS may work OK when using
a short communication cable (such as your deck cable) but will fail to function properly
on a real tether that is 1000 m or longer. You should conduct a few tests. One test is to
look at the mean voltage with respect to digital ground (also the black test points) on the
signal lines. This should be 2.500V +/- 0.005V. Take this measurement without the tether
connected. If you get 2.500V, then that is a good sign. If not, the driver and or receiver
chips got damaged and will have to be replaced. This is best done at RSI. The second test
is to try communication using your tether. If you do not get bad buffers, the RTRANS is
probably OK. The _nal test is to look at the signals at both ends of a (long) tether. If it
comes to that, I can give you some guidance on the voltage levels that the signals should
D352 cruise report / 48
have.
So, I think that you need at least:
1. 4 new SMC coaxial cables for the connection from the hockey pucks to the ASTP board.
2. A UTRANS
3. A new RSTRANS or a repaired one and or a spare one.
The other things on your list may not be needed but are useful spares. To repair the
RSTRANS only requires the board and not the whole instrument.
Cheers, Rolf
From: Peter Stern [mailto:peter@rocklandscienti_c.com] Sent: 17 June, 2010 10:09
To: [email protected]
Cc: Dave Cronkrite; 'Rolf Lueck'
Subject: VMP500 sn21
Hi Ben,
Rolf or Dave will comment on things electrical/electronic.
I am curious about the loosened rear sealing nut.
Do you have a sense of how loose it was?
Do you have any pictures of the instrument showing how it was rigged for those deployments, especially of the tail
section showing how all the cables, etc.. were tied down.?
How many casts did you complete before the problem was noticed?
Was the tail _n securely bolted to the clamps & were the clamps securely bolted together
and tight to the tube?
Having this nut back o_ has not happened before so I am very interested in this,
obviously.
I have ordered some low strength Loctite 222 (purple) and will do a loctite test. There
are two possible problems with using loctite (these are what spring to mind, there could
be other problems/issues): 1. Residual grease, etc on the threads will stop the loctite from
curing.
2. Loctite cures, but makes removing the nut so difficult that something is damaged or you
wind up pulling the threaded rod out of its mount inside the instrument. This threaded
rod is locked into place using Loctite 262 (Red) which should hold much more strongly
than the 222 Purple. Usually you cant remove the threaded rod without the aid of a heat
gun.
Cheers, Peter
Peter Stern Mechanical Engineer Rockland Scientific International 520 Dupplin Road
Victoria, BC V8Z 1C1 t: 250.370.1688 f: 250.370.0234
D352 cruise report / 49
7. Vessel Mounted ADCPs (Chris Old)
Overview
The RRS Discovery operates a pair of hull mounted ADCPs; a 75 kHz RDI Ocean Surveyor and a 150 kHz
RDI Ocean Surveyor.
These were configured while steaming from Govan and through the Clyde Sea. There are a set of test files
that were generated while sorting out navigation and time synchronizing issues. The last test files ends in
St George’s Channel (52° 14.03’ N, 005° 44.72’ W) at 2104 on the 3rd of June.
The main set of cruise deployment files were started at 2115 on 3rd June at the southern end of St George’s
Channel (52° 12.13’ N , 005° 46.17’ W). A new set of deployment files was started between major set of
data collection. A summary of each deployment file for the ADCPs is presented in Tables 1 and 2 below.
ADCP Configurations
Two configurations were used with each of the ADCPs, these were with the bottom tracking turned on and
the bottom tracking turned off. The column ‘Bot. Track’ in Tables 1 & 2 identify when the bottom tracking
was turned ON or OFF for each instrument.
The 75 kHz ADCP was configured to measure
Number of depth bins (WN) 100
Bin size
(WS) 8 m
Blanking distance
(WF)
8m
Pings per ensemble (WP) 1
Water mode
(WM) 10
Max. error velocity
(WE) 1 m/s
Time between pings (TP)
00:00.00
Coordinates
(EX)
beam
Pings per record
(BP)
1
Delay for reacquire
(BD)
0
(ping immediately after processing)
With bottom tracking on
Minimum correlation (BC)
220
Minimum amplitude
(BA)
30
Bottom track mode
(BM)
1
Max. error velocity
(BE)
1000
This configuration gives approximately 6.1 s per record.
The 150 kHz ADCP was configured to measure
D352 cruise report / 50
Number of depth bins (WN) 96
Bin size
(WS) 4 m
Blanking distance
(WF)
4m
Pings per ensemble (WP) 1
Water mode
(WM) 10
Max. error velocity
(WE) 1 m/s
Time between pings (TP)
00:00.00
(ping immediately after processing)
Coordinates
(EX)
00000
(uncorrected beam coordinates)
Pings per record
(BP)
1
Delay for reacquire
(BD)
0
With bottom tracking on
Minimum correlation (BC)
220
Minimum amplitude
(BA)
30
Bottom track mode
(BM)
1
Max. error velocity
(BE)
1 m/s
This configuration gives approximately 4.67 s per record.
Single pings were used to facilitate the removal of the ships motion in the post-processing before time
averaging to reduce the measurement variance (error).
PC Clock drift.
The ADCPs internal clocks are reset from the computers CPU clock. The CPU time is the time stamp tied
to the output data stream, therefore any CPU clock drift will lead to a drift in the time difference between the
navigation data (which uses the GPS clock) and the ADCP ensemble data.
CPU Clock Reset
End of Data Collection
ADCP
Date
Time
UTC-CPU
Date
Time
UTC-CPU
75 kHz
02/06/2010
19:18:00
0s
25/06/2010
07:04
1s
150 kHz
02/06/2010
19:16:30
0s
25/06/2010
07:04
38s
D352 cruise report / 51
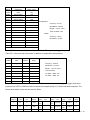
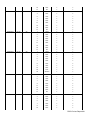
TABLE 1: 75 kHz ADCP
File Name
Day #
Date
Time
Latitude
Longitude
Bot. Track
Comments
D352_OS75001_*.*
154
03/06/2010
2115
52° 12.32’ N
005° 46.17’ W
ON
St Georges to mooring site
D352_OS75002_*.*
156
05/06/2010
0251
49° 25.06’ N
008° 59.62’ W
ON
VMP set 1
D352_OS75003_*.*
157
06/06/2010
1710
49° 26.64’ N
008° 58.90’ W
ON
VMP set 2
D352_OS75004_*.*
159
08/06/2010
2021
49° 29.41’ N
009° 00.49’ W
ON
Scanfish survey
D352_OS75005_*.*
164
13/06/2010
0820
49° 05.93’ N
009° 25.78’ W
ON
VMP set 3 / CTD + LADCP
D352_OS75006_*.*
167
16/06/2010
0133
49° 24.72’ N
008° 59.80’ W
ON
Scanfish
D352_OS75007_*.*
170
19/06/2010
1407
49° 24.53’ N
009° 00.36’ W
ON
CTD section
D352_OS75008_*.*
171
20/06/2010
1327
48° 36.35’ N
010° 14.19’ W
OFF
Off shelf edge CTD
D352_OS75a08_*.*
171
20/06/2010
1419
48° 29.44’ N
010° 23.99’ W
OFF
Incorrect config. file used
D352_OS75009_*.*
171
20/06/2010
1542
48° 29.95’ N
010° 27.93’ W
OFF
Correct config. file used
D352_OS75010_*.*
171
20/06/2010
2030
48° 34.87’ N
010° 16.17’ W
ON
Back on shelf
D352_OS75011_*.*
172
21/06/2010
0710
48° 42.03’ N
009° 39.39’ W
ON
Reset computers
D352_OS75012_*.*
172
21/06/2010
0820
48° 29.90’ N
009° 37.22’ W
ON
Along shelf scanfish
D352_OS75013_*.*
172
21/06/2010
2231
48° 16.80’ N
010° 45.24’ W
ON
Cross shelf scanfish (failed)
D352_OS75014_*.*
175
24/06/2010
0718
53° 03.88’ N
005° 12.18’ W
ON
Scanfish St Georges to fail pt.
176
25/06/2010
0704
50° 45.28’ N
006° 30.53’ W
System turned off
TABLE 2: 150 kHz ADCP
File Name
Day #
Date
Time
Latitude
Longitude
Bot. Track
Comments
D352_OS150001_*.*
154
03/06/2010
2115
52° 12.32’ N
005° 46.17’ W
ON
St Georges to mooring site
D352_OS150002_*.*
156
05/06/2010
0251
49° 25.06’ N
008° 59.62’ W
ON
VMP set 1
D352_OS150003_*.*
157
06/06/2010
1710
49° 26.64’ N
008° 58.90’ W
ON
VMP set 2
D352 cruise report / 52
D352_OS150004_*.*
159
08/06/2010
2021
49° 29.41’ N
009° 00.49’ W
ON
Scanfish survey
D352_OS150005_*.*
164
13/06/2010
0820
49° 05.93’ N
009° 25.78’ W
ON
CTD
D352_OS150006_*.*
167
16/06/2010
0133
49° 24.72’ N
008° 59.80’ W
ON
CTD
D352_OS150007_*.*
170
19/06/2010
1407
49° 24.53’ N
009° 00.36’ W
ON
CTD section
D352_OS150008_*.*
171
20/06/2010
1040
48° 49.57’ N
009° 59.99’ W
OFF
Off shelf edge
D352_OS150a08_*.*
171
20/06/2010
1419
48° 29.44’ N
010° 23.99’ W
OFF
Incorrect config. file used
D352_OS150009_*.*
171
20/06/2010
1544
48° 26.95’ N
010° 27.92’ W
OFF
Correct config. file used
D352_OS150010_*.*
171
20/06/2010
2229
48° 41.11’ N
010° 06.74’ W
ON
Back on shelf
D352_OS150011_*.*
172
21/06/2010
0710
48° 42.03’ N
009° 39.39’ W
ON
Reset computers
D352_OS150012_*.*
172
21/06/2010
0820
48° 29.90’ N
009° 37.22’ W
OFF
Along shelf scanfish
D352_OS150013_*.*
172
21/06/2010
2231
48° 16.80’ N
010° 45.24’ W
ON
Cross shelf scanfish
D352_OS150014_*.*
175
24/06/2010
0718
53° 03.88’ N
005° 12.18’ W
ON
Scanfish St Georges to fail pt.
176
25/06/2010
0704
50° 45.28’ N
006° 30.53’ W
System turned off
D352 cruise report / 53
8. Lowered ADCPs (Chris Old)
Overview
The aim of this deployment was to provide some independent validation of the method being developed to
measure low-resolution profiles of TKE dissipation rates from a lowered downward-facing ADCP. The
values estimated from the ADCP deployments will be compared with the profiles of TKE dissipation
measured using the VMP.
We removed the LADCPs and mounted a high-frequency, high-resolution instrument on the CTD rosette
using a custom built bracket. A number of different configurations were trialed to determine an optimal
configuration. Both a 1200 kHz and 600 kHz RDI Workhorse Sentinel were trialed. The 600 kHz instrument
used was the one recovered from the mid-water float high-frequency deployment.
Limiting factors on the success of the method are the amount of CTD rosette vertical movement while held
at a fixed depth and the length of time the rosette is held at each fixed water depth (typically about 60s for a
standard CTD cast). The longer the range the ADCP profiles the less the impact of vertical rosette motion
and the longer the time series at each depth the better the turbulent statistics are sampled. A minimum of
90s at each depth is required as it takes 30s for the turbulence generated by the rosette during the up cast
to dissipate, the remaining time series segment is used to estimate the TKE dissipation rate over the
measurable range of the ADCP.
The data collected between CTD casts 004 and 031 were less controlled, only a few of the casts produced
single depth time-series of more than 60s duration. The ADCP data were collected at the depths where the
water samples were taken.
D352 cruise report / 54
Casts 032 to 037 were specific to this experiment. For each cast the rosette was held for at least 2 minutes
at each depth. Nominally 5 depths were chosen, these corresponded to the near-bottom, mid-water, bottom
of thermocline, chlorophyll maximum, and the surface mixed-layer. The actual depths varied depending on
water depth and water structure profile taken from CTD down cast.
It should be noted that the pressure sensor on the 600 kHz ADCP was limited to 100m, therefore the
maximum depth for these casts was less than 100m.
D352 cruise report / 55
LADCP Uncontrolled Casts
Cast #
Cfg File #
Date
Time
Latitude
Longitude
Depth
Comments
004
001
04/06
15:22:43
49° 29.30’ N
008° 53.45’ W
126
MODE 5 configuration , 1.8 mins per depth
***
005
001
04/06
16:25:00
49° 25.52’ N
008° 53.45’ W
137
< 1 min per depth
006
001
05/06
02:36:33
49° 25.12’ N
008° 59.46’ W
136
< 1 min per depth
007
002
06/06
02:27:12
49° 25.13’ N
008° 58.12’ W
142
MODE 12 configuration , < 1 min per depth
008
002
06/06
04:34:35
49° 24.30’ N
008° 59.11’ W
145
2 min bottom & top, < 1 min mid-water
009
002
06/06
06:13:13
49° 24.00’ N
009° 00.32’ W
137
< 1 min per depth
012
002
07/06
04:36:54
49° 27.32’ N
008° 58.26’ W
122
Cap left on ADCP , 1.25 mins per depth
013
003
07/06
15:03:14
49° 25.86’ N
008° 59.59’ W
133
MODE 12, increased WV and WO , < 1 min
014
003
07/06
21:44:05
49° 25.68’ N
008° 59.94’ W
135
< 1 min per depth
015
003
08/06
04:07:10
49° 26.98’ N
008° 58.04’ W
128
< 1 min per depth
016
003
08/06
20:28:07
49° 24.49’ N
009° 00.27’ W
137
< 1 min per depth
017
003
09/06
02:33:31
49° 25.55’ N
008° 59.75’ W
135
> 2 mins per depth
***
018
003
09/06
10:48:02
49° 25.10’ N
008° 59.72’ W
133
~ 1 min per depth
019
003
09/06
15:39:28
49° 25.40’ N
009° 00.36’ W
137
< 1 min per depth
020
003
10/06
00:52:38
49° 24.44’ N
008° 59.23’ W
146
< 1 min per depth
021
003
10/06
04:16:34
49° 26.11’ N
008° 57.33’ W
137
< 1 min per depth
022
003
10/06
12:10:43
49° 25.80’ N
008° 59.68’ W
161
< 1 min per depth
023
003
10/06
22:00:34
49° 25.58’ N
009° 00.72’ W
134
< 1 min per depth
024
003
11/06
09:54:30
49° 24.60’ N
008° 58.25’ W
142
< 1 min per depth
025
003
11/06
19:48:30
49° 25.80’ N
009° 00.30’ W
134
2 mins per depth
***
026
003
12/06
02:18:21
49° 24.80’ N
008° 58.32’ W
143
< 1 min per depth
027
003
12/06
04:24:31
49° 24.07’ N
008° 58.32’ W
143
2 mins per depth
D352 cruise report / 56
***
028
003
12/06
05:49:36
49° 24.34’ N
008° 57.58’ W
132.5
> 2 mins per depth
***
029
003
13/06
02:24:51
49° 06.96’ N
009° 27.39’ W
159
< 1 min per depth
030
004
13/06
11:30:34
49° 03.48’ N
009° 28.92’ W
159.5
MODE 5, increased WN to 80 , 2 mins
***
031
004
13/06
22:03:40
49° 07.07’ N
009° 29.07’ W
159.5
< 1 min per depth
LADCP Uncontrolled Casts Depths
Cast #
z(1)
z(2)
z(3)
z(4)
z(5)
z(6)
z(7)
z(8)
z(9)
z(10)
z(11)
z(12)
z(13)
004
7.2
117.3
005
127.4
102.3
82.4
62.2
52.2
41.9
37.8
32.76
26.8
21.6
16.5
11.4
4.3
006
128.2
68.2
63.1
57.8
53.2
50.8
48.8
46.78
44.8
42.8
40.7
35.2
22.2
007
127.7
52.5
50.2
48.3
46.3
44.2
42.2
40.35
39.3
36.9
21.6
16.7
3.5
008
132.3
72.3
42.0
38.8
009
61.1
51.4
48.2
45.2
42.1
5.7
012
111.8
36.7
6.3
013
122.1
92.2
71.8
51.9
45.1
42.4
40.9
37.67
31.4
21.3
6.4
014
122.8
93.0
73.1
53.3
37.9
23.0
7.7
015
121.8
92.3
72.8
47.3
7.2
016
122.6
93.0
73.4
53.1
39.9
22.7
7.5
017
122.4
57.2
49.2
45.1
43.2
42.2
31.7
16.11
3.3
018
62.7
39.9
3.1
019
122.0
91.8
72.0
41.3
21.1
020
133.2
123.0
7.6
021
124.1
93.7
73.8
53.6
38.1
23.1
8.2
022
122.8
93.2
72.9
53.1
45.9
40.6
35.9
z(14)
3.7
7.5
D352 cruise report / 57
023
123.9
94.4
74.2
54.1
49.0
39.0
33.6
23.7
8.9
024
122.8
93.6
73.4
53.0
43.1
37.8
32.8
22.5
7.6
025
122.4
92.7
72.4
52.2
47.2
42.2
36.9
22.0
6.9
026
122.9
92.8
72.6
52.5
47.4
44.7
42.6
37.0
22.1
7.0
027
45.5
38.5
028
37.1
029
153.3
67.8
52.7
47.7
44.8
42.9
40.9
38.5
27.4
17.3
030
73.2
43.2
35.9
4.4
031
142.6
93.9
74.1
53.6
48.4
38.2
23.1
8.3
4.3
LADCP Dedicated Casts 14 June 2010
Cast #
Cfg File #
Date
Time
Latitude
Longitude
Depth
Comments
1200 kHz ADCP
032
004
14/06
08:07:15
49° 06.25’ N
009° 29.63’ W
161
Mode 5, 80 × 5cm bins
033
005
14/06
10:04:41
49° 06.22’ N
009° 25.73’ W
157
Mode 5, 45 × 10cm bins
034
006
14/06
11:24:28
49° 06.52’ N
009° 27.21’ W
157
Mode 11, 40 × 10cm bins
035
001
14/06
12:58:51
49° 06.93 N
009° 28.46’ W
158.5
Mode 5, 80 × 10cm bins
036
002
14/06
14:33:07
49° 07.57’ N
009° 28.10’ W
158.5
Mode 12, 80 × 10cm bins, 6 subpings
037
003
14/06
15:59:43
49° 07.89’ N
009° 27.68’ W
161
Mode 11, 80 × 10cm bins
600khz ADCP
LADCP Dedicated Cast Depths
Cast #
z(1)
z(2)
z(3)
z(4)
z(5)
z(6)
1200 kHz ADCP
D352 cruise report / 58
032
141.4
101.4
51.5
42.2
22.3
033
141.6
103.3
52.9
43.0
22.8
034
140.9
102.8
52.6
42.6
22.3
035
98.9
73.8
51.3
41.8
24.0
036
97.6
74.5
51.9
35.3
24.5
037
97.3
74.1
51.6
37.7
24.3
600 kHz ADCP
14.8
D352 cruise report / 59
ADCP Configuration Files
1200 kHz RDI Workhorse Sentinel
File: ctd_adcp1200_cfg_001.txt
CR1
CF11101
EA0
EB0
ED0
ES35
EX00000
EZ1111101
TE00:00:00.00
TP00:00.00
WA50
WB0
WC64
WD111100000
WF46
WM5
WN70
WP2
WS5
WZ5
RNCTDCS
RI1
CK
CS
;
;Instrument
= Workhorse Sentinel
;Frequency
= 1228800
;Water Profile
= YES
;Bottom Track
= NO
;High Res. Modes = YES
;High Rate Pinging = NO
;Shallow Bottom Mode= NO
;Wave Gauge
= NO
;Lowered ADCP
= NO
;Beam angle
= 20
;Temperature
= 8.00
;Deployment hours = 24.00
;Battery packs
=1
;Automatic TP
= YES
;Memory size [MB] = 1024
;Saved Screen
=2
;
;Consequences generated by PlanADCP version 2.02:
;First cell range = 0.50 m
;Last cell range = 3.95 m
;Max range
= 3.50 m
;Standard deviation = 0.43 cm/s
;Ensemble size
= 1548 bytes
;Storage required = 201.82 MB (211625532 bytes)
;Power usage
= 78.61 Wh
;Battery usage
= 0.2
;
; WARNINGS AND CAUTIONS:
; The number of pings is too low for reasonable sampling of the currents.
; The ensemble interval 00:00:00.64 is used for calculations.
; Advanced settings has been changed.
; Expert settings has been changed.
File: ctd_adcp1200_cfg_002.txt
CR1
CF11101
EA0
EB0
D352 cruise report / 60
ED0
ES35
EX00000
EZ1111101
TE00:00:00.00
TP00:00.00
WA50
WB0
WC64
WD111100000
WF170
WM12
WN45
WP1
WS10
WO6,5
WV80
WZ5
RNCTDCS
RI1
CK
CS
;
;Instrument
= Workhorse Sentinel
;Frequency
= 1228800
;Water Profile
= YES
;Bottom Track
= NO
;High Res. Modes = YES
;High Rate Pinging = YES
;Shallow Bottom Mode= NO
;Wave Gauge
= NO
;Lowered ADCP
= NO
;Beam angle
= 20
;Temperature
= 11.00
;Deployment hours = 24.00
;Battery packs
=1
;Automatic TP
= YES
;Memory size [MB] = 1024
;Saved Screen
=2
;
;Consequences generated by PlanADCP version 2.02:
;First cell range = 2.06 m
;Last cell range = 6.46 m
;Max range
= 12.93 m
;Standard deviation = 5.88 cm/s
;Ensemble size
= 1048 bytes
;Storage required = 173.75 MB (182187464 bytes)
;Power usage
= 71.65 Wh
;Battery usage
= 0.2
;
; WARNINGS AND CAUTIONS:
; The number of pings is too low for reasonable sampling of the currents.
; The ensemble interval 00:00:00.50 is used for calculations.
; Advanced settings has been changed.
; Expert settings has been changed.
File: ctd_adcp1200_cfg_003.txt
CR1
CF11101
EA0
EB0
ED0
ES35
EX00000
EZ1111101
TE00:00:00.00
TP00:00.00
WA50
WB0
WC64
D352 cruise report / 61
WD111100000
WF170
WM12
WN45
WP1
WS10
WO20,5
WV150
WZ5
RNCTDCS
RI1
CK
CS
;
;Instrument
= Workhorse Sentinel
;Frequency
= 1228800
;Water Profile
= YES
;Bottom Track
= NO
;High Res. Modes = YES
;High Rate Pinging = YES
;Shallow Bottom Mode= NO
;Wave Gauge
= NO
;Lowered ADCP
= NO
;Beam angle
= 20
;Temperature
= 11.00
;Deployment hours = 24.00
;Battery packs
=1
;Automatic TP
= YES
;Memory size [MB] = 1024
;Saved Screen
=2
;
;Consequences generated by PlanADCP version 2.02:
;First cell range = 1.93 m
;Last cell range = 6.33 m
;Max range
= 11.90 m
;Standard deviation = 6.04 cm/s
;Ensemble size
= 1048 bytes
;Storage required = 67.04 MB (70300888 bytes)
;Power usage
= 61.02 Wh
;Battery usage
= 0.1
;
; WARNINGS AND CAUTIONS:
; The number of pings is too low for reasonable sampling of the currents.
; The ensemble interval 00:00:01.29 is used for calculations.
; Advanced settings has been changed.
; Expert settings has been changed.
File: ctd_adcp1200_cfg_004.txt
CR1
CF11101
EA0
EB0
ED0
ES35
EX00000
EZ1111101
TE00:00:00.00
TP00:00.00
WA50
WB0
WC64
WD111100000
WF46
WM5
WN80
WP2
WS5
WZ5
RNCTDCS
RI1
D352 cruise report / 62
CK
CS
;
;Instrument
= Workhorse Sentinel
;Frequency
= 1228800
;Water Profile
= YES
;Bottom Track
= NO
;High Res. Modes = YES
;High Rate Pinging = NO
;Shallow Bottom Mode= NO
;Wave Gauge
= NO
;Lowered ADCP
= NO
;Beam angle
= 20
;Temperature
= 8.00
;Deployment hours = 24.00
;Battery packs
=1
;Automatic TP
= YES
;Memory size [MB] = 1024
;Saved Screen
=2
;
;Consequences generated by PlanADCP version 2.02:
;First cell range = 0.50 m
;Last cell range = 4.45 m
;Max range
= 3.50 m
;Standard deviation = 0.43 cm/s
;Ensemble size
= 1748 bytes
;Storage required = 209.04 MB (219197452 bytes)
;Power usage
= 76.46 Wh
;Battery usage
= 0.2
;
; WARNINGS AND CAUTIONS:
; The number of pings is too low for reasonable sampling of the currents.
; The ensemble interval 00:00:00.69 is used for calculations.
; Advanced settings has been changed.
; Expert settings has been changed.
File: ctd_adcp1200_cfg_005.txt
CR1
CF11101
EA0
EB0
ED0
ES35
EX00000
EZ1111101
TE00:00:00.00
TP00:00.00
WA50
WB0
WC64
WD111100000
WF46
WM5
WN45
WP1
WS10
WZ5
RNCTDCS
RI1
CK
CS
;
;Instrument
= Workhorse Sentinel
;Frequency
= 1228800
;Water Profile
= YES
;Bottom Track
= NO
;High Res. Modes = YES
;High Rate Pinging = NO
;Shallow Bottom Mode= NO
;Wave Gauge
= NO
D352 cruise report / 63
;Lowered ADCP
= NO
;Beam angle
= 20
;Temperature
= 8.00
;Deployment hours = 24.00
;Battery packs
=1
;Automatic TP
= YES
;Memory size [MB] = 1024
;Saved Screen
=2
;
;Consequences generated by PlanADCP version 2.02:
;First cell range = 0.55 m
;Last cell range = 4.95 m
;Max range
= 3.50 m
;Standard deviation = 0.44 cm/s
;Ensemble size
= 1048 bytes
;Storage required = 349.61 MB (366588304 bytes)
;Power usage
= 86.69 Wh
;Battery usage
= 0.2
;
; WARNINGS AND CAUTIONS:
; The number of pings is too low for reasonable sampling of the currents.
; The ensemble interval 00:00:00.25 is used for calculations.
; Advanced settings has been changed.
; Expert settings has been changed.
File: ctd_adcp1200_cfg_006.txt
CR1
CF11101
EA0
EB0
ED0
ES35
EX00000
EZ1111101
TE00:00:00.00
TP00:00.00
WA50
WB0
WC64
WD111100000
WF46
WM11
WN40
WP3
WS10
WZ5
RNCTDCS
RI1
CK
CS
;
;Instrument
= Workhorse Sentinel
;Frequency
= 1228800
;Water Profile
= YES
;Bottom Track
= NO
;High Res. Modes = YES
;High Rate Pinging = NO
;Shallow Bottom Mode= NO
;Wave Gauge
= NO
;Lowered ADCP
= NO
;Beam angle
= 20
;Temperature
= 8.00
;Deployment hours = 24.00
;Battery packs
=1
;Automatic TP
= YES
;Memory size [MB] = 1024
;Saved Screen
=2
;
;Consequences generated by PlanADCP version 2.02:
;First cell range = 0.55 m
D352 cruise report / 64
;Last cell range = 4.45 m
;Max range
= 3.50 m
;Standard deviation = 0.57 cm/s
;Ensemble size
= 948 bytes
;Storage required = 154.99 MB (162514692 bytes)
;Power usage
= 100.96 Wh
;Battery usage
= 0.2
;
; WARNINGS AND CAUTIONS:
; The number of pings is too low for reasonable sampling of the currents.
; The ensemble interval 00:00:00.51 is used for calculations.
; Advanced settings has been changed.
; Expert settings has been changed.
600 kHz RDI Workhorse Sentinel
File: ctd_adcp600_cfg_001.txt
CR1
CF11101
EA0
EB0
ED0
ES35
EX11111
EZ1111111
WA50
WB0
WD111100000
WF88
WM5
WN80
WP2
WS10
WV175
WZ5
TE00:00:00.00
TP00:00.00
CK
CS
;
;Instrument
= Workhorse Sentinel
;Frequency
= 614400
;Water Profile
= YES
;Bottom Track
= NO
;High Res. Modes = YES
;High Rate Pinging = YES
;Shallow Bottom Mode= NO
;Wave Gauge
= NO
;Lowered ADCP
= NO
;Beam angle
= 20
;Temperature
= 5.00
;Deployment hours = 24.00
;Battery packs
=1
;Automatic TP
= YES
;Memory size [MB] = 16
;Saved Screen
=2
;
;Consequences generated by PlanADCP version 2.02:
;First cell range = 0.97 m
;Last cell range = 8.87 m
;Max range
= 7.50 m
;Standard deviation = 0.43 cm/s
;Ensemble size
= 1748 bytes
;Storage required = 180.04 MB (188784000 bytes)
;Power usage
= 73.40 Wh
;Battery usage
= 0.2
;
; WARNINGS AND CAUTIONS:
; There is not enough memory for the deployment. (Memory of 16 MB will last < 1 days).
D352 cruise report / 65
; The number of pings is too low for reasonable sampling of the currents.
; The ensemble interval 00:00:00.80 is used for calculations.
; Advanced settings has been changed.
File: ctd_adcp600_cfg_002.txt
CR1
CF11101
EA0
EB0
ED0
ES35
EX11111
EZ1111111
WA50
WB0
WD111100000
WF88
WM12
WN80
WP1
WS10
WO6,6
WV175
WZ5
TE00:00:00.00
TP00:00.00
CK
CS
;
;Instrument
= Workhorse Sentinel
;Frequency
= 614400
;Water Profile
= YES
;Bottom Track
= NO
;High Res. Modes = YES
;High Rate Pinging = YES
;Shallow Bottom Mode= NO
;Wave Gauge
= NO
;Lowered ADCP
= NO
;Beam angle
= 20
;Temperature
= 5.00
;Deployment hours = 24.00
;Battery packs
=1
;Automatic TP
= YES
;Memory size [MB] = 16
;Saved Screen
=3
;
;Consequences generated by PlanADCP version 2.02:
;First cell range = 1.20 m
;Last cell range = 9.10 m
;Max range
= 33.15 m
;Standard deviation = 18.21 cm/s
;Ensemble size
= 1748 bytes
;Storage required = 197.84 MB (207454388 bytes)
;Power usage
= 67.62 Wh
;Battery usage
= 0.2
;
; WARNINGS AND CAUTIONS:
; There is not enough memory for the deployment. (Memory of 16 MB will last < 1 days).
; The number of pings is too low for reasonable sampling of the currents.
; The ensemble interval 00:00:00.73 is used for calculations.
; Advanced settings has been changed.
File: ctd_adcp600_cfg_003.txt
CR1
CF11101
EA0
EB0
ED0
ES35
EX11111
D352 cruise report / 66
EZ1111111
WA50
WB0
WD111100000
WF88
WM11
WN80
WP2
WS10
WO6,6
WV80
WZ5
TE00:00:00.00
TP00:00.00
CK
CS
;
;Instrument
= Workhorse Sentinel
;Frequency
= 614400
;Water Profile
= YES
;Bottom Track
= NO
;High Res. Modes = YES
;High Rate Pinging = YES
;Shallow Bottom Mode= NO
;Wave Gauge
= NO
;Lowered ADCP
= NO
;Beam angle
= 20
;Temperature
= 10.00
;Deployment hours = 24.00
;Battery packs
=1
;Automatic TP
= YES
;Memory size [MB] = 16
;Saved Screen
=2
;
;Consequences generated by PlanADCP version 2.02:
;First cell range = 0.97 m
;Last cell range = 8.87 m
;Max range
= 7.50 m
;Standard deviation = 0.93 cm/s
;Ensemble size
= 1748 bytes
;Storage required = 265.74 MB (278648680 bytes)
;Power usage
= 83.17 Wh
;Battery usage
= 0.2
;
; WARNINGS AND CAUTIONS:
; There is not enough memory for the deployment. (Memory of 16 MB will last < 1 days).
; The number of pings is too low for reasonable sampling of the currents.
; The ensemble interval 00:00:00.55 is used for calculations.
; Advanced settings has been changed.
D352 cruise report / 67
9. Temperature-Chlorophyll Chain (Mike Smithson)
Introduction
The temperature-chlorophyll (T-Chl) chain consists of a series of self-contained internally-recording
fluorometers and temperature loggers attached to a 10mm diameter galvanised steel wire. The chain is
designed to be towed through the water at speeds up to 4kt. A 380kg lead sphere shackled to the bottom
end of the wire acts as a depressor to prevent the line of instruments from streaming out behind the ship.
Copper ferrules crimped onto the wire at 1m intervals are used as mounting points to attach the
instruments. Specially designed clamps allow for quick attachment and release of instruments at these
mounting points.
The fluorometers used were Wetlabs FLB self-logging, internally-powered fluorometers. Two types of
temperature logger were used, both manufactured by Star-Oddi. Mounted at the same position on the wire
as the fluorometers were Star-Oddi Centi-TD temperature and depth loggers. At the other positions were
Star-Oddi Starmon-mini temperature loggers. Tables 1, 2 and 3 give the details and specifications of each
instrument type.
Deployment details
Three deployments were carried out during the cruise using the port-side Schatt davit and winch, both
towed at ~4kts and simultaneously with the VMP profiles and CTD casts. Details of each deployment are
given in Tables 4, 5 and 6. Instrument positions are counted from the deepest ferrule (i.e. the first
instrument attached to the wire during deployment). Depths are nominal values and true depths should be
determined after careful analysis of the pressure sensor data.
Data were downloaded from all instruments after each deployment using the proprietary software supplied
by the instrument manufacturers. Star-Oddi temperature calibrations are stored in each instrument and are
applied automatically when the data is downloaded. No further processing is required. Calibrations for the
fluorometers are applied individually to the raw data after downloading. The calibrations are linear across
the range of the instrument and the coefficients are just a simple “dark-count” offset and scale factor. These
are given in Table 1. Data return for the three deployments was 100%.
Depth data from the Star-Oddi depth sensors show an offset prior to and post deployment. This has been
noticed before and is exacerbated by the clamping of the sensors. Experience has shown that subtracting a
mean of the prior and post values of the offset from the depth data gives a “true” depth value.
For the third deployment fluorometers 1512 and 1513 show periods where the sample interval has jumped
from 60 to 61 seconds. Given that there is zero clock drift for these instruments for the duration of the
D352 cruise report / 68
deployment it is likely that this is a real increase in sampling interval rather than a “jump” in the internal
clock.
A note on clock settings and timings is important here. All instruments have their internal clocks set with
respect to the ship’s GPS clock. The timings of these are given in Tables 5, 6 and 7. The temperature
loggers are programmed to start at a later time and will do so according to their internal clocks. For
example, a programmed and internally recorded start time of 09:00:00 may in fact be a few seconds earlier
or later depending how much drift has occurred up to that time. The difference between the internally
recorded time and GPS time for the last sample is likely to be larger because of continuing clock drift for the
duration of the deployment. The fluorometers, however, need to be treated differently. They cannot be
programmed for a later start time and are started manually (this in itself can lead to some inaccuracy in the
start time). If the instrument is started manually at 09:00:00 (GPS time) the internally recorded start time
may be earlier or later than this because of internal clock drift up to that time. These differences between
“real” time and recorded times may or may not be important depending on the magnitude of the clock drift
and the frequency of events being studied.
Serial
number
Calibration date
Calibration coefficients
Offset
Scale factor
775
28-Jun-2007
91
0.0073
776
28-Jun-2007
69
0.0077
777
28-Jun-2007
67
0.0078
778
28-Jun-2007
78
0.0076
779
28-Jun-2007
78
0.0076
780
09-Jul-2007
73
0.0077
907
14-Feb-2008
83
0.0076
937
14-Feb-2008
80
0.0078
939
14-Feb-2008
78
0.0077
*1512
5-Aug-2009
50
0.0077
*1513
5-Aug-2009
49
0.0077
*1514
5-Aug-2009
50
0.0077
1712
21-Jan-2010
53
0.0077
Excitation: λ=470nm
Emission: λ=695nm
Sensitivity: 0.01μg l
-1
Range: 0.01 to 125μg l
-1
Table 1. Details and specifications of Wetlabs FLB chlorophyll fluorometers. *Fitted with biowiper.
D352 cruise report / 69
Serial
Calibration
Depth range
number
date
(m)
3268
29-Jun-2007
100
3269
29-Jun-2007
100
3270
29-Jun-2007
100
3271
29-Jun-2007
100
3272
29-Jun-2007
100
3273
29-Jun-2007
100
3275
29-Jun-2007
100
3276
29-Jun-2007
100
3278
29-Jun-2007
100
3653
17-Mar-2008
240
3655
17-Mar-2008
240
3661
18-Mar-2008
240
*
06-Nov-2007
100
683
Temperature:
Accuracy: ±0.1ºC;
Resolution: 0.032ºC
Range: –1ºC to +40ºC
Time constant: 20s
Depth:
Accuracy: ±0.4m
Resolution: 0.03m
Table 2. Details and specifications of Star-Oddi Centi-TD temperature loggers.
*
Centi-PR – has pitch and roll sensors in addition to temperature and pressure.
Serial
Calibration
Serial
Calibration
number
date
number
date
2604
30-May-2007
3579
28-Dec-2009
Accuracy: ±0.05ºC
2607
30-May-2007
3580
28-Dec-2009
Resolution: 0.013ºC
2622
29-Jun-2007
3581
28-Dec-2009
Range: –2ºC to +40ºC
2846
20-Mar-2008
3582
28-Dec-2009
Time constant:
2850
20-Mar-2008
3583
28-Dec-2009
s/n 2604 – 2850: 18s
3576
28-Dec-2009
3584
28-Dec-2009
s/n 3576 – 3585: 6s
3577
28-Dec-2009
3585
28-Dec-2009
3578
28-Dec-2009
Table 3. Details and specifications of Star-Oddi Starmon-mini temperature loggers. Loggers with serial
numbers from 3576 to 3585 are titanium-cased with a depth rating of 11,000m and faster response. The
others have plastic cases and are rated to 400m.
Nominal
Position
Instrument
Serial
depth (m)
on wire
type
Number
5
60
TS
3579
7
58
TS
3580
9
56
TS
3583
Clock set
Date
5-
Time
17:48:36
Jun
5-
Date
6Jun
17:46:44
Jun
5-
First sample
6Jun
17:43:55
6-
Time
09:00:00
09:00:00
09:00:00
Last sample
Date
9Jun
9Jun
9-
Time
Clock
drift (s)
12:08:15
–6
13:06:45
+1
12:56:30
+2
D352 cruise report / 70
Jun
11
54
TS
3581
13
52
TS
3585
15
50
TS
3576
17
48
TS
3577
19
46
TS
3584
21
44
TS
3582
23
42
F
17:42:44
Jun
17:41:42
Jun
17:38:07
Jun
17:37:08
Jun
40
TS
3578
30
35
TS
2619
35
30
5-
17:36:03
Jun
17:34:24
Jun
Jun
2622
50
15
TS
2604
55
10
TS
2608
60
5
09:00:00
09:00:00
Jun
9Jun
9Jun
9Jun
9Jun
–5
13:17:45
+1
12:40:30
–1
12:13:30
–4
13:13:30
–3
12:00:00
–2
Jun
09:50:02
Jun
10:02:17
+17
6-
09:00:00
9-
11:10:30
–7
9-
11:52:00
–1
08:56:15
+2
Jun
5-
17:32:27
Jun
6Jun
5-
17:54:41
Jun
6Jun
Jun
09:00:00
09:00:00
9Jun
9Jun
6-
07:23:54
6-
09:47:02
9-
18:03:48
Jun
09:00:00
Jun
TS
09:00:00
9-
13:01:30
18:09:15
5-
5-
20
09:00:00
Jun
Jun
Jun
45
09:00:00
9-
6-
775
2607
09:00:00
07:27:48
3270
TS
6-
Jun
6-
F
25
6Jun
5-
T100
40
6Jun
Jun
25
6Jun
5-
683
6Jun
5-
*
6Jun
5-
780
T100
Jun
5-
5-
17:51:35
Jun
Jun
09:19:47
+18
6-
9-
08:22:15
–5
Jun
Jun
08:44:15
0
11:56:00
–4
11:46:45
–3
12:04:45
+1
6Jun
5-
17:50:26
Jun
6Jun
5-
17:52:45
Jun
6Jun
5-
17:53:36
Jun
6Jun
09:00:00
09:00:00
09:00:00
09:00:00
9Jun
9Jun
9Jun
9Jun
6-
07:26:13
6-
09:49:02
9-
18:04:40
Jun
09:00:00
F
776
Jun
Jun
09:47:17
+16
T100
3268
5-
6-
9-
11:31:45
–3
Jun
Jun
Jun
Table 4: T-Chl chain deployment 1. All data were logged at 15s intervals. All times are GMT. Instrument
types are indicated by: F – Wetlabs FLB fluorometer; TS – Star-Oddi Starmon-mini temperature logger; T100
– Star-Oddi Centi-TD temperature logger with 100m pressure sensor. See note on timings in Deployment
Details section. *Centi-PR – has pitch and roll sensors in addition to temperature and pressure.
Nominal
Position
Instrument
Serial
depth (m)
on wire
type
Number
5
60
TS
3579
10
55
TS
3580
14
51
TS
3583
17
48
TS
3581
Clock set
Date
13-Jun
Time
First sample
Date
Time
Last sample
Date
Time
Clock
drift (s)
17:37:39
13-Jun
22:00:00
15-Jun
12:41:00
–1
13-Jun
17:38:47
13-Jun
22:00:00
15-Jun
12:28:00
+2
13-Jun
17:40:22
13-Jun
22:00:00
15-Jun
12:19:00
+3
17:42:03
13-Jun
22:00:00
15-Jun
12:23:30
–1
13-Jun
D352 cruise report / 71
20
45
TS
3585
13-Jun
17:44:06
13-Jun
22:00:00
15-Jun
12:04:30
+1
23
42
TS
3576
13-Jun
17:45:39
13-Jun
22:00:00
15-Jun
12:15:45
0
26
39
29
36
32
33
35
38
F
780
13-Jun
21:18:34
13-Jun
21:21:01
14-Jun
17:30:16
+4
*
683
13-Jun
18:03:27
13-Jun
22:00:00
15-Jun
11:36:45
–5
TS
3577
13-Jun
17:47:14
22:00:00
15-Jun
12:46:30
–2
TS
3584
13-Jun
17:49:03
13-Jun
22:00:00
15-Jun
12:11:15
+1
30
TS
3582
13-Jun
17:50:39
13-Jun
22:00:00
15-Jun
12:00:15
–1
27
TS
3578
13-Jun
17:52:24
13-Jun
22:00:00
15-Jun
12:31:30
+1
F
775
13-Jun
21:23:01
13-Jun
21:25:01
14-Jun
17:46:31
+4
T100
13-Jun
41
24
T100
3270
13-Jun
18:05:55
13-Jun
22:00:00
15-Jun
11:12:00
–2
44
21
TS
2619
13-Jun
17:53:48
13-Jun
22:00:00
15-Jun
12:58:45
+4
47
18
TS
2607
13-Jun
17:55:01
13-Jun
22:00:00
15-Jun
13:06:30
0
50
15
TS
2622
13-Jun
17:56:10
13-Jun
22:00:00
15-Jun
13:03:00
–3
53
12
TS
2604
13-Jun
17:57:28
13-Jun
22:00:00
15-Jun
12:54:30
–1
56
9
TS
2608
13-Jun
17:58:39
13-Jun
22:00:00
15-Jun
12:50:30
+1
60
5
F
776
13-Jun
21:26:43
13-Jun
21:29:01
14-Jun
18:06:01
+4
T100
3268
13-Jun
18:07:21
13-Jun
22:00:00
15-Jun
11:25:45
–2
Table 5: T-Chl chain deployment 2. All data were logged at 15s intervals. All times are GMT. Instrument
types are indicated by: F – Wetlabs FLB fluorometer; TS – Star-Oddi Starmon-mini temperature logger; T100
– Star-Oddi Centi-TD temperature logger with 100m pressure sensor. See not on timings in Deployment
Details section. *Centi-PR – has pitch and roll sensors in addition to temperature and pressure.
Position
Instrument
Serial
depth (m)
on wire
type
Number
–
TS
2846
20-Jun
14:27:36
20-Jun
16:00:00
21-Jun
12:07:15
–
T240
3653
20-Jun
14:12:06
20-Jun
16:00:00
21-Jun
10:05:00
–2
TS
2850
20-Jun
14:24:57
20-Jun
16:00:00
21-Jun
12:16:30
+2
T240
3655
20-Jun
14:18:27
20-Jun
16:00:00
21-Jun
10:12:15
–1
F
1712
20-Jun
15:12:37
20-Jun
15:16:02
21-Jun
07:15:02
0
T240
3268
20-Jun
13:50:01
20-Jun
16:00:00
21-Jun
10:19:45
–1
TS
2607
20-Jun
15:02:08
20-Jun
16:00:00
21-Jun
12:21:00
0
F
780
20-Jun
15:58:38
20-Jun
16:00:01
21-Jun
07:39:46
+3
2
7
–
12
59
15
56
18
53
21
50
24
47
26
45
28
43
30
41
32
39
34
37
Clock set
Date
Time
First sample
Date
Time
Last sample
Nominal
Date
Time
Clock
drift (s)
+1
T100
3270
20-Jun
13:54:43
20-Jun
16:00:00
21-Jun
10:48:45
–1
TS
3580
20-Jun
14:59:44
20-Jun
16:00:00
21-Jun
12:28:15
+1
F
778
20-Jun
15:23:05
20-Jun
15:25:02
21-Jun
07:58:47
+3
T100
3273
20-Jun
13:56:15
20-Jun
16:00:00
21-Jun
10:57:15
–5
TS
3581
20-Jun
14:56:28
16:00:00
21-Jun
12:32:30
+1
F
937
20-Jun
15:28:19
20-Jun
15:30:01
21-Jun
08:14:01
0
20-Jun
T100
3276
20-Jun
13:58:09
20-Jun
16:00:00
21-Jun
11:04:00
–2
TS
3583
20-Jun
14:54:30
20-Jun
16:00:00
21-Jun
12:36:45
+1
F
779
20-Jun
15:32:03
20-Jun
15:33:02
21-Jun
08:30:32
+3
T100
3278
20-Jun
13:59:55
20-Jun
16:00:00
21-Jun
11:10:00
–4
TS
3576
20-Jun
14:52:28
20-Jun
16:00:00
21-Jun
12:42:45
0
F
907
20-Jun
15:35:44
20-Jun
15:37:01
21-Jun
08:40:46
+1
T100
3275
20-Jun
14:01:16
20-Jun
16:00:00
21-Jun
11:17:30
–3
36
35
38
33
TS
3584
20-Jun
14:50:08
20-Jun
16:00:00
21-Jun
12:47:30
+1
40
31
F
1512
20-Jun
15:40:03
20-Jun
15:43:02
21-Jun
08:54:21
0
D352 cruise report / 72
42
29
44
27
46
25
T100
3269
20-Jun
14:04:22
20-Jun
16:00:00
21-Jun
11:24:00
–3
TS
3578
20-Jun
14:48:25
20-Jun
16:00:00
21-Jun
12:51:30
–1
F
1513
20-Jun
15:45:54
20-Jun
15:48:02
21-Jun
09:08:50
0
T100
3271
20-Jun
14:05:55
20-Jun
16:00:00
21-Jun
11:31:00
–3
TS
3585
20-Jun
14:45:12
20-Jun
16:00:00
21-Jun
12:55:15
+2
F
1514
20-Jun
15:49:40
20-Jun
15:51:02
21-Jun
09:18:47
–1
48
23
T100
3272
20-Jun
14:08:00
20-Jun
16:00:00
21-Jun
11:37:15
–5
50
21
TS
3579
20-Jun
14:42:40
20-Jun
16:00:00
21-Jun
12:59:15
0
53
18
TS
3582
20-Jun
14:40:22
20-Jun
16:00:00
21-Jun
13:03:00
+1
56
15
TS
2622
20-Jun
14:38:11
20-Jun
16:00:00
21-Jun
13:06:45
–2
F
777
20-Jun
15:54:33
20-Jun
15:56:00
21-Jun
09:34:00
+3
59
12
T100
683
20-Jun
14:21:57
20-Jun
16:00:00
21-Jun
11:43:30
–5
62
9
TS
3577
20-Jun
14:36:19
20-Jun
16:00:00
21-Jun
13:10:30
0
65
6
TS
2604
20-Jun
14:33:48
20-Jun
16:00:00
21-Jun
13:14:30
0
F
938
20-Jun
16:03:45
20-Jun
16:05:00
21-Jun
09:43:30
–1
T240
3661
20-Jun
14:09:46
20-Jun
16:00:00
21-Jun
11:52:00
0
70
1
Table 6: T-Chl chain deployment 3. All data were logged at 15s intervals. All times are GMT. Instrument
types are indicated by: F – Wetlabs FLB fluorometer; TS – Star-Oddi Starmon-mini temperature logger; TPPP
– Star-Oddi Centi-TD temperature and depth logger, suffix indicates the depth rating of the pressure
sensor. See note on timings in Deployment Details section. *Centi-PR – has pitch and roll sensors in
addition to temperature and pressure.
D352 cruise report / 73
10. Moorings
(Mike Smithson, NOC)
Introduction
Instruments were deployed at four mooring sites, one in the western Irish Sea (WIS), and three in the Celtic
Sea (IM1, IM2, IM3). WIS had two components: a line of temperature loggers up to a surface toroid fitted
with two independent meteorological packages; a seabed lander fitted with a 300kHz RDI Workhorse
ADCP and a 150kHz RDI narrowband ADCP. IM1 had three components: a line of temperature loggers,
fluorometers, CTDs and two McLane RAS water samplers up to a surface toroid fitted with a meteorological
package; a seabed lander fitted with a 150kHz FlowQuest ADCP; a subsurface 600kHz RDI Workhorse
ADCP. IM2 had two components: a line of temperature loggers and CTDs up to a surface toroid fitted with
a meteorological package; a seabed lander fitted with a 300kHz RDI Workhorse ADCP. IM3 had two
components: a line of temperature loggers and CTDs up to a surface toroid fitted with a meteorological
package; a seabed lander fitted with a 150kHz RDI narrowband ADCP. In addition, guard buoys were
deployed at two of the mooring sites, two at IM1 and one at IM3.
Toroid moorings
Irish Sea mooring
This mooring will be recovered on a subsequent cruise and will be described elsewhere.
Celtic Sea moorings
The three Celtic Sea moorings were of the same basic design. Each was a single-point mooring with a 1
tonne anchor, acoustic release and surface toroid with navigation light and radar reflector. The mooring line
was divided into two sections, an upper section 55m in length held vertical by a 150kg weight and a lower
section whose length was determined by the water depth at the mooring position and held vertical by a 1m
diameter steel buoyancy sphere. Short sections of wire could be removed or added to the lower section to
suit the depth at each site. The upper and lower sections were decoupled by two 25m sections of rope, one
polyester attached to the bottom of the upper section, the other polypropylene attached to the top of the
lower section. In terms of instrumentation IM1 was the most complex mooring. The upper section consisted
of a Seabird MicroCAT top and bottom, a series of Wetlabs FLB fluorometers and Star-Oddi temperature
loggers at intermediate depths, a McLane RAS100 water sampler in the surface mixed layer at ~20m depth
and a McLane RAS500 water sampler in the chlorophyll maximum at the bottom of the thermocline (depth
determined by CTD immediately prior to mooring deployment). The lower section consisted of a series of
Star-Oddi temperature loggers with a Seabird CTD at the bottom, immediately above the acoustic release.
IM2 and IM3 had Seabird MicroCATs immediately below the surface toroid and above the acoustic release
with a series of Star-Oddi temperature loggers between. The toroid at each site was fitted with a package of
meteorological sensors and a data logger. The moorings were deployed toroid first, with instruments,
D352 cruise report / 74
buoyancy etc being attached as the mooring line was payed out, stopping off as necessary to wind
subsequent sections of mooring line onto the winch. The slow speed of the winch was frustrating at times
but did not hinder the proper execution of the mooring operations. One issue was the necessity for the RAS
water samplers to be upside down for part of the time during deployment. This needs some thought for
future deployments. Mooring diagrams are given in Figs 1, 2 and 3. Details of instrumentation are given in
Tables 1, 2, 3 and 4. Three Star-Oddi temperature loggers were lost during the recovery operations, these
are indicated in the relevant table.
Data were downloaded from all instruments after recovery. Star-Oddi temperature calibrations are stored in
each instrument and are applied automatically when the data is downloaded, no further processing is
required. Calibrations for the fluorometers are applied individually to the raw data after downloading. The
calibrations are linear across the range of the instrument and the coefficients are just a simple “dark-count”
offset and scale factor. These are given in Table 1. Start and stop times, instrument clock drift etc. are
given in Tables 5, 6 and 7 (see below on clock settings and timings).
Depth data from the Star-Oddi depth sensors show an offset prior to and post deployment and this needs
to be taken into account when processing the data. For IM1, fluorometers 1512 and 1513 show periods
where the sample interval has jumped from 60 to 61 seconds. Given that the clock drifts for these
instruments for the duration of the deployment are –3 and +12 seconds respectively it is likely that this is a
real increase in sampling interval rather than a “jump” in the internal clock.
A note on clock settings and timings is important here. All instruments have their internal clocks set with
respect to the ship’s GPS clock. The timings of these are given in Tables 5, 6 and 7. The temperature
loggers are programmed to start at a later time and will do so according to their internal clocks. For
example, a programmed and internally recorded start time of 09:00:00 may in fact be a few seconds earlier
or later depending how much drift has occurred up to that time. The difference between the internally
recorded time and GPS time for the last sample is likely to be even larger because of continuing clock drift
for the duration of the deployment. The fluorometers, however, need to be treated differently. They cannot
be programmed for a later start time and are started manually (this in itself can lead to some inaccuracy in
the start time). If the instrument is started manually at 09:00:00 (GPS time) the internally recorded start time
may be earlier or later than this because of internal clock drift up to that time. These differences between
“real” time and recorded times may or may not be important depending on the magnitude of the clock drift
and the frequency of events being studied.
Calibration coefficients
Excitation: λ=470nm
date
Offset
Scale factor
Emission: λ=695nm
777
28-Jun-07
67
0.0078
Sensitivity: 0.01μg l-1
778
28-Jun-07
78
0.0076
Range: 0.01 to 125μg l-1
Serial
Calibration
number
D352 cruise report / 75
779
28-Jun-07
78
0.0076
907
14-Feb-08
83
0.0076
937
14-Feb-08
80
0.0078
939
14-Feb-08
78
0.0077
*1512
5-Aug-09
50
0.0077
*1513
5-Aug-09
49
0.0077
*1514
5-Aug-09
50
0.0077
1712
21-Jan-10
53
0.0077
Table 1. Details and specifications of Wetlabs FLB chlorophyll fluorometers. *Fitted with biowiper.
Serial
Calibration
Depth range
number
date
(m)
3269
29-Jun-07
100
3271
29-Jun-07
100
3272
29-Jun-07
100
Accuracy: ±0.1ºC;
3273
29-Jun-07
100
Resolution: 0.032ºC
3275
29-Jun-07
100
Range: –1ºC to +40ºC
3276
29-Jun-07
100
Time constant: 20s
3278
29-Jun-07
100
Depth:
3598
12-Feb-08
n/a
(100m sensor) Accuracy: ±0.4m
3599
12-Feb-08
n/a
3601
12-Feb-08
n/a
3602
12-Feb-08
n/a
3604
12-Feb-08
n/a
Temperature:
Resolution: 0.04m
(240m sensor) Accuracy: ±1.0m
Resolution: 0.08m
D352 cruise report / 76
3605
12-Feb-08
n/a
3606
12-Feb-08
n/a
3608
12-Feb-08
n/a
3610
12-Feb-08
n/a
3613
12-Feb-08
n/a
3614
12-Feb-08
n/a
3616
12-Feb-08
n/a
3619
12-Feb-08
n/a
3653
17-Mar-08
240
3655
17-Mar-08
240
3661
18-Mar-08
240
3662
18-Mar-08
240
Table 2. Details and specifications of Star-Oddi Centi-T(D) temperature loggers.
Serial
Calibration
Serial
Calibration
number
date
number
date
2605
30-May-07
2621
29-Jun-07
2606
30-May-07
2623
29-Jun-07
2609
30-May-07
2624
29-Jun-07
Accuracy: ±0.05ºC
2610
30-May-07
2625
29-Jun-07
Resolution: 0.013ºC
2611
30-May-07
2833
20-Mar-08
Range: –2ºC to +40ºC
2612
30-May-07
2834
20-Mar-08
Time constant: 18s
2613
30-May-07
2835
20-Mar-08
2614
30-May-07
2839
20-Mar-08
D352 cruise report / 77
2617
29-Jun-07
2845
20-Mar-08
2618
29-Jun-07
2846
20-Mar-08
2620
29-Jun-07
2850
20-Mar-08
Table 3. Details and specifications of Star-Oddi Starmon-mini temperature loggers.
Serial
Calibration
Depth range
number
date
(m)
3795
3500
4463
7000
5595
1000
5596
1000
7458
2-Nov-09
250
7459
2-Nov-09
250
7460
2-Nov-09
250
Table 4. Details and specifications of Seabird MicroCATs.
Nominal
Instrument
Serial
Clock set
depth (m)
type
Number
Date
Surface
M1000
5596
4-Jun
5
TS
2834
F
Time
First sample
Last sample
Clock
Date
Time
Date
Time
drift (s)
11:25:15
4-Jun
21:00:01
19-Jun
20:57:01
2-Jun
08:35:57
4-Jun
12:00:00
1712
2-Jun
12:08:46
4-Jun
12:04:03
19-Jun
18:09:03
+7
TS
2846
2-Jun
08:38:13
4-Jun
12:00:00
20-Jun
10:55:00
+1
F
907
2-Jun
12:17:21
4-Jun
12:02:03
19-Jun
19:54:03
+16
TS
2845
2-Jun
08:39:25
4-Jun
12:00:00
20-Jun
11:02:00
–6
+4
Lost during recovery
10
15
20
RAS100
2-Jun
4-Jun
D352 cruise report / 78
F
*1514
2-Jun
11:22:50
4-Jun
11:37:01
19-Jun
17:22:01
–13
T100
3276
2-Jun
09:25:39
4-Jun
12:00:00
20-Jun
08:46:00
–5
F
778
2-Jun
12:24:45
4-Jun
12:00:11
19-Jun
19:12:11
+85
TS
2850
2-Jun
08:40:11
4-Jun
12:00:00
20-Jun
11:07:00
–1
F
937
2-Jun
12:56:28
4-Jun
11:58:02
19-Jun
18:24:02
+7
T100
3278
2-Jun
09:26:19
4-Jun
12:00:00
20-Jun
08:58:00
–22
F
*1512
2-Jun
11:53:21
4-Jun
11:54:03
19-Jun
19:24:18
–3
TS
2833
2-Jun
08:41:44
4-Jun
12:00:00
20-Jun
11:10:00
–9
25
30
35
RAS500
40
2-Jun
4-Jun
F
*1513
2-Jun
11:39:54
4-Jun
11:40:05
19-Jun
17:41:34
+12
T100
3275
2-Jun
09:27:25
4-Jun
12:00:00
20-Jun
09:09:00
–12
F
938
2-Jun
13:04:33
4-Jun
11:56:02
19-Jun
20:11:02
+7
TS
2839
2-Jun
08:41:00
4-Jun
12:00:00
20-Jun
11:14:00
–2
F
777
2-Jun
13:15:44
4-Jun
11:52:11
19-Jun
20:27:11
+95
TS
2835
2-Jun
08:42:28
4-Jun
12:00:00
20-Jun
11:18:00
–5
F
779
2-Jun
13:23:47
4-Jun
11:50:11
19-Jun
19:42:11
+90
M250
7460
3-Jun
09:56:00
4-Jun
21:00:01
19-Jun
23:10:01
–1
60
T100
3269
2-Jun
09:28:52
4-Jun
12:00:00
20-Jun
09:21:00
–10
70
TS
2618
2-Jun
08:43:45
4-Jun
12:00:00
20-Jun
11:21:00
–17
85
T100
3271
2-Jun
09:28:07
4-Jun
12:00:00
20-Jun
09:32:00
–11
100
TS
2624
2-Jun
08:44:29
4-Jun
12:00:00
20-Jun
11:24:00
–18
Bottom
M250
7459
3-Jun
10:12:00
4-Jun
21:00:01
19-Jun
22:10:01
0
45
50
55
Table 5: IM1, location: 49º 25.31’N, 08º 58.88’W, depth 140m. All data were logged at 1 minute intervals.
All times are GMT. Instrument types are indicated by: F – Wetlabs FLB fluorometer; TS – Star-Oddi
Starmon-mini temperature logger; TPPP – Star-Oddi Centi-TD temperature and depth logger, suffix denotes
the pressure sensor limit in metres; MPPP – Seabird MicroCAT with 250m pressure sensor, suffix denotes
the pressure sensor limit in metres. See Deployment Details section for notes on timings.
D352 cruise report / 79
Nominal
Instrument
Serial
Clock set
depth (m)
type
Number
Surface
M7000
4463
5
TS
2620
2-Jun
10
TS
2625
15
TS
20
Date
Time
First sample
Last sample
Clock
Date
Time
Date
Time
3-Jun
10:00:01
18-Jun
12:34:01
14:22:48
4-Jun
12:00:00
20-Jun
18:05:00
+6
2-Jun
14:24:38
4-Jun
12:00:00
20-Jun
18:11:00
+25
2611
2-Jun
14:25:28
4-Jun
12:00:00
20-Jun
18:18:00
+11
TS
2609
2-Jun
20-Jun
18:22:00
+13
25
TS
2606
2-Jun
14:27:20
4-Jun
12:00:00
20-Jun
18:25:00
–15
30
T100
3272
2-Jun
15:04:58
4-Jun
12:00:00
20-Jun
09:50:00
–32
35
TS
2605
2-Jun
14:28:15
4-Jun
12:00:00
20-Jun
18:29:00
–24
40
TS
2621
2-Jun
14:30:13
4-Jun
20-Jun
18:33:00
+10
45
TS
2623
2-Jun
14:30:59
4-Jun
12:00:00
20-Jun
18:37:00
–15
50
TS
2614
2-Jun
14:31:53
4-Jun
12:00:00
20-Jun
18:40:00
–15
55
T240
3655
2-Jun
15:05:49
4-Jun
12:00:00
20-Jun
10:02:00
–14
60
T240
3653
2-Jun
15:06:38
4-Jun
12:00:00
20-Jun
10:12:00
–18
70
TS
2610
2-Jun
14:32:42
4-Jun
12:00:00
20-Jun
18:45:00
–23
85
TS
2617
2-Jun
14:33:33
4-Jun
12:00:00
20-Jun
18:49:00
–28
100
TS
2612
2-Jun
14:34:31
4-Jun
12:00:00
20-Jun
18:52:00
+8
120
TS
2613
2-Jun
14:35:17
4-Jun
12:00:00
20-Jun
18:55:00
+7
Bottom
M250
7458
3-Jun
10:32:00
5-Jun
09:00:01
18-Jun
12:15:01
0
14:26:27
4-Jun
12:00:00
12:00:00
drift (s)
Table 6: IM2, location: 49º 27.92’N, 08º 49.96’W, depth 149m. All data were logged at 1 minute intervals.
All times are GMT. Instrument types are indicated by: TS – Star-Oddi Starmon-mini temperature logger;
TPPP – Star-Oddi Centi-TD temperature and depth logger, suffix denotes the pressure sensor limit in metres;
MPPP – Seabird MicroCAT with 250m pressure sensor, suffix denotes the pressure sensor limit in metres.
See Deployment Details section for notes on timings.
.
D352 cruise report / 80
Nominal
Instrument
Serial
Clock set
depth (m)
type
Number
Surface
M3500
3795
5
TC
3616
2-Jun
10
TC
3610
15
TC
20
Date
Time
First sample
Last sample
Clock
Date
Time
Date
Time
3-Jun
10:00:01
19-Jun
10:07:01
15:43:54
4-Jun
12:00:00
2-Jun
15:45:30
4-Jun
12:00:00
20-Jun
19:20:00
–8
3605
2-Jun
15:46:07
4-Jun
12:00:00
20-Jun
19:29:00
–7
TC
3606
2-Jun
20-Jun
19:35:00
–9
25
TC
3598
2-Jun
15:47:22
4-Jun
12:00:00
20-Jun
19:41:00
–8
30
T100
3273
2-Jun
15:54:08
4-Jun
12:00:00
20-Jun
10:24:00
–32
35
TC
3602
2-Jun
15:48:16
4-Jun
12:00:00
20-Jun
19:46:00
–11
40
TC
3601
2-Jun
15:48:48
4-Jun
20-Jun
19:52:00
–11
45
TC
3604
2-Jun
15:49:21
4-Jun
12:00:00
20-Jun
19:58:00
–10
50
TC
3619
2-Jun
15:49:58
4-Jun
12:00:00
20-Jun
20:04:00
–8
55
T240
3661
2-Jun
15:55:12
4-Jun
12:00:00
20-Jun
10:34:00
–24
60
T240
3662
2-Jun
15:55:47
4-Jun
12:00:00
70
TC
3614
2-Jun
15:50:34
4-Jun
12:00:00
20-Jun
20:10:00
–12
85
TC
3599
2-Jun
15:51:09
4-Jun
12:00:00
20-Jun
20:15:00
–21
100
TC
3613
2-Jun
15:51:53
4-Jun
12:00:00
20-Jun
20:21:00
–21
120
TC
3608
2-Jun
15:52:24
4-Jun
12:00:00
20-Jun
20:26:00
–13
Bottom
M1000
5595
5-Jun
13:30:00
5-Jun
17:00:01
19-Jun
10:31:01
15:46:41
4-Jun
12:00:00
12:00:00
drift (s)
Lost during recovery
Lost during recovery
Table 7: IM3, location: 49º 22.34’N, 08º 54.77’W, depth 136m.. All data were logged at 1 minute intervals.
All times are GMT. Instrument types are indicated by: TS – Star-Oddi Starmon-mini temperature logger;
TPPP – Star-Oddi Centi-TD temperature and depth logger, suffix denotes the pressure sensor limit in metres;
MPPP – Seabird MicroCAT with 250m pressure sensor, suffix denotes the pressure sensor limit in metres.
See Deployment Details section for notes on timings.
D352 cruise report / 81
Seabed landers (John Kenny)
RDI 150kHz narrowband ADCPs were deployed at WIS and IM3 on modified NOCL pop-up ADCP frames.
A 300kHz RDI Workhorse ADCP was also fitted to WIS. Each frame was attached to a releasable
aluminium bed frame fitted with lead ballast weights. A 12 m stray-line with pellet floats was attached to the
top of each frame to facilitate recovery. A 300m spooling line was attached to the ballast and to the
instrument frame via an acoustic release mechanism located on the instrument frame (only one benthos
release was attached to the release mechanism along with a blank). This was to allow the ballast frame to
be discarded should the spooling line become tangled and hinder the instrument frame from reaching the
surface. The release mechanisms were standard titanium releases fitted with two “fizz link” burn wires on
each. Each of the burn wires can be fired independently, only one being needed to release the mechanism
and thus release the frame or the spooler line. Each frame was fitted with one RD Instruments 150 kHz
broadband ADCP. Both ADCPs were set up independently. The Flowquest ADCP at IM1 was deployed on
a pop-up frame. The frame was attached to a releasable ballast weight. A 12 m stray-line with pellet floats
was attached to the top of each frame to facilitate recovery. The release mechanisms were the same as
described earlier. The configuration of the ADCPs is given in Tables 8, 9 and 10. Figure 10.1 shows the
150kHz lander ready for deployment at WIS.
Figure 10.1: 150kHz ADCP lander ready for deployment at WIS.
An NMF supplied low-profile lander fitted with a 300kHz RDI Workhorse was deployed at IM2 and is shown
in Figure 10.2. The setup script is listed below
;SHARPLES_13872_D352
CR1
CF11101
EA00000
EB00000
ED01120
ES35
EX11111
EZ1111111
TE00:05:00.00
TF10/06/01,16:00:00
D352 Cruise Report/82
TP00:06.66
WB0
WD111100000
WF0176
WN112
WP00045
WS0100
WV170
CK
CS
;Temperature
= 5.00
;Frequency
= 307200
;Deployment hours = 1440.00
Figure 10.2: NMF low-profile ADCP lander being recovered at IM2
WIS
Table 8: NOCL RDI ADCP setup (WIS) and details of the instruments
Number of depth cells
28
Depth cell size
4m
Time per ensemble
2 minutes
Time per ping
4s
Number of pings per ensemble
30
Data recorded
Velocity, correlation, echo intensity, percent good, heading,
temperature, pitch, roll
Coordinates
Radial beam coordinates
Pitch and roll correction
No correction applied
D352 Cruise Report/83
Frame IS – RDI ADCP deployment
Instrument
Serial
number
RD Instruments
1149
Deployment details
Clock set
First data
15:20:00
09:00:00
31/05/2010
01/06/2010
Recovery details
Last data
Data
Drift (s)
150 kHz ADCP,
broadband
Benthos acoustic
transponder
Benthos acoustic
transponder
Benthos
acoustic
transponder
Receive frequency 11.5 kHz, Transmit 12.0 kHz
67679
Release code B
Receive frequency 10.0 kHz, Transmit 12.0 kHz
71904
Release code C
72378
Receive frequency 10.5 kHz, Transmit 12.0 kHz
Release code A
(Spooler)
D352 Cruise Report/84
IM1
Table 9: NOCL FLOWQUEST ADCP setup (IM1) and details of the instruments
Number of depth cells
31
Depth cell size
4m
Time per ensemble
2 minutes
Time per ping
1s
Number of pings per ensemble
120
Velocity, correlation, echo intensity, percent good, heading,
Data recorded
temperature, pitch, roll, SNR, signal strength, pressure
Coordinates
Radial beam, Instrument and earth coordinates
Pitch and roll correction
No correction applied
Frame IM2 – FLOWQUEST ADCP deployment
Instrument
Serial
number
Deployment details
Recovery details
Clock set
First data
Last data
08:51:00
15:00:00
10:48:55
01/06/2010
01/06/2010
Data
Drift (s)
011048
Flowquest ADCP
Benthos acoustic
transponder
Benthos acoustic
transponder
In sync
27782 kbytes
20/06/2010
Receive frequency 13.5 kHz, Transmit 12.0 kHz
72863
Release code A
Receive frequency 10.0 kHz, Transmit 12.0 kHz
70355
Release code B
IM2
Table10: NMF-SS RDI ADCP setup (IM2) and details of the instruments
D352 Cruise Report/85
Number of depth cells
112
Depth cell size
1m
Time per ensemble
5 minutes
Time per ping
6.66 s
Number of pings per ensemble
45
Data recorded
Velocity, correlation, echo intensity, percent good, heading,
temperature, pitch, roll
Coordinates
Earth coordinates
Pitch and roll correction
Pitch and roll used in coordinate transformation
Frame IM2 – RDI ADCP deployment
Instrument
Serial
number
Deployment details
Clock set
Recovery details
First data
???
RD Instruments
16:00:00
01/06/2010
???
Acoustic
transponder
Drift (s)
???
???
300 kHz ADCP,
broadband
Last data
Data
???
???
???
??? information not received from NMF-SS
IM3
Table 10: NOCL RDI ADCP setup (IM3) and details of the instruments
Number of depth cells
37
Depth cell size
4m
Time per ensemble
2 minutes
Time per ping
4s
Number of pings per ensemble
30
Data recorded
Coordinates
Velocity, correlation, echo intensity, percent good, heading,
temperature, pitch, roll
Radial beam coordinates
D352 Cruise Report/86
Pitch and roll correction
No correction applied
Frame IM3 – RDI ADCP deployment
Instrument
Serial
number
Deployment details
Recovery details
Clock set
First data
Last data
150 kHz ADCP,
09:35:00
09:00:00
16:00:00
broadband
31/05/2010
01/06/2010
RD Instruments
Benthos acoustic
transponder
Benthos acoustic
transponder
Drift (s)
1148
+3
10360 kbytes
18/06/2010
Receive frequency 14.5 kHz, Transmit 12.0 kHz
72858
Release code A
Receive frequency 13.0 kHz, Transmit 12.0 kHz
70354
Release code A
Benthos acoustic
transponder
Data
Receive frequency 10.5 kHz, Transmit 12.0 kHz
71919
Release code C
(spooler)
Mid-water ADCP (Chris Old)
Overview
At mooring IM1 an upward-looking 600 kHz ADCP was deployed in a mid-water float to provide a high
vertical resolution measure of the velocity field from the base of the thermocline into the surface mixed
layer. Two separate configurations were trialed. The first was a 3 day high frequency times series, the
second a low frequency deployment which continued until the moorings were recovered.
D352 Cruise Report/87
Two difficulties arose with this deployment. The water depth at the mooring location was 20m deeper than
estimated from the navigation charts and the surface mixed layer was 10m shallower than expected. The
mooring had to be extended by 20m to get the float close to the base of the thermocline. The nominal
range for a 600 kHz ADCP is approximately 60m, realistically you get about 45m, so the instrument would
not be able to measure to the surface and while the mixed layer was shallow it would not see into the mixed
layer.
The high frequency configuration was a compromise between collecting turbulence data and covering the
needs of the inertial oscillations experiment. It was decided that Mode 12 would be used for the high
frequency configuration to give the required measurement range while reducing the measurement noise for
the turbulence measurements.
For the high-frequency deployment the ADCP was pre-programmed to start collecting data at 1200 on
05/06/2010, for the low-frequency deployment the instrument was programmed to start immediately.
Deployment details
4
7
5
ADCP Serial Number
High Freq.
8
8275
6
Low Freq.
9
7301
10 Deploy date
11 05 / 06 / 2010
12 09 / 06 / 2010
13 Deploy time
14 11:36
15 13:28
17 49° 25.1’ N
18 49° 25.18’ N
20 008° 59.2’ W
21 008° 59.26’ W
23 138m
24 139m
25 Recovery date
26 09 / 06 / 2010
27 19 / 06 / 2010
28 Recovery time
29 12:00
30 10:15
32 im1_adcp600_hf_cfg.txt
33 im1_adcp600_lf_cfg.txt
16 Latitude
19 Longitude
22 Water depth at deploy
31 Config. File
D352 Cruise Report/88
The mooring was designed so that the anchor weight was left behind when the mooring was recovered. A
600 kg weight was used for the high-frequency mooring and a 1000kg weight was used for the lowfrequency mooring.
Mid-water ADCP Configuration Files
High-frequency configuration
CR1
CF11101
EA0
EB0
ED580
ES35
EX00000
EZ1111101
WA50
WB0
WD111100000
WF88
WM12
WN190
WP1
WS20
WO10,6
WV40
TE00:00:03.00
TP00:00.00
RNIM1MW
CK
CS
;
;Instrument
= Workhorse Sentinel
;Frequency
= 614400
;Water Profile
= YES
;Bottom Track
= NO
;High Res. Modes = NO
;High Rate Pinging = YES
;Shallow Bottom Mode= NO
;Wave Gauge
= NO
;Lowered ADCP
= NO
;Beam angle
= 20
;Temperature
= 11.00
;Deployment hours = 24.00
;Battery packs
=1
;Automatic TP
= YES
;Memory size [MB] = 256
;Saved Screen
=3
;
;Consequences generated by PlanADCP version 2.02:
;First cell range = 2.13 m
;Last cell range = 39.93 m
;Max range
= 45.56 m
;Standard deviation = 2.28 cm/s
;Ensemble size
= 3948 bytes
;Storage required = 108.44 MB (113702400 bytes)
;Power usage
= 55.80 Wh
;Battery usage
= 0.1
;
; WARNINGS AND CAUTIONS:
; The number of pings is too low for reasonable sampling of the currents.
; Advanced settings has been changed.
; Expert settings has been changed.
Low-frequency configuration
CR1
CF11101
D352 Cruise Report/89
EA0
EB0
ED580
ES35
EX00000
EZ1111101
WA50
WB0
WD111100000
WF88
WM12
WN130
WP2
WS50
WO20,10
WV80
TE00:00:30.00
TP00:15.00
RNIM1M2
CK
CS
;
;Instrument
= Workhorse Sentinel
;Frequency
= 614400
;Water Profile
= YES
;Bottom Track
= NO
;High Res. Modes = YES
;High Rate Pinging = YES
;Shallow Bottom Mode= NO
;Wave Gauge
= NO
;Lowered ADCP
= NO
;Beam angle
= 20
;Temperature
= 11.00
;Deployment hours = 480.00
;Battery packs
=1
;Automatic TP
= YES
;Memory size [MB] = 2048
;Saved Screen
=3
;
;Consequences generated by PlanADCP version 2.02:
;First cell range = 1.90 m
;Last cell range = 66.40 m
;Max range
= 43.84 m
;Standard deviation = 1.44 cm/s
;Ensemble size
= 2748 bytes
;Storage required = 150.95 MB (158284800 bytes)
;Power usage
= 366.14 Wh
;Battery usage
= 0.8
;
; WARNINGS AND CAUTIONS:
; The number of pings is too low for reasonable sampling of the currents.
; Advanced settings has been changed.
; Expert settings has been changed.
D352 Cruise Report/90
11. Meteorological Stations (John Kenny)
Airmar PB200 weather stations were deployed on the surface buoys at all mooring sites. The PB200
sensors were approximately 1.8m above sea level. Each weather station has a delay offset from the
ensemble interval of approximately +115s. This is the sum of the initialisation of the CR800 from ‘sleep
mode’ (aprox. 50s) and the time it take for the PB200 to get a GPS fix (60s). For example, a typical cycle
would be; at time 00:00:00 system wakes up. At time 00:01:55 system starts sampling. At time 00:02:55
system stops sampling, processes data and goes into ‘sleep mode.
The system measures average wind speeds, wind direction, max wind speed and max wind speed
direction, air pressure, air temperature, pitch, roll and heading. Measurements are made relative to earth
(using GPS, heading pitch and roll data, directional information recorded in degrees from true north and
magnetic north) and relative to the PB200 sensor (using heading data, directional information is recorded in
degrees from magnetic north). See weather station documentation contained with the data for further
information.
NOCL Weather Station system setup and details of the instruments
Ensemble interval
10 minutes from the hour
Time per ensemble
1 minutes
Time per ping
1s
Number of pings per ensemble
60
Ensemble start offset
+115s
Average wind speed, wind direction, max wind speed and max wind
speed direction, air pressure, air temperature, pitch, roll and heading.
Data recorded
Measurements made relative to earth and relative to instrument.
IM1
NOCL Weather Station four – IM1
Instrument
Serial
Deployment details
Recovery details
Data
number
Clock set
First data
Last data
Drift (s)
1858754
Airmar PB200
4
System CR800
14:08:00
14:50:00
31/05/2010
31/05/2010
17:50:00
In sync
923 kbytes
20/06/2010
D352 Cruise Report/91
IM2
NOCL Weather Station one – IM2
Instrument
Serial
Deployment details
Recovery details
Data
number
Clock set
First data
Last data
Drift (s)
1858750
Airmar PB200
1
System CR800
10:30:00
11:00:00
31/05/2010
31/05/2010
11:20:00
In sync
858 kbytes
18/06/2010
IM3
NOCL Weather Station three – IM3
Instrument
Serial
Deployment details
Recovery details
Data
number
Clock set
First data
Last data
Drift (s)
1858753
Airmar PB200
3
System CR800
14:21:00
14:30:00
31/05/2010
31/05/2010
16:30:00
In sync
865 kbytes
18/06/2010
WIS
NOCL Weather Station two – WIS
Instrument
Serial
Deployment details
Recovery details
Data
number
Clock set
First data
Last data
Drift (s)
1858755
Airmar PB200
2
System CR800
11:09:00
14:20:00
31/05/2010
31/05/2010
kbytes
D352 Cruise Report/92
12. Nutrient Analysis (Charlotte Williams, Claire Mahaffey)
Seawater samples were collected at discrete depths through the water column and analysed onboard for
inorganic nutrients in order to determine the vertical and horizontal distribution of nutrients in the Celtic Sea.
A rosette frame supporting a Seabird CTD instrument and twenty-four 10L Niskin bottles was used to
collect samples between the surface water and a maximum depth of 1750m. Sampling was performed at a
higher spatial resolution through the subsurface chlorophyll maximum (SCM) region.
Seawater samples were collected directly from each Niskin bottle into acid-washed, deionised water rinsed
250ml HDPE screwcap bottles. Bottles were rinsed 3 times with sample seawater before being filled to 90%
volume. Samples were collected from 37 CTD casts and nutrient concentrations were determined within 2
hours of sample collection. In addition, seawater samples were collected into acid-washed, deionised water
rinsed 60ml HDPE bottles from 32 of the 37 CTD casts and frozen immediately at -20°C. Nutrient samples
were labelled with cruise number (D352), CTD cast number, Niskin bottle number and depth (m) (Table 1).
Frozen seawater samples were packed into cool boxes containing dry ice and transported to the University
of Liverpool.
Inorganic nutrient concentrations were determined using a Bran and Luebbe QuAAtro 5-channel
segmented flow nutrient analyser. Nitrate plus nitrite, silicate, phosphate and nitrite concentrations were
determined using standard colorimetric techniques (NIOZ method). Ammonium concentrations were
determined by fluorometric techniques using a JASCO FP-2020 Intelligent fluorescence detector (Kerouel &
Aminot, 1997). Reagents were prepared onboard every 3 to 5 days from analytical or HPLC grade pre-
weighed dry and wet chemicals.
Calibration standards were prepared daily using primary nutrient stock standards (10mM) which were
stored in plastic amber bottles in the fridge. Typical calibration standard concentrations ranged from 1 to 10
μM for nitrate and silicate and 0.1 to 1 μM for nitrite, phosphate and ammonium. All calibration standards
were prepared in artificial seawater (35g of sodium chloride, 0.5g of sodium bicarbonate). Correlation
coefficients were typically better than 0.9995. To check accuracy of analysis and calibration standards, an
independent OSIL nutrient standard (Ocean Scientific, 10mM stock standards in seawater) was prepared
every 3 to 5 days in artificial seawater and the concentrations determined in triplicate during each analytical
run. If OSIL standard concentrations deviated significantly (> 5%) from the expected value (5 μM for nitrate
and silicate, 0.5 μM for nitrite and phosphate), the analysis was stopped and either calibration standards or
reagents adjusted.
Peak heights, representative of concentration, were captured using the Bran and Luebbe AACE software
and included corrections for baseline and calibration standard drift. Calibration and sample data were
processed in Microsoft Excel and the mean and standard deviation of each triplicate analysis calculated.
The OSIL concentration, regression correlation and calibration data were recorded. The typical limits of
detection for each nutrient analysed were (a) nitrate plus nitrite, 0.05 μM (b) silicate, 0.1 μM (c) phosphate
D352 Cruise Report/93
0.05 μM, (d) ammonium 0.1 μM and (e) nitrite, 0.05 μM. The typical precision of analysis for each nutrient
analysed was (a) nitrate plus nitrite ± 0.02 μM, (b) silicate ± 0.06 μM, (c) phosphate ± 0.02 μM (d)
ammonium ± 0.1 μM (e) nitrite ± μM
Problems within the nutrient analysis
(1)
Ammonium reagents: During initial reagent preparation onboard, it was noted that the ammonium
mixed reagent was contaminated (standard peaks showed a negative rather than positive peak
relative to the baseline, showing dilution of the reagent). Each ingredient of the mixed reagent was
replaced and it was found that the sodium tetraborate was the source of contamination, potentially
due to storage in plastic containers. Fortunately, smaller amounts of sodium tetraborate had been
stored in glass vials and were used to reagent preparation. However, due to the risk of contamination
and sensitivity of the reagent to light, the mixed reagent was prepared fresh every 1-2 days. All
glassware was acid soaked and rinsed at least 5 times with deionised water before the reagent was
prepared.
(2)
Cadmium column regeneration: Every 2 to 3 days, the efficiency of the cadmium column, used to
convert nitrate to nitrite, decreased due to the surface of the cadmium column becoming oxidised.
This reduction in cadmium column efficiency was manifested as an increase in the gain of the high
standard (e.g. typical gain of 173, increased to > 230). Online cadmium column regeneration was
therefore performed on a regular basis and consisted of pumping 10% hydrochloric acid and copper
sulphate through the imadizole buffer line for 1, 2 and 5 minutes respectively.
References
Kerouel, R. & A. Aminot, 1997: Fluorometric determination of ammonia in sea and estuarine waters by direct
segmented flow analysis. Mar. Chem. 57, 3-4, pp 265-275
Table 1. Date, time and CTD number where nutrient samples were collected. ‘DNF’ and ‘L’ mean that the
Niskin bottle did not fire or leaked, respectively. 60ml frozen samples marked ‘x*’ signifies samples that
were labelled 1 to 9 instead of Niskin bottle number.
DATE
TIME
CTD CAST
NISKIN BOTTLE
DEPTH
200ML SAMPLE
60ML FROZEN SAMPLE
03/06/2010
03:30
2
1
42m
x
x
3
17m
x
x
03/06/2010
14:00
3
5
14m
x
x
7
11m
x
x
9
5m
x
x
1
97m
x
x
3
77m
x
x
5
62m
x
x
7
52m
x
x
9
42m
x
x
D352 Cruise Report/94
04/06/2010
05/06/2010
06/06/2010
06/06/2010
07/06/2010
16:40
03:30
03:38
04:45
06:00
4
6
7
8
12
11
37m
x
x
13
30m
x
x
15
25m
x
x
17
22m
x
x
19
17m
x
x
21
7m
x
x
23
surface
x
x
1
100m
x
x
2
80m
x
x
3
60m
x
x
4
50m
x
x
5
40m
x
x
6
36m
x
x
7
31m
x
x
8
26m
x
x
9
20m
x
x
10
15m
x
x
11
10m
x
x
12
3m
x
x
1
127m
x
x
2
60m
x
x
4
55m
x
x
5
48m
x
x
7
46m
x
x
8
42m
x
x
9
38m
x
x
12
33m
x
x
14
20m
x
x
16
surface
x
x
1
126m
x
x
2
52m
x
x
4
48m
x
x
5
43.5m
x
x
7
41.9m
x
x
8
36.6m
x
x
12
31.7m
x
x
14
16.6m
x
x
16
2m
x
x
1
70m
x
x
5
37m
x
x
1
110m
x
x
3
90m
x
x
5
70m
x
x
7
50m
x
x
9
45m
x
x
11
35m
x
x
D352 Cruise Report/95
07/06/2010
07/06/2010
08/06/2010
08/06/2010
09/06/2010
16:00
22:24
04:15
21:30
03:36
13
14
15
16
17
13
30m
x
x
15
20m
x
x
17
5m
x
x
1
121m
x
x
3
91m
x
x
5
70.7m
x
x
7
51.3m
x
x
9
43m
x
x
11
40.2m
x
x
13
36.6m
x
x
15
30m
x
x
17
20m
x
x
19
5m
x
x
1
120m
x
x
3
90m
x
x
5
70m
x
x
7
50m
x
x
9
45m
x
x
12
40m
x
x
13
35m
x
x
15
20m
x
x
17
5m
x
x
1
120m
x
x*
2
90m
x
x*
3
70m
x
x*
4
50m
x
x*
5
45m
x
x*
6
40m
x
x*
7
35m
x
x*
8
20m
x
x*
9
5m
x
x*
1
120m
x
x*
3
90m
x
x*
5
70m
x
x*
7
50m
x
x*
9
45m
x
x*
11
37m
x
x*
13
34m
x
x*
15
20m
x
x*
17
5m
x
x*
1
120m
x
x
2
55m
x
x
4
47m
x
x
5
43m
x
x
7
41m
x
x
8
40m
x
x
D352 Cruise Report/96
09/06/2010
10/06/2010
10/06/2010
10/06/2010
11/06/2010
16:40
05:30
13:18
22:00
11:00
19
21
22
23
24
12
30m
x
x
14
15m
x
x
16
surface
x
x
1
120m
x
x
2
90m
x
x
3
70m
x
x
4
50m
x
x
5
45m
x
x
6-L
40m
x
x
7
35m
x
x
8
20m
x
x
9
5m
x
x
1
120m
x
x
2
90m
x
x
3
70m
x
x
4
50m
x
x
5
47m
x
x
6
40m
x
x
7
35m
x
x
8
20m
x
x
9
5m
x
x
1
120m
x
x
3
90m
x
x
5
70m
x
x
7
50m
x
x
9
43m
x
x
11
35m
x
x
13
33m
x
x
15
20m
x
x
17
5m
x
x
1
120m
x
x*
3
90m
x
x*
5
70m
x
x*
7
50m
x
x*
9
45m
x
x*
11
35m
x
x*
13
30m
x
x*
15
20m
x
x*
17
5m
x
x*
1
120m
x
x
3
90m
x
x
5
70m
x
x
7
50m
x
x
9
45m
x
x
11
35m
x
x
13
30m
x
x
D352 Cruise Report/97
11/06/2010
12/06/2010
13/06/2010
13/06/2010
16/06/2010
21:00
03:30
03:30
22:40
03:30
25
26
29
31
38
15
20m
x
x
17
5m
x
x
1
120m
x
x
3
90m
x
x
5
70m
x
x
7
50m
x
x
9
45m
x
x
11
35m
x
x
13
30m
x
x
15
20m
x
x
17
5m
x
x
1
120m
x
x
3
90m
x
x
5
70m
x
x
7
50m
x
x
9
45m
x
x
11
35m
x
x
13
30m
x
x
15
20m
x
x
17
5m
x
x
1
150m
x
x
2
65m
x
x
4
50m
x
x
5
45m
x
x
7
42m
x
x
8
40m
x
x
9
36m
x
x
14
25m
x
x
16
15m
x
x
18
surface
x
x
1
140m
x
x
3
90m
x
x
5
70m
x
x
7
50m
x
x
9
45m
x
x
11
40m
x
x
13
35m
x
x
15
20m
x
x
17
5m
x
x
1
120m
x
x
2
50m
x
x
4
40m
x
x
5
35m
x
x
7
33m
x
x
8
29m
x
x
12
25m
x
x
D352 Cruise Report/98
16/06/2010
16/06/2010
16/06/2010
16/06/2010
16/06/2010
16/06/2010
07:30
10:20
11:48
01:40
17:05
16:12
40
41
42
43
44
45
14
15m
x
x
16
surface
x
x
1
125m
x
x
3
80m
x
x
5
50m
x
x
7
45m
x
x
9
40m
x
x
11
35m
x
x
13
30m
x
x
15
20m
x
x
17
3m
x
x
1
130m
x
x
3
80m
x
x
5
50m
x
x
7
45m
x
x
9
40m
x
x
11
35m
x
x
13
30m
x
x
15
20m
x
x
17
5m
x
x
1
120m
x
x
3
80m
x
x
5
45m
x
x
7
40m
x
x
9
35m
x
x
11
30m
x
x
13
20m
x
x
15
10m
x
x
17
surface
x
x
1
85m
x
x
3
50m
x
x
5
40m
x
x
7
30m
x
x
9
22m
x
x
11
17m
x
x
13
12m
x
x
15
2m
x
x
1
90m
x
x
3
50m
x
x
5
30m
x
x
7
26m
x
x
9
24m
x
x
11
15m
x
x
13
10m
x
x
15
2m
x
x
1
95m
x
x
D352 Cruise Report/99
17/06/2010
19/06/2010
19/06/2010
19/06/2010
20/06/2010
05:00
06:00
21:30
23:22
00:15
46
48
50
51
52
3
50m
x
x
5
35m
x
x
7
27m
x
x
9
25m
x
x
11
20m
x
x
13
10m
x
x
15
1m
x
x
1
120m
x
x
3
50m
x
x
5
40m
x
x
7
35m
x
x
9
32m
x
x
14
28m
x
x
16
20m
x
x
18
10m
x
x
20
surface
x
x
1
120m
x
2
70m
x
5
60m
x
8
52m
x
9
45m
x
10
41m
x
13
35m
x
15
25m
x
17
10m
x
19
surface
x
1
135m
x
3
70m
x
5
40m
x
7
35m
x
9
30m
x
11
20m
x
13
10m
x
15
surface
x
1
150m
x
x
3
100m
x
x
5
65m
x
x
7
55m
x
x
9
45m
x
x
11
40m
x
x
13
30m
x
x
15
20m
x
x
17
10m
x
x
19
surface
x
x
1
155m
x
3
90m
x
D352 Cruise Report/100
20/06/2010
20/06/2010
20/06/2010
20/06/2010
03:29
13:30
13:30
15:50
53
55
55
56
5
62m
x
7
45m
x
9
35m
x
11
25m
x
13
20m
x
15
10m
x
17
2m
x
1
180m
x
x
2
60m
x
x
4
40m
x
x
5
30m
x
x
7
25m
x
x
8
22m
x
x
12
18m
x
x
14
10m
x
x
16
surface
x
x
1
540m
x
3
400m
x
5
300m
x
7
200m
x
9
100m
x
11
50m
x
13
30m
x
15
20m
x
17
8m
x
19
surface
x
1
540m
x
3
400m
x
5
300m
x
7
200m
x
1
1750m
x
x
2
1400m
x
x
3
1100m
x
x
4
950m
x
x
5
700m
x
x
6
600m
x
x
7
500m
x
x
8
450m
x
x
9
400m
x
x
10
350m
x
x
11
300m
x
x
12
250m
x
x
13
200m
x
x
14
150m
x
x
15
100m
x
x
16
60m
x
x
D352 Cruise Report/101
17
40m
x
x
18
30m
x
x
19
20m
x
x
20
10m
x
x
21
5m
x
x
22
surface
x
x
D352 Cruise Report/102
13. RAS Sampling (Charlotte Williams, Claire Mahaffey, Jo Hopkins)
Two McLane Remote Access Samplers (RAS) were used to collect daily water samples at mooring IM1.
The RAS is a time series water sampler that can collect up to 48 individual samples at pre-programmed
times at depths of up to 5,500m. A RAS-500 (500ml samples) was moored within the DCM at 40m, and a
RAS-100 (100ml samples) was placed in the upper mixed layer 20 m below the surface (nominal depths).
RAS-500 during tank tests
RAS-100 during tank tests
Individual sample holders each contain a sample bag (500ml or 100ml). A multi-port rotary valve directs
seawater to each collapsed bag mounted inside the holder. The top head has a single intake valve and 50
exhaust ports (connected in series to the tops of the sample holders); the bottom head has 50 intake ports
(connected in series to the bottom of each sample holder), and one exhaust port. Ports 0 and 49 are ‘home’
and acid ports respectively, 1-48 are for water samples. The pump draws water out of the sample holder in
which a collapsed sample bag is mounted. This pumping creates a pressure gradient that drives the
ambient seawater through the intake and into the sample bags. After each sample the multi-port valve
returns to ‘home’ sealing the sample in the bag.
To prevent sample contamination and reduce bio-fouling the valve flushes resident water from the intake
tube and valve head before each sample is collected. Furthermore, a pre-sample acid flush (10ml) of the
tubing and valves was also performed with 10% hydrochloric acid. A 25mm filter holder placed in-line with
the flush port (‘home’) to protect the valve from damage to large particles was NOT fitted with a filter.
Firstly, suspended particle concentration in the area was expected to be low and secondly, we didn’t want
to exclude a particular size of phytoplankton from the sampling.
Further details of the RAS can be found in the McLane Remote Access Sampler (RAS) User Manual http://www.mclanelabs.com/ras.html.
D352 Cruise Report/103
Sampling strategy
Both RAS were programmed to take two samples daily at 12:00 between 05/06/2010 and 23/06/2010, the
first for inorganic nutrients, the second for phytoplankton identification and ennumeration. On 14/06/2010
an additional two samples were taken at 14:00, 16:00, 18:00, 20:00 and 22:00 in order to capture any
changes over a spring to neap transition.
Clear bags (odd sample numbers) were used to collect inorganic nutrient samples (nitrate+nitrite,
phosphate, silicate, and nitrite). Mercuric chloride was pre-loaded into the bags such that its final
concentration, once a sample had been taken, was 20mg/l. Nutrient samples were passed through a 1
micron polyester filter (25mm and 47mm diameter for RAS-100 and -500 respectively) loaded into a filter
cap directly above the sample holder intake. This was to exclude phytoplankton cells from the sample that
may absorb or release nutrients thus changing the concentrations during storage. The 25mm and 47mm
1µm Polyester Membrane Filters were ordered from STERLITECH (P/N PET1025100 and P/N
PET1047100 respectively).
Metallic bags (even sample numbers) pre-loaded with the preservative lugols iodine were used for the
collection of phytoplankton samples. 500ml and 100ml bags contained 10ml and 2ml of preservative
respectively. i.e. a final 2% concentration of lugols. The metallic bags were used to cut out any light and
prevent the iodine from photo-degrading.
Instrument configuration/setup
RAS-500 (serial # ML12500-01 )
Header A| D352 RAS 500 Jun 2010
B| 49 25.6N, 8 58.5W
C| IM1 in DCM
Acid D| Pre-sample acid flush:
E| Flushing volume
=
Enabled
10 [ml]
F| Flushing time limit =
1 [min]
G| Exposure time delay =
1 [min]
Water H| Flushing volume
=
I| Flushing time limit =
100 [ml]
5 [min]
Sample J| Sample volume
=
K| Sample time limit =
500 [ml]
25 [min]
Acid L| Post-sample acid flush: Disabled
M| Flushing volume
=
N| Flushing time limit =
Timing P| Pump data period
NA [ml]
NA [min]
=
15 [sec]
D352 Cruise Report/104
Water H| Flushing volume
RAS-100 (serial # ML12500-02)
=
I| Flushing time limit =
Header A| D352 RAS 100 Jun 2010
5 [min]
Sample J| Sample volume
B| 49 25.6N, 8 58.5W
100 [ml]
=
K| Sample time limit =
C| IM1 in Surface
100 [ml]
6 [min]
Acid L| Post-sample acid flush: Disabled
Acid D| Pre-sample acid flush:
Enabled
E| Flushing volume
10 [ml]
M| Flushing volume
=
NA [ml]
F| Flushing time limit =
1 [min]
N| Flushing time limit =
NA [min]
G| Exposure time delay =
1 [min]
=
Timing P| Pump data period
=
15 [sec]
Recovery
Both RAS were recovered on 19/06/2010, therefore only the first 40 samples from each instrument were
taken.
39 samples from the RAS-500 were successfully collected and the bags chilled for future analysis at
Liverpool University. All sample bags from the RAS-100 split (see sample collection problems).
Sample collection problems
When the frames were deployed they were turned upside down while being fixed to the mooring. This
resulted in both lugols iodine and mercuric chloride being pushed back through each of the individual intake
tubes and filters. Chemicals were found in the top intake tube (between the intake value and protective
filter) and could therefore potentially have reached each sample.
Sample tube number 5 and its sample bag were lost during either recovery or deployment of the RAS-500.
Surrounding tubes and the hold down brackets were undamaged.
The top tubing from sample number 42 on the RAS-100 was found detached from the filter holder upon
recovery. However this sample was programmed for the 20th June and therefore not taken.
All sample bags from the RAS-100 split. It is thought that the 100-101 ml of sample plus the small amount
of preservative added to each bag was a volume that exceeded the capacity of the bag. The possibility of
contamination meant that all nutrient samples were discarded. The outer metallic layer of the phytoplankton
sample bags split but despite some leakage the inner bag lining was just about intact enough for the
sample to be worth saving.
D352 Cruise Report/105
Sample tube 5 missing from RAS-500 upon
recovery
Lugols leaked from bags in RAS-100
Lugols in in-take tubing in RAS-500
D352 Cruise Report/106
RAS-500 sample times and volumes
36
06/17/10 12:10:50
502
Sample
Date - Time
Sample Vol. (ml)
37
06/18/10 12:00:00
502
1
06/05/10 12:00:00
502
38
06/18/10 12:10:42
501
2
06/05/10 12:09:47
502
39
06/19/10 12:00:00
502
3
06/06/10 12:00:00
502
40
06/19/10 12:10:34
502
4
06/06/10 12:09:58
502
5
06/07/10 12:00:00
502
6
06/07/10 12:10:06
502
7
06/08/10 12:00:00
502
8
06/08/10 12:10:14
502
9
06/09/10 12:00:00
502
10
06/09/10 12:10:22
502
11
06/10/10 12:00:00
502
12
06/10/10 12:10:30
502
13
06/11/10 12:00:00
502
14
06/11/10 12:10:38
502
15
06/12/10 12:00:00
502
16
06/12/10 12:10:46
502
17
06/13/10 12:00:00
501
18
06/13/10 12:11:55
502
19
06/14/10 12:00:00
501
20
06/14/10 12:11:08
502
21
06/14/10 14:00:00
502
22
06/14/10 14:11:10
502
23
06/14/10 16:00:00
502
24
06/14/10 16:11:18
502
25
06/14/10 18:00:00
502
26
06/14/10 18:11:26
502
27
06/14/10 20:00:00
501
28
06/14/10 20:11:22
501
29
06/14/10 22:00:00
502
30
06/14/10 22:11:14
502
31
06/15/10 12:00:00
502
32
06/15/10 12:11:06
502
33
06/16/10 12:00:00
501
34
06/16/10 12:10:58
502
35
06/17/10 12:00:00
501
D352 Cruise Report/107
RAS-100 Sample times and volumes
36
06/17/10 12:05:31
101
Sample
Date-Time
Sample Vol. (ml)
37
06/18/10 12:00:00
100
1
06/05/10 12:00:00
101
38
06/18/10 12:05:23
101
2
06/05/10 12:04:28
101
39
06/19/10 12:00:00
101
3
06/06/10 12:00:00
101
40
06/19/10 12:05:15
100
4
06/06/10 12:04:40
101
5
06/07/10 12:00:00
101
6
06/07/10 12:04:47
101
7
06/08/10 12:00:00
101
8
06/08/10 12:04:56
101
9
06/09/10 12:00:00
101
10
06/09/10 12:05:04
100
11
06/10/10 12:00:00
101
12
06/10/10 12:05:11
101
13
06/11/10 12:00:00
100
14
06/11/10 12:05:21
101
15
06/12/10 12:00:00
101
16
06/12/10 12:05:27
101
17
06/13/10 12:00:00
101
18
06/13/10 12:05:35
100
19
06/14/10 12:00:00
101
20
06/14/10 12:05:43
100
21
06/14/10 14:00:00
101
22
06/14/10 14:05:51
101
23
06/14/10 16:00:00
101
24
06/14/10 16:05:59
101
25
06/14/10 18:00:00
101
26
06/14/10 18:06:07
101
27
06/14/10 20:00:00
100
28
06/14/10 20:06:03
101
29
06/14/10 22:00:00
101
30
06/14/10 22:05:56
101
31
06/15/10 12:00:00
101
32
06/15/10 12:05:48
101
33
06/16/10 12:00:00
101
34
06/16/10 12:05:39
101
35
06/17/10 12:00:00
101
D352 Cruise Report/108
14. 15-N Labelled Nitrate & Ammonium experiments (Charlotte Williams)
An investigation into the uptake and assimilation of two different forms of nitrogen (ammonium and nitrate)
in the surface, peak subsurface chlorophyll maximum (SCM) and base of the SCM was performed using a
15
N-labelled stable isotope approach. Experiments were conducted at three stations in the Celtic Sea
(Table 1). At each of the three stations seven seawater samples (volume 1.5L) were transferred in 2L
precleaned (pre-washed with 10% hydrochloric acid, rinsed 3 times with deionised water and 3 times with
sample seawater) polycarbonate bottles at each of the three defined depths. One bottle was filtered
immediately and represented the initial natural stable isotope abundance at each specified depth. The
remaining bottles were divided into 2 groups for each depth, where half were spiked with
ammonium and the other half were spiked with
15
15
N labelled
N labelled nitrate (Table 2). These ‘labelled’ bottles (18 in
total) were incubated according to the depth-dependent light intensity for 24 hours. The polycarbonate
bottles were pre-washed with 10% HCl acid and rinsed 3 times with deionised water, followed by being
rinsed 3 times with the actual seawater sample.
Table 1: Location and time for seawater collection for 15N experiments.
CTD
number
Location
DATE
TIME
LAT
LONG
30
(SHELF EDGE)
13/06/2010
06:15
48 57.41N
9 42.62W
39
16/06/2010
05:25
49 25.95N
9 2.03W
57
21/06/2010
12:33
49 03.83N
9 29.44W
The volume and concentration of
15
N-labelled ammonium or nitrate used for spiking was calculated to be
less than 10% of the natural concentration in the surface, peak SCM and base SCM with reference to
recent CTD profiles in the area. The amount used for spiking had to be minimised in order to avoid
stimulating nutrient uptake by phytoplankton, which would not be representative of the preference of a
particular nutrient source or the in situ uptake rate.
After the 24 hour incubation period, samples were filtered through a pre-combusted (450°C for 4 hours)
25mm Whatman Glass Fibre Filter to capture the labelled particles. The filters were placed in plastic
microcentrifuge tubes, labelled and frozen at 20°C. The
15
N content of particulate matter will be determined
using an elemental analyser-isotope ratio mass spectrometry at the University of Liverpool. The rate of
nitrate and ammonium uptake will be determined using equations outlined by Dugdale & Goering (1967).
D352 Cruise Report/109
Table 2: Details of the 15N experiment and all bottles used. 18 bottles incubated for 24 hours for each of
the three CTD stations described in Table 1.
Bottle
ID
1
Depth
Depth
Depth
(CTD
(CTD
(CTD
30)
39)
57)
3.5
5
1
Natural
Sample
Spike?
size
Concentration
(μM)
Spike
Concentration
Incubation
(>10% natural
Light level
conc.) (μM)
1.5L
15
0.1
0.01
35%
0.1
0.01
35%
N-nitrate
0.1
0.01
35%
N-ammonium
N-nitrate
2
3.5
5
1
1.5L
15
3
3.5
5
1
1.5L
15
4
3.5
5
1
1.5L
15
0.1
0.01
35%
1.5L
15
0.1
0.01
35%
15
0.1
0.01
35%
0.1
n/a
n/a
5
3.5
5
1
N-nitrate
N-ammonium
6
3.5
5
1
1.5L
A (ctrl)
3.5
5
1
2L
7
33
35
26
1.5L
15
1
0.1
4%
8
33
35
26
1.5L
15
1
0.1
4%
1.5L
15
9
33
35
26
N-ammonium
Control
N-nitrate
N-nitrate
N-nitrate
1
0.1
4%
N-ammonium
1
0.1
4%
10
33
35
26
1.5L
15
11
33
35
26
1.5L
15
1
0.1
4%
12
33
35
26
1.5L
15
1
0.1
4%
B (ctrl)
33
35
26
2L
13
40
45
40
N-ammonium
N-ammonium
1
n/a
n/a
1.5L
15
Control
5
0.5
2%
5
0.5
2%
N-nitrate
5
0.5
2%
N-ammonium
N-nitrate
14
40
45
40
1.5L
15
15
40
45
40
1.5L
15
16
40
45
40
1.5L
15
5
0.5
2%
1.5L
15
5
0.5
2%
15
5
0.5
2%
5
n/a
n/a
17
40
45
40
18
40
45
40
1.5L
C (ctrl)
40
45
40
2L
N-nitrate
N-ammonium
N-ammonium
Control
References
Dugdale, R. C. & Goering, J. J. 1967: Uptake of new and regenerated forms of nitrogen in primary
productivity. Limnol. Oceanog. 12, 196-206.
D352 Cruise Report/110
15. Water-column carbon dynamics (Anouska Bailey)
Routine sampling:
Niskin samples were taken from each pre-dawn full profile to measure the following rates:
•
Size-fractionated primary production – triplicate 100ml samples from each depth were collected in
125ml polycarbonate bottles and spiked with 12µCi NaH14CO3 and incubated at in-situ temperature
and light regime from dawn until dusk in on-deck incubators. One 100ml dark sample and one 100ml
control were also sampled per depth. Once the incubation was completed samples were filtered
sequentially through 10µm, 2µm and 0.2µm polycarbonate filters. Filters were fumed with 1ml 10%
HCl for 24 hours before adding 5ml Ultima Gold scintillation cocktail and reading on a Perkin Elmer
Tricarb 3100TR scintillation counter.
•
Bacterial production – triplicate 10ml samples from each depth were collected in 30ml polycarbonate
bottles and spiked with 10nM (final concentration) leucine (1 part 3H-Leucine and 9 parts L-leucine)
and incubated in dark bags for 2 hours in on-deck incubators. Triplicate surface samples were also
incubated at in-situ light conditions. Controls were killed with 5% ice-cold trichloracetic acid (final
concentration) and incubated alongside samples. At the end of the incubations all samples were killed
with 5% ice-cold TCA (final concentration) and filtered onto 0.2µm cellulose nitrate filters. Filters were
rinsed with 1ml 5% TCA twice and once with 1ml 80% ethanol before being dissolved with 1ml ethyl
acetate. Five ml of Ultima Gold were added to each vial and samples were read using the onboard
scintillation counter.
•
Net community production – fifteen 125ml oxygen bottles were filled from each depth. Five of these
were fixed with 1ml manganese (II) chloride and 1ml alkaline iodide immediately to act as Tzeros, five
were incubated at in-situ temperature and light conditions for 24 hours and the final five were
incubated in the dark for 24 hours. ‘Light’ bottles were placed within dark bags at sunset and removed
at sunrise to prevent stimulation by deck lights. After 24 hours the ‘light’ and ‘dark’ bottles were fixed
as above and analysed on a Metrohm Titrando after 24 hours.
Samples were also taken from these profiles for:
•
Dissolved organic carbon (DOC) – sample was filtered onto combusted GF/F on a glass filtration rig
pre-rinsed with sample three times. Twenty millilitres of sample were pipetted into an acid-washed
and combusted glass vial pre-filled with 20µl 50% (v/v) HCl. Duplicate samples were taken at each
depth.
•
Size-fractionated chlorophyll a – 500ml samples were sequentially filtered through 10µm, 2µm and
0.2µm (100ml) polycarbonate filters. Filters were stored in capped test tubes, wrapped in foil and
frozen at -80°C for several days. When ready for analysis 5ml of acetone were added to each tube
and fluorescence was read after 24 hours.
D352 Cruise Report/111
•
Phytoplankton abundance – duplicate 100ml samples from each depth were measured from the
Niskin bottles and added to 125ml glass amber jars pre-filled with 2% (final conc.) acid Lugol’s iodine.
Samples were stored in the fridge in the dark.
•
Bacterial abundance – duplicate 50ml samples were taken directly from Niskin bottles into Sterilins
pre-filled with 2% (final conc.) formaldehyde. Samples were stored in the fridge in the dark.
•
Dissolved oxygen concentration – triplicate samples from each depth were fixed immediately and
analysed onboard using a Metrohm Titrando once settled for at least 24 hours.
Additional samples and incubations:
•
Particulate silicate – one litre of water was filtered onto a 0.8µm polycarbonate filter which was
subsequently stored at -80°C in a microcentrifuge tube.
•
Bacterial kinetics incubations – the duration of incubation time as well as the concentration of the
initial leucine spike were examined using on deck incubations of bacterial production. For the timecourse experiment triplicate 10ml samples were spiked with 10nM leucine and incubated in the dark
for 15mins, 30 mins, 1 hour, 2 hours or 4 hours. For the leucine concentration experiment triplicate
10ml samples were incubated for 2 hours in the dark having received a leucine spike of 0, 2.5, 5, 10,
or 20nM. Killed controls were incubated alongside each treatment, and each of these incubations was
run with both surface and DCM water replicates.
Diurnal variability – two 10L carboys were filled with surface water and 2 with water from the DCM. Bottles
were incubated at in-situ light and temperature conditions for 30 hours and sub-sampled every 6 hours for
bacterial production. Bacterial abundance and bulk primary production were also measured at the start of
the incubations and again the following morning.
The following tables represent a log of all samples taken.
D352 Cruise Report/112
Date
CTD #
Stn
03/06/2010
3
Liverpool
Bay
Depth (m)
Routine samples taken
Additional samples
5
Size-frac. chl. a, DOC, NCP, BP, size-frac. PP,
Particulate silicate
phyto. + bact. abundance, DO2
05/06/2010
6
15
DO2
40
DO2
2
Size-frac. chl. a, DOC, NCP, BP, size-frac. PP,
IM1
phyto. + bact. abundance, DO2
20
Size-frac. chl. a, DOC, BP, size-frac. PP, phyto.
+ bact. abundance, DO2
33
Size-frac. chl. a, DOC, BP, size-frac. PP, phyto.
+ bact. abundance, DO2
38
Size-frac. chl. a, DOC, BP, size-frac. PP, phyto.
+ bact. abundance, DO2
42
DO2
46
DO2
48
Size-frac. chl. a, DOC, BP, size-frac. PP, phyto.
+ bact. abundance, DO2
55
DO2
60
Size-frac. chl. a, DOC, BP, phyto. + bact.
abundance, DO2
06/06/2010
09/06/2010
7
17
IM1
127
DO2, DOC
2
DO2
16.6
DO2
31.7
DO2
36.6
DO2
41.9
DO2
43.5
DO2
48
DO2
52
DO2
126
DO2
3
Size-frac. chl. a, DOC, BP, size-frac. PP, phyto.
IM1
+ bact. abundance, DO2
15
Size-frac. chl. a, DOC, BP, size-frac. PP, phyto.
+ bact. abundance, DO2
30
Size-frac. chl. a, DOC, BP, size-frac. PP, phyto.
+ bact. abundance, DO2
40
Size-frac. chl. a, DOC, BP, size-frac. PP, phyto.
D352 Cruise Report/113
+ bact. abundance, DO2
41
DO2
43
Size-frac. chl. a, DOC, BP, size-frac. PP, phyto.
+ bact. abundance, DO2
47
DO2
55
Size-frac. chl. a, DOC, BP, size-frac. PP, phyto.
+ bact. abundance, DO2
120
09/06/2010
12/06/2010
13/06/2010
18
IM1
26
29
DO2, DOC
2.8
NCP, size-frac chl. a, phyto. abundance
37
NCP, size-frac chl. a, phyto. abundance
5
DO2
20
DO2
35
DO2
40
DO2
42
DO2
45
DO2
50
DO2
70
DO2
90
DO2
120
DO2
3.5
Size-frac. chl. a, DOC, BP, size-frac. PP, phyto.
SW3
+ bact. abundance, DO2
15
Size-frac. chl. a, DOC, BP, size-frac. PP, phyto.
+ bact. abundance, DO2
25
Size-frac. chl. a, DOC, BP, size-frac. PP, phyto.
+ bact. abundance, DO2
36
Size-frac. chl. a, DOC, BP, size-frac. PP, phyto.
+ bact. abundance, DO2
40
DO2
42
DO2
45
Size-frac. chl. a, DOC, BP, size-frac. PP, phyto.
+ bact. abundance, DO2
50
DO2
65
Size-frac. chl. a, DOC, phyto. + bact.
abundance, DO2
150
DO2, DOC
D352 Cruise Report/114
13/06/2010
16/06/2010
16/06/2010
16/06/2010
17/06/2010
19/06/2010
19/06/2010
19/06/2010
20/06/2010
30
SW3
38
40
45
NE2
NE6
46
50
51
52
53
3.5
NCP
33
NCP
Surf
DO2
15
DO2
25
DO2
29
DO2
33
DO2
35
DO2
40
DO2
50
DO2
120
DO2
Surface
BP kinetics
DCM
BP kinetics
Surface
BP kinetics
DCM
BP kinetics
Surface
Bact. abundance
BP diurnal, bulk PP
DCM
Bact. abundance
BP diurnal, bulk PP
3
DOC
10
DOC
20
DOC
30
DOC
35
DOC
40
DOC
70
DOC
135
DOC
2
DOC
20
DOC
30
DOC
45
DOC
55
DOC
65
DOC
100
DOC
150
DOC
2
DOC
10
DOC
20
DOC
35
DOC
45
DOC
62
DOC
90
DOC
155
DOC
3
Size-frac. chl. a, DOC, BP, size-frac. PP, phyto.
SW5
+ bact. abundance, DO2
D352 Cruise Report/115
10
Size-frac. chl. a, DOC, BP, size-frac. PP, phyto.
+ bact. abundance, DO2
18
Size-frac. chl. a, DOC, BP, size-frac. PP, phyto.
+ bact. abundance, DO2
22
Size-frac. chl. a, DOC, BP, size-frac. PP, phyto.
+ bact. abundance, DO2
25
DO2
30
Size-frac. chl. a, DOC, BP, size-frac. PP, phyto.
+ bact. abundance, DO2
40
DO2
60
Size-frac. chl. a, DOC, BP, size-frac. PP, phyto.
+ bact. abundance, DO2
20/06/2010
20/06/2010
20/06/2010
24/06/2010
54
SW5
55
56
58
180
DO2, DOC
Surface
NCP
24
NCP
45
Phyto. abundance
80
Phyto. abundance
120
Phyto. abundance
160
Phyto. abundance
Surface
DOC
8
DOC
20
DOC
30
DOC
50
DOC
100
DOC
200
DOC
300
DOC
5
DOC
20
DOC
30
DOC
60
DOC
100
DOC
150
DOC
300
DOC
400
DOC
2
Size-frac. chl. a, DOC, NCP, BP, size-frac. PP,
Irish Sea
phyto. + bact. abundance, DO2
15
Size-frac. chl. a, DOC, BP, size-frac. PP, phyto.
+ bact. abundance, DO2
D352 Cruise Report/116
30
Size-frac. chl. a, DOC, BP, size-frac. PP, phyto.
+ bact. abundance, DO2
35
Size-frac. chl. a, DOC, NCP, BP, size-frac. PP,
phyto. + bact. abundance, DO2
40
50
DO2, DOC
Size-frac. chl. a, DOC, phyto. + bact.
abundance, DO2
70
DO2, DOC
80
Size-frac. chl. a, DOC, phyto. + bact.
abundance, DO2
90
DO2
D352 Cruise Report/117
16. Phosphorus Dynamics (Clare Davis)
Dissolved organic matter (DOM) cycling was investigated through a detailed study of phosphorus
dynamics. As the most labile component of DOM, phosphorus gives a good indication of how the
bioavailable DOM pool is exchanged between respective nutrient pools (dissolved inorganic, organic and
particulate) and how bioavailability may vary through the water column.
Together, the measurements taken can indicate the relative turnover times of the dissolved organic
phosphorus (DOP) pool resolved through the water column and associate observed remineralisation with
the responsible planktonic communities. These results can potentially indicate the proportion of labile DOM
mixed below the thermocline.
Bulk dissolved organic phosphorus (DOP)
Samples from 9 depths were collected at pre-dawn CTDs and also during both transects. Samples were
UV oxidised for 2 hours using a Metrohm UV oxidiser and analysed for total dissolved phosphorus using a
Bran and Luebbe Quaatro 5-channel autoanalyser on board. The DOP fraction was calculated to be the
difference between phosphate concentrations determined before and after UV oxidation (limit of detection
0.02 mM).
Enzyme hydrolysable phosphorus (EHP)
Samples were spiked with commercially available enzyme mixtures and incubated in the dark at ambient
room temperature overnight. The difference between the phosphate concentration measured before and
after incubation was taken to be the relevant DOP fraction hydrolysable by respective enzymes. The labile
phosphomonoester and phosphodiester pools were determined through addition of alkaline phosphatase
and phosphdiesterase (Sigma Aldrich), respectively. Phytase (Sigma Aldrich) was used to determine the
less labile fraction of bioavailable DOP. After the incubation period had elapsed, samples were frozen at 20°C for later analysis in the laboratory.
Alkaline phosphatase activity (APA)
Samples were spiked with the commercially available enzyme substrate methylumbelliferyl phosphate
(Sigma Aldrich) and incubated on deck at depth-corrected ambient light and sea surface temperature for up
to 12 hours. Upon hydrolysis of the phosphomonoester bond, facilitated by the enzyme alkaline
phosphatase present in the sample, a fluorescent compound is released – methylumbelliferone. The
change in sample fluorescence was measured at regular intervals throughout the incubation using a Turner
10 AU fluorometer, thus allowing the rate of phosphomonoester hydrolysis to be determined.
D352 Cruise Report/118
Enzyme labelled fluorescence (ELF)
In accompaniment to APA and EHP assays, up to 1 L of sample was filtered from each depth. Once
filtration was completed, the filter was transferred to a petri dish and incubated with the commercially
available enzyme substrate ELF-97 (Molecular Probes). This enzyme produces a compound that binds to
the enzyme active site and fluoresces green when viewed under an epifluorescent microscope later in the
laboratory. Thus, the origins of bulk APA can be identified.
Particulate organic phosphorus
At each depth, 1 L of sample was filtered onto GFF and stored at -20°C for later analysis of particulate
phosphorus in the laboratory. This serves as a proxy for biomass, but more importantly indicates over time
how phosphorus may be transferred between the particulate and dissolved pools.
Cast
number
Niskin
Depth
DOP EHP
APA
ELF
POP
2
9
5
X
X
X
X
X
6
3
60
X
X
X
X
X
6
6
48
X
X
X
X
X
6
10
38
X
X
X
X
X
6
13
33
X
X
6
15
20
X
X
6
17
2
X
X
X
X
X
17
3
55
X
X
X
X
X
17
6
43
X
X
X
X
X
17
9
40
X
X
X
X
X
17
13
30
X
17
15
15
X
17
17
3
X
29
3
65
X
X
X
X
X
29
6
45
X
X
X
X
X
29
10
36
X
X
X
X
X
29
15
25
X
29
17
15
X
29
19
2
X
X
38
1
120
X
X
38
2
50
X
38
4
40
X
X
38
5
35
X
X
X
X
X
X
X
X
X
X
X
X
X
X
X
X
X
D352 Cruise Report/119
38
7
33
X
X
38
8
29
X
X
X
X
X
38
12
25
X
X
X
X
X
38
14
15
X
X
X
X
X
38
16
2
X
40
1
125
X
40
3
80
X
40
5
50
X
40
7
45
X
40
9
40
X
40
11
35
X
40
13
30
X
40
15
20
X
40
17
3
X
41
1
130
X
41
3
80
X
41
5
50
X
41
7
45
X
41
9
40
X
41
11
35
X
41
13
30
X
41
15
20
X
41
17
3
X
42
1
120
X
42
3
80
X
42
5
45
X
42
7
40
X
42
9
35
X
42
11
30
X
42
13
20
X
42
15
10
X
42
17
2
X
43
1
85
X
43
3
50
X
43
5
40
X
43
7
30
X
43
9
22
X
X
D352 Cruise Report/120
43
11
17
X
43
13
2
X
44
1
90
X
44
3
50
X
44
5
30
X
44
7
26
X
44
9
24
X
44
11
15
X
44
13
10
X
44
15
2
X
50
1
135
X
50
3
70
X
50
5
40
X
50
7
35
X
50
9
30
X
50
11
20
X
50
13
10
X
50
15
3
X
51
1
150
X
51
3
100
X
51
5
65
X
51
7
55
X
51
9
45
X
51
15
20
X
51
19
2
X
52
1
155
X
52
3
90
X
52
5
62
X
52
7
45
X
52
9
35
X
52
11
20
X
52
13
10
X
52
15
2
X
53
1
180
X
53
3
60
X
53
4
40
X
53
6
30
X
X
X
X
X
X
X
X
X
D352 Cruise Report/121
53
7
25
X
53
9
22
X
53
13
18
X
53
15
10
X
53
17
2
X
55
5
300
X
55
7
200
X
55
9
100
X
55
11
50
X
55
13
30
X
55
15
20
X
55
17
8
X
55
19
2
X
56
9
400
X
56
11
300
X
56
14
150
X
56
15
100
X
56
16
60
X
56
18
30
X
56
19
20
X
56
21
5
X
X
X
X
X
X
X
X
X
D352 Cruise Report/122
17. D352 Satellite Imagery and Underway Chlorophyll Sampling (Jo Hopkins)
The following 1km resolution images were sent daily from NEODAAS Plymouth:
•
Daily AVHRR (Advanced Very High Resolution Radiometer) SST (°C)
•
MODIS in-water diffuse chlorophyll-a concentration calculated using the OCM3 algorithm (mg.m-3)
•
MODIS in-water diffuse attenuation coefficient at 490nm (m-1)
•
MERIS in-water chlorophyll-a concentration calculated using the case 1 algorithm (mg.m-3)
The following MODIS and AVHRR images from 15th June 2010 show the upwelling of cold water along the
shelf break and associated elevated chlorophyll-a concentration. The black dots mark the positions of
moorings IM1, IM2 and IM3. Black contours are the 150, 500 and 1000m isobaths.
D352 Cruise Report/123
128 samples from the ships underway nontoxic supply were taken approximately every half hour between
10.30 and 15:30 BST to determine chlorophyll concentration. 200ml was passed through a 25mm GFF
filter. The filter was left in 8ml of 90% acetone at approx. 4°C for at least 24 hours. Chlorophyll
concentration was subsequently determined using a Turner Designs – 700 Fluorometer (serial # 0315). The
following table lists the dates, times, latitudes and longitudes of each sample.
Time
Date
Jday
(BST)
Station
Latitude
Longitude
03/06/2010
154
11:17
uw1
53.72
-5.19
03/06/2010
154
15:14
uw2
53.50
-5.50
04/06/2010
155
10:54
uw3
50.12
-8.05
04/06/2010
155
11:58
uw4
49.97
-8.25
04/06/2010
155
13:26
uw5
49.76
-8.54
04/06/2010
155
14:31
uw6
49.60
-8.74
05/06/2010
156
10:51
uw7
49.41
-8.98
05/06/2010
156
12:27
uw8
49.47
-8.82
05/06/2010
156
13:35
uw9
49.45
-8.84
06/06/2010
157
10:05
uw10
49.42
-9.01
06/06/2010
157
11:02
uw11
49.43
-9.01
06/06/2010
157
12:42
uw12
49.52
-8.87
07/06/2010
158
10:02
uw13
49.43
-9.00
07/06/2010
158
10:55
uw14
49.42
-9.00
D352 Cruise Report/124
07/06/2010
158
11:52
uw15
49.40
-9.00
07/06/2010
158
13:42
uw16
49.45
-8.96
08/06/2010
159
10:01
uw17
49.42
-9.00
08/06/2010
159
10:57
uw18
49.42
-9.00
08/06/2010
159
12:48
uw19
49.41
-9.01
09/06/2010
160
09:50
uw20
49.37
-9.07
09/06/2010
160
11:42
uw21
49.42
-9.00
09/06/2010
160
12:37
uw22
49.42
-8.98
09/06/2010
160
13:45
uw23
49.43
-9.00
10/06/2010
161
10:49
uw24
49.41
-9.01
10/06/2010
161
13:44
uw25
49.39
-9.00
11/06/2010
162
10:00
uw26
49.41
-8.97
11/06/2010
162
10:52
uw27
49.40
-9.02
11/06/2010
162
12:39
uw28
49.43
-8.99
11/06/2010
162
13:40
uw29
49.45
-9.00
12/06/2010
163
09:39
uw30
49.54
-8.78
12/06/2010
163
10:07
uw31
49.58
-8.72
12/06/2010
163
11:03
uw32
49.67
-8.59
12/06/2010
163
12:16
uw33
49.79
-8.69
12/06/2010
163
13:12
uw34
49.76
-8.81
12/06/2010
163
14:17
uw35
49.67
-8.94
12/06/2010
163
14:55
uw36
49.62
-9.01
13/06/2010
164
09:39
uw37
49.08
-9.45
13/06/2010
164
13:07
uw38
49.13
-9.52
13/06/2010
164
13:44
uw39
49.16
-9.64
13/06/2010
164
14:03
uw40
49.18
-9.70
14/06/2010
165
09:40
uw41
49.10
-9.45
14/06/2010
165
06:43
uw42
49.10
-9.44
14/06/2010
165
10:59
uw43
49.10
-9.44
14/06/2010
165
11:28
uw44
49.11
-9.46
14/06/2010
165
12:02
uw45
49.11
-9.47
14/06/2010
165
13:20
uw46
49.12
-9.48
14/06/2010
165
14:12
uw47
49.12
-9.47
15/06/2010
166
09:59
uw48
49.48
-9.07
15/06/2010
166
10:24
uw49
49.52
-9.12
15/06/2010
166
11:28
uw50
49.62
-9.26
15/06/2010
166
11:58
uw51
49.67
-9.33
15/06/2010
166
12:29
uw52
49.72
-9.41
15/06/2010
166
13:12
uw53
49.74
-9.53
15/06/2010
166
13:59
uw54
49.66
-9.64
15/06/2010
166
14:28
uw55
49.61
-9.72
15/06/2010
166
09:08
mm1
49.40
-8.95
15/06/2010
166
09:08
mm2
49.40
-8.95
16/06/2010
167
09:28
uw56
49.81
-8.37
16/06/2010
167
09:55
uw57
49.87
-8.28
D352 Cruise Report/125
16/06/2010
167
10:21
uw58
49.93
-8.20
16/06/2010
167
10:55
uw59
49.97
-8.14
16/06/2010
167
11:29
uw60
49.16
-8.10
16/06/2010
167
12:09
uw61
50.08
-7.98
16/06/2010
167
12:30
uw62
50.12
-7.91
16/06/2010
167
12:59
uw63
50.15
-7.87
16/06/2010
167
13:23
uw64
50.15
-7.87
16/06/2010
167
14:03
uw65
50.23
-7.75
16/06/2010
167
14:38
uw66
50.30
-7.63
17/06/2010
168
09:48
uw67
49.42
-9.00
17/06/2010
168
10:22
uw68
49.42
-9.01
17/06/2010
168
10:59
uw69
49.40
-9.02
17/06/2010
168
11:29
uw70
49.40
-9.03
17/06/2010
168
12:01
uw71
49.40
-9.04
17/06/2010
168
12:30
uw72
49.40
-9.05
17/06/2010
168
13:01
uw73
49.40
-9.06
17/06/2010
168
13:30
uw74
49.40
-9.08
17/06/2010
168
13:57
uw75
49.40
-9.09
17/06/2010
168
14:35
uw76
49.40
-9.11
18/06/2010
169
09:26
uw77
49.47
-8.82
18/06/2010
169
09:59
uw78
49.46
-8.82
18/06/2010
169
10:29
uw79
49.46
-8.83
18/06/2010
169
10:57
uw80
49.46
-8.83
18/06/2010
169
11:30
uw81
49.39
-8.90
18/06/2010
169
12:01
uw82
49.37
-8.92
18/06/2010
169
12:25
uw83
49.37
-8.93
18/06/2010
169
13:01
uw84
49.36
-8.92
18/06/2010
169
13:31
uw85
49.37
-8.91
18/06/2010
169
14:03
uw86
49.37
-8.92
18/06/2010
169
14:30
uw87
49.37
-8.92
19/06/2010
170
09:35
uw88
49.42
-8.98
19/06/2010
170
10:00
uw89
49.42
-8.97
19/06/2010
170
10:27
uw90
49.42
-8.99
19/06/2010
170
11:02
uw91
49.42
-8.96
19/06/2010
170
11:29
uw92
49.41
-8.98
19/06/2010
170
11:58
uw93
49.41
-8.98
19/06/2010
170
12:29
uw94
49.41
-8.98
19/06/2010
170
12:59
uw95
49.42
-8.99
19/06/2010
170
13:29
uw96
49.41
-8.99
19/06/2010
170
14:04
uw97
49.41
-9.00
19/06/2010
170
14:38
uw98
49.36
-9.07
20/06/2010
171
09:06
uw99
48.83
-10.01
20/06/2010
171
09:39
uw100
48.84
-10.00
20/06/2010
171
10:28
uw101
48.84
-9.99
20/06/2010
171
10:59
uw102
48.78
-10.05
D352 Cruise Report/126
20/06/2010
171
11:32
uw103
48.69
-10.13
20/06/2010
171
12:35
uw104
48.62
-10.22
20/06/2010
171
13:32
uw105
48.59
-10.26
20/06/2010
171
14:32
uw106
48.46
-10.45
21/06/2010
172
09:38
uw107
48.28
-9.57
21/06/2010
172
09:59
uw108
48.29
-9.57
21/06/2010
172
10:27
uw109
48.34
-9.62
21/06/2010
172
11:00
uw110
48.40
-9.67
21/06/2010
172
11:49
uw111
48.48
-9.75
21/06/2010
172
12:22
uw112
48.54
-9.80
21/06/2010
172
12:47
uw113
48.54
-9.88
21/06/2010
172
13:16
uw114
48.54
-9.97
21/06/2010
172
13:51
uw115
48.55
-10.08
21/06/2010
172
14:16
uw116
48.56
-10.16
21/06/2010
172
14:45
uw117
48.60
-10.25
22/06/2010
173
09:30
uw118
49.30
-9.19
22/06/2010
173
10:07
uw119
49.35
-9.10
22/06/2010
173
10:34
uw120
49.40
-9.02
22/06/2010
173
11:02
uw121
49.45
-8.94
22/06/2010
173
11:30
uw122
49.50
-8.87
22/06/2010
173
11:58
uw123
49.55
-8.79
22/06/2010
173
12:30
uw124
49.61
-8.71
22/06/2010
173
12:56
uw125
49.66
-8.64
22/06/2010
173
13:30
uw126
49.72
-8.54
22/06/2010
173
13:59
uw127
49.77
-8.47
22/06/2010
173
14:27
uw128
49.82
-8.39
D352 Cruise Report/127
18. Phytoplankton taxonomy and photophysiology (Anna Hickman, Mark Moore, Jo
Hopkins)
Introduction.
Phytoplankton growth in the oceans is fundamentally dependent on the availability of 2 key resources,
nutrients and light. In shelf seas, the interaction of physical and biogeochemical processes results in a
dynamic environment where the availability of these resources varies in both time and space. In highly
stratified shelf sea regions, the deep chlorophyll maximum and surface layer above represent very different
environments, the former characterized by very low mean light levels, but a potential supply of nutrients,
while the latter has higher mean light levels, but generally low nutrient availability. Our previous work in
such shelf sea regions has indicated strong vertical gradients in both photoacclimation (physiological
acclimation to ambient light) and taxonomy between natural populations living in the surface and DCM
(Moore et al. 2006; Hickman et al. 2009). Despite a general understanding of the underlying mechanisms
behind such vertical ecophysiological gradients, many details of the processes involved remain unclear.
Additionally, we have previously observed less well understood physiological variability in these
environments, so called ‘Ek-independent’ variability (Behrenfeld et al. 2004, J. Phycol, 40: 2-25). A series of
phytoplankton physiological experiments and measurement of associated variables including detailed
taxonomic and spectral light absorption characteristics was thus performed on D352. The development of
new techniques should enable us to investigate the ecophysiology of natural phytoplankton populations in a
shelf sea environment at a previously unprecedented level.
CTD sampling: (Anna Hickman, Mark Moore)
The following measurements and samples were collected from CTD casts:
Bulk Chlorophyll-a (Chl-a): Total phytoplankton chlorophyll-a was measured following the fluorescence
method of Welschmeyer (1984). Water samples (100 or 200 ml) were filtered onto GFF filters and 8ml of
90% Acetone solution was added. Samples were left in the fridge to extract for >24hrs before measurement
on a Turner A-10 Fluorometer on board (see the detailed section below on Chl-a calibration). Values in this
report (and subsequently those used for CTD fluorometer calibrations quoted herein) are provisional,
subject to further calibration of the chl-a standard on return to the lab.
Pigments (HPLC): Water samples (1000-2000 ml) were filtered onto GFF filters and stored in -80’C freezer
for identification of pigments using High Performance Liquid Chromatography (HPLC) on return to the lab.
Phytoplankton Light Absorption (PABS): Water samples (1000-2000 ml) were filtered only GFF filters
and stored in a -80oC freezer for analysis on return to the lab. Analysis will be by spectrophotometry,
providing the wavelength-resolved light absorption by the phytoplankton.
Species composition by Analytical Flow Cytometry (AFC): Water samples (1.9 ml) were added to prespiked vials containing 100 l of a 20% Gluteraldehyde solution and stored in a -80oC freezer. On return to
the lab, quantification of pico-phytoplankton will be obtained by Analytical Flow Cytometry (AFC).
D352 Cruise Report/128
Species composition by microscope counts (Lugols): Water samples (100 ml) were added to glass
bottles containing 2 ml Lugols iodine solution. Microscope analysis of large phytoplankton will be carried
out on return to the lab.
Proteins: Water samples (around 10 litres) were filtered onto GFF filters and flash frozen in liquid nitrogen
before storage in -80oC freezer. On return to the lab, proteins relevant to light absorption and
photosynthesis will be analysed using quantitative immunoblotting.
Fast Repetition Rate Fluorometry (FRRF): Photophysiological parameters (Fv, Fm, PSII, PSII) and / or
the photophysiological response to incremental light dosage, were measured on a Mk II Chelsea
Instruments Fast Repetition Rate fluorometer (FRRf) (e.g. see Moore et al. 2006).
14
C Photosynthesis vs. Irradiance curves (PvsE): Water samples from each of (typically) two depths
were sub-sampled into 18 bottles (15 opaque and 3 darkened). Each bottle was spiked with 4.63 Ci 14C
(as a buffered sodium bicarbonate solution, NaH14CO3) and incubated in a light gradient for 2 hours while
chilled to the sea surface temperature. After incubation, samples were filtered onto 0.2 m polycarbonate
filters, which were then fumed with concentrated HCl for 30 minutes. Filters were then placed in scintillation
vials and 5 ml UltimaGold scintillation cocktail was added. After at least 12 hours, samples were analysed
using the on-board scintillation counter. Spike activity was checked by removing 100 l from 3 of the spiked
bottles (prior to incubation) and adding to 300 l of phenylethylamine. 5 ml of UltimaGold was then added
to these standards, which were then left in the dark for 24 hours before analysing on the scintillation
counter. The working stock was made up by taking 200 l of initial stock (1 mCu ml-1) and adding it to 1.96
ml of filtered sea-water, thus generating 2.16 ml of a 92.6 Ci solution.
Table 1. CTD sampling. Number of depths sampled for taxonomy and photophysiological measurements.
CTD
Chl-a
AFC
HPLC
PABS
FRRF
Proteins
PvsE
2
5
5
5
6
10
10
7
9
17
6
6
2
2
2
9
6
6
2
2
2
9
9
6
6
2
2
2
2
26
10
10
7
7
29
10
10
6
6
2
2
2
2
38
9
9
6
6
2
2
2
2
40
9
6
5
41
9
5
5
42
9
5
5
43
9
5
5
44
9
5
5
45
9
5
5
47
4
4
4
4
4
4
2
SEM
Lugols
2
D352 Cruise Report/129
48
6
6
50
8
8
8
51
10
10
10
52
9
9
9
53
9
9
54
4
4
55
10
9
1
9
56
9
9
1
9
57
2
2
58
6
6
2
6
6
2
2
4
2
2
2
2
2
2
2
7
Underway Sampling: (Jo Hopkins)
Bulk Chl-a measurements were routinely collected form the ship’s underway non-toxic supply. Samples
were generally collected every half an hour between the hours of 10:00 and 14:00 (ship time).
Pump Sampling: (Anna Hickman, Mark Moore)
On 17th June, a hose attached to a weighted cable was lowered to the base of the thermocline and water
was continuously pumped to the wet lab using a peristaltic pump. A temperature logger was attached at the
end of the hose to monitor temperature at the in-flow. A Mk I FRR fluorometer was set up at the out-flow to
continuously monitor Fm, the maximum fluorescence, a relative indicator of Chl-a. Flow rate was estimated
by timing the filling of a 20 liter carbuoy. The time taken for water to travel from the in-flow at depth to the
out-flow in the lab was estimated at 7 minutes. The outflow was raised in increments of 1 m after which
time we waited 7 mins before starting to collect water.
5 litres were collected at each depth and sub-samples were taken for the following measurements:
Chl-a, AFC, HPLC, PABS, Lugols and nutrients. In addition, samples were collected for particulate carbon
and nitrogen (POC/N). For this, water samples (1000 ml) were filtered onto ash dried GFFs and stored in
the -80’C freezer for analysis on return to the lab. Given the 7 minute delay between sampling, the
filtrations and taking of the various samples was achieved as we went along. There was no need for
sample storage.
Sample times and initial data are shown in Table 1 and Figs. 1 and 2. The experiment setup worked
well, and the pump performed excellently. However, despite the relatively high-resolution of sampling
throughout the thermocline, samples did not resolve the subsurface chlorophyll maximum, or nitrate
gradient, very well (as evidenced by the gap in the Fm values in the lower-left panel in Figure 1).
Subsequently, although in practice the approach approach worked, some more consideration should be
given to the sampling strategy in order to successfully resolve the region of interest.
D352 Cruise Report/130
Table 2. Pump sampling times and initial data. In situ temperature was estimated from that recorded by
the logger at the in-flow, 7 minutes prior to sampling. Fm was monitored at the out-flow at the time of
sampling. Nitrate was measured from the water samples.
Sample
Sample
Sample
Depth
Temp.
Fm
Nitrate
#
Time Start
Time End
(m)
(oC)
(a.u.)
(M)
P1
09:28
09:30
45.15
9.99
400
8.06
P2
09:50
09:51
43.72
9.80
169
8.80
P3
10:04
10:06
42.42
9.83
255
8.52
P4
10:17
10:19
40.94
9.80
174
9.04
P5
10:48
10:49
41.01
9.83
242
8.87
P6
11:03
11:05
40.08
9.80
210
8.81
P7
11:13
11:15
39.16
10.35
1962
7.40
P8
11:24
11:26
38.84
9.93
606
7.43
P9
11:56
11:58
37.36
9.96
530
7.65
P10
12:09
12:11
36.71
9.90
424
8.05
P11
12:22
12:24
36.13
10.61
1471
3.38
P12
12:34
12:36
34.38
10.32
1115
5.47
P13
12:48
12:50
33.62
12.70
501
0.02
P14
13:03
13:05
32.52
11.98
1400
0.03
P15
13:15
13:16
32.19
13.09
482
0.01
P16
13:26
13:28
30.84
12.15
708
0.01
P17
13:40
13:41
29.78
13.25
429
0.01
P18
13:53
13:55
28.72
13.93
334
0.01
P19
14:09
14:10
27.39
14.85
227
0.01
P20
14:19
14:21
26.85
14.66
229
0.01
P21
14:32
14:33
26.04
14.81
242
0.02
P22
14:43
14:45
24.88
14.09
307
0.03
P23
14:53
14:55
24.25
15.01
207
0.02
P24
15:04
15:06
23.01
15.41
160
0.02
P25
15:16
15:18
21.85
15.01
219
0.02
D352 Cruise Report/131
Figure 1. Initial data from pumped sampling. Blue lines indicate continuous monitoring; circles indicate
water sample properties.
Figure 2. Nitrate (Nitrate + Nitrite, N+N) and Fm against temperature for pumped water samples.
Chromatic Competition Experiments: (Anna Hickman)
Incubation experiments were carried out to investigate the response of the phytoplankton community to
light of different spectral qualities. Water was collected from the base of the thermocline and incubated in
light fields of different spectral composition. Shifts in phytoplankton species and photophysiology as a
response to the different light fields, were investigated.
CTD Sampling: Water from each of 14 Niskin bottles from the CTD rosette were sampled into 36 x 2 litre
incubation bottles (about 150 ml from each Niskin was added to each incubation bottle).
D352 Cruise Report/132
Incubations: For each experiment, 3 different light qualities were tested (Green, Turquoise, Blue). All
treatments yielded the same total PAR. 6 incubators were used so that experiments were carried out in
duplicate. Each incubator housed 6 incubation bottles. Incubations were for a duration of 4 days. Sampling
was carried out after 0, 24, 48 and 96 hours, with two incubation bottles removed for each time point.
Measurements: Samples were collected for Chl-a, nutrients, FRRF, HPLC, PABS, AFC and Lugols.
Experiments: A total of three 4-day incubation experiments were carried out. The first experiment was
carried out under low-light (PAR around 0.5 % surface irradiance). The second experiment, under high-light
(PAR around 10 % surface irradiance), and the third under intermediate light level (PAR around 5 %
surface irradiance).
Calibration of on-board fluorometer for Chlorophyll-a measurements: (Jo Hopkins, Mark Moore, Anna
Hickman)
Chlorophyll-a concentrations were obtained from fluorescence measured on board using a Turner A-10
Fluorometer (Welschmeyer 1984). The instrument was calibrated against chlorophyll-a standards of known
concentration on 11th June. Daily fluoresence readings of a solid standard were also recorded. There was
considerable instrument drift during the cruise, as evidenced by the readings for the solid standards (Figure
4).
Figure 3. Fluorescence readings for ‘high’ and ‘low’ solid standards during the cruise.
To account for the drift of the instrument over time, chlorophyll-a values (BotCHL) were obtained from the
fluorometer readings as follows:
BotCHL = (Reading - AcetoneBlank) × Rf × (AcetoneVolume/FilteredVolume) / RHL
D352 Cruise Report/133
Where Rf is the instrument response factor obtained on 11th June and RHL is a daily correction factor for
instrument drift:
RHL = [ Hstart / Hcalib + Lstart/Lcalib ] /2
Hstart and Lstart are the fluorescence readings of the high and low solid standards measured each day, and
Hcalib and Lcalib fluorescence readings of the high and low solid standards measured on 11th June.
D352 Cruise Report/134
19. SurfMet Data (Tom Millgate)
Throughout the duration of the cruise, the ship mounted Surfmet system collected readings every 30
seconds. Information about the instruments, mounting location and calibration dates can be found in the
technical section of the cruise report. The observations recorded consisted of:
•
Ships heading, speed and position
•
Absolute wind direction and speed
•
Relative wind direction and speed
•
Air temperature
•
Air pressure
•
Humidity
•
Fluorescence
•
Transmittance
•
Water column depth
•
Sea surface temperature
•
Salinity
•
Light sensors
Data Processing
Ships heading, speed and position
The ship’s heading and speed were not filtered, and only two of the ships positions were removed as they
lay outside the ranges 45oN to 60oN and 15oW to 0oW.
Absolute and relative wind direction and speed
Absolute wind directions of 0o and absolute wind speeds of 0 m/s were removed as these appeared as
anomalous readings. The relative wind directions and wind speeds which corresponded to the removed
absolute readings were removed. Relative wind speeds of either 0 m/s or greater than 50 m/s were
removed.
Air temperature and pressure
Temperatures outside the range of 5
to 30
were removed. Noise was removed from the results by
smoothing the readings with a moving window, 250 points in length. Results which lay more than 2
standard deviations from the block mean were removed. Air pressure readings outside the range 900
mbars to 2000 mbars were removed.
Humidity
Humidity readings outside the range 50% to 100% were removed as anomalous results.
D352 Cruise Report/135
Fluorescence and Transmittance
Fluorescence readings outside of the range 0V to 5V were removed. The Transmittance data has not been
used on the cruise and has therefore not been altered.
Water depth
Depth readings were removed if they were less than expected for the region. The readings were also
smoothed to remove noise in a similar manner to air temperature.
Sea surface temperature
Sea surface temperatures of less than 1
were removed and the remaining readings were smoothed using
the same technique as air temperature.
Salinity
Surfmet salinity readings which lay outside the range 25-50 were removed as anomalous results. The
salinity readings were calibrated using water samples collected periodically throughout the cruise from the
ships non-toxic underway supply. Sixteen samples, between midday 21/06/10 and midday 23/06/10, were
omitted from calibration as they had not been left in the constant temperature lab for 24 hours prior to
processing. This led to higher differences between Surfmet and underway salinity readings than those
samples which were in the constant temperature lab for at least 24 hours. These are indicated by the circle
in the residual plot below. A further five samples were also omitted from the calibration as they did not pass
the following criteria:
The difference between sample and Surfmet salinities must lie within one standard deviation of the mean of
the differences. This resulted in the following calibration which was obtained by linear regression:
Surfmet salinity = 0.0085 + 0.9996 x sample salinity, R2=0.9996
D352 Cruise Report/136
Residual plot of differences between Surfmet and underway salinity readings.
Surfmet Reading
Salinity Calibration
y = 0.9996x + 0.0085
35.8
35.6
35.4
35.2
35
34.8
34.6
34.4
34.2
34
35
35.2
35.4
35.6
35.8
Underway Reading
Surfmet salinity reading calibration plot.
Light sensors
PAR and TIR readings were taken on both port and starboard sides of the vessel. Readings of greater than
3000 mW/m2 were removed and the remaining readings were smoothed using the same technique as used
for air temperature.
Jonathan Sharples
28th October 2011
D352 Cruise Report/137