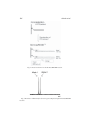
1
PCR Mutation Detection Protocols
2003.4.23
huangzhiman
For www.dnathink.org
METHODS IN MOLECULAR BIOLOGY
TM
John M. Walker, SERIES EDITOR
215. Cytokines and Colony Stimulating Factors: Methods and
Protocols, edited by Dieter Körholz and Wieland Kiess, 2003
214. Superantigen Protocols, edited by Teresa Krakauer, 2003
213. Capillary Electrophoresis of Carbohydrates, edited by Pierre
Thibault and Susumu Honda, 2003
212. Single Nucleotide Polymorphisms: Methods and Protocols,
edited by Piu-Yan Kwok, 2003
211. Protein Sequencing Protocols, 2nd ed., edited by Bryan John
Smith, 2003
210. MHC Protocols, edited by Stephen H. Powis and Robert W.
Vaughan, 2003
209. Transgenic Mouse Methods and Protocols, edited by Marten
Hofker and Jan van Deursen, 2002
208. Peptide Nucleic Acids: Methods and Protocols, edited by Peter
E. Nielsen, 2002
207. Human Antibodies for Cancer Therapy: Reviews and Protocols.
edited by Martin Welschof and Jürgen Krauss, 2002
206. Endothelin Protocols, edited by Janet J. Maguire and Anthony
P. Davenport, 2002
205. E. coli Gene Expression Protocols, edited by Peter E.
Vaillancourt, 2002
204. Molecular Cytogenetics: Protocols and Applications, edited
by Yao-Shan Fan, 2002
203. In Situ Detection of DNA Damage: Methods and Protocols,
edited by Vladimir V. Didenko, 2002
202. Thyroid Hormone Receptors: Methods and Protocols, edited
by Aria Baniahmad, 2002
201. Combinatorial Library Methods and Protocols, edited by
Lisa B. English, 2002
200. DNA Methylation Protocols, edited by Ken I. Mills and Bernie
H. Ramsahoye, 2002
199. Liposome Methods and Protocols, edited by Subhash C. Basu
and Manju Basu, 2002
198. Neural Stem Cells: Methods and Protocols, edited by Tanja
Zigova, Juan R. Sanchez-Ramos, and Paul R. Sanberg, 2002
197. Mitochondrial DNA: Methods and Protocols, edited by William
C. Copeland, 2002
196. Oxidants and Antioxidants: Ultrastructural and Molecular
Biology Protocols, edited by Donald Armstrong, 2002
195. Quantitative Trait Loci: Methods and Protocols, edited by
Nicola J. Camp and Angela Cox, 2002
194. Posttranslational Modifications of Proteins: Tools for Functional
Proteomics, edited by Christoph Kannicht, 2002
193. RT-PCR Protocols, edited by Joseph O’Connell, 2002
192. PCR Cloning Protocols, 2nd ed., edited by Bing-Yuan Chen
and Harry W. Janes, 2002
191. Telomeres and Telomerase: Methods and Protocols, edited
by John A. Double and Michael J. Thompson, 2002
190. High Throughput Screening: Methods and Protocols, edited
by William P. Janzen, 2002
189. GTPase Protocols: The RAS Superfamily, edited by Edward
J. Manser and Thomas Leung, 2002
188. Epithelial Cell Culture Protocols, edited by Clare Wise, 2002
187. PCR Mutation Detection Protocols, edited by Bimal D. M.
Theophilus and Ralph Rapley, 2002
186. Oxidative Stress Biomarkers and Antioxidant Protocols, edited by Donald Armstrong, 2002
185. Embryonic Stem Cells: Methods and Protocols, edited by
Kursad Turksen, 2002
184. Biostatistical Methods, edited by Stephen W. Looney, 2002
183. Green Fluorescent Protein: Applications and Protocols, edited
by Barry W. Hicks, 2002
182. In Vitro Mutagenesis Protocols, 2nd ed. , edited by Jeff
Braman, 2002
181. Genomic Imprinting: Methods and Protocols, edited by
Andrew Ward, 2002
180. Transgenesis Techniques, 2nd ed.: Principles and Protocols,
edited by Alan R. Clarke, 2002
179. Gene Probes: Principles and Protocols, edited by Marilena
Aquino de Muro and Ralph Rapley, 2002
178.`Antibody Phage Display: Methods and Protocols, edited by
Philippa M. O’Brien and Robert Aitken, 2001
177. Two-Hybrid Systems: Methods and Protocols, edited by Paul
N. MacDonald, 2001
176. Steroid Receptor Methods: Protocols and Assays, edited by
Benjamin A. Lieberman, 2001
175. Genomics Protocols, edited by Michael P. Starkey and
Ramnath Elaswarapu, 2001
174. Epstein-Barr Virus Protocols, edited by Joanna B. Wilson
and Gerhard H. W. May, 2001
173. Calcium-Binding Protein Protocols, Volume 2: Methods and
Techniques, edited by Hans J. Vogel, 2001
172. Calcium-Binding Protein Protocols, Volume 1: Reviews and
Case Histories, edited by Hans J. Vogel, 2001
171. Proteoglycan Protocols, edited by Renato V. Iozzo, 2001
170. DNA Arrays: Methods and Protocols, edited by Jang B.
Rampal, 2001
169. Neurotrophin Protocols, edited by Robert A. Rush, 2001
168. Protein Structure, Stability, and Folding, edited by Kenneth
P. Murphy, 2001
167. DNA Sequencing Protocols, Second Edition, edited by Colin
A. Graham and Alison J. M. Hill, 2001
166. Immunotoxin Methods and Protocols, edited by Walter A. Hall, 2001
165. SV40 Protocols, edited by Leda Raptis, 2001
164. Kinesin Protocols, edited by Isabelle Vernos, 2001
163. Capillary Electrophoresis of Nucleic Acids, Volume 2:
Practical Applications of Capillary Electrophoresis, edited by
Keith R. Mitchelson and Jing Cheng, 2001
162. Capillary Electrophoresis of Nucleic Acids, Volume 1:
Introduction to the Capillary Electrophoresis of Nucleic Acids,
edited by Keith R. Mitchelson and Jing Cheng, 2001
161. Cytoskeleton Methods and Protocols, edited by Ray H. Gavin, 2001
160. Nuclease Methods and Protocols, edited by Catherine H.
Schein, 2001
159. Amino Acid Analysis Protocols, edited by Catherine Cooper,
Nicole Packer, and Keith Williams, 2001
158. Gene Knockoout Protocols, edited by Martin J. Tymms and
Ismail Kola, 2001
157. Mycotoxin Protocols, edited by Mary W. Trucksess and Albert
E. Pohland, 2001
METHODS IN MOLECULAR BIOLOGY
TM
PCR Mutation
Detection Protocols
Edited by
Bimal D. M. Theophilus
Department of Haematology, Birmingham Children's Hospital
NHS Trust, Birmingham, UK
and
Ralph Rapley
Department of Biosciences, University of Hertfordshire,
Hatfield, UK
Humana Press
Totowa, New Jersey
© 2002 Humana Press Inc.
999 Riverview Drive, Suite 208
Totowa, New Jersey 07512
www.humanapress.com
All rights reserved. No part of this book may be reproduced, stored in a retrieval system, or transmitted in
any form or by any means, electronic, mechanical, photocopying, microfilming, recording, or otherwise
without written permission from the Publisher. Methods in Molecular Biology™ is a trademark of The
Humana Press Inc.
The content and opinions expressed in this book are the sole work of the authors and editors, who have
warranted due diligence in the creation and issuance of their work. The publisher, editors, and authors are
not responsible for errors or omissions or for any consequences arising from the information or opinions
presented in this book and make no warranty, express or implied, with respect to its contents.
This publication is printed on acid-free paper. ∞
ANSI Z39.48-1984 (American Standards Institute) Permanence of Paper for Printed Library Materials.
Production Editor: Jessica Jannicelli.
Cover design by Patricia F. Cleary.
For additional copies, pricing for bulk purchases, and/or information about other Humana titles, contact
Humana at the above address or at any of the following numbers: Tel.: 973-256-1699; Fax: 973-256-8341;
E-mail: [email protected]; or visit our Website: www.humanapress.com
Photocopy Authorization Policy:
Authorization to photocopy items for internal or personal use, or the internal or personal use of specific
clients, is granted by Humana Press Inc., provided that the base fee of US $10.00 per copy, plus US $00.25
per page, is paid directly to the Copyright Clearance Center at 222 Rosewood Drive, Danvers, MA 01923.
For those organizations that have been granted a photocopy license from the CCC, a separate system of
payment has been arranged and is acceptable to Humana Press Inc. The fee code for users of the Transactional
Reporting Service is [0-89603-617-0/02 $10.00 + $00.25].
Printed in the United States of America. 10 9 8 7 6 5 4 3 2 1
Library of Congress Cataloging in Publication Data
PCR mutation detection protocols / edited by Bimal d. Theophilus and Ralph Rapley.
p. cm. -- (Methods in molecular biology ; v. 187)
Includes bibliographical references and index.
ISBN 0-89603-617-0 (alk. paper)
1. Mutation (Biology)--Laboratory manuals. 2. Polymerase chain reaction--Laboratory
manuals. I. Theophilus, Bimal D. II. Rapley, Ralph. III. Methods in molecular biology
(Totowa, N.J.) ; v. 187.
QH462.A1 P37 2002
576.5'49--dc21
2002020563
Preface
As we enter the new millennium, it is tempting to speculate what may lie ahead
in future years, decades, and even centuries. In the area of the medical and life
sciences at least, we can speculate with perhaps more certainty than may be
possible in other areas. The exciting stage at which we find ourselves in the field
of molecular genetics means that we can be in no doubt that the application of
DNA technology will underlie many major advances in medicine in the coming
decades. While international research efforts seek to demonstrate the viability of
gene therapy, a major present application of human molecular genetics is the
identification of disease-causing mutations. This information may be used for
prenatal and carrier diagnoses, or to aid early detection and determine appropriate treatment of various disease states. While, traditionally, progress has been in
diseases caused by mutations in single genes, present research is unraveling the
underlying molecular basis of multigene disorders such as cancers, as well as
identifying increasing numbers of disease-associated single nucleotide polymorphisms (SNPs). In addition, the completion of the human genome project
will no doubt advance the pace of discovery even further, and also provide new
possibilities for diagnosis and treatment.
The rapidly increasing applications of DNA technology to disease diagnosis
has spawned numerous molecular diagnostic laboratories with an interest in
mutation detection methodology. Such laboratories would like the availability of
a single mutation method that is cheap, fast, with 100% detection in kilobase
lengths of DNA, and does not require specialized equipment or harmful reagents.
However, because no such universally applicable method exists, the present state
of play is a plethora of methodology, from which the user makes a choice based
on facilities, expertise, frequency of use, detection rate demanded, and whether
the application purpose is diagnostic (detection of the presence or absence of a
known mutation) or involves screening a candidate gene for a new unidentified
mutation.
PCR Mutation Detection Protocols comprises a comprehensive step-by-step
guide that brings together the large number of PCR-based mutation detection
methods described to date. Many of the earlier chapters describe the basic technology and techniques, e.g., the principles and methodology of PCR, labeling
DNA probes, restriction fragment length polymorphism analysis, and Southern
blotting. Further techniques are then presented covering both categories of
v
vi
Preface
mutation detection: detection of the presence of a known mutation and screening
for new mutations. The techniques presented in each involve different approaches
appropriate to different mutation types: point mutations (e.g., ASO-PCR, SSCP,
DGGE, chemical cleavage), deletions (multiplex PCR, FISH, blotting), nonsense mutations (PTT), etc. The new and exciting techniques of DNA array
analysis are also presented. The final chapters deal with different approaches to
DNA sequencing as a detection method in its own right, or for characterizing
mutations previously located by one of the other screening techniques. Recently
developed and experimental methods, such as conformation sensitive gel electrophoresis, are presented in addition to the more established methods.
Each chapter includes the underlying basis of the techniques, and enables the
reader to select the optimum method to use in relation to the above criteria.
Particularly useful are the Notes sections containing the small details necessary
for the successful execution of the technique. PCR Mutation Detection Protocols
is aimed at postgraduate scientists and researchers in diagnostic and research
laboratories. In addition, the basic techniques covered in the introductory chapters will ensure the book constitutes a fitting initiation to molecular techniques
for individuals in related medical and scientific fields.
Bimal D. M. Theophilus
Ralph Rapley
Contents
Preface ............................................................................................................. v
Contributors ..................................................................................................... ix
1 Agarose and Polyacrylamide Gel Electrophoresis
Andrea M. Guilliatt ................................................................................ 1
2 Internal Labeling of DNA Probes
Ralph Rapley and Bimal D. M. Theophilus ...................................... 13
3 End-Labeling of DNA Probes
Adrian J. Harwood ............................................................................... 17
4 Southern Blotting of Agarose Gels by Capillary Transfer
Ralph Rapley and Ian J. Williams ...................................................... 23
5 Restriction Fragment Length Polymorphism
Mohammad S. Enayat .......................................................................... 29
6 PCR: Principles, Procedures, and Parameters
Nicola Louise Jones ............................................................................ 37
7 Allele-Specific Oligonucleotide PCR
Elaine K. Green .................................................................................... 47
8 Long-Range PCR
Peter A. Davies and George Gray ...................................................... 51
9 Analysis of Nucleotide Sequence Variations by Solid-Phase
Minisequencing
Anu Wartiovaara and Ann-Christine Syvänen ................................. 57
10 Cycle Sequencing of PCR Products
G. K. Surdhar ........................................................................................ 65
11 Fluorescent In Situ Hybridization
Sara A. Dyer and Elaine K. Green ...................................................... 73
12 The Protein Truncation Test
Carol A. Hardy ...................................................................................... 87
13 Mutation Detection in Factor VIII cDNA from Lymphocytes
of Hemophilia A Patients by Solid Phase Fluorescent Chemical
Cleavage of Mismatch
Naushin H. Waseem, Richard Bagnall, Peter M. Green,
and Francesco Giannelli ............................................................... 109
vii
viii
Contents
14 Denaturing Gradient Gel Electrophoresis
Yvonne Wallis ..................................................................................... 125
15 Conformation-Sensitive Gel Electrophoresis
Ian J. Williams and Anne C. Goodeve ............................................. 137
16 SSCP/Heteroduplex Analysis
Andrew J. Wallace ............................................................................. 151
17 Cleavase® Fragment Length Polymorphism Analysis for Genotyping
and Mutation Detection
Laura Heisler and Chao-Hung Lee .................................................. 165
18 Automated Genotyping Using the DNA MassArray™ Technology
Christian Jurinke, Dirk van den Boom, Charles R. Cantor,
and Hubert Köster ......................................................................... 179
19 An Introduction to Bioinformatics
Henry Brzeski ..................................................................................... 193
Index ............................................................................................................ 209
Contributors
RICHARD BAGNALL • Division of Medical and Molecular Genetics, GKT
School of Medicine, Guy's Hospital, London, UK
HENRY BRZESKI • Windber Research Institute, Windber, PA
CHARLES R. CANTOR • Sequenom Inc., San Diego, CA
PETER A. DAVIES • Institute of Medical Genetics, University of Wales
College of Medicine, Cardiff, UK
SARA A. DYER • Regional Genetics Laboratory, Birmingham Women's
Hospital, Birmingham, UK
MOHAMMAD S. ENAYAT • Department of Haematology, Birmingham
Children's Hospital NHS Trust, Birmingham, UK
FRANCESCO GIANNELLI • Division of Medical and Molecular Genetics, GKT
School of Medicine, Guy's Hospital, London, UK
ANNE C. GOODEVE • Division of Genomic Medicine, Royal Hallamshire
Hospital, Sheffield, UK
GEORGE GRAY • Department of Clinical Chemistry, Birmingham Children's
Hospital NHS Trust, Birmingham, UK
ELAINE K. GREEN • Department of Psychiatry, Queen Elizabeth Psychiatric
Hospital, University of Birmingham, Birmingham, UK
PETER M. GREEN • Division of Medical and Molecular Genetics, GKT School
of Medicine, Guy's Hospital, London, UK
ANDREA M. GUILLIATT • Department of Haematology, Birmingham Children's
Hospital NHS Trust, Birmingham, UK
CAROL A. HARDY • Molecular Genetics Laboratory, Regional Genetics
Service, Birmingham Women's Hospital, Birmingham, UK
ADRIAN J. HARWOOD • MRC Laboratory for Molecular Cell Biology and
Department of Biology, University College London, London, UK
LAURA HEISLER • Third Wave Technologies, Inc., Madison, WI
NICOLA LOUISE JONES • Department of Haematology, Birmingham Children's
Hospital NHS Trust, Birmingham, UK
CHRISTIAN JURINKE • Sequenom Inc., San Diego, CA
HUBERT KÖSTER • Sequenom Inc., San Diego, CA
ix
x
Contributors
CHAO-HUNG LEE • Department of Pathology and Laboratory Medicine,
Indiana University School of Medicine, Indianapolis, IN
RALPH RAPLEY • Department of Biosciences, University of Hertfordshire,
Hatfield, UK
G. K. SURDHAR • Department of Haematology, Birmingham Children's
Hospital NHS Trust, Birmingham, UK
ANN-CHRISTINE SYVÄNEN • Department of Medical Sciences, Uppsala
University, Sweden
B IMAL D. M. THEOPHILUS • Department of Haematology, Birmingham
Children's Hospital NHS Trust, Birmingham, UK
DIRK VAN DEN BOOM • Sequenom Inc., San Diego, CA
ANDREW J. WALLACE • DNA Laboratory, Department of Medical Genetics, St.
Mary's Hospital, Manchester, UK
YVONNE WALLIS • Regional Genetics Laboratory, Birmingham Women's
Hospital, Birmingham, UK
ANU WARTIOVAARA • Department of Neurology, University of Helsinki,
Helsinki, Finland
NAUSHIN H. WASEEM • Division of Medical and Molecular Genetics, GKT
School of Medicine, Guy's Hospital, London
IAN J. WILLIAMS • Department of Haematology, Birmingham Children's
Hospital NHS Trust, Birmingham, UK
Agarose and Polyacrylamide Gel Electrophoresis
1
1
Agarose and Polyacrylamide Gel Electrophoresis
Andrea M. Guilliatt
1. Introduction
Electrophoresis through agarose or polyacrylamide gels is a standard method
used to separate, identify, and purify nucleic acids. The technique is simple,
rapid to perform and capable of resolving fragments that differ by as little as
0.2% in size. Electrophoresis occurs under the influence of an electric field:
Charged molecules such as nucleic acids migrate in the direction of the electrode having the opposite charge (anode). The electrophoretic mobility of
nucleic acids is determined by a number of parameters, but molecules of linear
double-stranded DNA migrate through gel matrices at rates that are inversely
proportional to the log10 of the number of base pairs (1) and therefore larger
molecules migrate more slowly because of the greater frictional drag (see
Note 1). Other factors affecting electrophoretic mobility include the pK value,
base composition, concentration of gel matrix, composition and ionic strength
of the electrophoresis buffer, temperature and the use of intercalating dyes such
as ethidium bromide.
The matrix used for electrophoresis should have adjustable but regular pore
sizes and be chemically inert, and the choice of which gel matrix to use depends
primarily on the sizes of fragments being separated. Agarose gels are the most
popular medium for the separation of moderate and large-sized nucleic acids
and have a wide range of separation but a relatively low resolving power.
Polyacrylamide gels are most effective for separating smaller fragments, and
although the gels are generally more difficult to prepare and handle, they have
three major advantages over agarose gels. They have a greater resolving power,
can accommodate larger quantities of DNA without significant loss in resolution, and the DNA recovered from polyacrylamide gels is extremely pure.
From: Methods in Molecular Biology, vol. 187: PCR Mutation Detection Protocols
Edited by: B. D. M. Theophilus and R. Rapley © Humana Press Inc., Totowa, NJ
1
2
Guilliatt
Two electrophoresis buffers are commonly used and contain EDTA and
Tris-acetate (TAE) or Tris-borate (TBE) at a concentration of approx 50 mM.
For historical reasons, TAE is the most commonly used buffer for agarose gel
electrophoresis, but its buffering capacity is low and may become exhausted
during extended electrophoresis. TBE is slightly more expensive, but it offers
significantly higher buffering capacity. Although the resolving power of the
buffers is almost identical, double-stranded linear DNA migrates approx 10%
faster in TAE than in TBE. Electrophoresis buffers are routinely prepared as
concentrated solutions and stored at room temperature (see Note 2).
The most convenient method for visualizing DNA in agarose and polyacrylamide gels is by staining with the fluorescent dye ethidium bromide (3,8diamino-6-ethyl-5-phenyl-phenanthridium bromide), which contains a fixed
planar group that intercalates between the stacked bases of the DNA (2). The
fixed position and the close proximity to the bases causes the bound dye to
display an increased fluorescent yield compared to that of the free dye in solution. Ultraviolet (UV) radiation at a range of 260–360 nm is absorbed by the
DNA and transmitted to the dye, and the energy is re-emitted at 590 nm in the
red–orange region of the visible spectrum. Because the fluorescent yield of
ethidium bromide: DNA complexes is greater than that of unbound dye, small
amounts of DNA can be detected in the presence of free ethidium bromide in
the gel. Ethidium bromide promotes damage of the nucleic acids when viewed
under UV light (photonicking); therefore, if the nucleic acid is to be used in
reactions following visualization, the gel should be viewed using long-wavelength UV light (300 nm).
1.1. Agarose Gel Electrophoresis
Agarose is a linear polymer extracted from seaweed that forms a gel matrix
by hydrogen-bonding when heated in a buffer and allowed to cool. Many
chemically modified forms of agarose are available commercially that gel or
melt at different temperatures without any significant loss of mechanical
strength. Although these different forms of agarose can be useful in both the
qualitative and preparative electrophoresis of DNA, the resolving power is still
not comparable to that of polyacrylamide gels.
The density and porosity of the gel matrix is determined by the concentration
of agarose used, referred to as the percentage of agarose (w/v) in buffer (see
Note 3). Typical agarose gel concentrations fall within the range of 0.3 to 2.5%
(w/v), depending on the size of DNA fragments to be separated (Table 1). For
most applications, only a single-component agarose is needed and no polymerization catalysts are required and they are, therefore, quick and easy to prepare.
This coupled, with the lack of toxicity (unless in the buffers), is largely responsible for the popularity of agarose gel electrophoresis.
Agarose and Polyacrylamide Gel Electrophoresis
3
Table 1
Range of Separation of Linear DNA Molecules
in Different Agarose Gel Concentrations
Concentration of agarose
(% [w/v])
Efficient range of separation of
linear DNA molecules (kb)
0.3
0.6
0.7
0.9
1.2
1.5
2.0
5–60
1–20
0.8–10
0.5–7
0.4–6
0.2–3
0.1–2
Many configurations and sizes of agarose gel electrophoresis tanks are available, of which the most common is the horizontal slab gel. Because of their relatively poor mechanical strength, agarose gels are cast in clear plastic
UV-transparent trays allowing handling and transfer of the gel once set (see Note 4).
Electrophoresis is carried out with the gel submerged just beneath the surface of
the buffer, and as the resistance of the gel is similar to that of the buffer, a current
passes through the gel. The principle advantage of submarine gel electrophoresis
is that the thin layer of buffer prevents the gel from drying out and provides some
degree of cooling.
The electrophoretic behavior of DNA in agarose gels is not significantly
affected by temperature or the base composition of the DNA (3); therefore,
agarose gels are generally run at room temperature unless low-melting-temperature agarose is used or the agarose concentration is less than 0.5% (w/v),
when the mechanical strength can be improved by running at 4°C.
1.2. Polyacrylamide Gel Electrophoresis
Polyacrylamide gels are formed by the vinyl polymerization of acrylamide
monomers, (CH2=CH-CO-NH2) crosslinked by the bifunctional co-monomer
N,N'-methylene-bis-acrylamide (CH2=CH-CO-NH-CH2-NH-CO-CH=CH2).
The resulting crosslinked chains form a gel structure whose pore size is determined by the initial concentrations of both acrylamide and the crosslinker.
The nomenclature introduced by Hjertén et al. (4) is now widely used to
describe gel composition, the term T being the total monomer concentration
(acrylamide and Bis) in grams/100 mL and C being the percentage (by weight)
of total monomer T that is contributed by the crosslinker (Bis). The pore size of
the gel can be altered in an easy and controllable fashion by changing the concentrations of the two monomers. The polymerization proceeds by a free-radi-
4
Guilliatt
Table 2
Range of Separation of Linear DNA Molecules
in Agarose and Polyacrylamide Gels and the
Position of Migration of Bromophenol Blue and Xylene Cyanol
Agarose gel
concentration
(%[w/v])
0.5 –1.5
Effective range
of resolution (bp)
Xylene cyanol
migration (bp)
Bromophenol blue
migration (bp)
1000 – 3000
4000 – 5000
400 – 500
1000 – 2000
80 – 500
60 – 400
40 – 200
25 –150
6–100
460
260
160
70
60
45
100
65
45
20
15
12
Acrylamide gel
concentration
(%[w/v])
3.5
5.0
8.0
12.0
15.0
20.0
cal mechanism and the most common method of initiation is with ammonium
persulfate, which produces oxygen free radicals by a base-catalyzed mechanism,
typically tertiary aliphatic amines such as N,N,N'N'-tetramethylethylenediamine (TEMED) (see Note 5). The length of the chains is determined by the
concentration of the acrylamide in the polymerization reaction (between 3.5%
and 20%). One molecule of crosslinker is included for every 29 monomers of
acrylamide. The effective range of separation in nondenaturing gels containing
different concentrations of acrylamide is shown in Table 2.
Polyacrylamide gels are usually run between two glass plates, ensuring uniform electrical conditions across the slab so that comparison between different
sample zones is far more accurate and a large number of samples may be run
on the gel.
Polyacrylamide gels are poured and run in 1X TBE at low voltages to prevent denaturation of small fragments of DNA by heat generated by passage of
the electric current. Most species of double-stranded DNA migrate through the
gel at a rate approximately inversely proportion to the log10 of their size, however, their electrophoretic mobility is affected by their base composition and
sequence, so that two DNAs of exactly the same size can differ in mobility by
up to 10%, as a result of secondary structures that may form at specific
sequences in the double-stranded DNA (5).
Denaturing polyacrylamide gels are used for the separation and purification
of single-stranded fragments of DNA and are polymerized in the presence of
Agarose and Polyacrylamide Gel Electrophoresis
5
an agent that suppresses base-pairing in nucleic acids, usually urea. Denatured
DNA migrates though these gels at a rate that is almost completely dependent
on its base composition and sequence and is discussed elsewhere in this volume (see Chapters 14–16).
2. Materials
2.1. Agarose Gel Electrophoresis
All of the chemicals used are of molecular biology grade, and solutions are
prepared with double-distilled water unless otherwise stated.
1. Agarose gel apparatus, comprising:
a. Gel tank and safety lid
b. Gel tray
c. Comb
d. Gel caster (optional)
2. Power supply capable of at least 100 V, 100 mA.
3. Powdered agarose.
4. Electrophoresis buffer (see Note 2 for formulations).
5. 10X Gel loading buffer: The loading buffer for sample application should contain
0.25% bromophenol blue (BPB) and 0.25% xylene cyanol as tracking dyes and 30%
sucrose, glycerol, or Ficoll to increase the sample solution density (see Note 6).
6. Ethidium bromide solution is generally prepared as a stock solution at a concentration of 10 mg/mL in water and stored at room temperature protected from
light. Ethidium bromide is toxic and a powerful mutagen; therefore, gloves should
always be worn. Solutions containing ethidium bromide should be disposed of
appropriately as discussed in the Material Safety Data Sheets.
7. Microwave oven or hot plate.
8. UV transilluminator and gel documentation system.
2.2. Polyacrylamide Gel Electrophoresis
All of the chemicals used are of molecular biology grade and solutions are
prepared with double-distilled water unless otherwise stated.
1. Polyacrylamide gel apparatus, comprising:
a. Gel tank and safety lid
b. Glass plates
c. Spacers and combs of the same thickness
d. Clamps or gel caster assembly (optional)
2. 30% Acrylamide stock, prepared by the addition of 29 g of acrylamide and 1 g
N,N'-methylene-bis-acrylamide to 100 mL water (see Note 7).
3. 10X TBE (see Note 2 for formulation).
4. 10% Ammonium persulfate, prepared by adding 1 g ammonium persulfate to
10 mL water. This solution may be kept at 4°C for several weeks.
5. TEMED.
6
Guilliatt
6. Power supply.
7. Siliconizing solution (dimethyl dichlorosilane [e.g., Sigmacote®]).
3. Methods
3.1. Agarose Gel Electrophoresis
3.1.1. Assembly and Pouring of the Gel
1. Seal the edges of the UV-transparent plastic casting tray with strong masking
tape or use a commercial gel casting system (see Note 8).
2. Place the tray/gel caster onto a horizontal section of bench, using a glass leveling
plate if necessary, and place the comb(s) in the appropriate position(s) so that
wells are formed at the cathode end of the gel.
3. Add the desired amount of powdered agarose to a measured quantity of 1X electrophoresis buffer in an Erlenmeyer flask or beaker and cover with Saran-Wrap.
Heat the mixture in a microwave oven swirling every 30 s until the agarose is
visibly seen to have dissolved. Alternatively, the agarose can be heated using
a hot plate. Any undissolved agarose appears as small translucent particles
(see Note 9).
4. Allow the solution to cool to 50°C, unless a high concentration of agarose or
high-gelling-temperature agarose is used where gelation will occur more rapidly.
A low level (0.5 µg/mL) of ethidium bromide can be added at this stage, allowing
the progression of the electrophoresis to be analyzed during electrophoresis by
illuminating the gel with UV light (see Note 10).
5. Pour the agarose into the gel mold, ensuring that no air bubbles form between the
teeth of the comb, and allow the gel to set at room temperature for 30 – 40 min.
3.1.2. Running the Gel
1. Carefully remove the comb and place the gel and tray into the gel tank oriented
with the wells at the cathode end, and add sufficient 1X electrophoresis buffer to
cover the gel to a depth of approx 1 mm (see Note 11).
2. Mix the DNA samples with gel loading buffer to produce a 1X concentration of
buffer and load into the wells through the thin layer of running buffer. Placing a
black piece of paper behind the wells may facilitate in the loading process by
making the wells more visible (see Note 12).
3. Load a DNA size standard to allow the determination of the sizes of the DNA
fragments, because although the tracking dyes in the loading buffer give a rough
estimate of the migration of the DNA, they do not give the exact size. Size standards can be purchased commercially or prepared by restriction enzyme digestion of plasmid DNA, producing DNA fragments of known sizes.
4. Place the lid onto the gel tank, being careful not to disturb the samples, and begin
electrophoresis (see Note 13).
5. When the dyes have migrated the appropriate distance on the gel as shown in
Table 2, turn off the power supply and proceed with visualization of the DNA.
Agarose and Polyacrylamide Gel Electrophoresis
7
3.1.3. Staining and Visualization of the Nucleic Acids
The gel can be stained during electrophoresis by the addition of ethidium
bromide as described in Subheading 3.1.1. or following electrophoresis by
immersion in a solution of 0.5 µg/mL ethidium bromide.
1. If ethidium bromide has been incorporated in the gel, the DNA can be visualized
progressively during the run. If post-electrophoretic staining is necessary, place
the gel in an appropriate volume of 0.5 µg/mL ethidium bromide for 30 min and
then destain in water for 10 min (see Note 14).
2. Following staining, place the gel on a UV transilluminator and photograph the
gel using standard cameras and film such as a Polaroid camera with a red filter
and 667 black and white film, or a charged-coupled devise (CCD)-based digital
analysis system (see Note 15).
3.2. Polyacrylamide Gel Electrophoresis
There are many types of commercially available electrophoresis equipment
with differing arrangements of glass plates and spacers. In all cases, the aim is
to form an airtight seal between the plates and the spacers so that any
unpolymerized gel solution does not leak.
Most vertical electrophoresis tanks are constructed to hold glass plates.
Spacers vary in thickness from 0.5 to 2 mm, but the thicker the gel, the hotter it
will become during electrophoresis and overheating may occur.
3.2.1. Assembly and Pouring of the Gel
1. Prepare the glass plates and spacers by washing with warm detergent and rinsing
with water. The plates should only be held by the edges so that oils from hands do
not become deposited on the working surface of the plates and lead to the formation of bubbles in the gel. Rinse the plates with ethanol and allow to dry. One
surface of the glass plate should be periodically treated with silicone solution to
prevent the gel from sticking to both plates and therefore reduce the possibility
that the gel will tear when it is removed from the plates following electrophoresis.
2. Most modern commercial gel systems provide gel casting units for the preparation of polyacrylamide gels; therefore, the manufacturers guidelines should be
followed. Generally, lay one plate on the bench siliconized side upward and
position the spacers on the plate. Place the inner glass plate onto the spacers and
seal the edges of the gel with electrical tape or a clamping unit (see Note 16).
3. Calculate and prepare the desired quantities of reagents needed to make sufficient solution to fill the gel mould. For example, to pour a 5% acrylamide gel in
a total volume of 100 mL, add 10 mL 10 X TBE and 16.67 mL 30% acrylamide to
72.23 mL water (see Note 17).
4. Immediately before pouring, add the ammonium persulfate solution and TEMED
and mix. Quickly fill the mould with the solution, trying not to trap any air
bubbles in the mould. Apply a comb to the top of the gel and then flush out the
syringe and needle (see Note 18).
8
Guilliatt
3.2.2. Assembly and Running of the Gel
1. When the gel has polymerized, assemble the gel tank apparatus as recommended
by the manufacturers.
2. Fill the tank with 1X buffer, remove the comb, and wash out the wells with buffer.
Remove the tape from the bottom of the plates or cut with a sharp blade (see
Note 19).
3. Mix the DNA samples with appropriate gel loading buffer and apply to the wells
(see Note 20).
4. Run the gel at a voltage between 1 and 8 V/cm. If electrophoresis is carried out at
a higher voltage, differential heating in the center of the gel may cause bowing of
the DNA bands or even melting of small strands of DNA.
5. When the marker dyes have migrated the desired distance, turn off the power
supply and disconnect the leads. Remove and detach the glass plates and pry
apart using a spatula.
3.2.3. Staining and Visualization of Nucleic Acids
1. Because polyacrylamide quenches the fluorescence of ethidium bromide, it is not
possible to detect bands that contain less than 10 ng of DNA using this method.
To stain the gel, gently submerge the gel and its attached glass plate in 0.5 µg/mL
ethidium bromide in 1X TBE buffer for 10 – 30 min at room temperature.
2. Destain for 10 min in water and following removal from the glass plate view the
gel as described in Subheading 3.1.3.
4. Notes
1. At low voltages, the rate of migration of linear DNA fragments is proportional to
the voltage applied, but as the electric field strength is increased, the mobility of
high-molecular-weight DNA fragments increases preferentially. Therefore, the
effective range of separation decreases as the voltage is increased.
2. Electrophoresis buffers are generally prepared as concentrated stock solutions,
as shown in Table 3.
A precipitate may form when 10X TBE is stored for extended periods of time;
therefore, it should be stored in brown glass bottles at room temperature and
discarded if a precipitate develops.
3. The unavoidable loss of water that occurs during the heating of the gel means
that, in practice, the percentage value is not precise.
4. If the gel is to be handled extensively, it may be convenient to place a sheet of
hydrophilic plastic support at the bottom of the gel mould, aiding in the handling
of the gel once set.
5. Oxygen at above trace levels acts as an inhibitor; therefore, many people advocate the deaeration of stock acrylamide solutions. Gelation should ideally occur
within 10 – 30 min of the addition of the catalysts, because outside of these times,
uneven polymerization may result, leading to non-homogenous gels and poor
separations. Because of the nature of the gel casting, inhibition of the polymerization by oxygen is confined to a narrow layer at the top of the gel.
Agarose and Polyacrylamide Gel Electrophoresis
9
Table 3
Formulations of Stock Electrophoresis Buffers
Electrophoresis buffer
Concentrated stock
1X Working solution
Tris-acetate
(TAE)
50X Stock 242 g Tris base
57.1 mL Glacial acetic acid
100 mL of 0.5 M EDTA (pH 8.0)
40 mM Tris (pH 7.6)
20 mM Acetate
1 mM EDTA
Tris-borate
(TBE)
10X Stock 108 g Tris base
55 g Boric acid
40 mL of 0.5 M EDTA (pH 8.0)
89 mM Tris (pH 7.6)
89 mM Boric acid
2 mM EDTA
6. Loading buffers are usually made as 5X to 10X concentrates and consist of three
main constituents. The first is a high-density solution such as glycerol, Ficoll, or
sucrose and the second is tracking dyes, such as bromophenol blue (BPB) or
xylene cyanol. When choosing the loading buffer, it must be noted that it may
quench the fluorescence of ethidium bromide and can obscure the presence of
DNA. Chelating agents such as EDTA are also included, which complex divalent
cations and stop any enzymatic reactions.
7. During storage, acrylamide and bis-acrylamide are slowly deaminated to acrylic
and bisacrylic acid, catalyzed by light and alkali. The solution should be pH 7.0
or less and stored protected from light at room temperature. Fresh solutions
should be prepared every few months. TEMED and persulfate are added immediately before use to initiate the polymerization process.
Acrylamide is a potent neurotoxin and is readily absorbed through the skin. The
effects of acrylamide are cumulative; therefore, gloves and a mask should be
worn when working with powdered acrylamide and methylbisacrylamide.
Although polyacrylamide is considered to be non-toxic, it should be handled with
care, as it may contain small quantities of unpolymerized acrylamide. To avoid
the hazards associated with acrylamide, stock solutions are available commercially that only require the TEMED and the persulfate to be added. Acrylamides
may contain contaminating metal ions, although they can be easily removed by
stirring overnight with approx 0.2 vol of monobed resin followed by filtration.
8. Some agarose gel systems enable the casting of the gel directly in the electrophoresis tank.
9. The buffer should not occupy more than 50% of the volume of the flask. Always
wear protective gloves when handling heated agarose, as the solution may become
superheated and boil violently when disturbed. Some evaporation of the solution
may occur and can be made up with water if desired.
10. During electrophoresis, the ethidium bromide migrates toward the cathode in the
opposite direction to the DNA. Extended electrophoresis can lead to removal of
the ethidium bromide from the gel, making detection of smaller fragments difficult. If this occurs, the gel can be restained by soaking for 30 – 40 min in a solu-
10
Guilliatt
Table 4
Examples of Polyacrylamide Gel Formulations for 100 mL Gel
Gel concentration (%T)
Constituents
Acrylamide (g)
Bis (g)
TEMED (mL)
10X Buffer stock (mL)
Water (mL)
10% Ammonium persulfate (mL)
11.
12.
13.
14.
15.
16.
17.
18.
3.5
5.0
7.5
10.0
15.0
20.0
3.24
0.26
0.1
10.0
86.4
1.0
4.7
0.3
0.1
10.0
84.9
1.0
7.13
0.37
0.1
10.0
82.4
1.0
9.6
0.4
0.1
10.0
79.9
1.0
14.55
0.45
0.1
10.0
74.9
1.0
19.5
0.5
0.1
10.0
69.9
1.0
tion containing 0.5 µg/mL ethidium bromide. The mobility of linear DNA is
reduced by the presence of ethidium bromide by about 15%.
The electrical resistance of the gel is almost the same as that of the buffer and so
a significant proportion of the current passes through the gel, but the deeper the
buffer layer, the less efficient this becomes.
The maximum volume of solution that can be loaded is determined by the dimensions of the well. To reduce the possibility of contaminating neighboring samples,
it is not advisable to fill the wells completely. The minimum amount of DNA that
can be detected by ethidium-bromide-stained gels is approx 2 ng in a 5-mm-wide
band, but if there is more than 500 ng of DNA, the well may become overloaded.
The power requirements for electrophoresis depend on the thickness and length
of the gel and the concentration of agarose and buffer used. It is recommended
that for maximal resolution, voltages applied to the gels should not exceed 10 V/cm,
as higher voltages may preferentially increase the migration rate of highermolecular-weight DNA and reduce the range of separation. Overnight separations using lower voltages are frequently used.
Extended destaining can lead to the removal of the ethidium bromide and lowering of the detection sensitivity. Insufficient de-staining will lead to a higher background of fluorescence.
Ultraviolet radiation is particularly dangerous to the eyes; therefore, to minimize
exposure, protective goggles or a face shield that efficiently blocks ultraviolet
radiation should be worn.
The bottom corners of the plates is where leaks are most likely to occur. An
alternative method is to seal the glass plate with a strip of filter paper impregnated with catalyzed acrylamide or use a commercial gel casting apparatus.
Examples of typical acrylamide gel formulations are shown in Table 4.
The pore size of the matrix is affected by the temperature at which polymerization occurs and the optimum polymerization temperature is approx 25 – 30°C.
The concentration of catalysts used to initiate the polymerization reaction and
the time taken for gelation to occur also affects the pore size.
Agarose and Polyacrylamide Gel Electrophoresis
11
19. It is important to wash out the wells thoroughly, as any unpolymerized acrylamide
in the wells may subsequently polymerize, giving rise to irregular surfaces, which
lead to distorted bands.
20. It is important that the gel is not loaded symmetrically, as the orientation of the
gel can become lost during subsequent steps as it is removed from the plates for
visualization and staining. When loading the samples, do not attempt the expel of
any remaining sample from the pipet, as the resulting air bubbles may blow out
the sample from the well. It is important not to take too long to complete the gel
loading process, as the samples may diffuse from the wells.
References
1. Helling, R. B., Goodman, H. M., and Boyer, H. W. (1974) Analysis of EcoRI
fragments of DNA from lambdoid bacteriophages and other viruses by agarose
gel electrophoresis. J. Virol. 14, 1235–1244.
2. Sharp, P. A., Sugden, B., and Saunders, J. (1973) Detection of two restriction
endonuclease activities in Haemophilus parainfluenzae using analytical agaroseethidium bromide electrophoresis. Biochemistry 12, 3055 –3063.
3. Thomas, M. and Davis, R. W. (1975) Studies on the cleavage of bacteriophage
lambda DNA with EcoRI restriction endonuclease. J. Mol. Biol. 91, 315 –321.
4. Hjertén, S., Jerstedt, S., and Tiselius, A. (1965) Some aspects of the use of “continuous” and “discontinuous” buffer systems in polyacrylamide gel electrophoresis. Anal. Biochem. 11, 219 – 223.
5. Orita, M., Suzuki, Y., Sekilya, T., and Hayashi, K. (1989) Rapid and sensitive
detection of point mutations and DNA polymorphisms using the polymerase chain
reaction. Genomics 5, 874 – 879.
Further Reading
Rickwood, D. and Hanes, B. D., eds. (1988) Gel Electrophoresis of Nucleic Acids:
A Practical Approach. IRL, Oxford, UK.
Sambrook, J., Fritsch, E. F., and Maniatis, T. Molecular Cloning: A Laboratory
Manual, 2nd ed. Cold Spring Harbor Laboratory, Cold Spring Harbour, NY.
150
Wells
Internal Labeling of DNA Probes
13
2
Internal Labeling of DNA Probes
Ralph Rapley and Bimal D. M. Theophilus
1. Introduction
One of the most common precursors to undertaking a protocol for mutation
detection is the production of a suitably labeled DNA probe (1). Labeled nucleotides (radioactive or fluorescent) can be incorporated efficiently into doublestranded DNA by a number of methods. One of the most common is by a
process termed nick translation. Nick translation works by using DNase and
DNA polymerase I enzymes. DNase cuts one strand of the DNA, exposing 5'phosphoryl and 3'-hydroxyl (OH) termini. Polymerase I adds dNTPs, including labeled dNTPs to the exposed 3'-OH strand, and at the same time, the
polymerase exonuclease activity digests from the exposed 5' end. In this way, a
new complementary strand, including labeled dNTPs, is produced (2). It is
also possible to incorporate radioactive nucleotides into a DNA using a enzymatic primer extension technique, usually termed random primer labeling (3).
In this method, random hexanucleotides are annealed to denatured DNA to be
used as the probe. These are used as a primer for enzymatic extension in the
presence of the four deoxyribonucleotides, one of which is radiolabeled. Alternative probes may be prepared where the label occurs on one of the termini of
the DNA, either the 3' or the 5' end. The protocol for this type of labeling is
found in Chapter 3.
2. Materials (see Note 1)
2.1. Nick Translation of DNA
1. 10X Nick translation buffer: 0.5 M Tris-HCl (pH 7.5), 0.1 M MgSO4, 1 mM
dithiothreitol, 500 mg/mL bovine serum albumin (optional).
2. DNase I: 10 ng/mL.
3. DNA polymerase I: 0.5 U/µL.
From: Methods in Molecular Biology, vol. 187: PCR Mutation Detection Protocols
Edited by: B. D. M. Theophilus and R. Rapley © Humana Press Inc., Totowa, NJ
13
14
Rapley and Theophilus
4. Unlabeled dNTP: 2 mM each of dATP, dGTP, and dTTP.
5. Radiolabeled dCTP: 10 mCi/mL [α-32P]dCTP, specific activity approx 3000 Ci/
mmol (see Note 2). This is stored at –20°C and should be removed from the
freezer approx 20 min before setting up the reaction.
6. Stop solution: 0.5 M EDTA (pH 8.0).
7. Sephadex separation spin column (see Note 3).
2.2. Random Hexamer Labeling of DNA
1. DNA probe to be labeled in TE buffer (10 mM Tris-HCl, 1 mM EDTA, pH 8.0).
2. Hexamer mix: 0.043 M each of dCTP, dTTP, and dGTP, 0.43 M HEPES, pH 7.0,
12 U/mL random hexanucleotides (Amersham Pharmacia Biotech, UK).
3. [α-32P]dATP, specific activity 6000 Ci/mM (Amersham Pharmacia Biotech).
This is stored at –20°C and should be removed from the freezer approx 20 min
before setting up the reaction.
4. Stop solution: 0.5 M EDTA, pH 8.0.
5. DNA polymerase (e.g., Klenow fragment) (6 U/µL).
3. Methods
3.1. Nick Translation of DNA
1. Dilute DNA to be labeled to 20 – 200 ng/mL with sterile distilled H2O and add 1 mg
to a sterile microcentrifuge tube.
2. Add the following to the tube:
a. 10 µL 10X nick translation buffer
b. 10 µL 20 nM unlabeled dNTPs
c. 10 µL 30 pmol labeled [α-32P]dCTP
3. Add 1 ng/mL DNase (10 mL) and 2.5 U DNA polymerase I (5 mL). Gently mix
by pipetting solution up and down.
4. Add water to ensure a final volume of 100 µL.
5. Incubate for 2 h at 15°C.
6. Stop the reaction by adding 10 µL EDTA.
7. The probe is now ready for hybridization. However, it may be necessary to
remove any unincorporated nucleotides, using Sephadex spin columns (see Notes
3 and 4).
3.2. Random Hexamer Labeling of DNA
1. Take 25 –100 ng of DNA to be labeled and adjust the volume of TE to 11 µL.
2. Denature the DNA by boiling for 5 min and transfer immediately to an ice bucket.
3. Add 11 µL of the primer mix, 2 µL of the [α-32P]dATP, and 3 U of the Klenow
polymerase (0.5 µL).
4. Incubate the mix at room temperature for approx 4 h.
5. Add 5 µL of stop mix to terminate the reaction.
6. At this point, the probe may be purified from free nucleotides by use of Sephadex
spin columns (see Notes 3 and 4).
Internal Labeling of DNA Probes
15
7. Following recovery of the labeled DNA, it must be rendered single-stranded by
boiling before it may be used in hybridization experiments.
4. Notes
1. Enzymes and buffers are now available in kit forms (Amersham [Amersham
Pharmacia Biotech, UK], Promega [Promega, UK]); however, slight variations
exist in concentrations of enzymes and buffer ingredients.
2. Nick translation can also be used to label DNA with nonradioactive markers,
including incorporation of Cy3 – dCTP and fluorescein, or rhodamine – dUTP into
DNA. However, radiolabeled probes are more sensitive markers for low quantities of DNA. It is also possible to label more than one dNTP if higher specific
activity is required for hybridizing low amounts of DNA. However, this increases
nonspecific hybridization.
3. To remove unincorporated labeled dNTPs, the probe can be purified by passing
the solution through a Sephadex spin column or push column. Unincorporated
dNTPs are trapped inside the Sephadex beads, whereas DNA is too large to enter
the beads and passes straight through the column.
4. Percentage incorporation and the specific activity of the probe can be calculated
by measuring the radioactivity in the mixture before and after separation.
Percentage incorporation = cpm incorporated × 100
Total cpm
Specific activity (cpm/mg DNA) = cpm incorporated × dilution × 100
mg input DNA
References
1. Aquino de Muro, M. (1998) Gene Probes, in The Molecular Biomethods Handbook (Rapley, R. and Walker, J. M., eds.) Humana, Totowa, NJ.
2. Rigby, P. W. J., Dieckmann, M., Rhodes, C., and Berg, P. (1977) Labelling deoxyribonucleic acid to a high specific activity in vitro by nick translation with DNA
polymerase I. J. Mol. Biol. 113, 237–251.
3. Feinberg, A. P. and Vogelstein, B. (1983) A technique for radiolabelling DNA
restriction endonuclease fragments to a high specific activity. Anal. Biochem.
132, 6 –13.
150
Wells
End-Labeling of DNA Probes
17
3
End-Labeling of DNA Probes
Adrian J. Harwood
1. Introduction
End-labeling is a rapid and sensitive method for radioactively, or nonisotopically, labeling DNA fragments and is useful for visualizing small amounts of
DNA. End-labeling can also be used to label fragments at one end. All of the
enzymes employed are specific to either the 3' or 5' termini of DNA and will,
consequently, only incorporate label once per DNA strand. If double-stranded
DNA is used, both ends are labeled, but single end-labeled fragments can be
produced by further restriction enzyme digestion. This works well with DNA
fragments cloned into polylinkers, as one labeled end can be removed as a tiny
DNA fragment, making subsequent purification easier. Such single end-labeled
molecules can be used to order restriction enzyme fragments and are a prerequisite for Maxam–Gilbert DNA sequencing (1). End-labeled synthetic oligonucleotides have numerous applications, including sequence specific probes
(2), gel retardation and Southwestern assays (3), and sequencing polymerase
chain reaction (PCR) products (4).
There are two common methods of end-labeling: the “fill-in” reaction and
the “kinase” reaction. The fill-in reaction uses the Klenow fragment of
Escherichia coli DNA polymerase (5) and labels DNA fragements that have
been digested with a restriction enzyme to create a 5' overhang. Klenow extends
the 3' recessed end of one DNA strand by using the 5' overhang of the other
strand as a template (Fig. 1A). This is the method of choice for double-stranded
DNA fragments because of its ease. When suitable restriction enzyme sites are
unavailable or when the substrate is single stranded, the kinase reaction is used.
The “kinase” reaction uses T4 polynucleotide kinase (T4 kinase) to transfer
labeled phosphate to the 5' end of the DNA molecule (6) (Fig. 1B). This method
From: Methods in Molecular Biology, vol. 187: PCR Mutation Detection Protocols
Edited by: B. D. M. Theophilus and R. Rapley © Humana Press Inc., Totowa, NJ
17
18
Harwood
Fig. 1. (A) The fill-in reaction; (B) the kinase reaction.
is ideal for labeling oligonucleotides, which are normally synthesized without
a 5' phosphate. To label restriction-enzyme-digested DNA fragments, the terminal phosphate must first be removed by using a phosphatase, such as calf
intestinal alkaline phosphatase (CIP). All of these reactions can be used without labeled nucleotides to modify the DNA fragments for further recombinant
DNA manipulations.
2. Materials
Molecular-biology-grade reagents should be utilized whenever possible.
Manipulations are performed in 1.5-mL disposable, sterile polypropylene
tubes, with screw tops to prevent leakage of radioactivity. Local safety precautions must be obeyed when using radioactivity.
End-Labeling of DNA Probes
19
2.1. End-Labeling with Klenow
1. 10X Klenow buffer: 200 mM Tris-HCl, pH 7.6, 100 mM MgCl 2, 15 mM
β-mercaptoethanol, 25 mM dithiothreitol.
2. Labeled nucleotide: 32P-α-dNTP, most commonly supplied dATP or dCTP, but
dGTP and dTTP are available. It is also possible to substitute nonisotopic label
such as fluoroscein-11-dUTP and digoxygenin-11-dUTP.
3. Unlabeled dNTPs:
a. dNTP mix: a mixture of 0.25 mM of each unlabeled dNTP, excluding that
which corresponds to the labeled nucleotide (see Note 1).
b. dNTP chase: 0.25 mM dNTP corresponding to the labeled nucleotide (see
Note 1).
4. Klenow: the Klenow (large) fragment of DNA polymerase I at 1 U/µL. Store
at –20°C.
5. TE: 10 mM Tris-HCl (pH 7.5), 1 mM EDTA. Autoclave and store at room
temperature.
6. Phenol: Tris-HCl equilibrated phenol containing 0.1% hydroxyquinoline (as an
antioxidant). Use ultrapure, redistilled phenol. Extract repeatedly with 0.5 M
Tris-HCl (pH 8.0) until the aqueous phase is 8.0 and then extract once with 0.1 M
Tris-HCl (pH 8.0). Can be stored at 4°C for at least 2 mo. Phenol is both caustic
and toxic and should be handled with care.
7. Chloroform.
8. Phenol: chloroform mixture: A 1:1 mixture was made by adding an equal volume
of chloroform to 0.1 M Tris-HCl, pH 8.0, equilibrated phenol. Can be stored at
4°C for at least 2 mo.
9. Ethanol and 70% ethanol (v/v in water).
10. 5 M Ammonium acetate, pH 7.5: Store at room temperature.
2.2. End-Labeling with T4 Kinase
11. 10X CIP buffer: 10 mM ZnCl2, 10 mM MgCl2, 100 mM Tris-HCl, pH 8.3.
12. CIP: calf intestinal alkaline phosphatase (Boehringer Mannhiem Gmbh) at
1 U/µL. Store at 4°C.
13. 10X Kinase buffer: 700 mM Tris-HCl, pH 7.6, 100 mM MgCl 2, 50 mM
dithiothreitol.
14. 32P-γ-ATP: Specific activity > 3000 Ci/mmol.
15. T4 kinase: T4 polynucleotide kinase at 1 U/µL. Store at –20°C.
16. Cold ATP: 1.0 mM ATP (freshly made from 20 mM stock).
3. Methods
3.1. End-Labeling with Klenow
1. Resuspend 1–1000 ng of DNA in 42 µL of dH2O (see Note 2). Add 5 µL of 10X
Klenow buffer, 1 µL of 32P-α-dNTP, 1 µL of dNTP mix, and 1 µL of Klenow.
Incubate at room temperature for 15 min (see Note 3).
20
Harwood
2. Add 1 µL of dNTP chase. Incubate at room temperature for a further 15 min (see
Notes 1 and 4).
3. Add 50 µL of TE followed by 100 µL of phenol:chloroform. Vortex briefly and
separate by centrifugation at 12,000g in a microfuge (see Note 5).
4. Remove the aqueous (top) phase to a fresh tube and add 100 µL of chloroform.
Separate the layers as in step 3 and remove the aqueous phase to a fresh tube.
Care must be taken, as the discarded reagents are contaminated with unincorporated 32P-α-dNTP.
5. Add 60 µL (0.6 vol) of 5 M ammonium acetate and 200 µL (2 vol) of ethanol (see
Note 6) and place on ice for 5 min. Centrifuge at 12,000g for 15 min. Carefully
remove the supernatant (remember that it is radioactive) and wash the pellet
in 70% ethanol.
6. Air-dry the pellet for 10 min and resuspend in the required amount of TE
(10 –100 µL).
The labeled DNA can be either immediately separated by gel electrophoresis
and detected by autoradiography (see Note 7) or digested further with a second
restriction enzyme. In either case, it is a good idea to count a 1-µL sample in a
scintillation counter, between 5000 and 10,000 counts are required to detect
the fragment by autoradiography. Possible causes of poor labeling and possible solutions are discussed in Notes 8–10.
3.2. End-Labeling with T4 Kinase
1. Dissolve 1–2 µg of restriction-enzyme-digested DNA in 44 µL of dH2O. Add 5 µL
of 10X CIP buffer and 0.05–1 U of CIP (see Note 11). Incubate for 30 min at
37°C (see Notes 12 and 13).
2. Heat-inactivate at 60°C for 10 min. Phenol extract and precipitate as in Subheading 3.1., steps 3 – 5 (see Notes 14 and 15).
3. Resuspend the DNA in 17.5 µL of dH2O. Add 2.5 µL of 10X kinase buffer, 5 µL
of 32P-γ-ATP, and 1 µL of T4 kinase. Incubate at 37°C for 30 min.
4. Add 1 µL of cold ATP and incubate for a further 30 min (see Note 16).
5. Phenol extract and precipitate as in Subheading 3.1., steps 3 – 6 (see Note 17).
4. Notes
1. Unlabeled dNTPs are required for two reasons. First, the labeled nucleotide may
not correspond to the first nucleotide to be filled within the restriction enzyme
site. In the example shown in Fig. 1A, which is a BamHI site, the labeled nucleotide, dCTP*, corresponds to the fourth nucleotide; therefore, the other three
nucleotides must be filled with cold dNTPs before the label is incorporated. For
convenience, a general 7.5 mM mix of the unlabeled dNTPs can be used regardless of the actual composition of the restriction enzyme site. Second, a “chase” is
required to generate molecules with flush ends, as the polymerase stalls in the
limited concentrations of the labeled nucleotide. This step may be omitted in
End-Labeling of DNA Probes
2.
3.
4.
5.
6.
7.
8.
9.
10.
11.
12.
13.
21
cases where the heterogeneous sized termini are not a problem, (e.g., when labeling large DNA fragments for separation by agarose gel electrophoresis).
The fill-in reaction is very robust, and provided Mg2+ is present, it can be carried
out in almost any buffer. This means that it is possible to carry out the reaction by
simply adding the labeled dNTP, unlabeled dNTPs, and Klenow directly to the
restriction enzyme mix at the end of digestion.
As only a small region of DNA is labeled in this reaction, it proceeds very quickly.
Incubation at room temperature is sufficient, unless 35S-labeled dNTP is used
when labeling should be carried out at 37°C. Prolonged incubation can result in
degradation of the DNA ends.
The labeled DNA may be used for gel electrophoresis at this point, but it must be
remembered that unincorporated 32P-α-dNTP will be present in the DNA solution. This may increase the exposure of the operator and increase the risk of
contamination when carrying out gel electrophoresis.
An alternative purification is to pass the DNA through a Sephadex-G50 spin
column.
If only very small amounts of DNA are present, it may be necessary to add a
carrier such as 10 µg of tRNA or glycogen.
The gel should be fixed in 10% acetic acid or trichloroacetic acid (TCA) before
drying to prevent contamination of the gel dryer.
Klenow is rarely affected by inhibitors, but it rapidly loses its activity if it is
warmed in the absence of a substrate. It can be one of the first enzymes to be lost
from the general enzyme stock. If the activity of the enzyme is in doubt, carry out
a test reaction by labeling control DNA. Generally, DNA markers are good for
this, but check the structure of the ends before proceeding.
The structure of the end is important, as the enzyme can only “fill-in” those bases
present in the site. Recheck the sequence of the single-strand end produced by
restriction enzyme digestion. It may be possible to exchange the 32P-α-dNTP for
another which has a higher specific activity.
The Klenow “fill-in” reaction only incorporates a small number of 32P-labeled
nucleotides per DNA molecule. If higher levels of incorporation are required, T4
DNA polymerase may be used. T4 DNA polymerase has a 200-fold higher 3'–5'
exonuclease activity than Klenow. If the DNA fragments are incubation in the
absence of dNTPs, this enzyme will produce a region of single-stranded DNA,
which can be subsequently labeled with a higher incorporation by the addition of
32P-α-dNTP and cold dNTPs to the mix (6).
One unit of CIP dephosphorylates 50 pmol of ends in 1 h (for a 5-kb fragment,
1 pmol of ends is approx 2 µg).
The efficiency of dephosphorylation of blunt and 5' recessed ends is improved by
incubating the reaction at 55°C.
The phosphatase reaction can be carried out in restriction enzyme buffer by the
addition of 0.1 vol of 500 mM Tris-HCl, pH 8.9, 1 mM EDTA, and the required
amount of enzyme.
22
Harwood
14. It is important to remove all phosphatase in order to prevent removal of the newly
incorporated labeled phosphate.
15. The T4 kinase reaction is very sensitive to inhibitors such as those found in agarose. Care should be taken to ensure that the DNA is inhibitor-free. In addition,
T4 kinase will readily phosphorylate RNA molecules; therefore, the presence of
RNA should be avoided, as this will severely reduce the incorporation of labeled
32P into the DNA.
16. The labeling reaction is only approx 10% efficient. To get all of the molecules
phosphorylated, it is necessary to chase the reaction with excess cold ATP.
17 This is a poor way to purify oligonulceotides, instead I recommend a SephadexG25 spin column.
References
1. Pickersky, E. (1996) Terminal labelling for Maxam-Gilbert sequencing, in Basic
DNA and RNA Protocols (Harwood, A. J., ed.), Methods in Molecular Biology,
vol. 58, Humana, Totowa, NJ.
2. Wallace, R. B., Shaffer, J., Murphy, R. F., Bonner, J., Hirose, T., and Itakura, K.
(1979) Hybridisation of synthetic oligodeoxyribonucleotides to phi chi 174 DNA:
the effect of single base pair mismatch. Nucl. Acid Res. 6, 3543.
3. Harwood, A. J., ed. (1994) Protocols for Gene Analysis, in Methods in Molecular
Biology, vol. 31. Humana, Totowa, NJ.
4. Harwood, J. C. and Phear, G. A. (1996) Direct sequencing of PCR products, in
Basic DNA and RNA Protocols, (Harwood, A. J., ed.), Methods in Molecular
Biology, vol. 58, Humana, Totowa, NJ.
5. Klenow, H., Overgaard-Hansen, K., and Patkar, S. A. (1971) Proteolytic cleavage
of native DNA polymerase into two different catalytic fragments. Eur. J. Biochem.
22, 371–381.
6. Challberg, M. D. and Englund, P. T. (1980) Specific labelling of 3' termini with
T4 DNA polymerase. Meth. Enzymol. 65, 39 –43.
Southern Blotting by Capillary Transfer
23
4
Southern Blotting of Agarose Gels
by Capillary Transfer
Ralph Rapley and Ian J. Williams
1. Introduction
The detection of specific nucleic acid species following electrophoretic separation of a complex sample may be undertaken by the use of Southern blotting
(1). Genomic DNA fragments are separated according to size by agarose gel
electrophoresis following digestion with suitable restriction enzymes (see
Chapter 5).
To facilitate the transfer of larger DNA fragments, the immobilized DNA
contained within the gel matrix is partially cleaved by depurination with HCl.
Subsequent soaking of the gel in NaOH denatures the double-stranded DNA to
produce single strands, which may be probed with an appropriately labeled
single-stranded DNA fragment (2).
Traditionally, the DNA is transferred to a nitrocellulose filter, although now
the membrane is usually constructed of nylon. Nylon has an improved capacity
for DNA binding and is more robust allowing reprobing to be undertaken. The
simplest and least expensive method of transfer utilizes capillary action to draw
liquid through the gel matrix, transferring the nucleic acid fragments onto the
nylon membrane. The nylon-bound immobilized DNA fragments provide an
exact representation of their original location following agarose gel electrophoresis. Alternative methods of transfer such as vacuum blotting or
electroblotting may provide a more efficient method of transfer and reduce
blotting time, but they are generally more expensive. Following transfer, the
DNA is covalently crosslinked to the nylon membrane by exposure to ultraviolet irradiation, after which the blot may be stored or probed.
From: Methods in Molecular Biology, vol. 187: PCR Mutation Detection Protocols
Edited by: B. D. M. Theophilus and R. Rapley © Humana Press Inc., Totowa, NJ
23
24
Rapley and Williams
Fig. 1. A typical setup for capillary action Southern blot.
2. Materials
1.
2.
3.
4.
5.
6.
7.
8.
9.
10.
Suitable apparatus for blotting, two buffer tanks, paper.
Towels, Whatmann paper (see Fig. 1).
Nylon hybridization membrane (e.g., Hybond-N+).
Depurination buffer: 0.25 M HCI.
Denaturation buffer: 1.5 M NaCl, 0.5 M NaOH.
Transfer buffer: 1.5 M NaCl, 0.25 M NaOH.
20X SSC: 3 M NaCl, 0.3 M trisodium citrate, pH 7.0.
Ultraviolet (UV) light transilluminator, 302-nm output.
Fixing solution: 0.4 M NaOH.
Rinsing solution: 5X SSC.
3. Methods
1. Isolate DNA with an appropriate extraction technique.
2. Digest total genomic DNA with desired restriction enzyme.
3. Separate the digested DNA fragments by agarose gel electrophoresis (see Chapter 1)
(see Notes 1 and 2).
4. Following electrophoresis, visualize the gel on a UV transilluminator and photograph (see Note 3).
5. Trim the gel with a clean scalpel blade to remove any unused areas (e.g., gel
wells and sides) (see Note 4).
Southern Blotting by Capillary Transfer
25
6. Soak the gel in three gel volumes of depurination buffer for 30 min at room
temperature with gentle agitation on an orbital shaker (see Notes 5 and 6).
7. Decant depurination buffer and rinse the gel in distilled H2O.
8. Discard H2O and soak in three gel volumes of denaturation buffer. Incubate with
gentle agitation at room temperature for 30 min.
9. Decant denaturation buffer. Replace with three gel volumes of transfer buffer.
Equilibrate the gel with gentle agitation at room temperature for 30 min.
10. Prepare Southern blotting system (Fig. 1). Cut a wick from 3MM paper, sufficient in width to cover the area of the gel platform and in length to reach both
reservoirs (see Note 7).
11. Soak the 3MM paper wick in transfer buffer and place over the gel platform.
Ensure that both ends of the wick reach the reservoirs and that all air bubbles are
removed from the wick by gently smoothing with a gloved finger.
12. Remove gel from transfer buffer and place, face up, on the gel platform of the
capillary transfer system. Fill both reservoirs with transfer buffer.
13. Cut a piece of Hybond-N+ nylon membrane to the exact size as the gel (see
Note 8) and mark the side of the membrane that will be in contact with the gel
(see Note 9).
14. Wet the membrane by floating it on distilled water. Rinse in transfer buffer and
place the membrane on the gel, smoothing out any air bubbles between the gel
and the membrane (see Note 10).
15. Cut three sheets of 3MM paper to the exact size of the gel/membrane sandwich
and wet with transfer buffer. Place on top of the membrane and smooth out any
air bubbles.
16. Cut a stack of absorbent paper towels to the size of the gel and place on top of the
3MM paper. Compress completed setup with a 1-kg weight to allow the transfer
to proceed and leave for at least 12 h (see Notes 11 and 12).
17. After blotting, carefully disassemble the gel and membrane from the transfer system. Before separating the gel and the membrane, mark the position of the gel
slots with a pencil, as this will allow orientation following autoradiography (see
Note 13).
18. Carefully remove the membrane (see Note 8) and rinse the filter in 2X SSC.
19. Covalently crosslink the DNA fragments to the matrix by exposure to a 302-nm
UV light transilluminator. Place the filter, DNA side down, on a piece of cling
film, and expose for 2 – 3 min (see Notes 14 and 15). The filter can be used immediately or stored at 4°C, in cling-film until required.
4. Notes
1. DNA fragment separation may be improved by varying electrophoresis conditions. Overnight runs at low voltages will provide good resolution.
2. It is possible to determine the size of the hybridizing band following autoradiography by comparison with standard or marker DNA (e.g., λDNA/HindIII, 1-kb
marker, 123-bp marker). This needs to be end-labeled with a radioactive or nonradioactive marker (see Chapter 3).
26
Rapley and Williams
3. Ethidium bromide stain can be incorporated into the gel or the buffer tank during
electrophoresis. Similarly, the gel can be stained after the run is complete.
4. Trimming away unwanted areas of the gel reduces the size of the nylon membrane required to cover the gel.
5. The depurination step partially cleaves large DNA fragments within the gel
matrix. The smaller DNA fragments are transferred more efficiently during the
blotting procedure. When the xylene cyanol loading dye changes color to a
greenish color or the bromophenol blue turns yellow, the depurination buffer
can be removed. Alternatively, this step can be achieved by exposing the gel to
UV light (302 nm) for 30 s, to cleave high-molecular-weight DNA.
6. The blotting apparatus can be set up during the 30-min incubation periods in
steps 6 – 9.
7. The width of the 3MM paper wick is cut to accommodate the width or length of
each agarose gel. The gel platform can vary in size to accommodate different
gel sizes.
8. Avoid touching the surface of the nylon membrane as any dirt or grease may
affect the result. Hold the membrane at the edges and wear gloves.
9. A small portion of the corner can be cut off for orientation.
10. Air bubbles trapped between the gel and nylon membrane sandwich will affect
DNA transfer.
11. A glass plate can be placed on top of the stack in order to distribute the weight
evenly, allowing a more even transfer of DNA. It is necessary to cover the blotting apparatus with cling film to avoid evaporation of transfer buffer.
12. With the completed setup, ensure that only the gel is in contact with the wick.
To ensure correct and only vertical transfer of DNA fragments from the gel to
the nylon membrane, contact of blotting items within the stack should only be
with the layer above or below. In some cases, the wick can be covered or “sectioned off” using cling film. This will also prevent evaporation from the wick
and the reservoirs.
13. Alternatives to the capillary system include vacuum blotting or electroblotting.
There are a number of manufacturers that produce equipment for this purpose,
and although they are more expensive, they reduce the transfer process to as
little as 1 h. In some cases, a more even transfer takes place.
14. For neutral nylon membranes (e.g., Amersham, Hybond-N), crosslinking is necessary; however, for positively charged membranes (e.g., Amersham Hybond-N+)
crosslinking may be undertaken by placing the membrane in 0.4 N NaOH for
30 min and rinsing in 5X SSC with gentle agitation for 1 min. If using nitrocellulose, it is necessary to bake the filter at 80°C for 20 –60 min.
15. Efficient crosslinking of DNA to nylon filters is achieved with an optimal
amount of exposure to UV light. Some manufacturers (e.g., Stratagene) produce UV crosslinkers (Stratalinker) that exposes the filter to the radiation for
the optimal amount of time. It is useful if no equipment such as this is available
to calibrate a UV source before use. This can be done by exposing filters with
identical amounts of DNA on each filter to UV for different lengths of time.
Southern Blotting by Capillary Transfer
27
Hybridization to the same probe will reveal the strongest signal that can be
used to establish the optimal time for exposure. With standard UV transilluminator, regular recalibration is required.
References
1. Southern, E. M. (1975) Detection of specific sequences among DNA fragments
separated by gel electrophoresis. J. Mol. Biol. 98, 503 – 517.
2. Evans, M. R., Bertera, A. L., and Harris, D. W. (1994) The Southern blot: an
update. Mol. Biotechnol. 1, 1–12.
150
Wells
Restriction Fragment Length Polymorphism
29
5
Restriction Fragment Length Polymorphism
Mohammad S. Enayat
1. Introduction
DNA sequence changes within a gene result either in polymorphism or mutation, causing different diseases. Some of these polymorphisms that occur with a
high frequency within the population can be a useful tool for gene tracking for a
given disease. Such investigations have initially been done by Southern blot
techniques, but, where possible, they have now been replaced by polymerase
chain reaction (PCR)-based methodology. The nucleotide substitutions can be
identified in two ways:
1. By use of restriction enzyme analysis or restriction fragment length polymorphisms
(RFLPs).
2. Allele specific oligonucleotide hybridization (ASO-H) or similar techniques.
Another type of polymorphism, a polymorphic tandem dinucleotide repeat
sequence or variable number tandem repeat (VNTR) can also be used for gene
tracing in a familial disease. In these cases, a segment containing the repeats is
amplified and the fragment size differences are detected by gel electrophoresis.
Hemophilia A or Factor VIII deficiency is the most common inherited bleeding disorder in humans. This X-chromosome-linked disorder affects approx 1
in every 10,000 males, and within the families of these patients, the females
are at risk of being carriers of this disorder. Factor VIII is a component of the
intrinsic coagulation pathway and the FVIII gene is a large gene, encompasses
186 kb at Xq28. It has 26 exons encoding a mRNA of 9 kb (1). Both RFLP and
VNTR analysis have been extensively used in carrier detection and antenatal
diagnosis in families with classical or familial hemophilia A. So far, 10 useful
polymorphisms have been identified within (intragenic) or flanking (extragenic)
From: Methods in Molecular Biology, vol. 187: PCR Mutation Detection Protocols
Edited by: B. D. M. Theophilus and R. Rapley © Humana Press Inc., Totowa, NJ
29
30
Enayat
Table 1
DNA Polymorphisms Within or Flanking the Factor VIII Gene (2)
Detection
Restriction
enzyme
Site
PCR
Probe
Heterozygosity
in Caucasian
BclI
XbaI
HindIII
MspI
TaqI
BglI
MspI
(CA repeat)
(CA repeat)
(G/A)
Intron 18
Intron 22
Intron 19
Intron 22
5'
3'
3'
Intron 13
Intron 22
Intron 7
+
+
+
–
–
–
–
+
+
+
+
+
+
+
+
+
+
–
–
–
0.43
0.49
0.38
0.01
0.40
0.25
0.43
(10 alleles approx 0.80)
(6 alleles approx 0.55)
0.33
the FVIII gene (Table 1). Seven of these polymorphisms are diallelic RFLP and
one, within the intron 7, is a nucleotide substitution (G/A) usually detected by
ASO-H (3).
The most useful intragenic polymorphic sites with high heterozygosity in
different ethnic populations are in intron 18 and intron 22, recognized with the
BclI and XbaI restriction enzymes, respectively. A closely linked polymorphism recognized by the BglII restriction is also highly informative, but with a
5% theoretical chance of recombination. All three of these RFLPs have originally been identified and analyzed by Southern blotting. However, this method
is time-consuming and may need the radioactive method for DNA band visualization. To this end, the BclI intragenic RFLP method has now been replaced
by a fast and nonradioactive polymerase chain reaction (PCR) analysis (4,5).
1.1. Use of Southern Blotting in BclI RFLP Analysis of Hemophilia A
This method involves a series of techniques some of which are dealt with in
detail elsewhere (6). These techniques include extraction of DNA from blood
samples, digestion with appropriate restriction enzyme and electrophoresis, preparation, extraction, isolation, purification, and radiolabeling of the DNA probe,
Southern blotting, hybridization, and, finally, autoradiography for DNA band
visualization.
2. Materials
2.1. Restriction of DNA with the BclI Enzyme
1. Assay buffer (10X): The composition of this buffer varies from one manufacturer to another. For example, the composition of Amersham Pharmacia Bio-
Restriction Fragment Length Polymorphism
31
tech (Amersham Pharmacia Biotech, Buckinghamshire, UK) reaction buffer
called One-Phor-All buffer PLUS (OPA) is 10 mM Tris-HCl (pH 8.0), 100 mM
KCl, 10 mM MgCl2, 10 mM β-Mercaptoethanol (β-ME), 100 µg bovine serum
albumin (BSA)/mL.
2. 200 µg/mL BSA.
3. Loading buffer (LB): 30% xylene in 30% glycerol.
4. See Notes 1–4 for the restriction enzyme.
2.2. Southern Blotting
1. 0.25 M HCl.
2. Standard saline citrate (SSC) (20X): 175.3 g/L NaCl and 88.2 g/L trisodium citrate. Adjust to pH 7.0 with concentrated HCl.
3. Denaturation buffer: 87.66 g/L NaCl and 20 g/L NaOH.
4. Neutralization buffer: 60.55 g/L Tris and 87.66 g/L NaCl. Adjust to pH 7.4 with
concentrated HCl.
5. 0.4 M NaOH.
6. Amersham Hybond-N + (nylon) (Amersham Pharmacia Biotech, Buckinghamshire, UK) as transfer membrane
7. Whatman 3MM chromatography paper (Whatman International, Ltd., Maidstone, Kent, UK).
3. Methods
3.1. Restriction of DNA
1. Isolate and purify DNA using standard methods.
2. Pipet a desired amount (about 25 µg) of DNA into a small Eppendorf tube and
dilute to 20 µL with distilled water.
3. Add 3 µL of the appropriate 10X assay buffer, 5 µL of 200 µg/mL BSA, and an
appropriate number of units (usually 10 U) of the restriction enzyme diluted in
dilution buffer (usually supplied with the enzymes) as desired, in a 2-µL volume
(see Notes 2 and 3).
4. Mix by pipetting and incubate at desired temperature for at least 60 min, preferably 3 –4 h.
5. Centrifuge contents in bench-top microcentrifuge at full speed to recover the full
content of the tubes.
6. Add 6 µL of loading buffer mixture and mix thoroughly.
7. Load the samples into a suitable size submarine gel well without touching the
sides (see Note 4).
8. Electrophorese the gel at 30 V for 8 h, but usually overnight.
9. Observe the gels on an ultraviolet (UV) transilluminator and make a permanent
record by taking a photograph of the gel. If the DNA has been digested properly,
a smearing from the well to the bottom of the gel should be present.
3.2. Southern Blotting
This method is used for the determination of the molecular sizes of the DNA
fragments after digestion with restricted enzymes and gel electrophoresis. DNA
32
Enayat
fragments are transferred to a nylon membrane for reaction with a labeled probe
for band visualization and molecular-weight sizing of each of the fragments.
All of the procedures are done at room temperature and the buffers used do
not have to be sterile.
1. After electrophoresis, trim away unwanted areas in the gel. Mark on the corner
for gel orientation and identification.
2. Soak the gel in 0.25 M HCl for 15 min with gentle agitation on an orbital shaker (see
Note 5).
3. Wash the gel twice with denaturation buffer for 30 min.
4. Neutralize the gel by replacing fluid with neutralization buffer and soak as in
step 2 for 30 min and repeat (see Note 6).
5. While the gel is in final soak, construct a bridge for blotting. Cut a piece of the
3MM paper to the same width as the base glass plate but long enough to form a
wick into the buffer compartment over the edges of the bridge.
6. After the final soak in the neutralization buffer, pour off the excess fluid and take
up the gel onto a spare piece of 3MM paper.
7. Place the gel onto the bridge with the DNA side up.
8. Smooth out the gel gently with a gloved finger to remove any air bubbles between
the bridge and the gel.
9. Cut piece of Hybond-N+ membrane to the approximate size of the gel and place
on the gel. Trim to the exact size of the gel, again ensuring that no air bubbles are
trapped underneath the membrane.
10. Cut two or three pieces of paper to the size of the gel and then presoak briefly in
2X SSC. Layer on top of membrane.
11. Surround the bridge/gel with Saran Wrap to prevent buffer bypass and evaporation.
12. Cut a stack of paper towels to size and place on top of the presoaked papers.
Finally, compress with a glass plate and a 1- to 1.5-kg weight.
13. Add transfer buffer (approx 400 mL) 0.4 M NaOH and allow the DNA to
transfer overnight.
14. After blotting, carefully remove the membrane and soak in 2X SSC to remove
any adherent agarose.
15. Briefly blot dry the membrane, which is now ready for either storage at 4°C or
immediate hybridization.
3.3. Hybridization and Autoradiography
There are many different methods of hybridization that are dealt with elsewhere (6). However, after hybridization, the filter is probed with a 32P-labeled
DNA fragment from the FVIII gene. This genomic probe, called p114.12, is a
647-bp StuI/SacI-restricted FVIII (7). The probed filter is exposed to an X-ray
film (Hyperfilm MP, Amersham) for 4 –7 d at –70°C in a cassette fitted with an
intensifying screen. In this polymorphism, a restriction fragment of variable
length of 879 bp and/or 1165 bp can be detected in Southern blots of genomic
DNA. About 42% of females are heterozygous at this locus. Figure 1 shows the
Restriction Fragment Length Polymorphism
33
Fig. 1. A family with history of hemophilia A was investigated for BclI polymorphism and found to be fully informative. Patient (II:2) has inherited the hemophilic
haplotype (0.8 bp) from her mother, who is the daughter of a hemophiliac and an
obligate carrier. The patient’s sister (II:1) is also a carrier and has the hemophilic
haplotype, whereas his other sister (II:3) is unaffected. She has inherited the unaffected
1.1-bp haplotype from her mother.
Southern blot using restricted DNA samples with BclI and probed with the
32P-labeled p114.12 probe.
3.4. Use of PCR and BclI RFLP Analysis in Hemophilia A
The same RFLP, identified by BclI Southern blotting, has now been demonstrated by PCR followed by digestion with the restriction enzyme (6). The PCR
product of this highly polymorphic allele gives a 142-bp (–) allele and 99+43bp (+) allele after restriction with the enzyme (see Fig. 2).
4. Notes
1. Keep the restriction enzyme cold at all times; if removed from the freezer, it
should be immediately kept on ice. In the majority of cases, it can be used straight
from the freezer.
2. Reaction volume here is fixed at 30 µL, as it is manageable. Generally, the smaller
the volume, the better. Note that if the reaction volume is changed:
a. Change the volume 10X assay buffer.
b. Ensure that the enzyme added is <10% of the reaction volume.
c. LB mixture added is one-fifth the reaction volume.
34
Enayat
Fig. 2. BclI-restricted (lanes 3, 5, and 7) and -unrestricted (lanes 2, 4, and 6) PCR
products, showing 142-bp (–) and 99-bp (+) fragments. Lane 1 is the molecularweight marker.
3. Less enzyme can be used if the incubation period is lengthened.
4. To ensure adequate digestion before full-size gel electrophoresis, a minigel
should be run. During digestion, remove 2 – 3 µL of reaction mix and add 6 µL
LB mixture. Load into 1% minigel and run at 50 – 60 mA for 1 h. View under UV
illumination to check digestion (see Chapter 1).
5. HCl acid denaturation allows large >13-kb fragments to be transferred more efficiently by breaking the DNA into smaller fragments. Do not leave in HCl for
more than 30 min or smaller DNA fragments will also be broken up into <300 bp,
significantly reducing the ability to DNA to bind covalently to the membrane.
6. Gels may be left in neutralization buffer for longer than 1 h with no adverse
effects if kept at 4°C so as to limit diffusion. Maximum time in neutralization
buffer is 4 h.
References
1. White, G. C. and Shoemaker, C. B. (1989) Factor VIII and haemophilia A. Blood
73, 1–12.
2. Peake, I. R., Lillicrap, D. P., Boulyjenkov, V., Briet, E., Chan, V., et al. (1993)
Report of a joint WHO/WFH meeting on the control of haemophilia: carrier
detection and prenatal diagnosis. Blood Coag. Fibrinol. 4, 313 – 344.
3. Peake, I. (1995) Molecular genetics and counselling in haemophilia. Thromb.
Haemost. 74, 40 – 44.
Restriction Fragment Length Polymorphism
35
4. Gitschier, J., Drayna, D., Tuddenham, E. G. D., White, R. L., and Lawn, R. M.
(1985) Genetic mapping and diagnosis of haemophilia A achieved through a BclI
polymorphism in the factor VIII gene. Nature 314, 738–740.
5 Gitschier, J., Lawn, R. M., Rotblat, F., and Goldman, E. (1985) Antenatal diagnosis and carrier detection of haemophilia A using factor VIII gene probe. Lancet 1,
1093–1094.
6. Rapley, R., ed. (2000) The Nucleic Acid Protocol Handbook. Humana Press,
Totowa, NJ.
7. Kogan, S. C., Doherty, N., and Gitschier, J. (1987) An improved method for
prenatal diagnosis of genetic diseases by analysis of amplified DNA sequences:
application to haemophilia A. New Engl. J. Med. 317, 980 –990.
150
Wells
PCR: Principles, Procedures, and Parameters
37
6
PCR
Principles, Procedures, and Parameters
Nicola Louise Jones
1. Introduction
In 1983, the Cetus scientist Kary Mullis developed an ingenious “in vitro”
nucleic acid amplification technique termed the polymerase chain reaction
(PCR). This technique involves the use of a pair of short (usually 20 bp long)
pieces of synthesized DNA called primers and a thermostable DNA polymerase
to achieve near-exponential enzymatic amplification of target DNA. Because
of the sensitivity of this technique, DNA of relatively poor condition may
be amplified, as only short intact sequences are required. Therefore, it is not
always necessary to carry out lengthy template sample preparation. For example,
a simple boiling step is often enough to release DNA from blood samples (1).
The starting material for PCR may be DNA from a variety of sources such as
blood, tissues, paraffin-embedded material, ancient archaeological samples, or
forensic material. The PCR may also be used to amplify RNA, which must first
be converted into cDNA by the enzyme reverse transcriptase (RT-PCR). In
contrast to DNA, great care must be taken in the preparation and handling of
RNA because of its instability and susceptibility to degradation.
Polymerase chain reaction proceeds in three stages:
1. Denaturation of double-stranded DNA. (This initial denaturation step is not
necessary when amplifying RNA because it is a smaller target molecule.)
2. Primer annealing.
3. Extension of the annealed primers.
The target DNA is suspended in a reaction mixture consisting of distilled
water, buffer (containing MgCl2, which is necessary for the polymerase to work
From: Methods in Molecular Biology, vol. 187: PCR Mutation Detection Protocols
Edited by: B. D. M. Theophilus and R. Rapley © Humana Press Inc., Totowa, NJ
37
38
Jones
Fig. 1. Basic steps in the PCR cycle. Hatched lines indicate target DNA. Filled
boxes represent annealed primers. See text for further details.
efficiently), the thermostable Taq polymerase, and each of the four deoxynucleotide triphosphates (dNTPs). Also present are a pair of primers whose sequences
are complementary to that of the DNA flanking the target region. Numerous
parameters must be taken into consideration when designing the primers (see
Note 1).
The reaction mixture is first heated to denature the double-stranded DNA
into single strands, then cooled to an optimum temperature to facilitate primer
annealing. The primer pair consists of a forward “sense” primer that binds to its
complementary sequence upstream of the region to be amplified and a reverse
“antisense” primer that binds downstream, both with their 3' ends facing inward.
During primer extension the DNA polymerase progressively adds dNTP’s,
complementary to the target, to the 3' end of each primer so that the target
sequence is copied. The 5' ends of the primers defines the length of the PCR
product. These three steps constitute a PCR cycle (see Fig. 1). Usually, 30
cycles are performed in a programmable thermal cycler, with each cycle theoretically doubling the quantity of target sequence. This exponential increase is
not achieved practically however because of the exhaustion of the PCR components and the accumulation and reannealing of product strands.
Polymerase chain reaction is a very sensitive and specific molecular biology
technique. Its versatility is demonstrated by the growing array of technical
PCR: Principles, Procedures, and Parameters
39
modifications that lend PCR to multiple applications. Such variations include
RT-PCR, nested, multiplex, long-range, and allele-specific PCR.
1. RT-PCR: RNA may be amplified following its conversion to cDNA by the enzyme
reverse transcriptase. The use of RNA as a starting material ensures that only the
coding regions, or exons, are amplified during the PCR reaction. RT-PCR not only
provides a useful tool for analyzing the transcriptional activity of genes but also
enables the investigation of many contiguous exons in a single analysis.
2. Nested PCR: This involves the use of two sets of primers. The first set (external
primers), which flanks the region of interest, allows for a first round of amplification. A small aliquot from the first round of PCR is then used as the target for
a second round of amplification, primed by a second pair of primers that lie internal to the first. This technique is designed to increase the sensitivity of the PCR
reaction and is particularly useful for the amplification of small quantities of
target material from readily accessible cell types expressing very low levels of
mRNA. For example, Factor VIII mRNA present at a quantity of 1 molecule per
500–1000 cells can be amplified in this manner from the lymphocytes of hemophilia A patients (2).
3. Multiplex PCR: More than one target sequence can be amplified in a single PCR
reaction by using multiple primer pairs. Multiplex PCR has been utilized in the
analysis of deletions, mutations, and polymorphisms as well as in RT-PCR and
quantitative assays (3). A specific application of multiplex PCR is in deletion
screening of the dystrophin gene in patients with Duchenne muscular dystrophy.
4. Long-range PCR: It is possible to amplify long fragments of DNA (>20 kb) using
an enzyme mixture of Taq and Pwo DNA polymerases. High yields of PCR products from episomal and genomic DNA can be obtained from this powerful polymerase mixture. An example of its application is in the routine diagnosis of
Fragile X syndrome. The mutation in Fragile X syndrome involves the expansion
of CGG repeats in the FMR1 gene. These repeats are resistant to amplification by
ordinary PCR methods possibly because of the stopping or pausing of the Taq
polymerase enzyme during the amplification of regions containing high levels of
CGG repeats (4). The presence of Pwo polymerase, with its proofreading ability,
can reduce this error frequency, whereas improved cycle and buffer conditions
can overcome the length limitation for PCR. Thiel et al. (5) have reported a system encompassing the effective amplification of up to 20 kb of viral genomic
RNA. The subject of long-range PCR is reviewed in Chapter 8.
5. Allele-specific PCR: PCR can be used to discriminate between alleles by using
allele specific oligonucleotides as primers. Successful PCR amplification requires
that the 3' end of the primers are complementary to the target DNA sequence; any
mismatch results in the inability of Taq polymerase to extend the primer. This
phenomenon can be exploited by designing primers that contain a base at the 3'
end that matches either that of a known mutation or its wild-type counterpart.
These primers will only anneal to and amplify target DNA containing that par-
40
Jones
ticular sequence. Allele identity may therefore by determined by the presence or
absence of PCR products. Diseases that encompass only one mutation are particularly well suited to this technique. Examples include the Prothrombin 20210A
mutation (6), sickle cell anemia, Fc-γ receptor IIA polymorphism (7), and
α-1antitrypsin deficiency, where the technique is termed the amplification refractory mutation system (ARMS). Allele-specific PCR is reviewed in Chapter 7.
Polymerase chain reaction plays two roles in molecular biology. First, it provides enough material to allow further technical manipulations such as for the
detection of mutations, conformation sensitive gel electrophoresis (e.g., in mutation screening methods such as chemical mismatch cleavage, single-strand conformational polymorphism, denaturing gradient gel electrophoresis, and DNA
sequencing). Second, it can be used analytically as a direct tool in mutation
detection as in allele-specific PCR and multiplex for deletion analysis. Following are given two standard methods for PCR: first, for amplification of DNA
and, second, for amplification of RNA by first converting it to cDNA. The many
variations on the standard method are covered in later chapters of this volume.
2. Materials
2.1. DNA PCR
1. Programmable thermal cycler.
2. Sterile distilled water (use as fresh).
3. Solution A: containing MgCl2 and a source of buffer/salt (usually KCl and
Tris-HCl) at a pH of 8.3. In our laboratory, solution A comprises 670 mM
Tris-HCl, 166 mM ammonium sulfate, and 67 mM magnesium chloride. Twentymilliliter batches are usually prepared and stored at room temperature for up to
1 mo (see Note 2).
4. 10X Reaction buffer: To 1 mL of solution A, add 34 µL of 5% bovine serum
albumin (BSA) and 7 µL of 14.4 M β-mercaptoethanol. (Note: β-Mercaptoethanol
is toxic; use in a fume cupboard.) Store at –20°C for up to 1 mo (see Note 3).
5. 5 mM dNTPs: dilute 50 mM stock solution of dNTPs (i.e., dATP, dCTP, dGTP,
and dTTP) in distilled water. Store at -20°C for up to 1 mo.
6. 15 pmol primers 1 (forward) and 2 (reverse): approx 0.1 µg/µL for a 20-mer.
7. 5 U/µL Taq polymerase.
8. Mineral oil. Store at room temperature.
2.2. RT-PCR
1. Programmable thermal cycler.
2. Sterile distilled water. Use fresh and keep supply separate from that used for
DNA PCR.
3. 15 pmol of primers 1 (forward) and 2 (reverse): approx 0.1 µg/µL for a 20-mer.
Store at –20°C.
PCR: Principles, Procedures, and Parameters
41
4. 10X Reaction buffer (see Subheading 2.1., items 3 and 4).
5. 5 mM dNTPs (see Subheading 2.1., items 5).
6. 5X Reverse transcriptase (RT) buffer containing 250 mM Tris-HCl, pH 8.3,
375 mM KCl, and 15 mM MgCl2. This is usually supplied with the reverse
transcriptase. Store at –20°C.
7. Maloney Murine Leukaemia Virus (MMLV) Reverse Transcriptase (200 U/µL).
Store at –20°C.
8. 100 mM Dithiothreitol (DTT). Store at –20°C.
9. Rnase inhibitor (50 U/µL). Store at –20°C.
10. 5 U/µL Taq polymerase. Store at –20°C.
11. Mineral oil. Store at room temperature.
3. Methods
3.1. DNA PCR
Note: Always wear, and frequently change, gloves to prevent contamination
by DNA from human skin cells. As likely sources of contamination include
other samples and previous amplification products, separate rooms, away from
sites of DNA/RNA extraction, manipulation, and recovery of PCR products,
should ideally be allocated for the setup of PCR. Designate separate sets of
pipets for DNA and RT-PCR and use filter tips whenever possible. Solutions
and buffers must be stored in sterile containers and always prepared with fresh
distilled water.
1. Into a sterile tube, prepare the following master mix according to the number of
samples to be analyzed:
10 µL of 10X reaction buffer;
10 µL of 5 mM dNTPs;
15 pmol primer 1 (approx 0.1 µg for a 20-mer);
15 pmol primer 2 (approx 0.1 µg for a 20-mer);
0.5 µL (2.5 U) Taq polymerase;
Distilled water to a volume of 98 µL per sample.
2. Aliquot 98 µL of master mix into a PCR reaction tube. Add 2 µL genomic DNA
(50 µg/mL) to give a final volume of 100 µL. PCR may be done in much smaller
volumes down to 10 µL, especially for analytical PCR, by reducing the reaction
components proportionately.
3. Always perform a blank control alongside the samples by replacing the genomic
DNA with dH2O. This will check for contamination.
4. Overlay the reaction mixture with 1 drop of mineral oil to prevent evaporation,
unless using an “oil-free” thermal cycler that has a heated lid to prevent evaporation.
5. Denature the template for 5 min at 94°C.
6. PCR at the following settings for 30 cycles:
42
Jones
a. Denaturation: 94°C for 1 min.
b. Annealing: 55 – 65°C for 1 min (adjust temperature according to the calculated
Tm of the primers; see Note 1).
c. Extension: 72°C for 3 min (optimum temperature for Taq polymerase activity)
(see Note 4).
7. Analyze 10 µL of the sample on a 1–2% agarose gel containing ethidium bromide.
(Ethidium bromide is carcinogenic.) See Chapter 1.
3.2. RT-PCR
Note: Follow the same precautions outlined in the note at the beginning
of Subheading 3.1. The sterile technique is even more critical with RT-PCR
than DNA PCR in order to prevent RNA degradation as well as protecting
against contamination.
1. Pipet 5 µL (0.2 –0.5 µg) RNA into a sterile PCR reaction tube. Always run a
blank alongside the sample by replacing the RNA with distilled water.
2. Prepare a premix of 15 pmol primer 2 (reverse primer) and distilled water to a
volume of 2.5 µL per sample. Add 2.5 µL of premix to the RNA. Overlay with
mineral oil (see Note 5).
3. Incubate at 65°C for 10 min.
4. Prepare the following premix according to the number of samples to be analyzed:
4 µL of 5X RT buffer;
2 µL of 100 mM DTT;
1 µL of MMLV Reverse Transcriptase (200 U);
0.5 µL of RNase inhibitor (25 U);
5 µL of 5 mM dNTPs.
5. Add 12.5 µL of this second premix to each sample. Incubate at 42°C for 1 h.
6. Prepare a PCR mix:
5 µL of 10X reaction buffer;
15 pmol primer 1 (forward primer);
2.5 U Taq polymerase;
Distilled water to a volume of 30 µL per sample.
7. Add 30 µL of the PCR mix to each sample.
8. Perform 30 PCR cycles at the following settings:
a. Denaturation: 93°C for 1 min.
b. Annealing: 55 – 65°C for 1 min (adjust according to the calculated Tm of the
primers; see Note 1).
c. Extension: 72°C for 5 min (see Note 4).
9. Remove 10 µL of sample for analysis on a 1–2% agarose gel containing ethidium
bromide (carcinogen). See Chapter 1.
3.3. Troubleshooting
1. Inadequate design of the primers may result in the formation of a hairpin loop.
This is where internal complementarity of the primer sequence enables it to bind
to itself rather than the DNA template so that the PCR cannot proceed.
PCR: Principles, Procedures, and Parameters
43
2. Complementarity between a primer pair allows them to bind to each other, thus
forming “primer-dimers.” As with internal complementarity, the primers are no
longer free to bind to the DNA template, resulting in failure of the PCR. Primerdimers can also be produced as a byproduct of a successful PCR if the primers
are present in excess (8).
3. Heparin, porphyrins, and high concentrations of ionic detergent (e.g., Proteinase
K, phenol, and sodium dodecyl sulfate), inhibit PCR.
4. As RNase enzymes can degrade target RNA, RT-PCR requires the use of Rnasefree reagents and equipment to prevent false-negative results.
5. Polymerase chain reaction failure or poor yield may result from a low target copy
number (e.g., where the RNA is from cell types expressing low levels of target
material). This may be remedied by using a second set of primers, as in nested
PCR (see Note 6).
6. It has been noted that mineral oil breaks down under 254-nm UV light, with
breakdown products inhibiting PCR. Remedial suggestions include the addition
of 0.1% of the antioxidant 8-hydroxyquinoline to the mineral oil prior to UV
treatment (8).
7. False negatives may also result from “stalling” of the Taq DNA polymerase
during primer extension. This occurs when regions of target DNA form secondary structures (9). Suggestions for overcoming this problem include adding
glycerol or tetramethylammonium chloride (TMAC) to the PCR mix. Elimination of buffer components stabilizing these secondary structures (e.g., KCl) may
also help.
8. If the annealing temperature is too high, the primers will not bind to the target
DNA, and PCR failure may ensue. Conversely, if the temperature is too low,
nonspecific binding will occur.
9. It has been suggested that an increase in amplification products from GC-rich
sequences may be obtained following the addition of either betaine or trimethylamine N-oxide to the PCR reaction. Betaine is thought to reduce the formation of secondary structures caused by GC-rich regions, however, the effect
of betaine on the fidelity of Taq polymerase is unknown (10).
10. Reagents and plasticware may be treated with UV irradiation to convert contaminating DNA into a nonamplifiable form. Times and conditions for irradiation are
dependant upon the energy of irradiation, length of contaminating DNA, and its
thymidine content.
11. To control contamination, PCR may be performed routinely with dUTP substituted for dTTP. Treatment of PCR reactions with uracil N-glycosylase then prevents contamination by carry over of PCR products from a previous reaction.
12. In order to eliminate false primer binding in the initial stages of DNA PCR,
which may produce nonspecific products, a technique known as “hot-start” PCR
can be used. Hot-start PCR ensures the physical separation of one essential
component of the PCR reaction (e.g., primers or Taq polymerase) prior to denaturation of the DNA template. Using a solid wax bead keeps the reagents separate. Upon heating, the wax bead melts and the components mix. An alternative
approach involves the use of a variant Taq polymerase that is inactive at room
44
Jones
temperature but is activated at 94°C. Conversely, the missing component can be
added manually immediately following the initial 5-min denaturation at 94°C
4. Notes
1. Primers are usually 20 bp in length, but typically between 15 and 30 bp with
approx 50% GC content. It is desirable to have a G or C at the 3' end, as this binds
to the target DNA with a triple hydrogen bond, thus anchoring the primer more
effectively than A or T. The primers should not contain self-complementary
sequences that might produce loop back or hairpin structures. The annealing
temperature of the primers varies according to their sequence, but, it is usually
50–65°C. For primers up 20 bp in length, the theoretical melting temperature
(Tm) (in °C) can be calculated approximately as:
2× (Number of A/T bases) + 4× (Number of G/C bases)
2.
3.
4.
5.
6.
The starting point for determining the optimal annealing temperature is approx
5–10°C below that of the primer with the lowest Tm. Ideally, the two primers
should have similar Tm’s. The primers usually completely complement the
sequence of interest, although for specific purposes such as allele-specific PCR,
primers with mismatches to the target sequence may be used. See Chapter 7.
The pH of the reaction buffer is important, as enzymes are sensitive to pH
changes. The optimal pH for Taq polymerase activity is 8.3. The magnesium
concentration of the buffer is also critical. Insufficient Mg2+ leads to low product
yields, whereas excessive Mg2+ gives nonspecific products. Free magnesium, in
addition to that complexed to dNTPs, is required for the polymerase to work
efficiently. Therefore, because the concentration of dNTPs affects the amount of
free Mg2+, optimum concentrations of MgCl2 should be determined for each PCR
protocol.
The addition of denaturants and other reagents such as dimethyl sulfoxide
(DMSO), formamide, glycerol, polyethylene glycol (PEG), Triton X-100, bovine serum albumin, and spermadine appear to enhance the PCR reaction. Such
compounds may stabilize the polymerase, prevent loop-back sequences, and
increase the specificity of primer binding.
Owing to the superior quality of modern Taq polymerases and the technological
advances in thermal cyclers, it is often possible to reduce the extension time to
approx 1 min/kb.
In the protocol described, the primer that is used subsequently as the reverse
primer in the PCR reaction is also used to prime the cDNA reaction. As an alternative, the cDNA may be primed by an oligo-dT primer, which binds to the poly
A tail present at the 3' end of most mammalian mRNAs, or by “random
hexamers.” In these cases, the whole mRNA population is converted to cDNA,
and both forward and reverse PCR primers must be added subsequently to
amplify the sequence of interest.
Nested RT-PCR: Follow steps 1–8 in Subheading 3.2., then make the following
master mix:
PCR: Principles, Procedures, and Parameters
45
10 µL of 10X reaction buffer;
10 µL of 5 mM dNTP;
15 pmol primer 3 (internal forward primer);
15 pmol primer 4 (internal reverse primer);
2.5 U Taq polymerase;
Distilled water to a volume of 98 µL per sample.
To 98 µL of master mix, add 2 µL of the primary PCR product (this may also be
done in a 50 µL or smaller reaction). Overlay with mineral oil (except when
using an oil-free thermal cycler that has a heated lid to prevent evaporation).
Perform 30 cycles at the following settings:
a. Denaturation: 93°C for 1 min.
b. Annealing: 55 – 65°C for 1 min (adjust according to the calculated Tm of the
primers; see Note 1).
c. Extension: 72°C for 5 min (see Note 4).
Link to a program of:
a. 72°C for 2 min.
b. 4°C soak.
Remove 10 µL of sample for analysis on a 1– 2% agarose gel containing
ethidium bromide (carcinogenic). See Chapter 1.
Acknowledgments
The author wishes to express her gratitude to Mr. Charles Williams (Head
MLSO, Haematology Department, Birmingham Children’s Hospital) for his
help and support in the writing of this chapter.
References
1. Rapley, R. (1998) Polymerase chain reaction, in Molecular Biomethods Handbook (Rapley, R. and Walker, J. M., ed.), Humana, Totowa, NJ, pp. 305 – 325.
2. Cooper, D. N. and Krawczak, M., ed. (1993) Human Gene Mutation, BIOS Scientific, Oxford.
3. Henegariu, O., Heerema, N. A., Dlouhy, S. R., Vance, G. H., and Vogt, P. H.
(1997) Multiplex PCR: critical parameters and step-by-step protocol. Biotechniques 23, 504 – 511.
4. Hecimovic, S., Barisic, I., Muller, A., Petkovic, I., Baric, I., Ligutic, I., et al.
(1997) Expand Long PCR for Fragile X mutation detection. Clin. Genet. 52,
147–154.
5. Thiel, V., Rashtchian, A., Herold, J., Schuster, D. M., Guan, N., and Siddell, S.G.
(1997) Effective amplification of 20-kb DNA by reverse transcription PCR.
Anal. Biochem. 252, 62–70.
6. Poort, S. R., Bertina, R. M., and Vos, H. L. (1997) Rapid detection of the prothrombin 20210A variation by allele specific PCR. Thromb. and Haemost. 78,
1157–1163.
46
Jones
7. Flesch, B. K., Bauer, F., and Neppert, J. (1998) Rapid typing of the human Fcγ
receptor IIA polymorphism by polymerase chain reaction amplification with
allele-specific primers. Transfusion 38, 174–176.
8. Dzik, S. (1998) The power of primers. Transfusion 38, 118 –121.
9. Hengen, P. N. (1997) Optimizing multiplex and LA-PCR with betaine. Trends
Biomed. Sci. 22, 225 – 226.
10. Henke, W., Herdel, K., Jung, K., Schnorr, D., and Loening, S. A. (1997) Betaine
improves the PCR amplification of GC-rich DNA sequences. Nucl. Acids Res.
25(19), 3957– 3958.
Further Reading
Bauer, P., Rolfs, A., Regitz-Zagrosek, V., Hildebrandt, A., and Fleck, E. (1997)
Use of manganese in RT-PCR eliminates PCR artifacts resulting from Dnase I
digestion 2. Biotechniques 2, 1128 –1132.
Maudru, T. and Peden, K. (1997) Elimination of background signals in a modified
polymerase chain reaction-based reverse transcriptase assay. J. Virol. Meth. 66,
247–261.
Tang, Y., Procop, G. W., and Persing, D. H. (1997) Molecular diagnostics of
infectious diseases. Clin. Chem. 43(11), 2021–2038.
Vaneechoutte, M. and Van Eldere, J. (1997) The possibilities and limitations of
nucleic acid amplification technology in diagnostic microbiology. J. Med.
Microbiol. 46, 188–194.
Allele-Specific Oligonucleotide PCR
47
7
Allele-Specific Oligonucleotide PCR
Elaine K. Green
1. Introduction
Many single-base substitutions that lead to inherited diseases, the predisposition to genetic disorders, and cancer are increasingly being discovered. The
ability to amplify specific DNA sequences by the polymerase chain reaction
(PCR) (1) has made it possible to rapidly and accurately diagnose many inheritable diseases.
Prior to the use of PCR, point mutations were identified by using direct
cloning and sequencing, Southern blotting and hybridization with labeled
oligonucleotide probes centered on the site of the mutation or digestion with
restriction endonucleases. These methods have been greatly enhanced by PCR,
which allows amplification of DNA fragments containing the polymorphic sites
from minute quantities of DNA. However, these techniques tend to be timeconsuming, complex, require the use of radioactive label, and, in the case of
the restriction endonuclease detection, are only applicable when the mutation
alters a known cleavage site.
Polymerase chain reaction using allele-specific oligonucleotides (ASOs) is
an alternative method for the detection of mutations in which only the perfectly matched oligonucleotide is able to act as a primer for amplification. The
advantage of ASO PCR is that it is a rapid, simple, and nonradioactive method.
ASO-PCR, otherwise known as the amplification refractory mutation system
(ARMS) was first described for the detection of mutations in the α1-antitrypsin
gene (2). It has since been adopted in the study of a number of genes, including
prenatal diagnosis of cystic fibrosis (3), polymorphisms of apolipoprotein E
(4,5), and point mutations in the ras oncogene (6). In this technique oligonucleotide primers are designed such that they are complementary to either the norFrom: Methods in Molecular Biology, vol. 187: PCR Mutation Detection Protocols
Edited by: B. D. M. Theophilus and R. Rapley © Humana Press Inc., Totowa, NJ
47
48
Green
Fig. 1. Principle of allele-specific oligonucleotide PCR. Allele-specific oligonucleotides allow amplification of a sequence of DNA to which they are perfectly homologous (1), but not one containing a mismatch (2).
mal (wild-type) or mutant sequence, and both are used in conjunction with a
common primer. Because DNA polymerase lacks a 3' exonuclease activity, it
is unable to repair a single-base mismatch between the pimer and the template
at the 3' end of the DNA primers. Thus, if oligonucleotide primers are designed
to contain mismatches close to or at the 3' end, the primer will or will not be
extended depending on which alternative single-base polymorphisms are
present in the target sequence. Hence, under the appropriately stringent conditions, only target DNA exactly complementary to the primer will be amplified,
as shown in Fig. 1.
2. Materials
All reagents should be of molecular biology grade and solutions made up
with sterile distilled water.
1. PCR reaction buffer (10X): 100 mM Tris-HCl, pH 8.3, 500 mM KCl, 15 mM
MgCl2, 0.01% gelatin. Autoclave and store at –20°C (see Note 1).
Allele-Specific Oligonucleotide PCR
49
2. Nucleotide mix: 200 mM each of dATP, dCTP, dGTP, and dTTP in sterile distilled water and store at –20°C.
3. Allele-specific oligonucleotide primers and common primer: 10 µM. Store at –20°C
(see Note 2).
4. DNA Taq polymerase.
5. Sterile distilled water.
6. Sample DNA (see Note 3).
7. Mineral oil.
3. Methods
1. To 0.5 mL Eppendorf tube, add 5 µL 10X reaction buffer, 5 µL nucleotide mix,
5 µL ASO primer (either wild or mutant type primer) (see Note 4) and 5 µL
common primer, 100 ng template DNA, and 2 U Taq polymerase (see Note 5),
make up to a final volume of 50 µL with sterile distilled water (see Note 6) and
overlay with mineral oil to prevent evaporation.
2. Place Eppendorf tubes on the thermal cycler to amplify the DNA by repeated
cycles of denaturation, annealing, and extension: initial denaturation of 94°C for
5 min, followed by 30 cycles of 94°C for 30 s, 55°C for 30 s and 72°C for 1 min
(see Note 7).
3. Following thermal cycling, electrophoresis 10 µL of the reaction sample through
an agarose gel, with a DNA size marker and stain with ethidium bromide. A
typical result is shown in Fig. 1 (see Note 8).
4. Notes
1. The concentration of MgCl 2 may be altered (0.5–5 mM) to optimize the
specificity and yield of the reaction.
2. The design of the ASO PCR primer is essential for specific amplification of the
template. Primers are synthesized in two forms (the wild or normal type and
the mutant), with the correspondingly different bases at the 3' end. However, a
single mismatch is often not enough to prevent nonspecific amplification and the
introduction of additional deliberate mismatches near the 3' terminal end (e.g.,
four bases from the 3' end) of the primers may overcome this problem. Several investigations have examined the effect of the type of the 3' terminal primer–template
mismatches on the PCR amplification (2–7), however it appears to differ depending
on the gene being studied. Where possible, select primers of random-base distribution and approx 50% GC content. The primers should not be complementary to
each other or contain a sequence with significant secondary structure. The common primer should be designed to give a product of suitable size (e.g., 200 bp).
3. A concentration 100 ng of template DNA is usually sufficient to amplify.
4. Two reactions are required for the detection of a point mutation: one including
the wild type and common primers, and the other with the mutant type and common primers.
5. Addition of the Taq polymerase following the initial denaturation step while the
PCR reaction is held at 80°C prior to the cycling reactions may increase the specificity of the PCR products.
50
Green
6. The volume of PCR reaction can be altered according to requirements: 10 –100 µL.
7. These are standard PCR reaction conditions, which may not amplify the template
specifically. By varying the conditions and constituents of the reaction (altering the
magnesium [0.5–5 mM], deoxynucleotide triphospates [dNTPs] [50–200 µM],
ASO primer concentration, DNA template, and Taq polymerase concentration
(1,8), and increasing the annealing temperature), this may be overcome. A good
indication of the correct annealing temperature is the melting template of the
oligonucleotide primers. This can calculated using the formula 64.9 + 0.41
(%C + %G) – 600/n. The addition of specificity enhancers such as DMSO (10%)
(9), may also increase the specificity. However, it may be necessary to redesign
the primers altering the 3' mismatches.
8. Amplification of a control DNA template with known point mutations will aid
the establishment of the ASO PCR. By including an internal control reaction,
such as β-globin amplification, the risk of false negatives will be reduced.
References
1. Saiki, R. K., Scharf, S., Faloona, F., Mullis, K. B., Horn, G. T., Erlich, H. A. et al.
(1985) Enzymatic amplification of β-globin genomic sequences and restriction
site analysis for diagnosis of sickle cell anaemia. Science 230, 1350–1354.
2. Newton, C. R., Graham, A., Heptinsall, L. E., Powell, S. J., Kalsheker, K., Smith,
J. C. et al. (1989) Analysis of point mutation in DNA. The amplification refractory mutation system (ARMS). Nucl. Acids. Res. 17, 2503–2516.
3. Newton, C. R., Summers, C., Schwarz, M., Graham, A., Heptinstall, LE.,
Super, M., et al. (1989) Amplification refractory mutation system for prenatal
diagnosis and carrier assessment in cystic fibrosis. Lancet II, 1481–1483.
4. Green, E. K., Bain, S. C., Day, P. J. R., Barnett, A. H., Charleson, F., Jones, A. F.
et al. (1991) Detection of human apolipoprotein E3, E2, and E4 genotypes by an
allele-specific oligonucleotide-primed polymerase chain reaction assay: development and validation. Clin. Chem. 37, 1263–1268.
5. Main, B. J., Jones, P. J., MacGillivary, R. T. A., and Banfield, D. K. (1991)
Apoliprotein E genotyping using the polymerase chain reaction and allelespecific oligonucleotide primers. J. Lipid Res. 32, 183–187.
6. Ehlen, T. and Dubeau, L. (1989) Detection of Ras point mutations by polymerase
chain reaction using mutation-specific, inosine-containing oligonucleotide
primers. Biochem. Biophys. Res. Commun. 160, 441–447.
7. Kwok, S., Kellog, DE., McKinney, N., Spasic, D., Goda, L., Levenson, C., et al.
(1990) Effects of primer–template mismatches on the polymerase chain reaction: human immunodeficiency virus type I model studies. Nucl. Acids Res. 18,
999–1005.
8. Rychlik, W., Spencer, W. J., and Rhoads, R. E. (1990) Optimisation of the
annealing temperature for DNA amplification in vitro. Nucl. Acids Res. 18,
6904–6912.
9. Winship, P. R. (1989) An improved method for directly sequencing PCR amplified
material using dimethyl sulphoxide. Nucl. Acids Res. 17, 1266.
Long-Range PCR
51
8
Long-Range PCR
Peter A. Davies and George Gray
1. Introduction
The heat-stable DNA polymerase utilized in the polymerase chain reaction
(PCR) has been widely used to amplify DNA fragments since its conception by
Kerry Mullis in 1985. However, it soon became apparent that there was a
constraint on the maximum size of amplified fragments. For genomic DNA,
this was 3–4 kb (1), whereas for phage lambda DNA amplifications of up to
15 kb have been possible (2).
The basis for this constraint is the rate of errors of misincorporation of Taq
DNA polymerase, which have been shown to be 2 × 10 – 4 to 2 × 10 – 5 (3) mutations per nucleotide per cycle. Incorporation of a mismatched base causes
strand extension to stall and the Taq DNA polymerase to dissociate from the
template strand. The longer the PCR product, the more likely misincorporation
is to occur.
Barnes (4) demonstrated that inclusion of a proofreading enzyme with the
Taq polymerase could greatly increase the length of amplified DNA strands.
The proofreader removes misincorporated nucleotides and allows the Taq polymerase to continue. Although capable of high-fidelity DNA synthesis, proofreading enzymes alone produce a low yield of amplified template. Combining
Taq polymerase with the proofreader produces an increased yield of a highfidelity long-range PCR product.
Using this mixture of enzymes, it is possible to obtain amplifications of 40 kb
from phage DNA clones and up to 22 kb from genomic DNA (5).
Applications of long-range PCR (L-PCR) include looking for structural rearrangements of mitochondrial DNA (mtDNA) in patients with neuromuscular
diseases (6), rapid alignment of clones in gene libraries, amplification and
mapping of chromosomal translocation break points, and successful amplifiFrom: Methods in Molecular Biology, vol. 187: PCR Mutation Detection Protocols
Edited by: B. D. M. Theophilus and R. Rapley © Humana Press Inc., Totowa, NJ
51
52
Davies and Gray
Table 1
Examples of Commercially Available L-PCR Kits
Product
name
Manufacturer
Expand™ Long Template
PCR System
Gene Ampl XL PCR Kit
Boehringer
Mannheim
Perkin-Elmer
Stratagene
Taq Plus™
DNA
polymerase
Proofreading
enzyme
Taq
Pwo
r Tth
Vent
Taq
Pfu
Note: L-PCR reaction mixes are used with the Expand™ Long Templates Kit as used for
mtDNA amplication in our department.
cation of long stretches of trinucleotide repeat expansions (7). L-PCR has also
been used to amplify RNA templates by first converting the RNA into a DNA
intermediate by use of a reverse-transcriptase (RT) enzyme (long RT-PCR).
The enzyme is a genetically engineered version of the Moloney Murine
Leukaemia Virus reverse transcriptase. Extension of the cDNA occurs in the
3' → 5' direction. A point mutation within the RNase H sequence prevents
5' → 3' exonuclease digestion of the growing cDNA strand. Long RT-PCR
applications include looking for deletions in exons and preliminary enrichment of sequences prior to subsequent PCR and mutation detection.
2. Materials
1. Template DNA: The quality of template DNA is of utmost importance. Many
methods are now available for DNA extraction. Care should be taken to select a
method that will provide the following:
a. Template DNA of a sufficiently high molecular weight for the intended size
of the L-PCR product.
b. Template of a sufficiently high purity.
2. Optimal primer design: This is essential to achieve successful amplification
(see Note 1).
3. dNTP and magnesium concentrations: To ensure efficient incorporation, the
concentration of dNTP’s is usually higher in L-PCR (300 – 500 µmol/L) than in
normal PCR (200 µmol/L), as is the magnesium concentration (see Note 2).
4. Polymerase mix: Since Barnes described the “narrow window of success” for
achieving amplification of long templates (4), many commercial kits have been
developed with optimal mixes of Taq DNA polymerase and proofreader enzyme
(see Table 1). The amount of enzyme mix used can affect specificity. An excess of
enzyme can promote extension of oligonucleotides bound to nontarget sequences.
5. Reaction buffer: Different buffers are supplied in kits, each recommended for
amplification of fragments within a specific size range.
Long-Range PCR
53
Table 2
Reaction Mix 1
Reactant
Volume (µL)
Final concentration
Primer 1 (20 pmol/µL)
0.5
0.4 pmol/µL
Primer 2 (20 pmol/µL)
10X L-PCR reaction buffer
0.5
2.5
0.4 pmol/µL
1X L-PCR reaction buffer
Sterile distilled/
double-distilled water
As required to 18 µL
final volume
Final concentrations refer to the concentrations in the reaction mix after adding Reaction Mix 2.
6. Thermocycler: A machine with an option of increasing the extension time with
each successive cycle is recommended, such as the Perkin-Elmer 9600. Rapid
ramping between temperatures is also desirable.
7. PCR reaction tubes: Thin-walled tubes allow rapid heat transfer and so minimize
the time reactions are held at the relatively high denaturing temperature, prolonging enzyme life.
3. Methods
3.1. Template DNA Preparation
Having selected an appropriate DNA extraction method, the following points
should be observed:
1. To reduce shearing and maintain high-molecular-weight DNA, tube transfers
should be carried out using sterile plastic pastettes, rather than pipet tips.
2. To prevent shearing, any mixing should be performed by gentle repeated inversion by hand rather than by a vortex mixer.
3. If phenol is used in the DNA extraction protocol, it should be buffered at pH 8.0,
as nicking of template DNA may occur at acid pH. Auto-oxidation of phenol can
also lead to degradation of the DNA.
3.2. Long-Range PCR Procedure
1. Thaw all the reaction components at room temperature. Leave the enzyme mix at
–20°C until needed.
2. Pipet 4 µL of appropriately diluted template DNA into PCR tubes (100 ng per
reaction).
3. Prepare a mix containing diluted primers in an appropriate 10X reaction buffer and
water (see Table 2). Mix thoroughly by gentle inversion and pipet 18 µL into PCR
tubes. Overlay with 1 drop of mineral oil (see Note 3). Prepare a separate mix of
dNTPs and combined Taq and proofreader (see Table 3). Pipet into the PCR tubes
immediately following a “hot-start” procedure. After the initial long denaturing
step of the cycle, the temperature of the PCR heating block should be held at 80°C
54
Davies and Gray
Table 3
Reaction Mix 2
Reaction reactant
dNTPs–Mix 5 mmol/L
of each nucleotide
DNA polymerase plus proofreader
Sterile pharmacy water
Volume (µL)
Final concentration
500 µmol/L
2.5
0.2 – 0.7
As required to 3 µL
final volume
0.028–0.098 U/µL
Final concentration refers to the concentration in the mix after adding Reaction Mix 2.
while 3 µL of the DNA polymerase mix is added to each tube. After addition of the
enzyme, the thermal cycler should proceed to the amplification part of the program.
3.3. Thermocycling Conditions
The optimal annealing temperature will vary with the primers used and is
dependent on their Tm (see Chapter 6). The following cycle conditions give an
indication of the time intervals for which temperatures should be maintained:
Initial denaturation
Hold “hot-start”
Cycle 1
Denature
Anneal and extend
Cycles 2 – 30 Denature
Anneal and extend
92°C
80°C
92°C
68°C
92°C
68°C
2 min
10 min
50 s
10 min
10 s
10 min plus 30 s
per cycle (see Note 4)
3.4. Analysis of PCR Products
The concentration of agarose used, the voltage applied, and the time of electrophoresis will vary according to the size of the product to be resolved (see
Chapter 1). For mtDNA, the following condition can be used:
Mix 5 µL of PCR products with 5 µL of loading dye (15% Ficoll [w/v], in
sterile double-distilled water). Load onto a 0.8% agarose gel (in 1X TBE) and
electrophorese at 90 V for 2 h.
To maximize the yield of product produced in each successive cycle, the
combined annealing and extension time is increased by 30 s per cycle.
4. Notes
1. Primer sequences should be chosen such that the melting temperature (Tm) of the
primer is between 65°C and 70°C. The length of L-PCR primers is typically 38
bases. The high Tm maximizes the specificity of primer and template binding and
Long-Range PCR
55
minimizes internal mispriming over long template reads. The Tm values for each
primer in the pair should not vary by more than 1°C or 2°C.
2. Nucleotides and magnesium ions form a complex that forms the substrate for
the DNA polymerase. A relatively high magnesium ion concentration (2.5 mM)
in the reaction buffer ensures that there is a sufficient supply of substrate for
incorporation.
3. Use of a mineral oil overlay is recommended even with oil-free PCR machines.
4. The combined annealing and extension time is increased by 30 s per cycle to
maximize the yield of product produced in each successive cycle.
References
1. Ehrlich, H. A., Gelfand, D., and Skinsky, J. J. (1991) Recent advances in the
polymerase chain reaction. Science 252, 1643–1651.
2. Kainz, P., Schmiedtechner, A., and Strack, H. B. (1992) In vitro amplification of
DNA fragments greater than 10 kb. Anal. Biochem. 202, 46 –49.
3. Lundberg, K. S., Shoemaker, D. D., Adam, M. W. W., Short, J. M., Sorge, J. A.,
and Mathur, E. J. (1991) High fidelity amplification using a thermostable DNA
polymerase isolated from Pyrococcus furiosus. Gene 108, 1– 6.
4. Barnes, W. M. (1994) PCR amplification of up to 35 kb DNA with high fidelity
and high yield from lambda bacteriophage templates. Proc. Natl. Acad. Sci. USA
91, 2216 – 2220.
5. Cheng, S., Fockler, C., Barnes, W.M., and Higuchi, R. (1994) Effective amplification of long targets from cloned inserts and human genome DNA. Proc. Natl.
Acad. Sci. USA 99, 5695 – 5699.
6. Li, Y. Y., Hengstenberg, C., and Maisch, B. (1995) Whole mitochondrial genome
amplification reveals basal level multiple deletions in mtDNA of patients with
dilated cardiomyopathy. Biochem. Biophys. Res. Comm. 210, 211 –218.
7. Campuzano, V., Montermini, L., Molto, M. D., Pianese, L., Cossee, M.,
Cavalcanti, F., et al. (1996) Friedreichs ataxia — an autosomal recessive disorder
caused by an intronic GAA triplet repeat expansion. Science 271, 1423 – 1427.
150
Wells
Solid-Phase Minisequencing
57
9
Analysis of Nucleotide Sequence Variations
by Solid-Phase Minisequencing
Anu Wartiovaara and Ann-Christine Syvänen
1. Introduction
The Sanger dideoxy-nucleotide sequencing method has been simplified by a
number of methodological improvements, such as the use of the polymerase
chain reaction (PCR) technique for generating DNA templates in sufficient
quantities for sequencing, the use of affinity-capture techniques for convenient
and efficient purification of the PCR fragments for sequencing, the development of laboratory robots for carrying out the sequencing reactions, and the
development of instruments for automatic on-line analysis of fluorescent
products of the sequencing reactions. Despite these technical improvements,
the requirement for gel electrophoretic separation remains an obstacle when
sequence analysis of large numbers of samples are needed, as in DNA
diagnosis, or in the analysis of sequence variation for genetic, evolutionary, or
epidemiological studies.
We have developed a method for analysis of DNA fragments differing from
each other in one or a few nucleotide positions (1), denoted as solid-phase
minisequencing, in which gel electrophoretic separation is avoided. Analogous
to the methods for solid-phase sequencing of PCR products, the solid-phase
minisequencing method is based on PCR amplification using one biotinylated
and one unbiotinylated primer, followed by affinity capture of the biotinylated
PCR product on an avidin- or streptavidin-coated solid support. The nucleotide
at the variable site is detected in the immobilized DNA fragment by a primer
extension reaction: A detection step primer that anneals immediately adjacent
to the nucleotide to be analyzed is extended by a DNA polymerase with a single
labeled nucleotide complementary to the nucleotide at the variable site (Fig. 1).
From: Methods in Molecular Biology, vol. 187: PCR Mutation Detection Protocols
Edited by: B. D. M. Theophilus and R. Rapley © Humana Press Inc., Totowa, NJ
57
58
Wartiovaara and Syvänen
The amount of the incorporated label is measured, and it serves as a specific
indicator of the nucleotide present at the variable site.
We have used the solid-phase minisequencing method for detecting numerous mutations causing human genetic disorders (2), for analyzing allelic variation in genetic linkage studies, and for identification of individuals (3). The
protocol presented here is generally applicable for detecting any variable nucleotide. The method suits well for analyzing large numbers of samples because it
comprises simple manipulations in a microtiter plate or test-tube format and
the result of the assay is obtained as an objective numeric value, which is easy
to interpret. Furthermore, the solid-phase minisequencing method allows quantitative detection of a sequence variant present as a minority of less than 1% in
a sample (4). We have utilized the possibility of the sensitive quantitative analysis for detecting point mutations in malignant cells present as a minority in a
cell population (4) and for analyzing heteroplasmic mutations of mitochondrial DNA (5,6). The high sensitivity is an advantage of the minisequencing
method, compared to dideoxy-nucleotide sequencing, in which a sequence variant must be present as 10 – 20% of a mixed sample to be detectable. On the
other hand, a limitation of the solid-phase minisequencing method is that it is
restricted to analyzing variable nucleotides only at positions predefined by the
detection step primers used. The minisequencing reaction principle is utilized
in a variety of other assay fomats than the one described here, for reviews, see
refs. 2 and 12.
2. Materials
2.1. Equipment and Materials
1. One of the PCR primers should be biotinylated at its 5' end during the oligonucleotide synthesis, and the other primer is not biotinylated, resulting in a PCR product with one biotinylated strand (see Note 1).
2. Detection step primer: an oligonucleotide complementary to the biotinylated
strand, designed to hybridize with its 3' end with the nucleotide adjacent to the
variant nucleotide to be analyzed (see Fig. 1 and Note 2).
3. Facilities for PCR.
4. Microtiter plates with streptavidin-coated wells (e.g., Combiplate 8, Labsystems,
Finland) (see Note 3).
5. Shaker at 37°C.
6. Water bath or incubator at 50°C.
7. Liquid scintillation counter.
8. Multichannel pipet and microtiter plate washer (optional).
2.2. Reagents
All of the reagents should be of standard molecular biology grade. Use sterile distilled or deionized water.
Solid-Phase Minisequencing
59
Fig. 1. Steps of the solid-phase minisequencing method. (1) PCR with one
biotinylated (black ball) and one unbiotinylated primer; (2) affinity capture of the
biotinylated PCR product in streptavidin-coated microtiter wells; (3) washing and
denaturation; (4) the minisequencing primer extension reaction; (5) measurement of
the incorporated label; (6) calculation of the result.
60
Wartiovaara and Syvänen
1. PBS/Tween solution: 20 mM sodium phosphate buffer, pH 7.5, 0.1% (v/v)
Tween-20. Store at 4°C; 50 mL is enough for several full-plate analyses.
2. TENT solution: 40 mM Tris-HCl, pH 8.8, 1 mM EDTA, 50 mM NaCl, 0.1% (v/v)
Tween-20. Store at 4°C. Prepare 1–2 L at a time, which is enough for several
full-plate analyses.
3. 50 mM NaOH (make fresh every 4 wk); store at room temperature (about 20°C).
Prepare 50 mL.
4. Thermostable DNA polymerase: Thermus aquaticus (Taq) DNA polymerase
(Promega, 5 U/µL) (see Note 4).
5. 10X concentrated Taq DNA polymerase buffer: 500 mM Tris-HCl, pH 8.8,
150 mM (NH 4) 2SO 4, 15 mM MgCl2 , 0.1% (v/v) Triton X-100, 0.01% (w/v)
gelatin; store at –20°C.
6. [3H]-labeled deoxynucleotides (dNTPs): dATP to detect a T at the variant site,
dCTP to detect a G, and so forth (Amersham; [3H] dATP, TRK 625; dCTP, TRK
576; dGTP, TRK 627; dTTP, TRK 633); store at –20°C (see Note 5).
7. Scintillation reagent (e.g., Hi-Safe II, Wallac).
3. Method
3.1. PCR for Solid-Phase Minisequencing Analysis
The PCR is done according to routine protocols, except that the amount of
the biotin-labeled primer used should be reduced so as not to exceed the biotinbinding capacity of the microtiter well (see Note 3). For a 50-µL PCR reaction,
we use 10 pmol of biotin-labeled primer and 50 pmol of the unbiotinylated
primer. The PCR should be optimized (i.e., the annealing temperature and template amount) to be efficient and specific; to be able to use [3H] dNTPs, which
are low-energy emitters, for the minisequencing analysis, one tenth of the PCR
product should produce a single visible band after agarose gel electrophoresis,
stained with ethidium bromide. After optimization, there is no need for purification of the PCR product.
3.2. Solid-Phase Minisequencing Analysis
1. Affinity capture: Transfer 10-µL aliquots of the PCR product and 40 µL of the
PBS/Tween solution to two streptavidin-coated microtiter wells (see Note 6).
Include a control reaction (i.e., a well with no PCR product). Seal the wells with
a sticker and incubate the plate at 37°C for 1.5 h with gentle shaking.
2. Discard the liquid from the wells and tap the wells dry against a tissue paper.
3. Wash the wells three times at room temperature as follows: pipet 200 µL of TENT
solution to each well, discard the washing solution, and empty the wells thoroughly between the washings (see Note 7).
4. Denature the captured PCR product by adding 100 µL of 50 mM NaOH to each
well, incubate at room temperature for 3 min. Discard the NaOH and wash the
wells as in step 3.
Solid-Phase Minisequencing
61
5. For each DNA fragment to be analysed, prepare two 50-µL mixtures of nucleotide-specific minisequencing solution—one for detection of the normal and
one for the mutant nucleotide (see Note 8). Mix 5 µL of 10X Taq DNA polymerase buffer, 10 pmol of detection step primer, 0.2 µCi (usually equal to 0.2 µL)
of one [3H] dNTP, 0.1 U of Taq DNA polymerase, and dH2O to a total volume of
50 µL. It is obviously convenient to prepare master mixes for the desired number
of analyses with a certain nucleotide.
6. Pipet 50 µL of one nucleotide-specific mixture per well, incubate the plate at
50°C for 10 min in a water bath or 20 min in an oven (see Note 9).
7. Discard the contents of the wells and wash them as in step 3.
8. Release the detection step primer from the template by adding 60 µL of 50 mM
NaOH and incubating for 3 min at room temperature.
9. Transfer the eluted primer to the scintillation vials, add scintillation reagent, and
measure the radioactivity (i.e., the amount of incorporated label) in a liquid scintillation counter (see Note 10).
10. The result is obtained as counts per minute (cpm) values. The cpm value of each
reaction expresses the amount of the incorporated [3H] dNTP. Calculate the ratio
(R) between the mutant and normal nucleotide cpms. In a sample of a subject
homozygous for the mutant nucleotide, the R will be >10; in a homozygote for
the normal nucleotide, R< 0.1; and in the case of a heterozygote, R varies between
0.5 and 2.0, depending on the specific activities of the [3H] dNTPs (see Note 11).
4. Notes
1. The efficiency of the 5'-biotinylation of an oligonucleotide on a DNA synthesizer
is most often 80 – 90%. The biotin-labeled oligonucleotides can be purified from
the unbiotinylated ones either by high-performance liquid chromatography (7),
polyacrylamide gel electrophoresis (8), or ion-exchange columns manufactured
for this purpose (Perkin-Elmer/ABI). If the biotin-labeled primer is not purified,
the biotinylation should be confirmed after the PCR by affinity capture of the
biotinylated PCR product, followed by detection of possible unbound products
by agarose gel electrophoresis; see Chapter 1.
2. The detection step primer for our standard protocol is a 20-mer. It is advisable to
use a nested primer as a detection step primer, to ensure that possible unspecific
PCR products remain undetected. The primer should be at least five nucleotides
nested in relation to the unbiotinylated PCR primer.
3. The binding capacity of a streptavidin-coated microtiter well is 2 – 5 pmol of
biotinylated oligonucleotide. If higher binding capacity is desired, avidin-coated
polystyrene beads (Fluoricon, 0.99 µm [IDEXX Corp., Portland ME]; biotinbinding capacity over 2 nmol of oligonucleotide/mg beads) or streptavidin-coated
magnetic polystyrene beads (Dynabeads M-280, streptavidin; biotin-binding
capacity 300 pmol/mg) can be used (9). The biotin-binding capacity of a
microtiter well allows reliable detection of up to 2% of a sequence variant present
in the sample (6), whereas a detection sensitivity of less than 0.1% is obtained
with the bead-based format (4).
62
Wartiovaara and Syvänen
4. It is advantageous to use a thermostable DNA polymerase for the single-nucleotide primer extension reaction, because a high temperature, favorable for the
simultaneous primer annealing reaction, can be used.
5. Although the specific activities of the [3H] dNTPs are low, their half-lives are
long (13 yr) and the necessary precautions for working with [3H] should be taken.
Also dNTPs or dideoxy-nucleotides labeled with other isotopes ([35S] or [32P]) or
with haptens can be used (1,10).
6. Each nucleotide to be detected at the variant site is analyzed in a separate well.
Thus, at least two wells are needed per PCR product.
7. The washings can be performed utilizing an automated microtiter plate washer or
by manually pipetting the washing solution to the wells, discarding the liquid,
and tapping the plate against a tissue paper. Thorough emptying of the wells is
important to avoid unspecific nucleotide incorporation.
8. The minisequencing reaction mixture can be stored at room temperature for 1–2 h.
It is convenient to prepare it during the incubation of step 1.
9. The conditions for hybridizing the detection step primer are not stringent and the
temperature of 50°C can be applied to the analysis of most PCR products irrespective of the sequence of the detection step primer. If the primer, however, is
considerably shorter than a 20-mer or its GC content is low (melting temperature
close to 50°C), lower temperatures for the primer annealing may be required.
10. Streptavidin-coated microtiter plates made of scintillating polystyrene are available (ScintiStrips, Wallac, Finland). When these plates are used, the final washing, denaturation, and transfer of the eluted detection primer can be omitted, but
a scintillation counter for microtiter plates is needed (11).
11. The ratio between the cpm values for the two nucleotides reflects the ratio
between the two sequences in the original sample. Therefore, the solid-phase
minisequencing method can be used for quantitative PCR analyses (4 – 6). The
R value is affected by the specific activities of the [3H] dNTPs used, and if
either the mutant or the normal sequence allows the detection step primer to be
extended by more than one [3H] dNTP, this will obviously also affect the R value.
Both of these factors can easily be corrected for when calculating the ratio
between the two sequences. Another possibility is to construct a standard curve
by mixing the two sequences in known ratios and plotting the obtained cpm values as a function of the ratios to obtain a linear standard curve (5,6). The test
results can then be interpreted from the standard curve without the need to take
the specific activities of the number of [3H] dNTPs incorporated into account.
References
1. Syvänen, A.-C., Aalto-Setälä, K., Harju, L., Kontula, K., and Söderlund, H. (1990)
A primer-guided nucleotide incorporation assay in the genotyping of
apolipoprotein E. Genomics 8, 684–692.
2. Syvänen, A.-C. (1999) From gels to chips: “minisequencing” primer extension
for analysis of point mutations and single nucleotide polymorphisms. Hum. Mutat.
13, 1–10.
Solid-Phase Minisequencing
63
3. Syvänen, A.-C., Sajantila, A., and Lukka M. (1993) Identification of individuals
by analysis of biallelic DNA markers, using PCR and solid-phase minisequencing.
Am. J. Hum. Genet. 52, 46 – 59.
4. Syvänen, A.-C., Söderlund, H., Laaksonen, E., Bengtström, M., Turunen, M., and
Palotie, A. (1992) N-ras gene mutations in acute myeloid leukemia: accurate
detection by solid-phase minisequencing. Int. J. Cancer 50, 713 –718.
5. Suomalainen, A., Kollmann, P., Octave, J.-N., Söderlund, H., and Syvänen, A.-C.
(1993) Quantification of mitochondrial DNA carrying the tRNA8344Lys point
mutation in myoclonus epilepsy and ragged-red-fiber disease. Eur. J. Hum. Genet.
1, 88 – 95.
6. Suomalainen, A., Majander, A., Pihko, H., Peltonen, L., and Syvänen, A.-C.
(1993) Quantification of tRNA3243Leu point mutation of mitochondrial DNA in
MELAS patients and its effects on mitochondrial transcription. Hum. Mol. Genet.
2, 525 – 534.
7. Bengtström M., Jungell-Nortamo, A., and Syvänen, A.-C. (1990) Biotinylation of
oligonucleotides using a water soluble biotin ester. Nucleosides Nucleotides 9,
123 – 127.
8. Wu, R., Wu, N.-H., Hanna, Z., Georges, F., and Narang, S. (1984) Oligonucleotide Synthesis: A Practical Approach. (Gait, M. J., ed.), IRL, Oxford, p. 135.
9. Syvänen, A.-C. and Söderlund, H. (1993) Quantification of polymerase chain
reaction products by affinity-based collection. Meth. Enzymol. 218, 474 – 490.
10. Harju, L., Weber, T., Alexandrova, L., Lukin, M., Ranki, M., and Jalanko, A.
(1993) Colorimetric solid-phase minisequencing assay illustrated by detection of
alpha-1-antitrypsin Z mutation. Clin. Chem. 39, 2282 – 2287.
11. Ihalainen, J., Siitari, H., Laine, S., Syvänen, A.-C., and Palotie, A. (1994) Towards
automatic detection of point mutations: use of scintillating microplates in solidphase minisequencing. BioTechniques 16, 938 – 943.
12. Syvänen, A.-C. (2001) Accessing genetic variation: genotyping single nucleotide
polymorphisms. Nat. Rev. Genet. 2, 930–942.
150
Wells
Cycle Sequencing of PCR Products
65
10
Cycle Sequencing of PCR Products
G. K. Surdhar
1. Introduction
The development of the polymerase chain reaction (PCR) has allowed the
rapid isolation of DNA sequences utilizing the hybridization of two oligonucleotide primers and subsequent amplification of the intervening sequences by
Taq polymerase. This technique has facilitated the identification and typing of
single-nucleotide substitutions in the analysis of DNA sequence polymorphisms and the screening of large numbers of samples to either detect known
mutations or search for unknown mutations at a defined locus (1– 4).
Since the introduction of PCR, a variety of methods for sequencing PCRgenerated fragments have been described, based on the Sanger chain-terminating dideoxynucleotide sequencing method (5). Cycle sequencing (6 –10) is a
kind of PCR sequencing approach. Like standard PCR, it utilizes a thermostable DNA polymerase and a temperature cycling format of denaturation,
annealing, and DNA synthesis. Cycle sequencing, also called the linear amplification process, in contrast with a traditional PCR reaction where the increase
is exponential, employs a single primer so that the amount of product DNA
increases linearly with the number of cycles in contrast with a traditional PCR
reaction where the increase is exponential.
Initially, cycle sequencing utilized 32P-labeled primers and a nonthermostable polymerase, which needed to be added after every denaturation cycle
(6). Further progress was made with the introduction of thermostable Taq polymerase (7,8) and the replacement of labeled primers with internal labeling
using α-labeled 35S or 32P dATPs and mixtures of nucleotides similar to those
used originally by Sanger (9,10). The latest manual method available is the
termination cycle sequencing (Amersham Pharmacia Biotech), which incorporates the isotopic label into the sequencing reaction products by the use of four
From: Methods in Molecular Biology, vol. 187: PCR Mutation Detection Protocols
Edited by: B. D. M. Theophilus and R. Rapley © Humana Press Inc., Totowa, NJ
65
66
Surdhar
[α-33P]dideoxynucleotide (ddNTP) terminators (G, A, T, and C). This method
is the most efficient in terms of radioactivity usage, as the labeled nucleotides
label only the properly terminated DNA chains. As a result, prematurely terminated chains are not labeled, therefore, “stop” artifacts that result in bands
across all four lanes and most background bands are eliminated. All results
obtained from the above-mentioned methods are visualized by running the
samples on a polyacrylamide gel followed by exposure to X-ray film for 24 h
or more depending on the age of the radioactivity and amount of template used.
Fluorescent or automated sequencing methodology is commonly used now
in order to avoid the use of radioactive materials. The other advantage of this
method is that approx 500 bp can be read per reaction on an automated DNA
sequencer with 99.3% accuracy compared to 150 –200 bp on an average manual
sequencing gel (11,12). The automated sequencing market is divided between
4-dye and 1-dye technology. With the 4-dye technology, there is one tube per
reaction with the four dyes corresponding to the four bases; therefore, each
sample can be run on a gel in one lane. This is in contrast to the 1-dye four-lane
approach, where there are four tubes per reaction, each tube corresponding to
one of the four bases and is, therefore, run on a gel in four lanes. The former
single-lane approach has been the option for both large-scale and large-samplenumber application groups. The 4-dye single-lane instrumentation allows for
higher sample throughput and consistent results among the large numbers of
samples that are processed on a single run. The other advantage of the 4-dye
single-lane approach compared to the 1-dye four-lane approach is that variations in electrophoretic mobility across the four lanes with the single-dye technology may result in artifacts of sequence miscalling between adjacent lanes.
The Big Dye™ Terminators from Perkin-Elmer and the DYEnamic dyes from
Amersham Pharmacia Biotech are examples of the 4-dye and single-lane
approach respectively. The Big Dyes have been an improvement on previous systems, as they produce more even peak heights, which facilitates the
identification of heterozygosity. Prior to this system, the recommended method
for recognizing heterozygotes was to use the dye primer technology, which
gave even peak heights. This method of sequencing requires the primer to be
fluorescently labeled with a dye, so four separate reactions have to be carried
out. It is possible to label each primer four times, each time using a different
dye, and then pool the reactions together for sequencing, but this turns out to
be very expensive. There have been vast improvements in sequencing technology such that the 4-dye terminator kits available on the market now result in
very even peak heights, which allows for an easier detection of heterozygotes.
This chapter describes the two recent technologies for cycle sequencing:
manual, radioactive termination cycle sequencing, and automated sequencing
using the Big Dye™ Terminators (Perkin-Elmer Applied Biosystems). Both of
these methods produce sequences of high quality.
Cycle Sequencing of PCR Products
67
2. Materials
2.1. Manual Cycle Sequencing
2.1.1. Purification of PCR Products
1. Geneclean Kit II (Anachem).
2.1.2. Termination Cycle Sequencing
1. Termination cylce sequencing kit (Amersham). The following components are
provided in the kit:
a. 10X Reaction buffer concentrate: 260 mM Tris-HCl,pH 9.5, 65 mM MgCl2.
b. dGTP termination master mix: 7.5 µM dATP, dCTP, dGTP, dTTP.
c. dITP termination master mix: 7.5 µM dATP, dCTP, dTTP, 37.5 µM dITP.
d. Four Redivue™ 33P-labeled terminators which consist of the following, which
are all 0.3 µM [α-33P] ddNTP (1500 Ci/mmol, 450 µCi/mL), 11.25 µCi:
ddGTP
ddATP
ddTTP
ddCTP
2.1.3. Treatment of PCR Products After Cycle Sequencing
1. Stop solution: 95% formamide, 20 mM EDTA, 0.05% bromophenol blue, 0.05%
xylene cyanol (store at 4°C).
2.1.4. 6% Polyacrylamide Sequencing Gels
1. 20X Glycerol tolerant gel buffer (1 L): 216 g Tris base, 72 g taurine, 4 g
Na2EDTA·2H2O (stable at room temperature).
2. 30 mL 30% (w/v) acrylamide stock solution (19:1 acrylamide/bis-acrylamide)
(store at 4°C).
3. 63 g Urea.
4. TEMED (N,N,N',N'-tetramethylethylenediamine).
5. 25% Ammonium persulfate (APS) (made fresh).
6. Loading buffer: stop solution as in Subheading 2.1.3.
2.1.5. Autoradiography
1. X-ray Hyperfilm 18 cm × 43 cm (Sigma) and cassettes.
2.2. Automated Fluorescent Cycle Sequencing
2.2.1. Purification of PCR Products Before Cycle Sequencing
1. Microcon-100 Microconcentrators (Amicon).
2.2.2. Cycle Sequencing
1. Terminator Ready Reaction Mix, Applied Biosystems (ABI) contains the following:
A-Dye terminator labeled with dichloro [R6G];
C-Dye terminator labeled with dichloro [ROX];
68
Surdhar
G-Dye terminator labeled with dichloro [R110];
T-Dye terminator labeled with dichloro [TAMRA];
Deoxynucleoside triphosphates (dATP, dCTP, dITP, dUTP);
AmpliTaq DNA polymerase, FS, with thermally stable pyrophosphatase;
MgCl2;
Tris-HCl buffer, pH 9.0.
2.2.3. Purifying Extension Products
1.
2.
3.
4.
3 M Sodium acetate, pH 5.2.
Absolute ethanol.
70% Ethanol.
Distilled water.
2.2.4. Preparing and Loading Samples
1. Template suppression reagent (ABI) (store at 4°C).
3. Methods
3.1. Manual Cycle Sequencing
3.1.1. Purification of PCR Products Before Cycle Sequencing
Purify the PCR products prior to sequencing using a Geneclean Kit II
(Anachem) according to manufacturer’s instructions (see Note 1).
3.1.2. Termination Cycle Sequencing
The amount of genecleaned PCR products should be roughly estimated on
an agarose gel before sequencing. The approximate range of template required
is about 2 – 50 ng/µL. A general outline of the protocol is as follows (details are
available in the manual provided by the kit [Amersham Pharmacia Biotech]):
1. Prepare four termination mixes (one each for ddA, ddC, ddG and ddT):
Termination mix dGTP (or dITP) (see Note 2)
α33P ddNTP
×1
2 µL
0.5 µL
2.5 µL
This can be multiplied by the number of samples to make a master mix and
2.5 µL aliquoted into each tube.
2. Dispense 2.5 µL each of ddA, ddC, ddG, and ddT termination mix into respectively labeled tubes for each template to be sequenced.
3. Prepare a reaction mix:
Reaction buffer
2 µL
DNA (2–50 ng/µL)
µL*
Primer (0.1 µg/µL) (see Note 3)
1 µL
*The
concentration of the PCR product should be as stated above.
Cycle Sequencing of PCR Products
Water
Thermo Sequenase (4 U/µL)
69
µL+
2 µL
20 µL
Add 4.5 µL of this reaction mix to each of the termination mixes. Mix contents
of the tube with a pipet and then add one drop of mineral oil.
4. Incubate the reactions in a thermal cycler using the following conditions: 50 cycles
at 95°C, 30 s; 50 cycles at 50°C, 30 s; and 50 cycles at 72°C, 60 s (see Note 4).
3.1.3. Treatment of PCR Products After Cycle Sequencing
Add 4 µL stop solution to each tube and store at –20°C until ready to run on a gel.
3.1.4. 6% Polyacrlyamide Sequencing Gels
1. To make 150 mL of acrylamide solution, add 63 g urea, 30 mL of 30% acrylamide stock solution, and 12 mL of 20X glycerol tolerant buffer and make up to
150 mL with distilled water.
2. Just before pouring the gel, add 50 µL of 25% APS and 50 µL TEMED to 50 mL
of the acrylamide solution to initiate polymerization. Pour this into a sandwich of
two 45 inches long gel plates that have been sealed at the bottom with 10 mL 6%
acrylamide, 50 µL 25% APS and 50 µL TEMED.
3. Leave gel to set for approx 1 h or overnight.
4. Set up the gel apparatus, using 0.8X glycerol tolerant buffer (see Note 5).
5. Load 4 µL of each sample into each well.
6. Run the gel at 50°C, approx 50 W until the sample dyes have migrated the required
distance. As a general guide, bromophenol blue migrates with a DNA fragment of
approx 26 bp and xylene cyanol with a fragment of approx 106 bp in a 6% gel.
3.1.5. Autoradiography
Following electrophesis, allow the glass plates to cool to room temperature. Carefully separate the glass plates, leaving the gel adhered to one of the plates. Transfer
the gel to a piece of Whatmann 3MM paper cut out to the same size of the gel by
slowly placing it over the gel. Slowly peel off the paper with the attached gel.
Cover the gel with cling film and dry in a slab gel dryer at 80°C for 30–120
min until the gel is dry. Remove the cling film and autoradiograph the gel
against a high-speed X-ray film in an appropriate cassette.
Exposure of the film at room temperature varies from about 1 d to 6 d depending
on the amount of starting DNA template used and the age of the radioactivity.
3.2. Automated Cycle Sequencing
3.2.1. Purification of PCR Products Before Cycle Sequencing
There are various methods used for this procedure. The Microcon-100 spin
columns are recommended by ABI to give good sequencing results, as they
+Adjust
the amount of water to make up to a total volume of 20 µL.
70
Surdhar
remove salt which can interfere with the sequencing reaction. There are alternative methods available (see Note 1).
3.2.2. Cycle Sequencing
1. For each reaction, mix the following reagents in a labeled tube:
(This is a half-reaction; one-eighth and one-quarter reactions can also be carried
out, but this requires a propietary buffer from ABI that maintains a reasonable
reaction volume.)
4 µL
x µL
1 µL
y µL
10 µL
Set up and keep the reaction on ice until ready to transfer to the thermal cycler.
2. Perform the sequencing reactions in a thermal cycler using the following conditions: 96°C for 10 s; 25 cycles of 96°C for 10 s, 50°C for 5 s, 60°C for 4 min
(see Note 4).
Make up to 20 µL with water following the reaction.
Terminator-ready reaction mix
PCR product (30 – 90 ng)
Primer (0.02 µg/µL) (see Note 3)
dH2O
3.2.3. Purifying Extension Products
This method utilizes ethanol and sodium acetate to purify the extension products (see Note 6).
1. After completion of the sequencing reactions, transfer the 20 µL extension products to 0.5 µL tubes.
2. Add the following to the tubes:
2 µL of 3 M NaOAc, pH 5.2;
5 0 µL of 95% EtOH at room temperature (see Note 7).
3. Cap the tubes and vortex briefly.
4. Incubate the tubes at room temperature for 15 min.
5. Place the capped tubes in a microcentrifuge,and spin the tubes for 20 min at
maximum speed. This should be at least 1400g but less than 3000g.
6. Without disturbing the pellet, carefully aspirate the supernatant with a pipettor
and discard it.
7. Rinse the pellet by adding 200 µL of 70% EtOH. Cap the tubes and vortex briefly.
Centrifuge for 5 min at maximum speed.
8. Without disturbing the pellet, carefully aspirate the supernatant with a pipettor
and discard.
9. Dry the pellet in a vacuum centrifuge for 10–15 min, or remove the caps and
place the tubes in a heat block at 90°C for 1 min.
3.2.4. Preparing and Loading Samples
Resuspend each pellet in 20 µL of Template Suppression Reagent (ABI) and
heat denature at 95°C on a heating block for 2 min, 30 s; immediately place on
Cycle Sequencing of PCR Products
71
ice. Load sample on to automated analyzer according to manufacturer’s
instructions.
4. Notes
1. Geneclean Kit II (Anachem) or any other silica-based purification methods, purification with Exonuclease and Shrimp Alkaline Phosphatase, and spin columns
that concentrate and desalt the PCR products, such as the Microcon-100 spin columns (Millipore), may be used. For automated fluorescent sequencing, the latter
method of purification is more appropriate as silica from the Geneclean can interfere with the sequencing reaction, such that a shorter read is obtained. When there
are multiple bands present because of nonspecific amplification, then Geneclean
is used to purify the sample, in which case it is very important to not get any silica
carryover into the sequencing reaction. The enzyme method of PCR purification
gives good sequencing, as it removes the excess dNTPs and primers: 8 µL of a
50-µL PCR product is digested with 1 µL of Exonuclease I (10 U/µL) and 1 µL of
shrimp alkaline phosphatase (2 U/µL) (Amersham supplies both enzymes together
as a presequencing kit), incubated at 37°C for 15 min and then inactivated at 80°C
for 15 min; 5 µL is used for the sequencing reaction.
2. Compressions occur when the DNA (usually G-C rich) synthesized by the DNA
polymerase does not remain fully denatured during electrophoresis. dITP can be
used instead of dGTP to reduce compressions in the sequence.
3. Primers should be about 18 – 25 nucleotides long. It is also important to check the
sequence of the primer for possible self-complementarity.
4. The number of cycles required depends on the amount of template used for
sequencing, as well as the purity and sensitivity of autoradiographic detection.
In general, when the amount of template is low, more cycles should be used.
Most reactions can be carried out at the 50°C default annealing temperature.
Polymerization is optimal at 70 –75°C, except when using dITP, which requires
a maximum temperature between 55°C and 60°C. Big Dye Terminators™
utilize dITP; therefore, the polymerization is carried out at 60°C.
5. The 0.8X glycerol tolerant buffer is recommended, as it results in faster gel
migration.
6. When using Big Dye™ Terminators, there are two other methods recommended
for purifying extension products; using either 60% ± 5% isopropanol or 60% ± 3%
ethanol. These methods are described further in the ABI manual. All three methods
have been tested simultaneously and the described ethanol/sodium acetate method
was found to be the most efficient for purifying the extension products.
7. When exposed to air, absolute ethanol absorbs moisture and becomes more dilute.
Also, slight variations in concentration occur when ethanol is diluted to 95%. These
variations can result in increased residual dyes. Use of a commercially prepared
molecular-biology-grade 95% ethanol is therefore recommended to eliminate variations. Alternatively, 100% molecular-grade ethanol can be diluted to 95% with
molecular-grade isopropanol.
72
Surdhar
References
1. Orita, M., Suzuki, Y., Sekeiya, T., and Hayashi, K. (1989) Rapid and sensitive
detection of point mutations and DNA polymorphisms using the polymerase chain
reaction. Genomics 5, 874 – 879.
2. Kwok, P. Y., Carlson, C., Yager, T. D., Ankener, W., and Nickerson, D. A. (1994)
Comparative analysis of human DNA variations by fluorescence based sequencing of PCR products. Genomics 23, 138–144.
3. Martin-Gallardo, A., McCombie, W. R., Gocayne, J. D., Fitzgerald, M. G.,
Wallace, S., Lee, B. M. B., et al. (1992) Automated DNA sequencing and analysis
of 106 kilobases from human chromosome 19q 13.3. Nature Genet. 1, 34 – 39.
4. NIH/CEPH Collaborative Mapping Group (1992) A comprehensive genetic linkage map of the human genome. Science 258, 67– 86.
5. Sanger, F., Nicklen, S., and Coulson, A. R. (1977) DNA sequencing with chain
terminating inhibitors. Proc. Natl. Acad. Sci. USA 74, 5463 – 5467.
6. McMahon, G., Davis, E., and Wogan, G. N. (1987) Characterization of c-Ki-ras
oncogene alleles by direct sequencing of enzymatically amplified DNA from carcinogen induced tumours. Proc. Natl. Acad. Sci. USA 84(14), 4974 – 4978.
7. Carothers, A. M., Urlab, G., Mucha, J., Grunberger, D., and Chasin, L. A. (1989)
Point mutation analysis in a mammalian gene: rapid preparation of total RNA,
PCR amplification of cDNA, and Taq sequencing by a novel method.
BioTechniques 7(5), 494 – 499.
8. Murray, V. (1989) Improved double-stranded DNA sequencing using the linear
polymerase chain reaction. Nucl. Acids Res. 17(21), 8889.
9. Levedakou, E. N., Landegren, U., and Hood, L. E. (1989) A strategy to study gene
polymorphism by direct sequence analysis of cosmid clones and amplified
genomic DNA. BioTechniques 7(5), 438 –442.
10. Lee, J. S. (1991) Alternative dideoxy sequencing of double-stranded DNA by
cyclic reactions using Taq polymerase. DNA Cell Biol. 10(1), 67–73.
11. McBride, L. J., Koepf, S. M., Gibbs, R. A., Nyugen, P., Salser, W., Mayrand, P.
E., et al. (1989) Automated DNA sequencing methods involving PCR. Clin. Chem.
35, 2196 – 2201.
12. Tracy, T. E. and Mulcahy, L. S. (1991) A simple method for direct automated
sequencing of PCR products. BioTechniques 11(1), 68 –75.
Fluorescent In Situ Hybridization
73
11
Fluorescent In Situ Hybridization
Sara A. Dyer and Elaine K. Green
1. Introduction
Single-stranded DNA will recognize a complementary strand with high
specificity under suitably controlled conditions. In situ hybridization (ISH)
exploits this phenomenon by hybridizing an appropriately labeled singlestranded DNA “probe” to target sequences in situ in either dissociated cell
preparations or tissue sections.
Early ISH protocols used radioactivity to label probes, whereas current techniques use fluorescent labels giving rise to the term “fluorescent in situ hybridization” (FISH). FISH probes may be directly labeled by the incorporation of a
fluorochrome-conjugated molecule (e.g., fluoroscein d-UTP or Texas red d-UTP)
or indirectly labeled by the incorporation of a reporter molecule (e.g., biotin
d-UTP or digoxygenin d-UTP). If probes are indirectly labeled, they must be
detected posthybridization using a reporter-binding fluorescent molecule. A
schematic representation of the FISH principle is shown in Fig. 1.
Fluorescent in situ hybridization probes fall into three main categories
depending on the region of the genome to which they hybridize: repetitivesequence probes, single-copy probes, and whole-chromosome libraries. Repetitive-sequence probes are specific for repetitive DNA regions found within the
human genome. Centromeric probes are a family of repetitive-sequence probes
hybridizing to mainly α-satellite DNA found near the centromeres of all human
chromosomes. Subtelomeric probes are also repetitive-sequence probes.
Single-copy probes are specific for unique sequences within the genome.
Whole-chromosome libraries are made up of a mixture of DNA sequences comprising the entire length of a specific chromosome; these probes are also known
as chromosome paints.
From: Methods in Molecular Biology, vol. 187: PCR Mutation Detection Protocols
Edited by: B. D. M. Theophilus and R. Rapley © Humana Press Inc., Totowa, NJ
73
74
Dyer and Green
Fig. 1. Schematic representation of the FISH principle.
Many FISH probes are commercially available prelabeled with a choice of
direct or indirect labels. A list of suppliers used by the authors is given in
Table 1. Alternatively, probes may be grown in the laboratory from appropriate DNA stocks and labeled with a desired fluorochrome or reporter molecule.
Target preparations for FISH may take one of many forms, including cell
suspensions, touch preparations, or paraffin-sectioned material and the technique is applicable to both dividing and nondividing cells (i.e., metaphases or
interphases, respectively).
Fluorescent In Situ Hybridization
75
Table 1
Suggested Probe Suppliers
Supplier
Appligene Oncor
Vysis Ltd.
Address
Qbiogene
Salamander Quay West
Park Lane
Harefield
Middlesex UB9 6NZ
United Kingdom
Vysis SA
UK Customer Department
81470 Maurens Scopont
France
Over the last decade, FISH has proved to be an invaluable technique in
both diagnostic and research laboratories. The appropriate choice of probe
and target can lead to the characterization of chromosomal and gene rearrangements and the ascertainment of chromosome copy number. Single-copy
unique-sequence probes have proved useful in the detection of microdeletions
such as those found on chromosomes 7, 15, and 22 in Williams, Prader Willi,
and Di George syndromes, respectively. Single-copy probes have also been
widely used in recent years in the identification of gene rearrangements such
as BCR/ABL and PML/RARA fusion in blood and bone marrow samples from
patients with leukemia. Chromosome libraries and subtelomeric probes have
proved to be valuable in the characterization of complex and sometimes subtle
chromosomal rearrangements in both constitutional and acquired genetic
abnormalities. Centromeric probes have been widely used to determine the
chromosomal origin of small marker chromosomes that are unidentifiable by
conventional Giemsa-banding analysis. These repetitive-sequence probes are
also of great value in determining the chromosome copy number in nondividing cells. In recent years, “multi-probe” devices have been developed that
allow simultaneous detection of all human telomeres or centromeres on a
single microscope slide.
Over the past 10 years the basic FISH principle has been used to develop
new molecular cytogenetic techniques, including multicolor FISH (M-FISH)
(1) and comparative genomic hybridization (CGH) (2). M-FISH allows each
chromosome to be visualized in a different color, enabling the rapid identification of chromosome rearrangements, whereas CGH allows a whole genome to
be scanned for genetic imbalances in a single hybridization. Both M-FISH and
CGH rely on sophisticated image-analysis equipment, which is becoming
increasingly important in the growing field of molecular cytogenetics.
76
Dyer and Green
Practically, FISH involves probe labeling, denaturation of probe and target
DNA, hybridization of probe to target DNA, stringency washing to remove
excess probe, detection (of indirectly labeled probes), and counterstaining. Basic
hybridization methods are given in the following sections, together with protocols for growing and labeling probes in the laboratory. All methods are designed
as general guidelines only, and in the case of commercially purchased probes,
manufacturer’s guidelines should always be followed. Particularly hazardous
reagents have been highlighted but appropriate safety precautions should be
followed for all laboratory work.
2. Materials
2.1. Growing Probes in the Laboratory
1. Plasmid Maxi kit (Qiagen, cat. no. 12162) containing Qiagen 100 tips, and
buffers: P1 (resuspension buffer), P2 (lysis buffer), P3 (neutralization buffer),
QBT (equilibration buffer), QC (wash buffer) and QF (elution buffer).
2. LB broth (Luria–Bertani medium): Dissolve 10 g bacto-tryptone, 5 g bacto-yeast
extract, and 10 g NaCl in 950 mL of distilled water, adjust the pH to 7.0 with 5 N
NaOH, and make up to 1 L with distilled water. Sterilize by autoclaving.
3. Kanamycin (50 mg/mL) store at – 20°C.
4. Shaking incubator.
5. Sorvall centrifuge (GSA and SS-34 rotors).
6. 250 mL and 50 mL centrifuge tubes.
7. Isopropanol.
8. 70% Ethanol; store at –20°C.
2.2. Probe Labeling
1. Nick translation kit (e.g., Roche Diagnostics, cat. no. 976776, containing dNTPs,
buffer, DNA polymerase/DNase I enzyme mix).
2. Labeled dUTP: digoxygenin-11-dUTP, biotin-11-dUTP, fluoroscein-11-dUTP,
or Texas Red-11-dUTP at a concentration of 0.4 mM (see Note 1).
3. 0.2 M EDTA, pH 8.0.
4. Herring sperm DNA (Gibco-BRL) (5 µg/mL).
5. Human COT-1 DNA (Gibco-BRL) (1 mg/mL).
6. 100% Ethanol.
7. 3 M Sodium acetate, pH 5.2.
8. Glycogen: 20 mg/mL (Gibco-BRL).
9. 20X SSC: Dissolve 87.66 g NaCl and 44.11 g Na3 citrate in 500 mL distilled H2O
(dH2O). Adjust pH to 7.0. Autoclave and store at room temperature.
10. For use with repetitive-sequence probes: Hybridization buffer 1 (HB1), containing 50% formamide. Dissolve 1 g dextran sulfate in 5 mL deionized formamide
(see Note 2) by heating to 70°C. Add 1 mL 20X SSC and adjust pH to 7.0. Make
up final volume to 10 mL with dH2O. Store at – 20°C.
Fluorescent In Situ Hybridization
77
Table 2
Suggested Stringency Washing Conditions
SSC concentrationa
Temperatureb
Time
Repetitive sequence
Single copy
Chromosome library
0.5X SSC
75°C
5 min
2X SSC
75°C
5 min
1X SSC
75°C
2 × 5 min
aTo prepare various SSC concentrations use 20X SSC (see Subheading 2.2.) and dilute as
appropriate (e.g., to make 2X SSC, use 1 vol of 20X SSC to 9 vol H2O).
bIncubate wash chamber containing SSC in a 75°C water bath for at least 30 min prior to
washing. Check temperature inside the chamber before commencing washing.
11. For use with single-copy probes or whole-chromosome libraries: Hybridization
buffer 2 (HB2), containing 71% formamide. Dissolve 1 g dextran sulfate in 5 mL
deionized formamide (see Note 2) by heating to 70°C. Add 1 mL of 20X SSC
and adjust pH to 7.0. Make up final volume to 7 mL with H20. Store at –20°C.
12. Water bath, 15°C.
13. Microcentrifuge.
2.3. Hybridization
1.
2.
3.
4.
5.
6.
7.
8.
9.
10.
Labeled probe(s).
Methanol (100%, 95%, 75%).
For use with repetitive-sequence probes: HB1 (see Subheading 2.2.).
For use with single-copy probes and whole-chromosome libraries: HB2 (see Subheading 2.2.).
Denaturation solution: 70% deionized formamide/2X SSC. To 35 mL deionized
formamide (see Note 2), add 5 mL of 20X SSC (see Subheading 2.2.) and 10 mL
dH2O, adjust pH to 7.0. Note: Denaturation solution is not required when using
repetitive-sequence probes.
Diamond pen to mark target slides.
Sealable plastic hybridization chamber lined with moist tissue.
Hot plate, 50°C.
Water bath, 75°C.
Incubator, 37°C, 42°C.
2.4. Stringency Washing
1. SSC (see Table 2 for concentration).
2. PN buffer: Titrate 4 L of 0.1 M sodium phosphate dibasic (Na2HPO4) solution
with 0.1 M sodium phosphate monobasic (NaH2PO4) solution to give a pH of 8.0.
Add 4.5 mL nonidet-P-40 (detergent). Mix well and store at room temperature
for up to 2 wk.
3. Water bath, 75°C.
78
Dyer and Green
2.5. Detection
1. PNM buffer: To 250 mL PN buffer (see Subheading 2.4.), add 12.5 g nonfat
dried milk (or other blocking agent [e.g., bovine serum albumin] and 0.05 g
sodium azide; see Note 3), mix well, and incubate at 37°C for 60 min. Cool and
store at 4°C for up to 2 mo.
2. Fluoroscein avidin (Vector Laboratories, Inc.) (2 mg/mL).
3. Biotinylated anti-avidin D, affinity purified (Roche Diagnostics) (0.5 mg/mL).
4. Mouse monoclonal anti-digoxin (Sigma Biosciences) (100 µg/mL).
5. Sheep anti-mouse Ig-digoxygenin, F(ab) 2 -fragment (Roche Diagnostics)
(200 µg/mL).
6. Sheep anti-digoxygenin–rhodamine, FAB fragments (Roche Diagnostics)
(200 µg/mL).
7. PN buffer (see Subheading 2.4.).
2.6. Counterstaining
1. Propidium iodide (PI) (Vector Laboratories, Inc.) in an antifade solution (e.g.,
Vectashield, Vector Laboratories, Inc.) to give a final concentration of 1 µg/mL
(see Note 4).
2. 6-Diamidine-2-phenylindole (DAPI) (Vector Laboratories, Inc.) in an antifade
solution (e.g., Vectashield, Vector Laboratories, Inc.) to give a final concentration of 0.5 µg/mL.
3. Methods
3.1. Growing Probes in the Laboratory
Plasmid, cosmid, and P1 clone (PAC) DNA suitable for labeling as FISH
probes can be isolated using a Qiagen Plasmid kit. In the following methodology, the isolation of PACs will be described (see Note 5), for plasmid and
cosmid preparations, see the Qiagen Plasmid purification handbook.
1. Grow a single colony, picked from a freshly streaked LB (kanamycin,
25 µg/mL) plate, in a starter culture of 5 mL LB medium containing kanamycin
(25 µg/mL) and incubate in a shaking incubator for approx 8 h at 37°C with
vigorous shaking at 300 rpm.
2. Inoculate a 500-mL LB kanamycin (25 µg/mL) culture with 1 mL of the starter
culture and grow as in step 1 for 12–16 h.
3. Transfer the culture to clean centrifuge tubes and pellet the bacterial cells
at 7500 rpm for 15 min.
4. Resuspend the bacterial pellet in 10 mL of P1 buffer containing RNase A
(100 µg/mL) until there are no visible clumps.
5. Add 20 mL of P2 buffer and mix gently by inverting the tube 10 times and
leave at room temperature for 5 min.
6. Add 20 mL of chilled P3 buffer, mix immediately by inverting four to five times
and incubate on ice for 20 min.
Fluorescent In Situ Hybridization
79
7. Centrifuge at 9500 rpm for 30 min at 4°C.
8. In the meantime, prepare the Qiagen tip by adding 10 mL of equilibration buffer
QBT and allowing to drip through by gravity flow.
9. If the supernatant is clear, pipet onto the Qiagen tip and allow to enter the resin
by gravity flow. If the supernatant is not clear, centrifuge again before applying
to the Qiagen tip.
10. Wash the Qiagen tip with 2 × 10 mL buffer QC.
11. To elute the DNA, apply 5 mL buffer QF prewarmed to 50°C (see Note 6).
12. Precipitate the DNA with 0.7 vol isopropanol at room temperature, centrifuge
immediately at 4°C for 30 min and carefully remove the supernatant (see Note 7).
13. Wash the pellet by adding 2 mL cold 70% ethanol and inverting. Centrifuge at
11,000 rpm for 10 min.
14. Remove the supernatant, air-dry the pellet, and redissolve in sterile water.
3.2. Probe Labeling
Nick translation is the method of choice for labeling FISH probes. The technique involves the use of two enzymes; a DNase that randomly nicks probe
DNA and a DNA polymerase that repairs the nicked DNA and, at the same
time, incorporates labeled dNTP molecules into the probe. The following protocol uses a nick translation kit and describes a basic method suitable for indirect or direct labeling of FISH probes.
1. To label 1 µg of DNA, add the following to a 0.5-mL Eppendorf tube on ice:
1 µg DNA;
10 µL dNTP mix (1 vol labeled dUTP[0.4 mmol/L], 2 vol dTTP [0.1 mM], 3
vol each dATP, dCTP, dGTP [0.1 mM]);
2 µL 10X buffer;
2 µL enzyme mix (see Note 8);
Sterile water to give final volume of 20 µL.
2. Mix well and incubate at 15°C for 90 min.
3. Add 2 µL EDTA (0.2 M) to stop enzyme activity.
4. For nick translation of single-copy probes or whole-chromosome libraries, add
25 µL Human COT-1 DNA (1 mg/mL) (see Note 9).
5. Add 10 µL Herring sperm DNA (5 µg/mL) (see Note 10)
6. To precipitate DNA, add the following:
0.1 × total volume sodium acetate (3 M, pH 5.2);
1 µL glycogen (20 mg/mL);
2 × total volume 100% ethanol.
7. Mix well and incubate at – 20°C for 30 min to aid DNA precipitation.
8. Spin at 13,000 rpm for 30 min to pellet the DNA.
9. Discard aqueous phase and air-dry DNA pellet at room temperature for 15 min or
until supernatant is no longer visible.
10. Resuspend dried pellet in 20 µL HB1 (for centromeric probes) or HB2 (for
single-copy probes and whole-chromosome libraries) to give a final concentration of 50 ng/µL.
80
Dyer and Green
11. Incubate at 37°C for 30 min to aid resuspension of DNA. Store probe at – 20°C
while not in use.
3.3. Hybridization
The methodology for hybridization depends on the nature of the probe. Three
hybridization protocols are described for use with laboratory-grown repetitivesequence, single-copy, and whole-chromosome library probes. The protocols
are designed for use on fixed cell preparations.
Target slides should be checked prior to hybridization under a phase-contrast microscope. The cells should not be overlapping and there should be minimal visible cytoplasm. Chromosomes, if present, should be of an appropriate
length and adequately spread. They should appear a dark gray color; light gray
chromosomes or those with a “glassy” appearance are likely to result in poor
hybridization. Optimum results are achieved on unbaked slides that are less
than 1 mo old.
3.3.1. Hybridization Protocol 1:
For Use with Repetitive Sequence Probes
Repetitive-sequence probes can be applied with equal success to metaphase
or interphase preparations. By using differentially labeled probes, it is possible
to apply more than one probe to a single target slide. The following protocol
involves codenaturation of target and probe DNA.
1. Prewarm the hybridization chamber in a 75°C water bath.
2. Mark the hybridization area on the underside of each target slide using a
diamond pen.
3. Dehydrate the target slide(s) by incubating through an alcohol series; 2 min in
each of 75%, 95%, and 100% methanol at room temperature; dry briefly on a
50°C hot plate.
4. For each slide, aliquot 0.5 µL of each labeled probe into an Eppendorf tube and
make volume up to 10 µL with HB1 (e.g., if simultaneously applying two differentially labeled probes to two slides, use 1 µL of each probe and 18 µL of HB1);
mix well.
5. Apply 10 µL of probe mix to the marked hybridization area of each dehydrated
slide, cover the hybridization area with a 22 × 22-mm coverslip (see Note 11),
and seal the edges with rubber sealant.
6. Place the slide (s) in the prewarmed hybridization chamber, seal the lid, and incubate at 75°C for exactly 10 min in order to codenature the probe and target DNA.
7. Incubate the hybridization chamber containing the slide(s) at 37°C overnight.
3.3.2. Hybridization Protocol 2: For Use with Single-Copy Probes
Single-copy probes can be applied to metaphase or interphase preparations.
The use of differentially labeled probes allows the simultaneous application of
more than one probe to a single target slide.
Fluorescent In Situ Hybridization
81
1. At least 30 min prior to hybridization, prewarm a lidded plastic Coplin jar
containing denaturation solution in a 75°C water bath. The water bath should be
sited in a Class 1 fume hood to contain formamide fumes.
2. Mark the hybridization area on the underside of each target slide using a diamond pen.
3. For each slide, aliquot 1 µL of each labeled single-copy probe into an Eppendorf
tube and make up volume to 10 µL with HB2 (e.g., if simultaneously applying
two differentially labeled probes to two slides, use 1 µL of each probe and 18 µL
of HB2); mix well.
4. Denature by incubating the probe mix at 75°C for exactly 5 min, snap-chill on ice
for 30 s and prehybridize by incubating at 37°C for 30 min (see Note 12).
5. Shortly before the end of prehybridization, check that the temperature of the
denaturation solution is 75°C. Denature the target slide(s) by incubating in the
denaturation solution for exactly 2 min (see Note 13). Dehydrate the target
slide(s) by incubating through an ice-cold alcohol series; 2 min in each of 75%,
95%, and 100% methanol and dry briefly on a 50°C hot plate.
6. Apply 10 µL of the denatured, prehybridized probe mix to the marked
hybridization area of each denatured slide. Cover the hybridization area with a
22 × 22-mm coverslip and seal the edges with rubber sealant (see Note 11). Place
slide(s) in a hybridization chamber and hybridize overnight at 37°C.
3.3.3. Hybridization Protocol 3:
For Use with Whole-Chromosome Libraries
Whole-chromosome libraries are usually used for the characterization of
metaphase chromosomes rather than interphases cells, where the signals appear
as indistinct, often overlapping domains. Dual-color painting refers to the
simultaneous application of two differentially labeled chromosome libraries to
target chromosome spreads.
1. At least 30 min prior to hybridization, prewarm a lidded plastic Coplin jar containing denaturation solution in a 75°C water bath. The water bath should be
sited in a Class 1 fume hood to contain formamide fumes.
2. Mark the hybridization area on the underside of each target slide using a diamond pen.
3. If using a single library, dilute 3 µL of labeled library with 7 µL HB2 (per slide);
mix well. For dual-color painting, use 3 µL of each of two differentially labeled
chromosome libraries and 4 µL HB2 (per slide). Denature the probe(s) at 75°C
for exactly 5 min. Snap-chill on ice for 30 s and prehybridize at 37°C for at least
2 h (see Note 12).
4. Shortly before the end of prehybridization, check that the temperature of the
denaturation solution is 75°C. Denature the target slide(s) in denaturation solution for exactly 2 min. Dehydrate the target slide(s) by incubating through an icecold alcohol series; 2 min in each of 75%, 95%, and 100% methanol and dry
briefly on a 50°C hot plate.
5. Apply 10 µL denatured probe mix to the marked hybridization area of each
denatured slide. Cover the hybridization area with a 22 × 22 mm coverslip (see
82
Dyer and Green
Note 11) and seal the edges with rubber sealant. Place the slide(s) in a hybridization chamber and hybridize overnight at 42°C.
3.4. Stringency Washing
Stringency washing removes unbound probe from the target slide. The amount
of probe left on the slide depends on the stringency of the wash; high-stringency
washes have a low salt concentration and/or high temperature, whereas lowstringency washes have a high salt concentration and/or low temperature.
1. After hybridization, gently remove coverslips and rubber sealant using fine forceps and wash the slide(s) in the appropriate SSC concentration at 75°C (see
Note 13) for the required time (see Table 2).
2. Rinse briefly in PN buffer and then allow the slide to stand in PN buffer for at
least 10 min. If using indirectly labeled probes, proceed to the detection stage
(see Subheading 3.5.). If using directly labeled probes, proceed to the counterstaining stage (see Subheading 3.6.).
3.5. Detection
This stage is only necessary for slides hybridized with indirectly labeled
probes; if directly labeled probes have been used, slides may be counterstained
immediately (see Subheading 3.6.). Protocols are given for the detection of
both biotin- and digoxygenin-labeled probes and involve “amplifying” detection reagents to give high-intensity signals. Biotin is detected with a green
fluorescent label (fluoroscein) and digoxygenin with a red label (rhodamine).
1. Prepare detection reagents I, II, and III in light-protected plastic Coplin jars as
shown in Table 3. The detection reagents can be reused over a 6 wk period and
should be stored at 4°C while not in use.
2. After washing, incubate the hybridized slide(s) in detection reagent I at room
temperature for 20 min. Rinse briefly in PN buffer and leave standing at room
temperature in fresh PN buffer for 10 min. Do not allow the slides to dry out at
any stage.
3. Repeat step 2 using detection reagents II and III, consecutively. Leave slide(s)
standing in PN buffer prior to the counterstaining stage.
3.6. Counterstaining
For optimum contrast, probes labeled or detected with a green label are best
viewed on a red (PI) background, whereas red probes are best viewed on a blue
(DAPI) background. If both red and green probes have been applied, a DAPI
counterstain should be used.
1. Remove slide(s) from PN buffer (i.e., the final stage of either stringency washing
or detection for directly or indirectly labeled probes, respectively) and drain off
Detection of biotin only
Detection of digoxygenin only
Simultaneous detection
of biotin and digoxygenin
83
Detection Reagent I
50 mL PNM buffer,
125 µL fluoroscein avidina
(2 mg/mL)
50 mL PNM buffer,
100 µL mouse monoclonal
anti-digoxin (100 mg/mL)
50 mL PNM buffer,
125 µL fluoroscein avidina
(2 mg/mL),
100 µL mouse monoclonal
anti-digoxin (100 mg/mL)
Detection Reagent II
50 mL PNM buffer,
500 µL biotinylated
anti-avidin D (0.5 mg/mL)
50 mL PNM buffer,
500 µL sheep anti-mouse
Ig-digoxygenin (200 mg/mL)
500 µL sheep anti-mouse
Ig-digoxygenin (200 mg/mL)
50 mL PNM buffer,
500 µL biotinylated anti-avidin D
(0.5 mg/mL),
Detection Reagent III
50 mL PNM buffer,
125 µL fluoroscein avidina
(2 mg/mL)
50 mL PNM buffer,
500 µL sheep anti-digoxygenin–
rhodaminea (200 mg/mL)
50 mL PNM buffer,
125 µL fluoroscein avidina
(2 mg/mL),
500 µL sheep anti-digoxygenin–
rhodaminea (200 mg/mL)
a These
Fluorescent In Situ Hybridization
Table 3
Preparation of Detection Reagents
chemicals are light sensitive, handle in reduced-light conditions at all times.
83
84
Dyer and Green
excess buffer by touching the end of each slide to a paper towel. Do not allow the
slide(s) to dry out completely.
2. Apply 10 µL of the appropriate counterstain to the marked hybridization area of
each target slide.
3. Cover the hybridization area with a 22 × 32-mm coverslip (avoiding air bubbles)
and store at 4°C in the dark until ready for microscopic evaluation.
3.7. Microscope Evaluation
A fluorescent microscope is required for analysis of FISH preparations, and
good signal intensities are achieved using a 100-W mercury bulb. The microscope needs to be fitted with excitation and barrier filters appropriate for the
fluorescent labels used. At this stage, slides are prone to fading if exposed to
light and should be kept in reduced-light conditions.
During microscopic evaluation, probe signals should appear as distinct signals with minimal background fluorescence. Single-copy probes should be seen
as small bright signals and there should be virtually no background nonspecific
hybridization. Repetitive-sequence probes tend to show some degree of crosshybridization across the genome, but specific signals should still be bright and
easily recognizable. It should be noted that certain repetitive-sequence centromeric probes hybridize to more than one centromeric pair because of extensive
sequence homology (e.g., the chromosome 1 centromeric probe hybridizes to
the centromeric regions of chromosomes 1, 5, and 19 whereas centromeric
probes specific for chromosomes 13 and 14 also hybridize to the centromeres
of chromosomes 21 and 22, respectively). Whole-chromosome libraries should
hybridize specifically along the length of a chromosome pair although it is not
uncommon to see low levels of cross-hybridization across the rest of the
genome. Occasionally, FISH preparations show no signal or excessive crosshybridization; there is usually a simple reason for this and some troubleshooting tips are given in Table 4.
4. Notes
1. If using direct labels (i.e., fluoroscein-11-dUTP or Texas Red-11-dUTP), handle
in reduced-light conditions at all times.
2. Formamide is a known teratogen and should be handled with extreme care.
3. Sodium azide is a known mutagen and should be handled with extreme caution.
4. Propidium iodide is a potential carcinogen and should be treated with care.
5. Yield for PAC DNA can be as little as 10 µg from a 500-mL culture.
6. After precipitation, if no DNA appears to have been eluted, apply a higher-pH
buffer, pH 9.0, to the Qiagen tip and precipitate as before.
7. Isopropanol pellets have a glassy appearance and tend to be easily dislodged. If
this occurs, use a standard ethanol precipitation in an Eppendorf and add the
following:
Fluorescent In Situ Hybridization
85
Table 4
Troubleshooting FISH
Problem
No signal or dim
signal at microscope evaluation
High background to
probe signal
Chromosomes have
poor morphology
Possible causes and solutions
1. Probe concentration may have been too weak—increase
the amount of probe in the probe mix.
2. The target slide was not sufficiently denatured—remake
the denaturation solution using fresh reagents and ensure
temperature is 75°C. If using the codenaturation method,
ensure that the temperature is 75°C.
3. The wash was too stringent—increase the SSC concentration.
4. Incorrect filters were used for slide evaluation—check
that filters and fluorescences are compatible.
5. Detection solutions were incorrectly prepared (indirectly
labeled probes only)—remake detection solutions I, II,
and III.
6. Probe labeling may have failed—repeat using fresh nick
translation reagents.
1. Too much probe was used—decrease the amount of probe
in the probe mixture.
2. The wash was not stringent enough—decrease the SSC
concentration.
The slide may have been overdenatured—remake the denaturation solution, ensure that the temperature is 75°C and that
slide is denatured for 2 min only. If codenaturing, ensure
that the temperature of hybridization chamber is 75°C.
If the slides still have poor morphology, decrease the
denaturation time or denaturation solution temperature.
0.1 × total volume 3 M sodium acetacte, pH 5.2;
2 × total volume cold 100% ethanol.
Mix well and incubate at –20°C for 30 min and centrifuge for 30 min at 13,000 rpm.
Remove the supernatant and wash the pellet with 200 µL cold 70% ethanol;
recentrifuge for 10 min. Remove the supernatant and air-dry the pellet before
resuspending in distilled sterile water.
8. The enzyme mixture is heat sensitive; keep at –20°C until just before use and
replace immediately after use.
9. Human COT-1 DNA blocks repetitive sequences within single-copy probes or
whole chromosome libraries.
10. Herring sperm DNA acts as carrier DNA and aids the precipitation of probe DNA.
It also blocks the nonspecific attachment of probe to the slide surface.
86
Dyer and Green
11. Take care to avoid trapping air bubbles, as the probe will not hybridize to target
DNA under the bubbles.
12. This step allows COT-1 DNA included in the probe mixture to hybridize to
repetitive sequences within the probe DNA, thus blocking these region from
hybridizing to target DNA. This process is known as competitive in situ
suppression (CISS) (3).
13. A maximum of four slides should be processed at any one time to avoid a significant decrease in temperature.
References
1. Speicher, M. R., Ballard, S. G., and Ward, D. C. (1996) Karyotyping human chromosomes by combinatorial multi-fluor FISH. Nature Genet. 12, 368 – 375.
2. Kallioniemi, A., Kallioniemi O-P., Sudar, D., Rutovitz, D. Gray, J. W., Waldman
F., et al. (1992) Comparative genomic hybridization for molecular cytogenetic
analysis of solid tumours. Science 258, 818 – 821.
3. Lichter, P., Cremer, T., Borden, J., Manuelidis, L., and Ward, D. C. (1988) Delineation of individual human chromosomes in metaphase and interphase cells by in
situ suppression hybridization using recombinant DNA libraries. Hum. Genet. 80,
224 –234.
Further Reading
Barch, M. J., Knutsen, T., and Spurbeck, J., eds. (1997) The AGT Cytogenetics
Laboratory Manual,. Lippincott–Raven, PA.
Rooney, D. E. and Czepulkowski, B. H., eds. (1992) Human Cytogenetics, Volume I,
IRL, Oxford.
Protein Truncation Test
87
12
The Protein Truncation Test
Carol A. Hardy
1. Introduction
The protein truncation test (PTT) (1), occasionally referred to as the in vitro
synthesized-protein (IVSP) assay (2), is a method for screening the coding
region of a gene for mutations that result in the premature termination of
mRNA translation. The techniques involved in performing PTT are relatively
straightforward and begin with the isolation of genomic DNA or RNA. The
polymerase chain reaction (PCR) is used to amplify a DNA template, usually
of 1–3 kb in size, that is tested in an in vitro transcription and translation assay.
Truncated proteins are identified by sodium dodecyl sulfate polyacrylamide
gel electrophoresis (SDS-PAGE) and autoradiography or fluorography. A
single, large exon of a gene can be amplified directly from genomic DNA in
several overlapping fragments. The complete coding sequence of a large gene,
with many small exons, can be amplified in several overlapping fragments by
reverse-transcription PCR (RT-PCR) starting from RNA. Amplifying the gene
in several segments that overlap each other by 300 – 500 bp increases the sensitivity of PTT. A truncating mutation located toward the 3' end of one segment
will also occur near the 5' end of the next overlapping segment, thus increasing
the likelihood of identifying a truncated protein. A specially modified forward
PCR primer is required for PTT. In addition to the in-frame gene-specific
primer sequence, an extension at the 5' end includes the T7 promoter sequence
for RNA transcription by T7 RNA polymerase, the eukaryotic consensus
sequence for the initiation of protein translation, and the ATG protein translation start site. The yield and specificity of the PCR amplification is checked by
agarose gel electrophoresis. Then, an aliquot of the PCR product is used as the
template for in vitro transcription and translation, using RNA polymerase and
rabbit reticulocyte lysate or wheat-germ extract. A radiolabeled amino acid is
From: Methods in Molecular Biology, vol. 187: PCR Mutation Detection Protocols
Edited by: B. D. M. Theophilus and R. Rapley © Humana Press Inc., Totowa, NJ
87
88
Hardy
usually incorporated into the translated protein, to allow detection by autoradiography, although nonradioactive PTT methods have also been described
(3,4). The translated proteins are separated by SDS-PAGE, and autoradiography is performed. The presence of a protein that is smaller than the full-length
protein identifies a translation terminating mutation (see Figs. 1 and 2). The
size of the truncated protein indicates the position of the premature stop codon,
and DNA sequencing of genomic DNA is performed to confirm the presence
of a mutation. The mutations identified are principally frameshift and nonsense
mutations, but may also include mutations that disrupt the normal splicing of
exons. There are two main advantages of PTT compared to most other mutation
detection methods. Several kilobase segments of a gene can be rapidly screened
in a single reaction, and PTT only identifies those mutations that have a clear
pathological effect on protein function (i.e., those that result in a truncated
protein and are likely to result in loss of function). Missense mutations and
neutral polymorphisms are not identified. If it is important to identify missense
mutations, another mutation detection method, such as single-strand
conformation polymorphism (SSCP) (see Chapter 16), would need to be used
in conjunction with PTT.
The protein truncation test was first described in 1993 as a technique for
identifying translation terminating mutations in the dystrophin gene (1), which
cause the X-linked disorder Duchenne muscular dystrophy (DMD). The
technique was subsequently applied to identification of truncating mutations in
the APC gene (2) that cause familial adenomatous polyposis. Since then, PTT
has been used successfully in the identification of translation terminating
mutations in many other genes that result in human hereditary disorders, some
examples are shown in Table 1. The dystrophin gene illustrates some of the
problems encountered in screening large genes for mutations and shows how
these problems are largely overcome by the use of PTT. The dystrophin gene is
exceptionally large, with 79 small exons contained within a region of 2400 kb.
The majority of dystrophin mutations in DMD patients are easily identifiable
deletions of one or more exons (1). However, approximately one-third of
dystrophin mutations are nonsense mutations or small frameshift mutations
that result in premature truncation of the dystrophin gene, less than 2% of DMD
cases are the result of a pathogenic missense mutation (1,5). Using conventional methods, such as SSCP, to screen for these mutations is exceedingly
time-consuming and is usually less than 100% sensitive. Moreover, neutral
polymorphisms and missense mutations of uncertain pathogenicity are identified by these techniques. Direct sequencing of the gene is both time-consuming
and expensive. PTT was developed to screen the dystrophin gene specifically
for translation-terminating mutations, following amplification of large segments of the gene by nested RT-PCR (1). The whole of the dystrophin coding
Protein Truncation Test
89
1
2
Fig. 1. PTT for exon 11 of the BRCA1 gene, amplified from genomic DNA. From
left to right: lane 1, a normal control with only the full-length translated protein; lane
2, a breast cancer patient with a 5 bp deletion of nucleotides 1623–1627, which results
in a premature stop at codon 503. (PTT performed by Ms. Kim Hampson, DNA Laboratory, Regional Genetics Service, Birmingham Women’s Hospital, Birmingham.)
1
2
3
4
5
Fig. 2. PTT for the PTCH gene in patients affected with naevoid basal cell carcinoma syndrome (NBCCS or Gorlin syndrome). RNA was isolated from lymphoblastoid
cell lines, and nested RT-PCR was used to amplify a 1.6-kb fragment of the gene,
which includes exons 10–16. Truncated proteins were identified in NBCCS patients
with the following mutations (from left to right): lane 1, 2439insC; lane 2, 2101del19bp;
lanes 3 and 4, siblings with 2683insC mutation; lane 5, normal control.
90
Table 1
Some Examples of Human Hereditary Disorders Frequently Caused
by Translating Terminating Mutations that Can Be Identified by PTT
90
Disorder
Gene
Duchenne muscular dystrophy
Duchenne muscular dystrophy
FAP
Breast/ovarian cancer
Breast/ovarian cancer
Breast/ovarian cancer
Breast cancer
HNPCC
HNPCC
Cystic fibrosis
Neurofibromatosis 1
Tuberous sclerosis
Polycystic kidney disease
Gastric cancer
DMD
DMD
APC
BRCA1
BRCA1
BRCA1/BRCA2
BRCA1/BRCA2
hMLH1
hMSH2
CFTR
NF1
TSC2
PKD1
E-cadherin
Forward primer 5' extension
ggatccTAATACGACTCACTATAGGaacagaCCACCATG
ggatccTAATACGACTCACTATAGGaacagaCCACCATG
ggatccTAATACGACTCACTATAGGaacagaCCACCATG
gcTAATACGACTCACTATAGGaacagaCCACCATGG
ggatccTAATACGACTCACTATAGGGagaCCACCATGG
TAATACGACTCACTATAGGGagaCCACCATG
ggatccTAATACGACTCACTATAGGacagaCCACCATG
ggatccTAATACGACTCACTATAGGGagaCCACCATGG
ggatccTAATACGACTCACTATAGGGagaCCACCATGG
ggatccTAATACGACTCACTATAGGaacagaCCACCATG
ggatccTAATACGACTCACTATAGGGagaCCACCATG
ggatccTAATACGACTCACTATAGGaacagaCCACCATG
ggatccTAATACGACTCACTATAGGaacacaCCACCATG
aagcttATTAACCCTCACTAAAGGGAagagaCCACCATGG
Ref.
1
5
7,8
9
10
11
13
14
15
16
17
18
19
4
Note: The forward primer 5' extensions used in each case are shown. Restriction sites and spacer sequences are shown in lowercase letters; the
T7 promoter (a is the T3 promoter) is shown in uppercase letters and underlined, the eukaryotic translation initiation site is shown in uppercase
letters.
Hardy
Protein Truncation Test
91
sequence can by amplified and screened by PTT in just 10 overlapping fragments and has been successfully used to identify translation-terminating mutations in affected males and carrier females (5). More recently, multiplex PTT
for the dystrophin gene has been described (6). The complete coding sequence
can be analyzed in just five overlapping RT-PCR products, which are simultaneously tested for truncating mutations in a single in vitro transcription–translation reaction, translated proteins from one reaction are separated in a single
lane of an SDS-PAGE gel (6).
The advantages PTT has over conventional mutation screening methods
make it an ideal choice for identifying translation-terminating mutations that
occur in several important tumor suppressor genes. Familial adenomatous polyposis (FAP) is caused by germline mutations of the APC gene, and somatic
mutation of the APC gene occurs frequently in sporadic colorectal carcinomas
(CRC). In both FAP and CRC, approx 95% of the mutations identified in the
APC gene result in premature termination of protein translation (7). The APC
gene is large with 15 exons and a coding sequence of 8.5 kb. Exon 15 of the
APC gene is 6.5 kb in length and approx 70% of the mutations found in FAP
patients occur in the 5' end of exon 15. Approximately 65% of the somatic
mutations found in sporadic CRC are located within a small region of exon 15
known as the mutation cluster region. By direct amplification of a 2-kb segment of exon 15 of the APC gene from genomic DNA and a single PTT, it is
theoretically possible to identify 50% of germline mutations in FAP patients
and 75% of somatic mutations in sporadic CRC (7). PTT analysis of the complete coding region of the APC gene can be accomplished by amplification of
the whole gene in five or six overlapping segments (2,8). Exon 15 is amplified
directly from genomic DNA in four overlapping segments (2,8). Exons 1–14
are amplified in one (2) or two overlapping segments by RT-PCR amplification of RNA (8). Using this approach, translation-terminating mutation were
identified in 82% of FAP patients tested (2).
A similar approach has been described for the identification of translationterminating mutations that occur in the BRCA1 and BRCA2 genes, which cause
the majority of cases of hereditary breast and ovarian cancer where a single
gene is involved (9–11). BRCA1 and BRCA2 are similar in structure, both
are large genes with many exons, and in each case, the majority of mutations
result in the premature termination of translation. The BRCA1 gene encodes a
7.5-kb transcript, spread over 100-kb of DNA. It has 22 coding exons, and
exon 11 alone contains 60% of the coding sequence (10,12). Approximately
86% of the mutations identified in BRCA1 are truncating mutations and approx
50% of these are located within exon 11 (10). Similarly, BRCA2 has 26 coding
exons and encodes a 10.5-kb transcript; exon 11 is exceptionally large and
contains 50% of the entire coding sequence (12). Virtually all of the mutations
92
Hardy
so far identified in BRCA2 are protein truncating (11). Thus, like the APC gene,
translation-terminating mutations in BRCA1 and BRCA2 are most easily identified by PTT. In both cases, exon 11 is amplified directly from genomic DNA
in one (11) or three (9,10) overlapping segments for BRCA1 and in two to five
overlapping segments for BRCA2 (11–13). Exon 10 of the BRCA2 gene can
also be amplified directly from genomic DNA as a single 1.2-kb segment (13).
PTT for the other, smaller exons is performed following nested RT-PCR
(9,11,12).
In summary, PTT is a simple, rapid, and cost-effective method of screening
large genes, with a high frequency of mutations that result in premature termination of protein translation. The following sections describe how to perform
mutation analysis by PTT, and consideration is given to some of the problems
most often encountered when using this technique.
2. Materials
2.1. PCR Amplification of Template
for In Vitro Transcription and Translation
2.1.1. Reverse Transcription of RNA
1. Total cellular RNA prepared from the appropriate tissue (see Note 1).
2. Oligo-d(N)6 primer, 0.5 µg/µL (Promega Ltd.). Store at –20°C (see Note 2).
3. Diethyl pyrocarbonate (DEPC) treated distilled H2O. Add 100 µL of DEPC to
100 mL of distilled H2O contained in a glass bottle. Mix vigorously for 10 min
and then leave at room temperature overnight. Inactivate the DEPC by autoclaving for 30 min at 120°C. Store at 4°C. DEPC should be handled with care, as it is
a powerful acylating agent, always handle in a fume hood and never add to Tris
buffers or solutions containing ammonia.
4. 5X Reverse transcription buffer (Invitrogen Life Technologies Ltd.). Store at –20°C.
5. 0.1 M Dithiothreitol (DTT) (Invitrogen Life Technologies Ltd.). Store at –20°C.
6. 10 mM dNTP mix in sterile DEPC-treated H2O, prepared from 100 mM stocks of
dATP, dCTP, dGTP; and dTTP (Amersham Pharmacia Biotech Ltd.). Store at –20°C.
7. RNasin ribonuclease inhibitor (Promega Ltd.). Store at –20°C.
8. M-MLV reverse transcriptase, 200 U/µL (Invitrogen Life Technologies Ltd.). Store
at –20°C.
2.1.2. Nested RT-PCR
1. 10X Taq Extender™ reaction buffer (see Note 3), 200 mM Tris-HCl (pH 8.8),
100 mM KCl, 100 mM (NH4)2SO4, 20 mM MgSO4, 1% Triton X-100, 1 mg/mL
nuclease-free bovine serum albumin (Stratagene Ltd., Cambridge, UK). Store
at –20°C.
2. 2 mM dNTP mix in sterile H2O, prepared from 100 mM stocks of dATP, dCTP,
dGTP, and dTTP (Amersham Pharmacia Biotech Ltd). Store at –20°C.
Protein Truncation Test
93
3. Nested PCR primers pairs. The forward primer of the inner pair must have the
5' extension, which includes the T7 promoter sequence, the eukaryotic protein
translation initiation sequence, followed by the in-frame ATG start codon
and the gene-specific primer sequence (see Table 1 and Note 4). Some examples
of 5' extension sequences are shown in Table 1. Primers stock solutions are
200 pmol/µL in TE buffer (10 mM Tris-HCL, 1 mM Na2EDTA, pH 8.0), store at
–20°C. Working solutions are 20 pmol/µL in sterile dH2O. Store at –20°C.
4. Sterile dH2O.
5. Taq Extender™ PCR additive, 5 U/µL (see Note 3) (Stratagene Ltd., Cambridge,
UK). Store at –20°C.
6. Taq DNA polymerase (see Note 5), 5 U/µL (Invitrogen Life Technologies Ltd.).
Store at –20°C.
7. 50 mM MgCl2 (Invitrogen Life Technologies Ltd.). Store at –20°C.
8. Mineral oil (Sigma Chemical Company). Store at room temperature.
2.1.3. PCR Amplification of Genomic DNA
1. Genomic DNA. (see Note 6).
2. 10X PCR buffer minus magnesium (see Note 5), 200 mM Tris-HCl (pH 8.4),
500 mM KCl (Invitrogen Life Technologies Ltd.). Store at –20°C.
3. T7 modified forward primer and reverse primer pairs. Stock solutions are
200 pmol/µL in TE buffer; store at –20°C. Working solutions are 20 pmol/µL, in
sterile dH2O. Store at –20°C.
4. 2 mM dNTP mix (see Subheading 2.1.2.).
5. 50 mM MgCl2 (Invitrogen Life Technologies Ltd.). Store at –20°C.
6. Taq DNA polymerase, 5 U/µL (Invitrogen Life Technologies Ltd.). Store at –20°C.
7. Mineral oil (Sigma Chemical Company). Store at room temperature.
2.2. Agarose Gel Electrophoresis
1. 1X TBE buffer: 89 mM Tris-borate, 89 mM boric acid, 2 mM EDTA. Prepare a
10X stock solution by dissolving 108 g Trizma base, 55 g boric acid, and 9.3 g
Na2EDTA dissolved in a final volume of 1000 mL distilled H2O without adjustment of pH. Store at room temperature.
2. Ethidium bromide solution, 5 mg/mL in dH2O. Store at 4°C in a dark glass bottle.
Great care should be taken when handling solutions and gels containing ethidium
bromide, as it is a powerful mutagen. Gloves should be worn at all times and a
mask should be worn when weighing out the solid. Solutions of ethidium bromide should be disposed of in compliance with the local safety regulations.
3. Agarose gel, 1% (w/v) agarose in 1X TBE buffer, with 0.5 µg/mL ethidium
bromide.
4. 1-kb Ladder (Invitrogen Life Technologies Ltd.), supplied at a concentration of
1.0 µg/µL. Store at –20°C. Prepare a working solution of 100 ng/µL in 1X gel
loading buffer Store at –20°C. Load approx 100 ng of ladder per millimeter
lane width.
94
Hardy
5. 6X DNA loading buffer, 0.25% bromophenol blue, 0.25% xylene cyanol, 30%
glycerol in dH2 O. Prepare 2X DNA loading buffer by dilution in dH2O. Store
at –20°C.
2.3. In Vitro Transcription and Translation
1. TnT® T7 Quick Coupled Transcription/Translation system (Promega Ltd.) (see
Note 7). Stable for 1 yr when stored at –70°C. Avoid unnecessary thawing and
refreezing, as this will severely reduce the activity of the kit. The kit contains
200-µL aliquots of the TnT® T7 Quick master mix, which should be thawed and
refrozen no more than twice. After thawing and using part of a 200-µL aliquot,
divide the remaining master mix into smaller aliquots. For example, aliquots of
50-µL of master mix is sufficient for five 12.5 µL reactions.
2. T7 luciferase control DNA, 0.5 mg/mL. Supplied withTnT® T7 Quick Coupled
Transcription/Translation system (Promega Ltd.). Store at –20°C.
3. Nuclease-free H2O: Supplied with TnT® T7 Quick Coupled Transcription/Translation system (Promega Ltd.). Store at –20°C.
4. Redivue™ L- [35S]methionine (see Notes 7 and 8), specific activity 37 TBq/mmol
(1000 Ci/mmol) (product code AG1594, Amersham Life Science). Store at –20°C.
Observe local regulations for handling and disposal of radioactive isotopes.
2.4. SDS-PAGE and Autoradiography
1. 0.5 M Tris-HCl buffer (pH 6.8), autoclave and store at room temperature.
2. 10% (w/v) Sodium dodecyl sulfate (SDS). Store at room temperature. Wear a
mask and gloves when weighing out the solid SDS; if possible, use a fume cupboard. SDS is extremely irritating to the respiratory system by inhalation, and by
direct contact with eyes and skin.
3. SDS-PAGE sample loading buffer. Mix 2 mL glycerol, 2 mL 10% SDS (w/v),
0.25 mg bromophenol blue, and 2.5 mL of 0.5 M Tris buffer (pH 6.8); add dH2O
to a final volume of 9.5 mL. Just before use, add 0.5 mL β-Mercaptoethanol.
Stored at room temperature, the loading buffer is stable for about 1 wk, and then
discard and prepare a fresh batch. β-Mercaptoethanol is harmful by inhalation
and contact with skin, as well as having a very unpleasant smell. Therefore, only
open the stock of β-Mercaptoethanol in a fume cupboard and always wear disposable latex gloves. If possible, only handle the SDS-PAGE sample loading
buffer in a fume cupboard or use only in a well-ventilated laboratory.
4. 1.5 M Tris buffer (pH 8.8); autoclave and store at room temperature.
5. 30% Acrylamide solution (29:1 ratio of acrylamide to bis-acrylamide), store at
4°C. Both acrylamide and bis-acrylamide are neurotoxins that are readily absorbed
through the skin and by inhalation of the dust. A mask, safety spectacles, and gloves
must be worn when weighing them. Therefore, it is more convenient to purchase
preprepared 30% acrylamide solution, which is available from a number of suppliers of chemicals and molecular-biology reagents. The solution is still extremely
harmful, and great care should be taken when using it. Always wear protective
clothing, disposable latex gloves, and safety spectacles.
Protein Truncation Test
95
6. 10% (w/v) Ammonium persulfate solution in dH2O. Store at 4°C and discard
after 1 wk.
7. N,N,N',N'-tetramethylethylenediamine (TEMED). Store at 4°C.
8. Polyacrylamide gel apparatus (e.g., the Mini-Protean II electrophoresis cell [see
Note 9] [Bio-Rad Laboratories Ltd.]).
9. 1X Tris-glycine gel running buffer: 25 mM Tris, 250 mM glycine, 0.1% SDS.
Prepare a 5X stock solution by dissolving 15.1 g Tris base and 94 g glycine dissolved in 900 mL of dH2O, add 50 mL 10% SDS solution, adjust final volume to
1000 mL with dH2O. Store at room temperature.
10. Rainbow™ colored protein molecular-weight markers (see Note 10), low-molecular-weight range 2.35–46 kDa or high-molecular-weight range 14.3–220 kDa
(Amersham Life Sciences). Stable for at least 3 mo stored at –20°C.
11. Fix solution, 10% (v/v) acetic acid and 20% (v/v) methanol in dH2O, freshly
prepared before use.
12. 3MM Chromatography paper (Whatman).
13. Vacuum gel drier.
14. X-ray film (e.g., Hyperfilm MP [Amersham Life Science], Kodak T-mat or
Kodak X-OMAT AR [Kodak]) and cassettes.
3. Methods
3.1. PCR Amplification of Template
for In Vitro Transcription and Translation
3.1.1. Reverse Transcription of RNA (9)
Particular care must be taken when preparing and working with RNA to
prevent contamination with RNases. The workbench should be clean. Clean
disposable latex gloves should be worn at all times. New, autoclaved disposable plastic microtubes and pipet tips should be used. Some laboratories prefer
to have a set of automatic pipets kept exclusively for RNA work only in order
to minimize contamination problems.
1. Place approx 1– 3 µg of total cellular RNA and 500 ng of oligo-d(N)6 primer (see
Note 2) in a 0.5-mL microtube. Make the final volume to 32 µL with DEPC-treated
H2O. Heat to 65°C for 10 min and then place on ice.
2. Add 12 µL of 5X reverse transcriptase buffer, 6 µL of 0.1 M DTT, 6 µL of 10 mM
dNTP mix, 1 µL RNasin (30–40 U/µL), and 3 µL M-MLV reverse transcriptase
(200 U/µL). Incubate at 42°C for 1 h. Inactivate the reverse transcriptase by heating to 95°C for 5 min.
3. Perform RT-PCR immediately or store at –20°C until required. Reverse-transcribed RNA should be stable for several months when stored at –20°C.
3.1.2. Nested RT-PCR
The gene under investigation may not be highly expressed in tissues that are
easily sampled, such as blood lymphocytes, cultured skin fibroblasts, or
96
Hardy
lymphoblastoid cell lines. In some cases, the mRNA may be present only as
illegitimate transcripts. This problem can usually be overcome by performing
nested RT-PCR. In the first round of PCR, gene-specific primers are used to
amplify a segment of the gene using the reverse-transcribed RNA as the
template. A second round of PCR is then performed using an aliquot of the first
PCR as template. The primers for the second round of PCR are nested within
the first primer pair; the forward primer has the 5' modification required for
PTT. If low-level transcription of the gene is not a problem, then one round of
PCR should be adequate, using the 5' modified T7 primer and a suitable reverse
primer. Obtaining good, reproducible results for PTT depends to a large extent
on obtaining a single PCR product of high yield. Therefore, it is important to
ensure that the PCR conditions are optimized (see Note 11).
1. Place 1–5 µL of the reverse-transcribed RNA in a 0.5 mL microtube. Store the
remainder of the reverse-transcribed RNA at –20°C.
2. Add 2.5 µL of 10X Taq extender reaction buffer, 2.5 µL of 2 mM dNTPs, 20
pmol forward primer, 20 pmol reverse primer, and sterile H2O to bring the total
volume to 24 µL. When setting up a number of reactions, it is more convenient to
prepare a master mix containing the appropriate volumes of the PCR components. The master mix is added to the tubes containing the reverse-transcribed
RNA, thus reducing the number of pipetting steps. Mix well and overlay the
reaction with 1 or 2 drops of mineral oil to prevent evaporation.
3. Perform “hot-start” PCR (see Note 12). Place the tubes in the thermal cycler and
heat to 94°C for 4 min. Pause the thermal cycler at 94°C and add 1 U Taq DNA
polymerase and 1 U Taq extender additive. Add the two enzymes simultaneously
as a mixture diluted to 1 U/µL in 1X reaction buffer.
4. Resume thermal cycling and perform 30 – 35 rounds of amplification consisting
of denaturing at 94°C for 1 min, annealing at 50 – 65°C for 1 min, and extension
at 72°C for 2 min (see Note 13). End the program with a final extension step of
72°C for 10 min.
5. When the thermal cycling program has ended, check 2 – 5 µL from each sample
by agarose gel electrophoresis (see Subheading 3.2.). It may be possible to see
the first-round amplification product. If a PCR product is visible, check if it is of
the expected size by comparison with the DNA size ladder.
6. Transfer 1– 5 µL of the first-round PCR into a fresh 0.5 mL microtube. Store the
remainder of the first-round PCR product at –20°C. Add 2.5 µL 10X Taq extender
reaction buffer, 2.5 µL of 2 mM dNTPs, 20 pmol of 5' modified forward primer,
20 pmol reverse primer, and sterile H2O to bring the total volume to 24 µL. Mix
well and overlay the reaction with 1 or 2 drops of mineral oil.
7. Perform “hot-start” PCR. Add 1 U Taq DNA polymerase and 1 U Taq
extender additive. Perform 30–35 rounds of amplification consisting of denaturing at 94°C for 1 min, annealing at 50–65°C for 1 min, extension at 72°C
for 2 min (see Note 13). End the program with a final extension step of 72°C
for 10 min.
Protein Truncation Test
97
8. Check the specificity and yield of the amplification by agarose gel electrophoresis (see Subheading 3.2.).
3.1.3. PCR Amplification of Genomic DNA
1. Place 100–500 ng of genomic DNA in a 0.5-mL microtube. Add 2.5 µL of 10X
PCR buffer, 2.5 µL of 2 mM dNTPs, 0.75 µL of 50 mM MgCl2 (see Note 11),
20 pmol 5' modified forward primer, 20 pmol reverse primer, and sterile H2O to
bring the total volume to 24 µL. Mix well and overlay the reaction with 1 or 2
drops of mineral oil.
2. Perform “hot-start” PCR. Add 1 U Taq DNA polymerase. Perform 30 –35 rounds
of amplification consisting of denaturing at 94°C for 1 min, annealing at
50–65°C for 1 min, extension at 72°C for 2 min (see Note 13). End the program
with a final extension step of 72°C for 10 min.
3. Check the specificity and yield of the amplification by agarose gel electrophoresis.
3.2. Agarose Gel Electrophoresis of PCR Products
1. Mix 2–5 µL of each PCR sample with an equal volume of 2X DNA loading
buffer. Load the samples onto the 1% agarose gel and load the appropriate volume of the 1-kb ladder into one lane. Separate by electrophoresis at 75 Volts for
1–2 h.
2. View the gel on an ultraviolet (UV) transilluminator. A single product of the
expected size should be seen. Estimate the yield of the PCR product. This can
most easily done by comparison with a similar-sized DNA band of known concentration. For example, the 1.6-kb fragment of the 1-kb ladder contains 10%
of the mass loaded on the gel. It is useful to take a Polaroid photograph of the
agarose gel as a record of the PCR product concentration and the specificity of
the amplification.
3. A single PCR product of high yield can be used directly, without purification, in
the in vitro transcription–translation reaction. The mineral oil can be removed
from the PCR sample if preferred, although this is not essential when using the
TnT ® T7Quick kit. This can be easily done by addition of 1 or 2 drops of
chloroform, vortexing, and spinning for 2 min in a microcentrifuge. Retain the
upper aqueous layer and transfer to a fresh tube. Proceed directly with the in vitro
transcription–translation or store the PCR samples at –20°C until required.
3.3. In Vitro Transcription and Translation
When performing the in vitro transcription and translation reaction, it is
important to maintain an Rnase-free environment. Use new, sterile plastic
microtubes and pipet tips; always wear clean, disposable latex gloves.
1. Remove a tube of TnT® T7 Quick master mix from the -70°C freezer. Thaw
rapidly by hand warming; then place on ice. The TnT® T7 Quick master mix
should always be kept on ice while the reactions are being set up and should be
returned to the –70°C freezer afterward to minimize the loss of activity.
98
Hardy
2. Place approx 250–500 ng of PCR product in a 0.5-mL microtube, if necessary,
make the volume up to 2 µL with nuclease-free H2O. Add 0.5 µL [35S]methionine
and 10 µL TnT® T7 Quick master mix to give a final volume of 12.5 µL (see
Note 14). Mix well by gently pipetting; avoid mixing too vigorously and causing
the mixture to foam, as this will reduce the activity of the lysate. When testing a
number of PCR templates, it is more convenient to prepare a master mix containing the appropriate volumes of [35S]methionine and TnT® T7 Quick kit. The number of pipetting steps is reduced by dispensing the master mix directly to tubes
containing the PCR products. To monitor the efficiency of the in vitro transcription–translation, it is useful to include a reaction containing 250 ng of the T7
Luciferase control DNA that is supplied with the TnT® T7 Quick kit. The control
DNA translation product is an intensely labeled 61-kDa protein. This provides a
useful way of monitoring the activity of the kit, particularly after prolonged periods of storage, and provides an additional size marker for SDS-PAGE. Include a
control reaction without any PCR product to monitor the background incorporation of labeled amino acid. If possible, include a positive control (i.e., a PCR
product with a characterized translation-terminating mutation).
3. Incubate at 30°C for 90 min (see Note 15). Store at –20°C until required or proceed with the SDS-PAGE immediately.
3.4. SDS-PAGE and Autoradiography
1. When the in vitro transcription–translation reaction is complete, transfer 5 µL to
a fresh tube containing 45 µL SDS-PAGE sample loading buffer. Heat at 100°C
for 2 min to denature the protein; then centrifuge briefly. Store the remainder of
the reaction at –20°C.
2. Ensure that the gel electrophoresis apparatus is clean and dry. Assemble the glass
plates and spacers in between the side clamps. Ensure that the spacers and the
glass plates are flush at the bottom end. Position the clamped plates into the gel
pouring stand.
3. Prepare two 12% resolving gels (see Note 16), mixing 3.3 mL H2O, 4.0 mL of
30% acrylamide solution, 2.5 mL of 1.5 M Tris buffer (pH 8.8), and 100 µL
of 10% SDS in a 15-mL disposable plastic tube. Add 4 µL TEMED and 100 µL
of 10% ammonium persulfate. Mix by inversion and pour approx 3 mL into
each of the gel molds. Tap the glass plate to dislodge any air bubbles as they
form. To ensure that the top of the gel sets with a straight edge, overlay the gel
with 0.1% SDS solution. Leave the gel to polymerise for about 1 h.
4. When the gel is fully polymerized, pour off the 0.1% SDS solution and rinse the
top of the gel with distilled H2O. Drain away as much water as possible and soak
up the remainder using a piece of Whatman 3MM paper.
5. Prepare two 5% stacking gels by mixing 2.77 mL H2O, 0.83 mL of 30% acrylamide solution, 1.26 mL of 0.5 M Tris buffer (pH 6.8), and 50 µL of 10% SDS in
a 15-mL disposable plastic tube. Add 5 µL TEMED and 50 µL of 10% ammonium
persulfate. Mix by inversion and pour on top of the resolving gel, fill the gel mold
Protein Truncation Test
6.
7.
8.
9.
10.
11.
12.
99
up to the level of the small glass plate. Insert the comb so that there is a depth of
1 cm between the bottom of each well and the top of the resolving gel. Leave the
gel to polymerize for at least 30 min.
When the stacking gel is polymerized, carefully remove the comb. Remove the
clamped glass plates from the pouring stand and clip in to the central cooling core.
Place the central core within the electrophoresis chamber. Place approx 100 mL of
1X Tris-glycine running buffer in the upper buffer chamber and approx 200 mL in
the lower buffer chamber. Flush out the wells with 1X running buffer.
Gently load 10–15 µL of each sample into the bottom of each well using a fine
gel loading tip. Load only 5 µL of the Luciferase control reaction. Mix 3.5 µL of
the Rainbow colored protein molecular-weight marker with an equal volume of
SDS-PAGE sample loading buffer. Load the marker directly into one of the lanes
of the gel, there is no need to heat denature the size marker.
Perform electrophoresis at a constant voltage of 200 V for a period of 45 – 60 min,
or until the bromophenol dye has reached the bottom of the gel.
When electrophoresis is complete, dismantle the apparatus and carefully separate the glass plates containing the gel. Remove the stacking gel (the gel will be
radioactive and should be disposed of in the appropriate way) and cut off a small
piece of one corner, for orientation purposes.
Place the gel in a plastic box containing approx 200 – 300 mL of fix solution.
Leave for 20–30 min with gentle shaking.
Pour off the fix solution, the solution will be radioactive and should be disposed
of appropriately. Place the gel on a piece of 3MM paper that is just slightly larger
than the gel. Cover the gel and 3MM paper completely with Saran Wrap and dry
on a vacuum gel drier at 60°C for approx 1 h. Do not release the vacuum until the
gel is completely dried; premature release of the vacuum will cause the gel to
crack. The 1-mm thickness of the gel should be reduced to a negligible thickness
when the gel is completely dry. Remove the gel from the drier and discard the
Saran Wrap. Tape the gel inside an X-ray film cassette; and perform autoradiography overnight at room temperature (see Note 17).
Develop the X-ray film and align the film over the gel. Mark the position of the
Rainbow colored protein molecular-weight markers on to the film with a permanent marker pen. The size of any truncated proteins can be estimated from a
graph of log10 of the mass of the size standards plotted against electrophoretic
mobility. A shorter or longer exposure time may be required, depending on the
level of [35S]methionine incorporation.
3.5. Interpretation
1. The presence of a translation-terminating mutation within the PCR-amplified
fragment is indicated by the presence of a protein of lower molecular weight than
the full-length protein (see Figs. 1 and 2). The size of the truncated protein, estimated by comparison with protein molecular-weight markers or with the truncated protein of a characterized mutation, indicates the position of the premature
100
Hardy
stop codon. The position of a nonsense mutation can be determined quite accurately; whereas a frameshift mutation may be located some distance upstream
from the site of the premature stop codon. Another mutation detection method,
such as SSCP or heteroduplex analysis, can be used to locate the mutation more
precisely and confirm the presence of the mutation in genomic DNA. Sequencing
of genomic DNA should be used to definitively characterize the mutation.
2. Other labeled polypeptides, in addition to the full-length protein and any truncated protein, are often observed on the autoradiograph (see Figs. 1 and 2). These
nonspecific proteins are usually weakly labeled and easily distinguishable from
true truncated proteins. These extra bands often arise from protein translation
initiated from internal methionine codons and do not usually affect the overall
result. Occasionally, these internally initiated proteins may be quite intensely
labeled and may be wrongly identified as truncated proteins. The addition of
magnesium chloride to a final concentration of 1.5 mM in the in vitro transcription–translation reaction is reported to reduce nonspecific bands that result from
initiation at internal methionine codons (6). Translation of mRNA transcripts
from the reticulocyte lysate is another cause of nonspecific protein bands appearing in all of the lanes of the gel, including the “no DNA” control. In the case of
the PTT for the BRCA1 gene, the presence of nonspecific translated proteins has
been shown to be both sequence dependent and to vary with the type of in vitro
translation system being used (10). One of the PCR fragments tested was found
to be more efficiently translated, with fewer nonspecific protein bands, when
wheat-germ extract was used compared with a rabbit reticulocyte-based translation system (10). The inclusion of a myc reporter tag (see Note 8) in the translated protein provides a means of eliminating these nonspecific protein bands
(3). Immunopreciptitaion can be used to isolate radiolabeled proteins containing
the myc reporter tag. Hence, only proteins initiated from the methionine start site
are identified (3). Alternatively, nonradioactive PTT can be performed (see Note
8), with the myc reporter tag providing a means of identifying the translated proteins using Western blot methodology (3).
3. An additional RT-PCR product, observed by agarose gel electrophoresis, suggests the presence of a splice site mutation. However, the presence of smaller,
nonspecific PCR products in samples from both affected individuals and normal
controls is frequently observed when performing nested RT-PCR from low-level
mRNA transcripts and may lead to a false-positive result by PTT (11,20,21). The
presence of additional RT-PCR products has been correlated with the quality of
the RNA preparation and is often simply a nonreproducible PCR artifact that can
sometimes be eliminated by adjustment of the conditions for cDNA preparation
and optimization of the PCR conditions (11,20). The presence of alternative
mRNA transcripts can also lead to a false-positive result and has been described
in PTT for the hMLH1 gene in hereditary nonpolyposis colorectal cancer
(HNPCC) (14). Alternative transcripts resulted in the identification of truncated
proteins in many samples from both affected individuals and normal controls.
The alternative transcripts were found to be more common in RNA samples
Protein Truncation Test
101
obtained from lymphocyte blood samples compared with RNA samples from
lymphoblastoid cell lines. These alternative transcripts were often found to have
a deletion of one or more exons. However, sequencing of genomic DNA failed to
identify any splice site defects involving these exons, indicating that the unusual
transcripts were unrelated to the HNPCC (14). Thus, PCR artifacts and alternative transcripts can make the identification of translation-terminating mutations
and splice site mutations complicated. However, translation-terminating mutations and splice site mutations should give a consistently reproducible result and
can be confirmed by sequencing of genomic DNA.
4. For samples that show only the full-length translation product and no truncated
protein, a number of possibilities must be considered. The most obvious explanation is that no translation-terminating mutation is present. However, a number of
other explanations must be considered, as there are certain situations when PTT
will fail to identify a truncating mutation. Truncating mutations that occur at the
extreme 5' and 3' ends of the gene are not easily identified by PTT (22). A truncating mutation close to the 5' end may result in a truncated protein that is too
small to be seen by SDS-PAGE. A mutation close to the 3' end of the gene may
result in a truncated protein that is not significantly different in size from the fulllength protein, which cannot be resolved by SDS-PAGE (22). As it is not possible to design overlapping PCR segments for these regions, another mutation
detection method, such as SSCP or direct sequencing, should be used to screen
the extreme 5' and 3' ends of the segment in question (22). Mutations that alter
primer binding sites may not be detected because of failure to amplify the mutated
allele; although this should not present a problem when the gene is amplified in
several overlapping fragments. Deletion, insertion, or duplication of several
kilobases or a translocation with a break point within the gene will result in failure
to amplify the mutant allele (22). Consequently, these abnormalities cannot be
detected by PTT. A mutation in the promotor or 3' untranslated region that
reduces the level of mRNA will not be detected by PTT. Small in-frame deletions
or insertions, which cause only a small change to the size of the mutant protein,
may not be resolved by SDS-PAGE (22). A mutation that causes instability of the
mRNA may result in failure to identify a mutation by PTT when RT-PCR is used.
The instability of mutant mRNA transcripts with in-frame stop codon mutations
is a recognized phenomenon that is often cited as a cause of false-negative results
for PTT. For example, PTT analysis of the PAX6 gene, following RT-PCR, was found
to be less sensitive than expected (21). PTT failed to identify truncated proteins
in a number of samples with characterized mutations, because of low levels (or,
in some cases, the complete absence) of the mutant mRNA (21). Similarly,
Whittock et al. (6) postulated that the instability of mutant mRNA resulted in the
failure to identify a characterized truncating mutation in an obligate female DMD
carrier. In contrast, Lui et al. identified truncating mutations in the hMSH2 gene
by PTT, even though the mutant mRNA transcripts were shown to be less abundant than the normal transcript because of nonsense mediated mRNA instability
(15). Samples that show no evidence of a translation-terminating mutation by
102
Hardy
PTT should be investigated by another mutation detection method, such as SSCP
or denaturing gradient gel electrophoresis (DGGE), to exclude the possibility of a
false-negative result and to investigate the pathogenic role of missense mutations.
4. Notes
1. Total cellular RNA can be isolated using a variety of well-established methods
and a number of kits can be purchased for this purpose. The RNeasy total RNA
kit (Qiagen Ltd.) is reliable and very easy to use. Using the spin columns supplied with the kit, RNA can be rapidly isolated from a wide variety of tissues
with minimum preparation and without the use of organic solvents. The TRIzol
reagent (Invitrogen Life Technologies Ltd.) offers another reliable method for
isolating RNA. Whatever method is chosen to prepare RNA, the integrity and
yield should be assessed by agarose gel electrophoresis (see Chapter 1).
2. Oligo-d(T) primer (23), or a gene-specific primer complimentary to the 3' end of
the sense strand can also be used to prime the first-strand synthesis of cDNA (5,6).
3. Taq Extender™ PCR additive improves the efficiency of standard Taq DNA polymerase by increasing the number of extension reactions that go to completion by
improved proof reading activity. It increases the yield of PCR product and can
improve the amplification of long and difficult PCR templates. Optimized 10X
Taq Extender™ reaction buffer is used instead of 10X Taq DNA polymerase
reaction buffer.
4. Sequence-specific primers should be chosen to amplify a segment of between
1 and 2 kb. It is possible to amplify larger segments, although this is technically
more difficult. The length of the gene-specific primer sequences should be about
18 – 25 bases. A number of computer programs (e.g., PRIMER) are available that
can be a useful aid in designing gene-specific primer pairs. For large genes, PTT
is more sensitive when the coding sequence is amplified in a number of overlapping segments. In most published methods the overlap is 300 – 500 bp, although
overlaps of 750 bp have been reported to further improve the sensitivity of PTT
(11). Overlapping the PCR segments will maximize the chances of detecting all
truncating mutations. A mutation occurring near the end of segment 1 is likely to
result in a truncated peptide that is only fractionally shorter than the full-length
product. Hence, the two proteins may not be easily resolved by SDS-PAGE.
However, if segment 2 overlaps with segment 1 by 300–500 bp, then a mutation
near the end of segment 1 will also occur near the start of segment 2. The smaller
truncated protein should be easily identified by SDS-PAGE. The forward primer
must have an extension at the 5' end, containing the sequence motifs that are
essential for in vitro transcription and translation. Essentially, most PTT primers
are of a similar design with minor variations. Some examples of the 5' modifications that are used in PTT are shown in Table 1. The extreme 5' end of the forward primer may include a restriction enzyme recognition site, often BamH1,
which can be useful for cloning the PCR product into a plasmid vector (22). The
addition of a restriction enzyme site is not essential for the success of the PTT
and may be replaced by any 2 or 3 bases. These are followed directly by the
Protein Truncation Test
5.
6.
7.
8.
103
bacteriophage T7 promoter sequence required for RNA synthesis. Alternatively,
the T3 or SP6 promoter may be used, in which cases an in vitro transcription–
translation system designed for use with these promoters must be used (see Note 7).
The promoter sequence is followed by a small spacer sequence of 2 – 5 bp. The
spacer is followed by the eukaryotic translation initiation sequence, the in-frame
ATG translation start site, and the gene-specific sequence. It is most important to
ensure that the ATG codon and the gene-specific sequence are in frame; otherwise, an incorrect translation product will be obtained and the results of the PTT
will be meaningless. The forward primer sequence should be positioned in a
region that contains at least one or, preferably, more, codons for the labeled amino
acid (22) (see Note 8). The reverse primer may be modified at the 5' end so that a
stop codon is incorporated at the 3' end of the PCR product. This is said to
improve the efficiency of the translation reaction by preventing the ribosomes
from stalling at the end of the PCR segment (TnT ® T7 Quick kit user manual),
although, in practice, this modification does not seem to be essential for the
success of PTT.
Taq DNA polymerase is available from a variety of suppliers of molecular-biology reagents. Taq DNA polymerase supplied by Invitrogen Life Technologies
Ltd. gives consistently good results. It is supplied with 10X Taq DNA polymerase
buffer, a separate vial of 50 mM MgCl2, and 1% W1 reagent. Added to PCRs at a
final concentration of 0.05%, the W1 reagent acts to stabilize the Taq DNA polymerase and improve the yield of the PCR product.
A number of methods have been described for the isolation of genomic DNA and
a variety of commercially available kits can be obtained for this purpose. Any
method that gives good quality, high-molecular-weight DNA should be adequate
for PCR amplification for PTT. The phenol/chloroform method, Nucleon II kit
(Scotlabs Ltd.), and the Puregene DNA isolation kit (Gentra Systems) are all
reliable methods of extracting DNA suitable for PCR amplification prior to PTT.
The TnT® T7 Quick coupled transcription–translation system is recommended
because it is very straightforward to use. The TnT® T7 Quick master mix contains
all the components required for in vitro transcription–translation; hence, few
pipetting steps are involved. One limitation of the TnT® T7 Quick kit is that it can
only be used in conjunction with T7 promoters, and [35S]methionine is the only
labeled amino acid that can be used. If it is necessary to use a different radiolabeled
amino acid the TnT® T7 coupled reticulocyte lysate or wheat-germ extract transcription–translation systems may be used (Promega Ltd.). These are supplied with
three separate amino acid mixtures—one for use with [35S]methionine, one for
[35S]cysteine, and one for [3H]leucine. These systems are also available with different RNA polymerases to allow the use of T7, T3, or SP6 promoters.
The choice of radiolabeled amino acid for detection of the translation products
should be determined from the amino acid composition of the gene product under
investigation. Ideally, the labeled amino acid should occur frequently within the
protein, particularly near the start of each translated segment. Truncating mutations near the start of each segment will not be identified if they do not contain
104
Hardy
any labeled amino acid, and this should be taken into consideration when
designing PCR primers. Practically, the choice of labeled amino acid is limited
by the configuration of the in vitro transcription–translation kits and the availability of labeled amino acids. Most published PTT methods use
[35 S]methionine, [35S] cysteine and [3H] leucine are the two other alternatives.
Nonradioactive methods have been described that involve the incorporation of
biotinylated lysine, with the additional steps of electroblotting of the SDSPAGE gel and detection of the proteins by chemiluminescence (4). Commercially available kits for nonradioactive PTT are the Transcend™ nonradioactive
translation detection system (Promega Ltd.), and the protein truncation test,
nonradioactive kit (Boehringer Mannheim). An alternative nonradioactive
method for detecting the products of the in vitro transcription–translation reaction involves the incorporation of a myc reporter tag into the translated protein
(3). This is accomplished by the inclusion of 36 basepairs of the human c-myc
sequence in the forward primer sequence. The in-frame c-myc sequence is positioned directly between the ATG start site and the in-frame gene-specific primer
sequence. The presence of the myc epitope in the translated protein allows nonradioactive detection of the translated proteins using an anti-myc monoclonal
antibody and enhanced chemiluminescence technology (3). PCR amplification
of the template is performed in the usual way, using a T7 modified forward
primer that also contains the myc tag reporter sequence. Nonradioactive in vitro
transcription–translation is performed using the TnT® T7 coupled wheat-germ
extract system. In vitro transcription–translation systems that contain rabbit
reticulocyte lysate cannot be used because the antibodies used for the detection
of the myc tag crossreact with the proteins in the reticulocyte lysate. The translated proteins are separated by SDS-PAGE and elec-troblotted onto a hybridization membrane. Detection of the proteins is accomplished by hybridization
with an anti-myc monoclonal antibody, followed by a rabbit anti-mouse antibody, and, finally, with a horseradish peroxidase conjugated swine anti-rabbit
antibody. The translation products are visualized by enhanced chemiluminescence. The main advantage of myc tag PTT is that only proteins that contain the
myc epitope are detected. This greatly reduces the number of protein bands that
are seen and simplifies the identification of truncated proteins. The advantages
of these nonradioactive PTT methods are that there is no handling of radioactive isotopes, chemiluminescence detection methods are sensitive and often quicker
than autoradiography, and the translated proteins can be stored indefinitely.
9. The Mini-Protean II electrophoresis cell is a convenient format for the separation
of translated proteins in PTT. Two gels 7 cm in length and 8 cm in width, each
with 10 or 15 lanes, can be run simultaneously in under 1 h. Any similar gel
system can used (e.g., the Hoefer “Mighty Small” electrophoresis cell [SE245] is
of a similar design to the Mini-Protean II model). Some laboratories prefer to use
larger-format gels for the separation of PTT translation products. The Protean II
electrophoresis cell (Bio-Rad Laboratories Ltd.) is an alternative for those who
wish to run longer gels. Up to four gels of 16 × 16 cm, or 16 × 20 cm can be run
Protein Truncation Test
10.
11.
12.
13.
14.
15.
105
simultaneously to separate between 60 and 100 samples. Using the Protean II
system, electrophoresis is performed over a period of 16 h at 30 mA.
The Rainbow™ colored protein molecular-weight markers provide a less
expensive alternative to 14 C-radiolabeled protein molecular-weight standards.
The Kaleidoscope prestained SDS-PAGE standards are a similar product (BioRad Laboratories Ltd.). The main disadvantage of using the nonradioactive molecular-weight standards is that the position of the protein standards must be
marked on to the X-ray film, after the film has been developed, by aligning the
film with the gel. Hence, the molecular weight of the truncated proteins calculated in this way may be slightly inaccurate. The Rainbow™ colored protein
molecular weight markers are also available labeled with a 14 C label
(Amersham Life Sciences).
In optimizing the RT-PCR, it may be necessary to adjust the amounts of cDNA
and primers added to the first round of amplification. To establish the optimal
MgCl2 concentration for specific amplification, it is necessary to perform a MgCl2
titration. The efficiency of amplification by Taq DNA polymerase and the composition of 10X reaction buffer from different suppliers may vary. In establishing
optimal amplification conditions, it may be useful to try different types of Taq
DNA polymerases and buffers to see which gives the best result. Amplification
of templates with a strong secondary structure can sometimes be improved by the
addition of dimethyl sulfoxide to a final concentration of 5–10%.
Performing “hot-start” PCR reduces mispriming and thus increases the specificity of the amplification.
The melting temperature ™ of the PCR primers can be calculated using a variety
of formulas (e.g., 4[G+C] + 2[A+T]), the PCR annealing temperature is usually
taken as 5°C below the Tm. In practice, the optimal annealing temperature is best
determined empirically. The duration of the 72°C extension step is determined
by the length of the fragment to be amplified. Allowing 1 min for each kilobase
to be amplified should be sufficient time for the extension reactions to be completed. The number of cycles can be decreased if the amplification efficiency is
good. The use of thin-walled PCR tubes allows the duration of the 94°C denaturing step and the annealing step to be reduced considerably, thus minimizing the
loss of activity of the Taq DNA polymerase and reducing the time in which
misannealing of primers can occur.
The volumes given here for performing the in vitro transcription–translation
are actually one-quarter of those recommended in the TnT ® Quick kit protocol.
Between 0.25 and 1 µL [ 35S]methionine can be added to the reaction. For templates that translate well, the minimum volume of [35S]methionine can be used.
For templates that contain few methionine residues or translate less efficiently,
the volume may be increased. If it is necessary to use more than 2 µL of PCR
product, the volumes of reaction components can be scaled up.
Incubation at 22°C for 90 min has been reported to improve the efficiency of
transcription and translation in PTT analysis of the BRCA1, BRCA2, NF1, and
APC genes using the Promega TnT/T7 coupled reticulocyte lysate system (24).
106
Hardy
16. A 12% SDS-PAGE gel is suitable for separating proteins in the range of approx
14 –100 kDa. The volumes of reagents given in this method to prepare a 12%
SDS-PAGE gel are adapted from Sambrook et al. (25), which also gives the volumes of reagents required to prepare gels of 6%, 8%, 10%, and 15% concentration. Separating the translation products on several gels of different percentages
(e.g., 8%, 10%, and 14% gels) (21) can increase the likelihood of detecting the
larger and smaller truncated proteins. The use of 5–18% gradient SDS-PAGE
has been reported to give better resolution for a broad size range of truncated
proteins (11).
17. The signal strength may be increased by treatment of the gel with Amplify™
fluorographic enhancement reagent (Amersham Life Science) for 20 – 30 min
after the gel has been fixed. The gel is then rinsed in distilled water and dried
under vacuum. Fluorography is performed with intensifying screens overnight at
–70°C. Some loss in resolution may be observed following fluorographic enhancement. Fluorographic enhancement is unnecessary if a strong signal can be obtained
by autoradiography.
Acknowledgments
I would like to thank all my colleagues for many helpful discussions on
PTT, in particular Dr. David Bourn for his advice and comments during preparation of the manuscript and Kim Hampson for providing the BRCA1 autorad
and information used in the preparation of Fig. 1. I would also like to thank
Professor Georgia Chenevix-Trench and Dr Sue Shanley, of the Queensland
Institute of Medical Research, Brisbane, Australia, for the primer sequences
used for PTT of the PTCH gene illustrated in Fig. 2.
References
1. Roest, P. A. M., Roberts, R. G., Sugino, S., van Ommen, G-J. B., and den Dunnen,
J. T. (1993) Protein truncation test (PTT) for rapid detection of translation-terminating mutations. Hum. Mol. Genet. 2, 1719–1721.
2. Powell, S. M., Petersen, G. M., Krush, A. J., Booker, S., Jen, J., Giardiello, F. M.,
et al. (1993) Molecular diagnosis of familial adenomatous polyposis. N. Engl. J.
Med. 329, 1982–1987.
3. Rowan, A. J. and Bodmer, W. F. (1997) Introduction of a myc reporter tag to
improve the quality of mutation detection using the protein truncation test. Hum.
Mutat. 9, 172–176.
4. Becker, K.-F., Reich, U., Handschuh, G., Dalke, C., and Höfler, H. (1996) Nonradioactive protein truncation test (nrPTT) for rapid detection of gene mutations.
Trends Genet. 12, 250.
5. Gardner, R. J., Bobrow, M., and Roberts, R. G. (1995) The identification of point
mutations in Duchenne muscular dystrophy by using reverse-transcription PCR
and the protein truncation test. Am. J. Hum. Genet. 57, 311–320.
Protein Truncation Test
107
6. Whittock, N. V., Roberts, R. G., Mathew, C. G., and Abbs, S. J. (1997) Dystrophin
point mutation screening using a multiplexed protein truncation test. Genet. Test.
1, 115 –123.
7. van der Luijt, R., Khan, P. M., Vasen, H., Van Leeuwen, C., Tops, C., Roest, P., et al.
(1994) Rapid detection of translation-terminating mutations at the adenomatous
polyposis coli (APC) gene by direct protein truncation test. Genomics 20, 1– 4.
8. Prosser, J., Condie, A., Wright, M., Horn, J. M., Fantes, J. A., Wyllie, A. H., et al.
(1994) APC mutation analysis by chemical cleavage of mismatch and a protein
truncation assay in familial adenomatous polyposis. Br. J. Cancer 70, 841–846.
9. Hogervorst, F. B. L., Cornelis, R. S., Bout, M., van Vliet, M., Oosterwijk, J. C.,
Olmer, R., et al. (1995) Rapid detection of BRCA1 mutations by the protein truncation test. Nature Genetics 10, 208–212.
10. Plummer, S. J., Anton-Culver, H., Webster, L., Noble, B., Liao, S., Kennedy, A.,
et al. (1995) Detection of BRCA1 mutations by the protein truncation test. Hum.
Mol. Genet. 4, 1989–1991.
11. Garvin, A. M. (1998) A complete protein truncation test for BRCA1 and BRCA2.
Eur. J. Hum. Genet. 6, 226–234.
12. Garvin, A. M., Attenhofer-Haner, M., and Scott, R.J. (1997) BRCA1 and BRCA2
mutation analysis in 86 early onset breast/ovarian cancer patients. J. Med. Genet.
34, 990 –995.
13. Friedman, L. S., Gayther, S. A., Kurosaki, T., Gordon, D., Noble, B., Casey, G., et al.
(1997) Mutation analysis of BRCA1 and BRCA2 in a male breast cancer population. Am. J. Hum. Genet. 60, 313 –319.
14. Kohonen-Corish, M., Ross, V. L., Doe, W. F., Kool, D. A., Edkins, E., Faragher,
I., et al. (1996) RNA-based mutation screening in hereditary nonpolyposis
colorectal cancer. Am. J. Hum. Genet. 59, 818 –824.
15. Lui, B., Parsons, R. E., Hamilton, S. R., Petersen, G. M., Lynch, H. T., Watson,
P., et al. (1994) hMSH2 mutations in hereditary nonpolyposis colorectal cancer
kindreds. Cancer Res. 54, 4590 – 4594.
16. Romey, M.-C., Tuffery, S., Desgeorges, M., Bienvenu, T., Demaille, J., and
Clautres, M. (1996) Transcript analysis of CFTR frameshift mutations in lymphocytes using the reverse transcription-polymerase chain reaction and the protein
truncation test. Hum. Genet. 98, 328 – 332.
17. Heim, R. A., Kam-Morgan, L. N. W., Binnie, C. G., Corns, D. D., Cayouette, M.
C, Farber, R. A., et al. (1995) Distribution of 13 truncating mutations in the neurofibromatosis 1 gene. Hum. Mol. Genet. 4, 975 – 981.
18. van Bakel, I., Sepp, T., Ward, S., Yates, J. R. W., and Green, A. J. (1997) Mutations in the TSC2 gene: analysis of the complete coding sequence using the protein truncation test (PTT). Hum. Mol. Genet. 6, 1409–1414.
19. Peral, B., Gamble, V., Strong, C., Ong, A. C. M., Sloane-Stanley, J., Zerres, K.,
et al. (1997) Identification of mutations in the duplicated region of the polycystic
kidney disease 1 gene (PKD1) by a novel approach. Am. J. Hum. Genet. 60,
1399 – 1410.
108
Hardy
20. Fitzgerald, M. G., Bean, J. M., Hegde, S. R., Unsal, H., MacDonald, D. J.,
Harkin, D. P., et al. (1997) Heterozygous ATM mutations do not contribute to
early onset of breast cancer. Nature Genet. 15, 307– 310.
21. Axton, R., Hanson, I., Danes, S., Sellar, G., van Heyningen, V., and Prosser, J.
(1997) The incidence of PAX6 mutation in patients with simple aniridia: an evaluation of mutation detection in 12 cases. J. Med. Genet. 34, 279 – 286.
22. Hogervorst, F. B. L. (1998) Protein truncation test (PTT). Promega Notes 62, 7–10.
23. Lo Ten Foe, J. R., Rooimans, M. A., Bosnoyan-Collins, L., Alon, N., Wijker, M.,
Parker, L., et al. (1996) Expression cloning of a cDNA for the major fanconi
anaemia gene FAA. Nature Genet. 14, 320 – 323
24. Claes, K., Macháckova, E., Callens, T., Van der Cruyssen, G., and Messiaen, L.
(1998) Improved conditions for PTT analysis of the BRCA1, BRCA2, NF1 and
APC genes. Elsevier Trends Journals Technical Tips Online, T01457, 22/7/98.
Available from: URL: http://www.elsevier.com/homepage/sab/tto/menu.htm
25. Sambrook, J., Fritsch, E. F., and Maniatis, T. (1989) Molecular Cloning: A Laboratory Manual, 2nd ed., Cold Spring Harbor Laboratory, Cold Spring Harbor, NY.
Mutation Detection in Factor VIII
109
13
Mutation Detection in Factor VIII cDNA from
Lymphocytes of Hemophilia A Patients by Solid
Phase Fluorescent Chemical Cleavage of Mismatch
Naushin H. Waseem, Richard Bagnall,
Peter M. Green, and Francesco Giannelli
1. Introduction
Defects of the factor VIII gene causes (f8) hemophilia A, an hemorrhagic
X-linked disorder. The factor VIII gene is 186 kb long with 26 exons, varying
from 69 bp (exon 5) to 3106 bp (exon 14) (1). The factor VIII mRNA is 9028
bases in length with a coding region of 7053 nucleotides (2).
Hemophilia A mutations in factor VIII genes are quite heterogeneous and
various methods have been used for the detection of these mutations. The most
widely used are:
1. Denaturing gradient gel electrophoresis (DGGE): This is based on the ability of
mutations to reduce the melting temperature of DNA domains resulting in altered
mobility on a formamide and urea gradient polyacrylamide gel. This method can
detect any sequence change but requires 41 PCR to amplify the 26 exons of factor
VIII gene and the putative promoter region. The maximum length of the suitable
PCR product is 600–700 bp and the product must have appropriate melting domain
structure. Some splicing signal region were not screened by this procedure (3).
2. Single strand conformation polymorphism (SSCP): This method is based on the
fact that single stranded DNAs differing in a single nucleotide will acquire different conformations that have different mobilities on a polyacrylamide gel. Various exons of factor VIII are amplified using polymerase chain reaction (PCR)
and subjected to electrophoresis. The exon showing an altered electrophoretic
mobility is then sequenced (4). The PCR products must be between 100–300 bp
for efficient screening.
From: Methods in Molecular Biology, vol. 187: PCR Mutation Detection Protocols
Edited by: B. D. M. Theophilus and R. Rapley © Humana Press Inc., Totowa, NJ
109
110
Waseem et al.
3. Denaturing high performance liquid chromatography (DHPLC): This new technique for mutation detection has recently been used to scan factor VIII mutations
(5). The exons from a normal DNA is hybridized to the corresponding exon from
a hemophilia A patient and the resulting heteroduplexes are analyzed on a partially denaturing HPLC column. This method requires 33 amplifications and the
detection rate is 70% (5).
In the above procedures, the PCR products containing the mutation is identified but the position of the mutation is not determined.
4. Chemical cleavage of mismatch: In order to develop a rapid and fully effective
procedure for the detection of hemophilia A mutations the method of chemical
cleavage of mismatch (CCM) is combined with analysis of the traces of factor
VIII mRNA present in peripheral blood lymphocytes. The method of CCM has
the advantage that it detects any sequence change even in long DNA segments
(1.5–1.8 kb) and indicates the position of mismatch within the segment. Hence,
entire mRNA can be screened in few overlapping segments. The mRNA analysis
offers a chance of detecting mutations occurring in any region of the gene, including internal region of the long introns by virtue of their effect on the structure of
the mRNA, thus allowing a gain not only in the speed but also in the completeness of mutation detection. A further advantage of mRNA analysis is that it provides direct evidence of the effect gene mutation may have on the structure of the
gene transcript. In the basic procedure, the factor VIII message and appropriate
segments of a patient gene are specifically amplified and compared with similar
products amplified from control RNA. The patient and control PCR products are
then hybridized to form a hetroduplex and treated with hydroxylamine and/or
osmium tetroxide, which modify C or T residues, respectively. The DNA is then
cleaved with piperidine at the modified base and analyzed on a denaturing polyacrylamide gel. From the size of the cleavage fragments, the position of the mutation is estimated and the relevant exons sequenced (6,7). To aid the visualization
of DNA on the acrylamide gel the DNA is either radioactively or fluorescently
labelled. This chapter describes the methods used in the detection of mutations
by solid phase fluorescent chemical cleavage of mismatch (SPFCCM).
The factor VIII message, except the large exon 14, is reverse transcribed
with AMV reverse transcriptase and amplified with Tfl DNA polymerase into
four overlapping segments (Fig. 1). Exon 14 is amplified from genomic DNA
as two additional segments so that the entire coding region is represented in six
overlapping segments. The promoter region (segment P) and the polyadenylation signal region (segment T) are also amplified from the genomic DNA.
The promoter region overlaps with segment 1 (Fig. 1). The promoter region
and polyadenylation signal regions are sequenced directly whereas the rest of
the segments are processed through SPFCCM. Three different fluorescent
labeled dUTPs are used to label the segments: segment 1 and 2 with green,
segment 3 and 4 with blue and segment 5 and 6 with yellow fluorescence.
Similar segments are amplified from either control RNA or cloned factor VIII
Mutation Detection in Factor VIII
111
Fig. 1. Schematic diagram of factor VIII cDNA showing the positions segment 1–8.
Open bars represent primary PCR whereas filled bars are nested PCR. Segment 3, 4,
promoter region (P) and polyadenylation signal region (T) are amplified from DNA.
cDNA using biotinylated primers and fluorescent dUTPs. The patient and the
control products are then hybridized to form heteroduplexes in two multiplex
reactions. The heteroduplexes are then captured on streptavidin coated magnetic beads and treated with hydroxylamine and osmium tetroxide followed by
treatment with piperidine (Fig. 2). The products are analyzed on an ABI PRISM
377 DNA sequencer.
2. Materials
2.1. Lymphocyte Isolation
1. Histopaque-1077 is supplied by Sigma (cat. no. 1077-1).
2. Phosphate Buffered Saline (PBS): 10 mM potassium phosphate buffer, 138 mM
NaCl, 2.7 mM KCl, pH 7.4.
2.2. RNA Isolation
1. Various RNA isolation kits are available commercially. We used RNA Isolator
from Genosys (cat. no. RNA-ISO-050 ).
2. Isopropanol.
3. Chloroform.
2.3. DNA Isolation
1. Puregene DNA isolation kit (D-5500A) is purchased from Gentra Systems (USA).
2. Isopropanol.
112
Waseem et al.
Fig. 2. Diagrammatic representation of steps involved in the solid phase fluorescent chemical cleavage of mismatch method.
2.4. RT-PCR and PCR
1. Primers: The primers used for amplification are listed in Table 1. The four RTPCR fragments are labeled 1, 2, 5, and 6. The outer primers are called A and B
whereas the nested ones are given C and D as suffix. Segment 3, 4, P, and T are
amplified from DNA and therefore require only one pair of primers each. The
nested and the segment 3 and 4 primers are also synthesized with biotin at their 5'
end and are marked with an asterisk in the table. A working solution of primers at
100 ng/µL is kept at 4°C and primer stocks are kept at –20°C.
2. Access RT-PCR System (cat. no. A1250) is supplied by Promega, USA. The kit
is stored at –20°C.
Mutation Detection in Factor VIII
113
Table 1
Primers Used for the Amplication of Factor VIII cDNA
1A
1B
1C*
1D*
2A
2B
2C*
2D*
3A
3B
4A
4B
5A
5B
5C*
5D*
6A
6B
6C*
6D*
PA
PB
TA
TB
GGGAGCTAAAGATATTTTAGAGAAG
CAACAGTGTGTCTCCAACTTCCCCAT
GAGAAGATTAACCTTTTGCTTCTC
CCTACCAATCCGCTGAGGGCCATTG
GAAGAAGCGGAAGACTATGATGATG
GCCTAGTGCTACGGTGTCTTGAATTC
CTGATTCTGAAATGGATGTGGTCAGG
GGGAGAAGCTTCTTGGTTCAATGGC
AGAGTTCTGTGTCACTATTAAGACCC
TCTGAGGCAAAACTACATTCTCTTGG
CAAAGGACGTAGGACTCAAAGAGATGG
CACCAGAGTAAGAGTTTCAAGACAC
CTTCAG TCAGATCAAGAGGAAATTGAC
GAAGTCTGGCCAGCTTTGGGGCCCAC
TATGATGATACCATATCAGTTGAAATG
CTCTAATGTGTCCAGAAGCCATTCCC
TTCATTTCAGTGGACATGTG
CAGGAGGCTTCAAGGCAGTGTCTG
CAGTGGACATGTGTTCACTGTACGAA
TAGCACAAAGGTAGAAGGCAAGC
GGATGCTCTAGGACCTAGGC
AAGAAGCAGGTGGAGAGCTC
CAAATGTTCATGGAACTAGC
CTGTTCTCCTGGATTGAGGC
* The outer primers for seg 1, 2, 5, and 6 are given A and B as suffix,
whereas the nested ones are called C and D. The primers also synthesized with biotin at their 5' end are marked with an asterisk.
3. Fluorescent deoxynucleotides: Fluorescent deoxynucleotides for labeling the
PCR products can be obtained from Perkin-Elmer Applied Biosystems. [F]dUTP
set (cat. no. P/N 401894) contains 12 nmol of [TAMRA]dUTP, 3 nmol of
[R110]dUTP and 3 nmol of [R6G]dUTP. These are stored as 2 µL aliquots at
–20°C in the dark to avoid repeated freezing and thawing.
2.5. Solid Phase Fluorescent Chemical Cleavage of Mismatch
1. Hydroxylamine hydrochloride (Sigma, cat no. H 2391): A 4 M solution is prepared and titrated to pH 6.0 with diethylamine (Sigma, cat. no. D 3131). Since
very little hydroxylamine (20 µL/reaction ) is required for the reaction a rough
guide to prepare a 4 M solution, pH 6.0, is: weight (in mg) of hydroxylamine
divided by 0.28 gives the volume (in µL) of water to be added. This value times
0.2 to 0.3 gives the volume of diethylamine (in µL) to be added to the solution to
reach pH 6.0. The volume of diethylamine to be added varies from batch to batch
114
Waseem et al.
Table 2
Sequence of Primers Used in the Detection of Intron 22 Inversion
Primer
Sequence
P-INV
Q-INV
A-INV
B-INV
GCCCTGCCTGTCCATTACACTGATGACATTATGCTGAC
GGCCCTACAACCATTCTGCCTTTCACTTTCAGTGCAATA
CACAAGGGGGAAGAGTGTGAGGGTGTGGGATAAGAA
CCCCAAACTATAACCAGCACCTTGAACTTCCCCTCTCATA
2.
3.
4.
5.
6.
7.
8.
9.
and should be titrated for every batch. Hydroxylamine is highly toxic and should
be handled in fumehood and protective laboratory clothing should be worn.
Osmium tetroxide: A 4% solution can be obtained from Sigma (cat. no. O 0631).
A working solution of osmium tetroxide is 0.4% osmium tetroxide in 0.2% pyridine (Sigma, cat. no. P 3776). A fresh solution of osmium tetroxide should be
made each time it is required as it has a short half life. Fresh stock solution should
be purchased every 2 – 3 mo. Osmium tetroxide is very toxic and should be
handled in a fumehood. Protective laboratory clothing should be worn at all times
during handling.
Formamide loading dye: Deionized formamide containing 10 mg/mL dextran
blue. Formamide from Amresco and Sigma give no background fluorescence
when used as loading dye on ABI PRISM 377 DNA Sequencer.
Piperidine: A 1 M solution of piperidine (Sigma, cat. no. P 5881) is prepared in
formamide loading dye.
10X Hybridization buffer: 3 M NaCl in 1 M Tris-HCl, pH 8.0. This is stored at
room temperature.
2X Binding buffer: 2 M NaCl, 0.4% Tween 20, 0.1 mM EDTA , 10 mM Tris-HCl,
pH 8.0, stored at room temperature.
TE 8.0: 10 mM Tris-HCl, pH 8.0, containing 0.1 mM EDTA, autoclaved and
stored at room temperature.
6% Acrylamide/Bisacrylamide solution from Severn Biotech Ltd., UK, cat. no.
20-2700-10.
Streptavidin coated magnetic beads, Strep Magneshere Paramagnetic Particles,
from Promega, USA, cat. no. Z5481.
2.6. Fluorescent Dye Terminator DNA Sequencing
1. ABI PRISM™ DNA Sequencing kit, Big Dye Terminator Cycle Sequencing
Ready Reaction (cat. no. 4303152) is supplied by Perkin-Elmer Applied
Biosystems and is stored as 4 µL aliquots at –20°.
2. Absolute and 70% ethanol.
3. 3 M Sodium acetate, pH 4.6.
4. AutoMatrix 4.5 (cat. no. EC-854) from National Diagnostics (UK).
5. Sequence Navigator software from ABI.
Mutation Detection in Factor VIII
115
2.7. Detection of Intron 22 Inversions
1. Primers used for the detection of intron 22 inversion are shown in Table 2.
2. Expand Long Template PCR System (cat. no. 1681842) from Boehringer
Mannheim, Germany.
3. Deaza dGTP (cat. no. 988537) from Boehringer Mannheim, Germany.
3. Methods
3.1. Isolation of Lymphocytes
1. In a 50 mL polypropylene conical tube, add 10 mL of Histopaque 1077. Gradually overlay equal volume of EDTA anti-coagulated blood. This can be facilitated by tilting the centrifuge tube containing Histopaque so that the blood trickles
down the side of the tube. It is essential that Histopaque and the blood are at room
temperature (see Note 1).
2. Centrifuge at 400g at room temperature for 20 min.
3. Transfer the opaque layer of lymphocytes at the interface with a disposable plastic Pasteur pipet into a fresh 50 mL centrifuge tube and add 35 mL of phosphate
buffered saline. At this stage, divide the suspension equally between two tubes.
4. Centrifuge at 400g for 10 min at room temperature.
5. In one tube resuspend the pellet in 500 µL of RNA Isolator (Genosys) and store at
–70°C until further use. In the other tube add 600 µL of Cell Lysis Solution
(Gentra, USA) and store at 4°C for DNA isolation.
3.2. Isolation of DNA and RNA
There are a number of kits available for the isolation of RNA and DNA. We
use Puregene DNA isolation kit for DNA isolation and RNA Isolator (Genosys)
for RNA isolation.
3.2.1. Isolation of DNA
1. To the 600 µL cell lysate add 300 µL of Protein Precipitation Solution (supplied
with the kit). Mix 20 times and centrifuge at 16,000g for 10 min. The precipitated
protein forms a tight pellet at the bottom of the tube.
2. Transfer the supernatant into a fresh 2 mL microfuge tube and add 1 mL of 100%
isopropanol to it and mix by inverting several times.
3. Centrifuge at 16,000g for 10 min at room temperature.
4. Decant the supernatant and add 70% ethanol and repeat the centrifugation.
5. Air-dry the pellet for 5 min and resuspend in 500 µL of TE, pH 8.0.
3.2.2. Isolation of RNA
1. Thaw the cell lysate in RNA Isolator (Genosys). Add 100 µL chloroform and mix
gently 15 times and incubate for 15 min at room temperature.
2. Centrifuge at 16,000g for 15 min at room temperature.
116
Waseem et al.
3. Transfer the upper aqueous phase to a fresh 1.5 mL microfuge tube and add 250 µL
isopropanol. Mix and incubate for 10 min at room temperature.
4. Centrifuge at 16,000g for 10 min at room temperature. At this stage, RNA should
be visible as translucent pellet.
5. Wash pellet with 70% ethanol.
6. Air-dry the RNA pellet and dissolve it in RNA Hydration Solution (see Note 2).
3.3. RT-PCR
For reverse transcription and amplification of four out of the eight segment
from factor VIII mRNA, we use Access RT-PCR System. In this kit, the
reverse transcription by AMV reverse transcriptase and initial 10 cycles of
amplification by Tfl DNA polymerase is performed in a single tube (primary
PCR) (see Note 3). An aliquot is then amplified for another 30 cycles with
nested primers (secondary PCR). Two of the four segments (segment 1,5 and
2,6) are multiplexed in the primary PCR so in total we have two primary and
four secondary PCRs.
1. Add 5 µL 5X reaction buffer, 0.5µL 10 mM dNTP, 3.0 µL 25 mM MgSO4,
2.5 µL of 100 ng/µL primer 1A, 1B, 5A, 5B, 0.5 µL AMV reverse transcriptase,
0.5 µL Tfl DNA polymerase, 100 – 200 ng RNA. Make up the volume with
RNAse-free water to 25 µL. Set up a second RT-PCR substituting primer 1A, 1B,
5A, and 5B for 2A, 2B, 6A, and 6B.
2. Place the tubes in controlled temperature block equilibrated at 48°C and incubate
for 1 h and proceed immediately to thermal cycling reactions: 93°C for 30 s,
65°C for 30 s, 68°C for 5 min for 10 cycles.
3. To set up secondary PCR, add 2.5 µL of 10X Tfl buffer, 0.5 µL of 10 mM dNTP,
1.0 µL of 25 mM MgSO4, 2.5 µL of 100 ng/µL primer XC & XD (x is the segment
number), 0.5 µL Tfl I, 0.4 µL [F]dUTP, 14.5 µL water, 2.5 µL of primary PCR.
This reaction mix is also used for the amplification of segment 3 and 4 from DNA
(see Note 4).
4. Set up the cycling conditions as follows: 94°C for 5 min and 30 cycles of 93°C
for 30 s, 65°C for 30 s, 72°C for 3 min.
5. For amplification from control RNA or cloned factor VIII cDNA (referred to as
probe from now on) use the same recipe except use biotinylated primers. The
products should be gel purified before using in the solid phase fluorescent chemical cleavage of mismatch (see Note 5).
3.4. Solid Phase Fluorescent Chemical Cleavage of Mismatch
3.4.1. Preparation of Hybrids
1. Set up the hybridization as follows: 3 µL 10X hybridization buffer, 30 ng each of
the probe 1, 3 and 6 (the other multiplex will be 2, 4, and 5), 300 ng of target 1, 3,
and 6. Make up the volume to 30 µL with TE 8.0.
2. Incubate at 95°C for 5 min and 65°C for 1 h (see Note 6).
Mutation Detection in Factor VIII
117
3. 10 µL of Streptavidin coated magnetic beads (a 50% suspension is supplied) are
required to bind the biotin tagged products per reaction. Take out the required
volume and wash twice with 2X binding buffer. Resuspend in three times the
original volume of the beads with 2X binding buffer.
4. Add 30 µL of the washed streptavidin beads to each reaction. Incubate 15 min at
room temperature.
5. Place the tube on a magnetic stand to pellet the beads and aspirate the supernatant.
3.4.2. Hybrid Modification and Cleavage
3.4.2.1. HYDROXYLAMINE
1. Resuspend the beads in 20 µL of 4 M hydroxylamine, pH 6.0 (see Methods for
preparation procedure).
2. Incubate 2 h at 37°C.
3. Pellet the streptavidin beads on a magnetic stand and wash the beads with TE 8.0
and proceed to Subheading 3.4.2.3. below.
3.4.2.2. OSMIUM TETROXIDE
1. Resuspend the beads from step 5 above in 20 µL 0.4% osmium tetroxide, 0.2%
pyridine and incubate for 15 min at 37°C (see Note 7).
2. Pellet the streptavidin beads on a magnetic stand, wash with TE 8.0 (see Note 8).
3.4.2.3. CLEAVAGE OF DNA
Add 5 µL of piperidine/ formamide loading dye to the reaction and incubate at
90°C for 30 min (see Note 9).
3.5. Analysis of the Products from SPFCCM
on ABI PRISM 377 DNA Sequencer
3.5.1. Preparation and Loading of Polyacrylamide Gel
1. Clean the glass plates with 3% Alconox. After rinsing them with water wipe
them with isopropanol soaked lint free tissue paper.
2. Set up the glass plates on the cassette, with notched plate at the bottom.
3. Prepare the following mix for the acrylamide gel for 12-cm plates (see Note 10):
6% Acrylamide/Bisacrylamide solution
20 mL
10% APS
47 µL
TEMED
33 µL
4. Pour in between the plates and allow it to set for 1 h. Save the rest of acrylamide
solution to check for its polymerization (see Note 11).
5. Prerun the gel for 15 min at PR 12A-1200.
6. Load 2 µL of the sample from Subheading 3.4.2.3. above. Dilute Rox GS-2500
1:5 in formamide loading dye. Heat it at 92°C for 2 min and use 2 µL of this as a
marker (see Note 12).
7. Electrophorese the gel on GS12A-1200 for 5 h.
8. Analyze the gel using Genescan software (Fig. 3).
118
Waseem et al.
Fig. 3. Gel image of mismatch products obtained by Genescan software on ABI
PRISM 377 DNA Sequencer. Lane M, Genescan 2500 Rox marker; lanes 1 and 6,
patient UKA162 with G to T mutation at nt 1798 leading to 50 nt deletion in mRNA;
lanes 2 and 7, patient UKA160 with A to G mutation at nt 1763 (see Note 13); lanes 3
and 8, patient UKA144 with A to G mutation at nt 1801. Lanes 4 and 9, patient
UKA133 with C to T mutation at nt 1636; lanes 5 and 10 are wild-type controls.
Mutation Detection in Factor VIII
119
3.6. Analysis of the Promoter and Polyadenylation Signal Region
Samples with mutations in the promoter or polyadenylation signal region of
factor VIII may have reduced levels or no transcripts. Therefore, RNA samples
that fail to amplify or do not give any mismatch bands (see Note 13) should be
screened for the mutations in these regions. Segment P (promoter region) and
segment T (polyadenylation signal region) are amplified in the same way as
above (Subheading 3.3., step 4) except no FdUTP is added. The primers used
for amplification are shown in Table 1. The PCR products are gel purified and
sequenced with one of the primers used for amplification.
3.7. Sequence Analysis for Complete Mutation Characterization
3.7.1. Setting up the Sequencing Reaction
1. From the size of the mismatch fragment estimate the position of the mutation
from either end of the segment.
2. Amplify either the same segment from a new RT-PCR or amplify the relevant
exons (see Note 14).
3. Gel purify the products (see Note 15).
4. Set up the sequencing reaction as follows: BigDye terminator mix 4 µL, primer
0.8 pmol, DNA (200 –400 ng) water to 10 µL.
5. Start the following thermal cycling condition: 96°C for 30 s, 50°C for 15 s, 60°C
for 4 min, 25 cycles and hold at 4°C.
6. Transfer the content of the reaction tube to a fresh tube and add 1 µL 3 M sodium
acetate, pH 4.6, and 25 µL ethanol. Mix and incubate on ice for 10 min.
7. Centrifuge at the maximum speed for 15 min at room temperature.
8. Wash pellet with 70% ethanol. Vortex to resuspend for about 30 s. This is very
crucial in removing unincorporated nucleotides.
9. Repeat the centrifugation step (step 7).
10. Discard the supernatant and air-dry the pellet for 10 min at room temperature.
11. Resuspend in 2 µL of formamide loading dye. Just before loading heat the sample
at 92°C for 2 min.
3.7.2. Preparation of Polyacrylamide Gel
1. Clean and set up the 36-cm glass plates as described in Subheading 3.5.
2. Prepare acrylamide mix as follows:
AutoMatrix 4.5
45 mL
10X TBE
5 mL
10% APS
250 µL
TEMED
35 µL
Stir to mix
3. Immediately pour it between the plates from the top end, pressing the plates to
avoid bubbles.
120
Waseem et al.
4. Allow it to set for 1 h at room temperature.
5. Prerun the gel for 15 min on Seq PR 36E-1200.
6. Load the samples from step 11 above (Subheading 3.7.1.) and electrophorese
for 7 h on Seq Run 36E-1200.
3.7.3. Sequence Analysis
1. To start the sequence analysis program, double click on the Gel file from the
sequence run.
2. Define the first and last track on the gel and the click Track and Extract lanes
from the Gel menu.
3. Quit sequence analysis program and open Sequence Navigator Program for the
analysis of mutations.
4. Import relevant sequences together with the published factor VIII sequence and
compare them using Comparative or Clustal program from Align menu.
3.8. Detection of Intron 22 Inversion by Long PCR
Forty five percent of the severe hemophilia A patients have inversions in
their factor VIII gene involving intron 22 resulting in the factor VIII coding
sequence ending at exon 22 and leading to segment 6 amplification failure (8).
The inversions are due to intra-chromatid homologous recombination between
a sequence in intron 22 called int22h-1 and either of the two repeats of these
sequence (int22h-2 and int22h-3) located 500 and 600 kb more telomerically
and in inverted orientation relative to int22h-1 (9). In 1998, Lui et al. (10)
developed a rapid PCR method for the detection of these inversions. The reaction is performed in a single tube containing four primers. Primers P and Q
amplify a 12 kb int22h-1 specific sequence and primers A and B amplify 10 kb
of int22h-2 and int22h-3. When an inversion occurs, two new recombined PCR
products, PB (11 kb) and AQ (11 kb) are amplified together with the AB (10 kb)
from unrecombined int22h-2 or int22h-3 and can be readily distinguished as
two bands on a 0.5 % agarose gel (Fig. 4).
1. In a 0.2 mL microfuge tube, add 1 µL of 10X Expand buffer 2 (supplied with the
enzyme), 1 µL 5 mM dNTP (made with 2.5 mM deaza dGTP, 2.5 mM dGTP and
5 mM each of dCTP, dTTP and dATP), 7.5% DMSO, 120 ng of primer P and Q,
50 ng of primer A and B, 0.3 µL of Expand (Boehringer Mannheim, Germany)
and 250 ng of DNA, make up the volume to 10 µL with TE 8.0.
2. Place the tube in a controlled temperature block and cycle under following conditions: after 2 min denaturation at 94°, 10 cycles of 94° for 15 s, 68° for 12 min
followed by 20 cycles of 94° for 15 s, 68° for 12 min with 20-s increment per cycle.
3. Load the products on 0.5% agarose gel and visualize the band after staining with
ethidium bromide.
Mutation Detection in Factor VIII
121
Fig. 4. Schematic diagram depicting the PCR assay for intron 22 inversion in factor
VIII gene. (A) Diagrammatic representation of the position of the primers around
int22h-1 and int22h-2 and -3. (B) PCR products (PQ, AB) from a normal male (12 kb
and 10 kb, lane 1), PB + AQ, AB from intron 22 inversion male patients (11 kb and
10 kb, lane 2) and a PQ, PB + AQ, AB from female carrier (12, 11 and 10 kb, lane 3).
4. Notes
1. Blood stored for 3 d at room temperature can be used for the isolation of RNA.
Although the yield of RNA is low it is usually good enough for the RT-PCR.
2. We normally analyze our RNA on 1% agarose gel before starting the RT-PCR.
To 2 µL RNA solution add 2µL bromophenol/glycerol dye (0.1% bromophenol
blue in 30% glycerol). Heat it at 65°C for 5 min and load on the gel. Two, sometimes three ribosomal RNA bands are visible under UV light.
3. Some types of mutations, e.g., nonsense or frameshift make the transcript
unstable. To compensate for this, increase the number of cycles in primary PCR
from 10 to 30.
4. Fluorescent dUTP and dCTP lowers the efficiency of PCR. Avoid using too much
fluorescent dUTP in the PCR reaction.
122
Waseem et al.
5. We use cloned factor VIII cDNA from Genentech as a probe to amplify segment
1, 2, 5, and 6. Segment 3 and 4 are amplified from normal DNA.
6. Hybrids of target and control DNA can be stored at –20° for up to 3 d.
7. Osmium tetroxide is a strong oxidizing agent, avoid undue exposure to the air.
8. Hydroxylamine and osmium tetroxide reaction can either be performed separately
or can be combined. To do that, first do the reaction with hydroxylamine then
osmium tetroxide followed by the piperidine cleavage step. Follow the reaction
until step 3 (Subheading 3.4.2.1.) then start step 1 of Subheading 3.4.2.2. (the
osmium tetroxide reaction) as described in the protocol.
9. On a Genescan gel, a couple of fluorescent bands appear around 150–200 bp.
These are the degraded fluorescent moieties from the fluorescence dUTPs. They
can be removed from the reaction mixture by ethanol precipitation. Perform the
cleavage step with aqueous 1 M piperidine at 90°C for 30 min. To the supernant
add 1/10 vol of 3 M sodium acetate, pH 4.6 and 2.5 vol of ethanol. Place the tube
in dry ice for 5 min, spin at maximum speed for 10 min in a microfuge. Wash the
pellet with 70% ethanol, air-dry and resuspend in 5 µL of formamide loading dye.
10. Twelve centimeter plates give good separation of most of the mismatch bands.
However, samples that have large mismatch products are better separated on
36-cm plates.
11. The manufacturer of ABI PRISM 377 DNA sequencer recommend the gel to age
for 2 h before loading the samples, However, we find that 15 min setting time is
enough. Gels left to set for more 2 h run slower.
12. More accurate sizing of the mismatched products on a Genescan gel will require
internal standards. For this purpose, GS 2500-Rox diluted 1:400 in formamide
loading dye should be used in place of formamide loading dye at the cleavage step.
13. A T nucleotide mispaired with G is not modified by osmium tetroxide if preceded
by G at the 5' end and will only show up in the hydroxylamine reaction (11).
14. Fluorescent DNA sequencing requires more template than 35S dATP sequencing.
Don’t even attempt to sequence from a poor PCR.
15. For gel purifying the PCR product, remove the relevant band from the low melting agarose gel and add equal volume of water. Heat at 70°C for 10 min, this
keeps it in solution. Several matrices are available commercially, e.g., Geneclean
(BIO101), PCR purification kit (Promega), centrisep column (Amicon), which
can be used for the purification of DNA from this gel.
References
1. Gitschier, J., Wood, W. I., Goralka, T. M., Wion, K. L., Chen, E. Y., Eaton, D. H.,
et al. (1984) Characterization of the human factor VIII gene. Nature 312,
326 –330.
2. Toole, J. J., Knopf, J. L., Wozney, J. M., Sultzman, L. A., Buecker, J. L., Pittman,
D. D., et al. (1984) Molecular-cloning of a cDNA-encoding human antihemophilic factor. Nature 312, 342 – 347.
3. Higuchi, M., Antonarakis, S. E., Kasch, L., Oldenburg, J., Economou-Petersen,
E., Olek, K., et al. (1991) Molecular characterisation of mild-to-moderate hemo-
Mutation Detection in Factor VIII
4.
5.
6.
7.
8.
9.
10.
11.
123
philia A: detection of the mutation in 25 of 29 patients by denaturing gel electrophoresis. Proc. Natl. Acad. Sci. USA 88, 8307– 8311.
Orita, M., Iwahana, H., Kanazawa, H., Hayashi, K., and Sekiya, T. (1989) Detection of polymorphisms of human DNA by gel-electrophoresis as single-strand
conformation polymorphisms. Proc. Natl. Acad. Sci. USA 86, 2766 – 2770.
Oldenburg, J., Ivaskevicius, V., Rost S., Fregin, A., White, K., Holinski-Feder,
E., et al. (2001) Evaluation of DHPLC in the analysis of hemophilia A. J. Biochem.
Biophys. Meth. 47, 39 – 51.
Waseem, N. H., Bagnall, R., Green, P. M., and Giannelli, F. (1999). Start of UK
confidential haemophilia A database: analysis of 142 patients by solid phase fluorescent chemical cleavage of mismatch. Throm. Haemost. 81, 900 – 905.
Naylor, J. A., Green, P. M., Montandon, A. J., Rizza, C. R., and Giannelli, F.
(1991) Detection of three novel mutations in two haemophilia A patients by rapid
screening of whole essential region of factor VIII gene. Lancet 337, 635 –639.
Naylor, J. A., Green, P. M., Rizza, C. R., and Giannelli, F. (1992) Factor VIII
gene explains all cases of haemophilia A. Lancet 340, 1066 –1067.
Naylor, J. A., Buck D., Green P., Williamson H., Bentley D., and Giannelli F.
(1995) Investigation of the factor VIII intron 22 repeated region (int22h) and the
associated inversion junctions. Hum. Mol. Genet. 4, 1217–1224.
Liu, Q., Nozari, G., and Sommer S. S. ( 1998) Single-tube polymerase chain reaction for rapid diagnosis of the inversion hotspot of mutation in hemophilia A.
Blood 92, 1458 –1459.
Forrest, S. M., Dahl, H. H., Howells, D.N., Dianzani, I., and Cotton R. G. H.
(1991) Mutation detection in phenylketonuria using the chemical cleavage of mismatch method: Importance of using probes from both normal and patient samples.
Am. J. Hum. Genet. 49, 175 –183.
150
Wells
Denaturing Gradient Gel Electrophoresis
125
14
Denaturing Gradient Gel Electrophoresis
Yvonne Wallis
1. Introduction
Denaturing gradient gel electrophoresis (DGGE) is a powerful mutation
detection technique described by Fisher et al. in 1983 (1). It allows the resolution of relatively large DNA fragments (usually polymerase chain reaction
[PCR] products) differing by only a single nucleotide. DGGE is most frequently
employed for the detection of unknown mutations. A related technique referred
to as constant denaturing gradient gel electrophoresis (CDGE) is used for the
sensitive detection of known mutations (2,3). More recently a modified
version of DGGE known as 2-dimensional DGGE has been employed for the
simultaneous analysis of several PCR fragments (4). PCR fragments are
initially separated by size on a polyacrylamide gel prior to loading onto a conventional denaturing gradient gel system, as will be described in this chapter.
Denaturing gradient gel electrophoresis offers a number of advantages over
other mutation detection techniques, including:
1. It is capable of detecting up to 100% of all single base substitutions in fragments
up to 500 bp in length. It has been shown to be more sensitive than many other
commonly used mutation detection methods including single-strand
conformation polymorphism (SSCP) and heteroduplex analysis (5,6).
2. The availability of user-friendly computer programs reduces the amount of
preliminary work required prior to fragment analysis.
3. It uses a nonradioactive method of DNA band detection.
4. The formation of heteroduplexes significantly improves the detection of
heterozygotes.
5. Variant DNA bands may be readily isolated from gels for subsequent sequencing
analysis.
From: Methods in Molecular Biology, vol. 187: PCR Mutation Detection Protocols
Edited by: B. D. M. Theophilus and R. Rapley © Humana Press Inc., Totowa, NJ
125
126
Wallis
DGGE also has a number of limitations, including:
1.
2.
3.
4.
Its sensitivity decreases for fragments larger than 500 bp.
It requires the use of specialist equipment.
The addition of GC clamps makes the purchase of PCR primers expensive.
Knowledge of melting behaviour is essential for efficient analysis and therefore
preliminary work-ups must be performed before fragment analysis can take place.
DGGE analysis involves the electrophoresis of double-stranded DNA
fragments through a polyacrylamide gel containing a linearly increasing
concentration of denaturants usually urea and formamide (1). Temperature may
also be employed as the denaturant using a similar technique known as temperature denaturing gradient gel electrophoresis (TGGE). During migration discrete regions within the DNA fragments, referred to as melting domains,
denature (“melt”) at specific positions along the denaturing gradient. The concentration of denaturant at which denaturation of a melting domain occurs is
referred to as the melting temperature or Tm. Branched denatured portions of
DNA fragments entangle more readily in the polyacrylamide matrix and as a consequence cause an abrupt decrease in the mobility of the whole DNA fragment.
A DNA fragment may contain more than one melting domain with the Tm of
each one being strictly dependent upon its nucleotide sequence. Alterations in
the nucleotide sequence (e.g., disease-causing mutations) in all but the highest
melting temperature domain will alter the melting properties of the whole DNA
molecule thereby altering its electrophorectic mobility (Fig. 1).
Base changes in the domain with the highest melting temperature will not be
detected due to the loss of sequence dependent migration upon complete strand
dissociation. This limitation is easily overcome by the attachment of a highly
thermostable segment referred to as a GC clamp to one end of the DNA fragment. The GC clamp is efficiently introduced during the PCR amplification
step prior to DGGE analysis by the use of a modified primer containing a GC
tail at its 5' end. In general a GC clamp of 40 bp as originally described by
Sheffield et al. (7) is sufficient (see Note 1). Longer GC clamps may be required
for the sensitive analysis of particularly GC-rich sequences (8). The introduction of a GC clamp increases the percentage of mutations detectable by DGGE
close to 100% in fragments up to 500 bp therefore making it more sensitive
than other commonly used mutation detection systems.
Successful DGGE requires knowledge of the melting behavior of each DNA
fragment to be analyzed. Optimal DGGE results are obtained if the DNA fragment under analysis contains only one or two melting domains (excluding the
GC-clamp domain). In fragments containing two melting domains, the GC
clamp should be positioned immediately adjacent to the domain with the higher
melting temperature. Computational analysis using software such as MELT95
Denaturing Gradient Gel Electrophoresis
127
Fig. 1. Schematic diagram showing the electrophoresis of normal (lane A) and
mutant (lane B) PCR fragments. The normal PCR product in lane A has two melting
domains, X and Y, and the melting temperature of X (TmX) is higher thatn that of Y
(i.e., TmX > TmY). As the normal fragment migrates through the linearly increasing
denaturing gradient gel, domain Y “melts” before domain X and the branched segment of Y causes retardation of the whole PCR fragment. A mutation in domain Y
(marked with an *) increases the Tm of domain Y. Y* therefore melts at a higher
denaturing concentration and therefore migrates to a position further along the denaturing gradient than its normal counterpart Y. The mutant PCR fragment therefore
migrates further along the denaturing gradient.
(9) or MACMELT (commercially available from Bio-Rad Laboratories, UK),
allows the melting behavior of each target DNA sequence to be visualized as a
meltmap. Using these programs PCR primers can be specifically designed to
create fragments containing only one or two melting domains, and GC clamps
can be placed to produce products with the most favorable melting behavior.
DGGE is particularly sensitive when screening for heterozygous nucleotide
alterations and is used to analyze a number of genes causing dominantly inherited genetic disorders. Examples include the APC and the hMLH1 and hMSH2
mismatch repair genes (10 –12). Mismatches present in heteroduplex molecules
produced during the PCR stage significantly reduce the thermal stability of the
whole DNA fragment causing them to denature at a lower denaturant concentration than their homoduplex counterparts. Heteroduplex molecules usually
128
Wallis
Fig. 2. Photograph of a DGGE gel for the analysis of exon 6 of the APC gene. Lane 1
shows an A to G transition at codon 235 and lane 3 shows a C to T transition at codon
232. Lane 2 shows a normal band pattern. Two heteroduplex bands migrate above the
normal/mutant homoduplex bands in both cases.
appear as additional bands above the homoduplexes and therefore facilitate
detection of heterozygous mutations (Fig. 2). Homozygous mutations may also
be detected by DGGE if the mutant homoduplex products migrate to a different position along the denaturing gradient than their normal counterparts. If
necessary, heteroduplex molecules may be artificially created by mixing normal and patient PCR products prior to DGGE analysis (see Note 2).
A denaturing gradient linearly increasing from the top to the bottom of a
vertical polyacrylamide gel is created using a gradient maker. A “high” denaturant polyacrylamide solution is gradually diluted with a “low” denaturant
polyacrylamide solution as it pours into a glass-plate sandwich under gravity
(see Fig. 3).
The choice of denaturant range (and hence the concentration of the “low”
and “high” polyacrylamide solutions) is made based on the Tm of the domain of
interest (obtained by computational analyses) with a top to bottom difference
of 30%. Gels are usually run at 60°C and at this temperature the conversion
factor between the T m of a melting domain and the required percentage of
denaturant is derived from the following formula:
% denaturant = (3.2 × Tm) – 182.4
Therefore, the starting denaturant range for a particular DNA fragment is
usually selected as the percentage of denaturant ±15% of the calculated %
denaturant (as derived from the Tm value).
For example, if a PCR fragment has a single melting domain with a Tm of
71°C, the % denaturant required for “melting” at 60°C is calculated to be 45%,
Denaturing Gradient Gel Electrophoresis
129
Fig. 3. Schematic diagram of a gradient maker used to generate linearly increasing
denaturant gradient gels for DGGE analysis.
and therefore a denaturing gradient of 30 – 60% should be employed to resolve
this fragment. Fragments containing two melting domains should be analyzed
on two gradient gels with denaturant gradients specific for each of the two Tm
values.
It may be necessary to optimize the denaturing gradient for some PCR products if they migrate either too far along the denaturing gradient or insufficiently
so that they come to rest near the top of the polyacrylamide gel (see Note 3).
2. Materials
The author uses the INGENYphorU DGGE system supplied by Genetic
Research Instrumentation Ltd (GRI), and all materials and methods described
below are for use with this system. Commercial systems are not essential, however, and “homemade” equipment as originally described by Myers et al. (13)
may be used if a good electrical workshop is to hand.
2.1. DGGE Equipment
1. DGGE gel system supplied by GRI, comprising of the following components
(to make one DGGE gel): two glass plates, one with a large notch and one with
a small notch; U-shaped spacer (1 mm thick); 32-well comb; plexi-glass pressure unit.
2. Gradient maker (GRI) with at least a 30 mL capacity per chamber.
3. Electrophoresis unit (GRI): designed to hold two gradient gels. The gels face
each other to create the upper buffer reservoir. The unit also incorporates the
130
Wallis
cathode and anode platinum electrodes. There is an inlet at the top of the unit that
connects to a buffer flow tube. During electrophoresis, buffer is continuously
pumped into the upper buffer reservoir and overflows from the chamber via two
holes present on each side of the unit positioned above the level of the wells.
Circulating buffer maintains a constant pH in the upper reservoir.
4. Buffer tank (GRI): holds 17L TAE (Tris/acetate/EDTA) buffer and incorporates
a thermostat to keep the buffer at the designated temperature, as well as a pump
to circulate buffer from the tank in to the upper buffer reservoir via a buffer flow
tube. A safety mechanism cuts the current off if the tank lid is opened during
electrophoresis.
2.2. Reagents and Solutions
1. 20X TAE buffer, pH 8.0: 800 mM Tris base, 20 mM EDTA and 400 mM sodium
acetate. For 1 L dissolve the following in 950 mL distilled water: 97 g Tris
base, 7.5 g Na2EDTA, and 54.5 g sodium acetate.3H2O
Adjust to pH 8 with acetic acid (approx 30 mL). Make up to 1 L with distilled
water. Store at room temperature.
2. 80% denaturant polyacrylamide stock: 8% polyacrylamide (see Note 4), 5.6 M
urea, and 32% formamide. For 500 mL add together the following: 100 mL
40% polyacrylamide (19:1 acrylamide:bis-acylamide), 170 g urea, 160 mL
deionized formamide (see Note 5), 25 mL 20X TAE buffer, and distilled water
up to 500 mL.
Stir until urea is completely dissolved. Store at 4°C in a dark bottle, stable at
4°C for 3 mo.
3. 0% Denaturant polyacrylamide (8%) stock. For 500 mL combine 100 mL 40%
polyacrylamide (19:1 acrylamide:bis-acylamide) and 400 mL distilled water.
Store at 4°C, stable at 4°C for 3 mo.
4. 10% Ammonium sulphate (APS). Dissolve 1 g in 10 mL distilled water. Divide
into 500 µL aliquots and store at –20°C until required.
5. N,N,N',N'-Tetramethylethylenediamine (TEMED). Store in the dark at room
temperature.
6. 6X Gel loading buffer: 0.025% bromophenol blue, 0.025% xylene cyanol, and
20% Ficoll. Dissolve 250 mg bromophenol blue, 250 mg xylene cyanol, and 20 g
Ficoll in 100 mL distilled water; can be stored at room temperature.
7. 10 mg/mL Ethidium bromide solution. Dissolve 1 g ethidium bromide in 100 mL
distilled water. Store at room temperature in a dark bottle. Note: Ethidium bromide is a highly hazardous substance. In addition to standard laboratory safety
procedures, always wear appropriate protective equipment when handling
ethidium bromide powder (i.e., face mask) and solution (i.e., gloves).
3. Methods
3.1. Preparation of DGGE Gel System
It is important to use thoroughly cleaned glass plates as grease and dust
may disrupt the denaturing gradient gel during pouring. Plates should there-
Denaturing Gradient Gel Electrophoresis
131
fore be washed in water immediately after use and cleaned with 100% ethanol
before use.
1. Assemble the glass plates and spacer(s) according to manufacturers instructions
(GRI or other company). If using a homemade system, use plates that are at least
20 cm by 20 cm and use spacers that are 0.75–1 mm thick.
2. Insert the glass plate sandwich in to the electrophoresis cassette so that the inner
smaller plate faces inwards (to create an upper buffer chamber). Insert the plexiglass pressure unit so that it rests against the larger outer glass plate (this prevents
over tightening of the screws and therefore plate cracking during electrophoresis). Lift the U-shaped spacer until it locks into position and tighten all screws to
secure the glass plate sandwich into the electrophoresis unit. The design of the
U-shaped spacer prevents leakage of the gradient gel during pouring.
3. The comb may be inserted at this point in to the top of the glass plate sandwich.
3.2. Preparation of Denaturing Gradient Gel
1. For each denaturing gradient gel, prepare appropriate “low” and “high” polyacrylamide solutions, e.g., 30% and 60% denaturant solutions should be prepared
to make a 30 – 60% denaturing gradient gel. The “low” and “high” solutions are
prepared by mixing appropriate volumes of 0% and 80% denaturant polyacrylamide solutions (see Note 6). The volume of the “low” and “high” solutions is
dependent up on the total volume held by the glass plates. The INGENYphorU
plates hold a total volume of 55 mL. Therefore, 27.5 mL volumes of “low” and
“high” solutions are prepared separately for each denaturing gradient gel. The
“low” and “high” solutions should be placed at 4°C for 15 min before pouring.
2. Place the gradient maker on a magnetic stirrer positioned 25 – 30 cm above the
top edge of the glass plate sandwich. The connection between the two chambers
should be closed, and the exit tube should be clamped. Insert the end of the exit
tube into the top of the glass plate sandwich (this may be facilitated by attaching
a yellow tip onto the end of the tubing). Place a magnetic bar into the “high”
chamber (see Fig. 3). The apparatus is now ready for pouring a gradient gel.
3. Add appropriate volumes of 10% APS and TEMED to the “low” and “high”
denaturing solutions and mix gently. 140 µL of 10% APS and 14 µL TEMED are
added to the 27.5 mL solutions required to make an INGENYphorU gel.
4. Pour the “low” denaturant solution into the “low” chamber. Briefly open the connection between the two chambers to release a small quantity of polyacrylamide
into the “high” chamber. This action prevents air bubbles blocking the connection tube.
5. Pour the “high” denaturant solution into the “high” chamber. Activate the magnetic bar to create a vortex, and open the clamped exit tube.
6. By gravity, the “high” denaturant solution will then leave the “high” chamber
and pass into the glass plate sandwich via the exit tube. At this point, open the
connection between the two chambers. The “low” solution will then flow into the
“high” chamber, and mix with the “high” solution.
132
Wallis
7. The clamp should be used to adjust the rate of flow of polyacrylamide solution
from the “high” chamber through the exit tubing so that a denaturing gradient gel
is poured in 5–10 min.
8. Allow the gel to polymerize for between 1– 2 h.
9. In the meantime, heat the TAE buffer in the buffer tank to 60°C (see Note 7).
Please note that the TAE buffer may be used three times before replacing.
3.3. Gel Electrophoresis
1. Following polymerization, loosen all screws until they just touch the plexi-glass
pressure unit.
2. Place the electrophoresis cassette into the INGENYphorU buffer tank and connect the buffer flow tube. Buffer should overflow from the upper buffer chamber
into the main tank through holes in the sides of the cassette. A valve on the outside of the tank controls the rate of buffer flow into the upper buffer reservoir.
3. Carefully remove the comb and push the U-shaped spacer downwards so that the
bottom of the polyacrylamide gel makes contact with the buffer. Dislodge any
little air bubbles lying below the gel by briefly holding the cassette at a 45° angle.
4. Retighten the upper two screws on each side of the cassette. Connect the electrodes and prerun the gel at 100 V for 10–15 min before loading.
5. During this time, add 6X gel-loading buffer to the PCR samples to be analyzed
(see Note 8). Depending on the yield of the PCR product, load 5–10 µL of sample
from a 25 µL PCR reaction (see Note 9).
6. Before loading, disconnect the power supply and flush out the wells thoroughly
with TAE buffer using a needle and syringe. After sample loading reconnect the
power supply and electrophorese for the required running time. The optimum
running time may be calculated using software mentioned in the introduction. As
a guide, the author runs all gels for the analysis of exons 3 –14 of the
Adenomatous polyposis coli gene at 100 V (for a gel 30 cm in length) for 16 h.
Products may be electrophoresed at a higher voltage for a shorter time if required.
3.4. Gel Staining
1. After the required electrophoresis time disconnect the power supply, and switch
off the buffer tank. Carefully remove the hot gel electrophoresis unit from the
buffer tank.
2. Remove the gel(s) from the unit and separate the glass plates gently to leave the
gel on the noneared plate. Remove as appropriate a top gel corner to assign the
gel-loading end.
3. Place the gel (still on a noneared plate) into a staining box and stain in 1X TAE
buffer (or distilled water) containing 0.5 µg/µL ethidium bromide.
4. Shake gently for 15 – 30 min.
5. Decant ethidium bromide solution and rinse gel in distilled water and visualize
the DNA bands under UV light (254 nm).
Denaturing Gradient Gel Electrophoresis
133
Fig. 4. Photographs of DGGE gels showing examples of variant band patterns
detected in exons 10 (panel A), 15D (panel B) and 5 (panel C) of the APC gene. Panel
A: four bands in lane 1 represent a 5-bp deletion at codon 456 and 3 bands are seen in
lane 4 caused by a 2-bp insertion at codon 452. Panel B: a two-band pattern in lane 1 is
caused by a 1-bp deletion at codon 964. Panel C: a G to T splice site mutation causes
a three-band pattern in lane 2. The presence of heteroduplex bands in lanes 4 of Panel
A, lane 1 of Panel B and lane 2 of Panel C facilitates the detection of these variants
since the normal and mutant homoduplex bands comigrate.
3.5. Gel Interpretation
A normal PCR fragment (containing no nucleotide alterations) will resolve
on a DGGE gel as a single band. Amplification of a DNA fragment containing
a heterozygous nucleotide change (whether single base substitution or small
insertion/deletion) will result in the formation of both normal and mutant
homoduplex molecules as well as two different heteroduplex molecules. Ideally, the mutant homoduplex will be displaced from its normal counterpart. In
addition, the two heteroduplexes will migrate to different positions along the
denaturing gradient. Following ethidium staining, therefore, a variant band
pattern will usually appear as four DNA bands. In some cases, however, variants may manifest as two or even three DNA bands (Fig. 4).
134
Wallis
4. Notes
1. The 40 bp GC clamp originally described by Sheffield et al. (7) has the following
sequence: 5'-CGCCCGCCGCGCCCCGCGCCCGTCCCGCCGCCCCCGCCCC3' and should be attached to the 5' end of either the forward or reverse primer.
2. To make heteroduplex molecules when screening homozygous mutations, mix
equal quantities of normal and mutant PCR products and denature at 95°C for
10 min followed by 30 min at the product-specific annealing temperature. Cool
to room temperature before loading.
3. Optimization of DNA band migration may be achieved by altering the denaturant gradient range. For example, if fragments migrate too far into the gel before
they resolve, the denaturant concentration at the top should be increased. However, if fragments do not migrate sufficiently, the concentration at the top
should be lowered.
4. The concentration of polyacrylamide may be altered to suit the fragment size
under analysis.
5. To deionize formamide, add 3 g of mixed bed resin to 100 mL formamide and
mix for 30 min (in a fume hood). Filter through Whatman paper (again in a fume
hood) and store in a dark bottle at 4°C.
6. Appropriate volumes of 0% and 80% denaturant polyacrylamide solutions are
mixed to make “low” and “high” gradient solutions. For example, 30% “low”
and 60% “high” solutions are made to pour a denaturing gradient gel with a range
of 30–60%. The following volumes of 0% and 80% denaturant polyacrylamide
solutions are mixed to give 27.5 mL volumes of 30% and 60% solutions:
30% Low solution
60% High solution
volume 0% solution
volume 80% solution
17.2 mL
10.3 mL
6.9 mL
20.6 mL
7. The temperature of the running buffer is very important, and it must not be
allowed to deviate from 60°C, as this is a factor in the derivation of the denaturing gradient. If the temperature is too high, DNA fragments may not migrate far
enough into the gel, and if it is too low, migration may be too far.
8. PCR conditions are specific to the fragment under analysis, and therefore have
not been discussed in this chapter other than the necessity to incorporate a GC
clamp into the product. Reactions however should be free from nonspecific
amplification products to avoid confusion caused by extra bands.
9. It is important to avoid overloading the gel as this leads to “fuzzy” bands or
smeared lanes making interpretation difficult. “Fuzzy” bands and smeared lanes
may also be caused if the samples have not properly focused, a problem that may
require either optimization of the denaturing gradient conditions or primer design.
References
1. Fischer, S. G. and Lerman, L. S. (1983) DNA fragments differing by a single
base-pair substitution are separated in denaturing gradient gels: correspondence
with melting theory. Proc. Natl. Acad. Sci USA 80, 1579–1583.
Denaturing Gradient Gel Electrophoresis
135
2. Hovig, E., Smith-Sorenson, B., Brogger, A., and A. L. (1991) Constant denaturant gel electrophoresis, a modification of denaturing gradient gel electrophoresis,
in mutation detection. Mut. Res. 262, 63–71.
3. Borresen, A. L., Hovig, E., Smith-Sorenson, B., Malkin, D., Lystad, S., Andersen,
T. I., Nesland, J. M., Isselbacher, K. J., and Friend, S. H. (1991) Constant denaturant gel electrophoresis as a rapid screening technique for p53 mutations. Proc.
Natl. Acad. Sci. USA 88, 8405 – 8409.
4. Van Orsouw, N. J., Vijg, J. (1999) Design and application of 2-D DGGE-based
gene mutational scanning tests. Genet Analyt. 14, 205 – 213.
5. Takahashi, N., Hiyami, K., Kodaira, M., and Satoh, C. (1990) An improved
method for the detection of genetic variations in DNA with denaturing gradient
electrophoresis. Mut. Res. 234, 61–70.
6. Moyret, C., Theillet, C., Puig, P. L., Moles, J. P., Thomas, G., and Hamelin, R.
(1994) Relative efficiency of denaturing gradient gel electrophoresis and single
strand conformation polymorphism in the detection of mutations in exon 5 to 8 of
the p53 gene. Oncogene 9, 1739 –1743.
7. Sheffield, V. C., Cox, D. R., Lerman, L. S., and Myers, R. M. (1989) Attachment
of a 40 base pair G+C-rich sequence (GC-clamp) to genomic DNA fragments by
the polymerase chain reaction results in improved detection of single base
changes. Proc. Natl. Acad. Sci USA 86, 232 – 236.
8. Olschwang, S., Laurent-Puig, P., Groden, J., White, R., and Thomas, G. (1993)
Germ-line mutations in the first 14 exons of the adenomatous polyposis coli (APC)
gene. Am. J. Hum. Genet. 52, 273 –279.
9. Lerman, L. S. and Silverstein, K. (1987) Computational simulation of DNA melting and its application to denaturing gradient gel electrophoresis, in Methods in
Enzymology Volume 155, (Wu, R., ed.), Academic Press, NY, pp. 482 – 501
10. Wallis, Y. L., Morton, D. G., McKeown, C. M., and Macdonald, F. (1999)
Molecular analysis of the APC gene in 205 families: extended genotype-phenotype correlations in FAP and evidence for the role of APC amino acid changes in
colorectal cancer predisposition. J. Med. Genet. 36, 14 – 20.
11. Fidalgo, P., Almeida, M. R., West, S., Gaspar, C., Maia, L., Wijnen, J., et al.
(2000) Detection of mutations in mismatch repair genes in Portuguese families
with hereditary non-polyposis colorectal cancer (HNPCC) by a multi-method
approach. Eur. J. Hum. Genet. 8, 49 – 53.
12. Fodde, R., Vander Luijt, R., Wijnen, J., Tops, C., Van der Klift, H., Van LeeuwenCornelisse, I., et al. (1992) Eight novel inactivating germ line mutations of the
APC gene identified by denaturing gradient gel electrophoresis. Genomics 13,
1162–1168.
13. Myers, R. M., Maniatis, T. and Lerman, L. S. (1987) Detection and localisation of
single base changes by denaturing gradient electrophoresis, in Methods in Enzymology, Volume 155 (Wu, R., ed), Academic Press, NY, pp. 501–527.
150
Wells
Conformation-Sensitive Gel Electrophoresis
137
15
Conformation-Sensitive Gel Electrophoresis
Ian J. Williams and Anne C. Goodeve
1. Introduction
Conformation-sensitive gel electrophoresis (CSGE) was first described by
Ganguly et al. in 1993 (1). This technique was developed as the result of a
study into a rapid, non-radioactive heteroduplex-based detection method for
mutation screening. The method relies on the differential migration of DNA
heteroduplexes in comparison with homoduplexes during polyacrylamide gel
electrophoresis under mildly denaturing conditions. Ethidium bromide staining and visualization under ultraviolet (UV) light determines those samples
with aberrant banding patterns resulting from heteroduplexes. These samples
are subsequently subjected to DNA sequencing to determine the nature of the
nucleotide alteration.
This chapter aims to describe the theory behind CSGE and provide information to establish this method both quickly and effectively in most laboratory situations.
1.1. CSGE Theory
The difference in electrophoretic mobility of DNA homoduplexes from DNA
heteroduplexes has been the focal point for the development of rapid screening
techniques in the detection of DNA sequence alterations. A DNA homoduplex
differs from a DNA heteroduplex in its complete Watson –Crick base pairing of
adenine–thymine and guanine–cytosine pairs. A DNA homoduplex consists of
entirely complementary DNA and is completely Watson – Crick base-paired. A
DNA heteroduplex has incomplete Watson –Crick base-pairing in opposition.
Mismatched, noncomplementary base-pairing may involve a single mismatched
nucleotide to produce a DNA heteroduplex, detectable by CSGE.
From: Methods in Molecular Biology, vol. 187: PCR Mutation Detection Protocols
Edited by: B. D. M. Theophilus and R. Rapley © Humana Press Inc., Totowa, NJ
137
138
Williams and Goodeve
The CSGE method relies upon mildly denaturing solvents to amplify the
conformational changes caused by single-base mismatches during polyacrylamide gel electrophoresis (1). Under nondenaturing conditions, slight conformational changes caused by single-base mismatches in DNA fragments will
have an almost identical electrophoretic mobility to wild-type DNA fragments
of identical sequence. Under mildly denaturing conditions, one mismatched
base becomes rotated out of the double helix, creating a bend or kink in the
DNA fragment. The conformational change causes aberrant migration of this
fragment compared with wild-type DNA during polyacrylamide gel electrophoresis under mildly denaturing conditions. If the denaturants within the gel
matrix are increased above optimal conditions for CSGE, both mismatched
bases are rotated out of the double helix and the bend or kink causing the
conformational change is eliminated. In this situation, homoduplexed and
heteroduplexed DNA will have similar electrophoretic mobilities. Bhattacharrya
and Lilley (2) proposed that under nondenaturing conditions, DNA fragments
with an additional base or bases on one side of the DNA helix, such as a deletion or insertion resulting in a frameshift mutation, exhibit more marked gel
retardation than DNA fragments possessing single mismatches, where two nonWatson–Crick bases are in opposition. They also reported an increased gel
retardation with an increasing number of mismatched bases. This increased gel
retardation with insertion and deletion mutations is also observed under the
mildly denaturing conditions of CSGE (see Subheading 3.4.). Therefore,
CSGE aims to optimize conditions for mismatched bases in heteroduplexed
DNA to result in a shift in band migration during polyacrylamide gel electrophoresis.
1.2. CSGE Conditions
Optimized conditions for CSGE were described by Ganguly and Prockop
(3). Denaturants ethylene glycol and formamide, known to alter the conformation of DNA, were chosen for inclusion into the CSGE gel mix at concentrations of 10% and 15% respectively, because of their compatibility with
polyacrylamide gel electrophoresis. A tris-taurine buffer system was employed,
replacing a tris-borate buffer, as the tris-taurine buffer is glycerol tolerant (1).
Finally, a 10% polyacrylamide gel of 1 mm thickness was used with
bisacryloylpiperazine (BAP), replacing bis(N,N-methylene bisacrylamide) as
a crosslinker. These conditions provide strength to CSGE gels and enhance the
sieving action of the gel during electrophoresis (3).
1.3. Sensitivity of Technique
Originally, Ganguly et al. tested CSGE on a range of polymerase chain reaction (PCR) products possessing known single-nucleotide changes in amplified
Conformation-Sensitive Gel Electrophoresis
139
DNA fragments varying in size from 200 to 800 base pairs (bp) (1). Eighteen
of twenty-two single-base changes were detected in four different collagen
genes. Of the four not detected, three mismatches were located in an isolated
high-melting-temperature domain. The remaining undetected mismatch was
located 51 bp from one end of the PCR fragment. Subsequently, this mismatch
was detected when present 81 bp from the end of a new PCR fragment. A
similar observation was made with samples from patients having known factor
IX gene (FIX) mutations, where 31/35 mismatches were detected (1). The four
undetected mismatches were located within 50 bp of the end of the PCR fragment. This led to PCR primers being designed further away from the sequence
of interest, with 50–100 bp of redundant sequence being incorporated into each
end of the region amplified. In the same study, 100% detection of mutations
was achieved in a further 11 samples having sequence alterations in the M13
phage and in the elastin gene, giving a total of 60/68 mismatches detected. The
mutations not detected were either located in the terminal sequence of the PCR
product or located in a high-melting temperature domain. In our laboratory,
CSGE was applied to screening the factor VIII (FVIII) gene of hemophilia A
patients with similar success (4). Analysis of the FVIII gene of seven patients
with hemophilia A revealed seven nucleotide alterations plus an intragenic
deletion, detected because of the failure of amplification of exons 23 –25. The
FIX gene has also been examined by CSGE in our laboratory. CSGE detected
nucleotide alterations in 21 of 21 individuals with hemophilia B, 11 of which
were previously unknown (5). Recent improvements by Korkko et al. (6)
yielded 100% detection of mutations by CSGE in 76 different PCR products,
ranging in size from 200 – 450 bp using altered electrophoresis conditions.
CSGE has also been adapted to use fluorescent dyes and automated detection
on a DNA sequencer for an increased screening throughput (7). In summary,
CSGE will detect close to 100% of nucleotide sequence alterations.
1.4. Applications of CSGE
Conformation-sensitive gel electrophoresis has been used for detection
of sequence alterations in many different genes. These include inherited
defects in several collagen genes (1,6,8–10) and genes involved in haemostasis (4,5,11,12), plus acquired mutations in c-kit (13) and BRCA1 and
BRCA2 (7,14).
1.5. Variations on CSGE
Many variations on CSGE conditions have been presented by different laboratories. As a standard, we use the PCR sample alone in the heteroduplex reaction, covered by mineral oil to prevent evaporation of the sample, and a 10%
acrylamide (99:1 acrylamide:BAP) gel containing 10% ethylene glycol and
140
Williams and Goodeve
15% formamide. This CSGE gel is prerun for 1 h at 750 V and then samples are
electrophoresed at 400 V for 16 –17 h. Early work involved the addition of
ethylene glycol, formamide, xylene cyanol, and bromophenol blue to samples
to be heteroduplexed (1,3,9,10). Most laboratories heteroduplex samples without additives. Markoff et al. (14) used urea as a denaturant in the gel, at 15%, in
place of formamide (15%). Electrophoresis conditions have ranged from 40 W
for 6 h (6) to a 400 V overnight run (4). Gel documentation has been reported
by both ethidium bromide staining and by silver staining (14). A more recent
development has also adapted the CSGE mutation scanning assay for use with
fluorescent detection (F-CSGE) (7).
1.6. PCR Amplification
1.6.1. Primer Design
Primers for use in PCR amplification of a gene for mutation detection should
encompass the entire coding region, including intron/exon boundaries, the promoter region, and the polyadenylation signal. Most primer sets will thus be
intronic and should include, for the purpose of CSGE, an additional 80 –100 bp
at either end of each exon. Larger exons can be split into smaller PCR fragments, with an overlap of 80 –100 bp for each fragment.
1.6.2. PCR Conditions
Polymerase chain reaction optimization for mutation screening enhances the
quality of CSGE results and reduces PCR product purification steps for subsequent DNA sequencing. Following PCR amplification, samples are electrophoresed on 5% polyacrylamide:bis (see Note 1) minigels to assess DNA purity
and concentration. A single strong PCR product is ideal for CSGE and sequence
analysis. Polyacrylamide gel electrophoresis will also provide information
relating to the volume of sample to be loaded onto the CSGE gel. If the sample
is too concentrated, a smaller volume can be loaded or even diluted in water to
maintain the loading volume. An increased volume can also be loaded if the
DNA concentration is too low (see Note 2).
In some situations we have found that the components of the PCR reactions
can affect the DNA sample when loaded onto the CSGE gel. In these cases,
smearing of the sample has occurred and, instead of a single band, the sample
resembles a long streak blending into the DNA front, masking any indication
of heteroduplex band separation. This smearing can be easily eliminated by
changing PCR buffer components or buffer manufacturer. In our laboratory,
Bioline Taq polymerase is used with the manufacturers 10X (NH4)2SO4 buffer
with excellent results. Bioline Taq also works reliably with a homemade ammonium-sulfate-based buffer (see Note 3). Use of commercially supplied buffer
ensures standard amplification conditions and eliminates the batch-to-batch
variation with homemade buffer.
Conformation-Sensitive Gel Electrophoresis
141
An incompatibility between PCR amplification buffer and CSGE gel can be
identified at an early stage in the procedure by the appearance of smeared bands
on CSGE gels, not present on polacrylamide:bis mini gels, even with a dilution
of the CSGE sample. Once PCR conditions have been identified that give sharp
single bands on CSGE gels, test samples can be amplified, heteroduplexed,
and screened by CSGE.
1.7. Heteroduplexing DNA Samples
DNA heteroduplexes are formed between mismatched wild-type and mutant
DNA fragments. The heteroduplexing method is a simple two-step process
involving an initial denaturing stage, where hydrogen bonds between paired
nucleotides are broken, producing single-stranded DNA fragments. This denaturing step involves heating the sample to 98°C for 5 min. The second step, or
annealing stage, involves cooling the sample to 65°C for 30 min (see Note 4).
At this temperature, the DNA can reform back into double-stranded DNA, with
the possibility of each sense strand pairing with a different antisense strand
(Fig. 1). Heteroduplexes are formed when the new paired strands differ in
sequence by one or more nucleotides. For inherited disorders, the inheritance
pattern of the expected nucleotide change requires consideration. Males posses
only one copy of X-linked genes, such as FVIII. For their analysis, a PCR
sample from a normal individual is mixed with the patient’s sample, enabling
the two (potentially different) alleles to mix and form heteroduplexes. Five
microliters each of patient plus control PCR product are mixed and overlaid
with mineral oil to avoid evaporation during heteroduplexing (see Note 5). In
the situation where the subject is expected to be heterozygous for a mutation,
such as female carriers of hemophilia, PCR product is heteroduplexed with its
own normal allele. This also applies to autosomal dominant inherited disorders
such as von Willebrand disease (chromosome 12). Therefore, if heterozygosity
for a defect is expected, heteroduplexing can be added at the end of the PCR
thermocycling and an aliquot loaded directly onto the CSGE gel. Where there
is an uncertainty about the nature of a mutation, samples should be analyzed by
CSGE following both heteroduplexing against self and against a wild-type
sample. The latter technique has been used determine allele frequency in polymorphism analysis (4).
2. Materials
2.1. Gel Preparation
All chemicals were obtained from Sigma, unless specified.
1. 20X TTE (1.78 M Tris, 570 mM taurine, 4 mM EDTA). A Tris-taurine buffer
system was developed for CSGE gels, as it is more alcohol tolerant than the traditional Tris-borate buffer. A 500-mL stock solution of 20X TTE can be used for
142
Williams and Goodeve
Fig. 1. Illustration of the heteroduplexing reaction between normal or wild-type
DNA and mutant DNA. (Top) Prior to heteroduplexing, both DNA strands exhibit
Watson–Crick base-pairing. At the mutation site, wild-type pairing is presented as
G-C and the mutated nucleotide as A-T. Following the heteroduplexing reaction, both
homoduplex and heteroduplex DNA are formed (bottom). In homoduplexed DNA,
original base-pairings are reinstated of wild-type G-C and mutant A-T. Heteroduplex
DNA is formed where wild-type and mutant DNA strands are paired, which differ by
one or more nucleotides. In this example, the two heteroduplexed species formed have
non-Watson–Crick base-pairings of G-T and A-C. DNA heteroduplexes such as these
can be resolved from DNA homoduplexes, because of their induced conformation
under mildly denaturing conditions by CSGE.
five CSGE gel runs, including subsequent staining procedures, and can be kept at
room temperature for approx 4 mo.
2. 99:1 Acrylamide:BAP (40%). The crosslinker bisacryloylpiperazine (BAP) has
been reported to be a more efficient crosslinker than bis(N,N-methylene
bisacrylamide) in its ability to improve the CSGE gel resolving capacity and to
Conformation-Sensitive Gel Electrophoresis
3.
4.
5.
6.
7.
8.
enhance the physical strength of polyacrylamide gels. A 500 mL gel mix contains 198 g of solid acrylamide (BDH) (see Note 6) and 2 g of BAP (Fluka). Once
dissolved, this stock is kept at 4°C and has a shelf life of 4 mo.
Gel loading buffer: 50% glycerol, 0.25% xylene cyanol, 0.25% bromophenol
blue. The ingredients are mixed and dissolved in water.
10% Ammonium persulfate (APS). Used in the polymerization of acrylamide
gels. A solution of 10% (w/v) APS dissolved in water is made fresh every 2 wk.
Reduced APS activity prolongs the polymerization reaction.
Ethidium bromide (EtBr, 10 mg/mL). Used in powder form and dissolved in water
to yield a concentration of 10 mg/mL. Care must be taken in the preparation,
handling, and disposal of this solution (see Note 7).
Gel rigs. Electrophoresis equipment required for running CSGE gels are of a
standard design and have few special requirements. Electrophoresis tanks used
for manual sequencing can be used for CSGE and make a good starting point to
“test” the procedure. Preferably, shorter rigs should be used to minimize wasted
gel space. For this reason, we use gel tanks which are 410 mm × 330 mm
(Flowgen).
Gel plates. The glass plates are a standard plain and lugged glass plate set,
dimensions 410 mm × 330 mm, with a siliconized lugged plate. One-millimeter
spacers and 1-mm castle combs are used in casting CSGE gels. The thickness of
the gel will affect its run time, heat dissipation, and the strength of the gel during
the later handling stages. Once the lugged glass plate has been siliconized and
both plates cleaned with 70% ethanol, the plates can be sealed using electrical
tape (Genetic Research Instrumentation Ltd., code AFT/UT), to prevent leaking
of the gel during casting.
Combs. One-millimeter castle combs (Web Scientific, special request) are used
to cast a CSGE gel with overall comb dimension width 280 mm, depth 35 mm,
and thickness 10 mm. Each comb has 40 teeth, but it can be cut in half to give two
equal-sized combs of 20 teeth to use with standard sequencing-sized plates. The
well dimensions are important to prevent overloading of the well. Well dimensions are 5 mm width, 10 mm depth, and 2 mm well separation.
2.2. Casting the Gel
1.
2.
3.
4.
5.
6.
7.
8.
9.
10.
143
(40%) 99:1 acrylamide:BAP.
20X TTE buffer.
Formamide.
Ethylene glycol.
Deionized water.
10% Ammonium persulfate (APS).
TEMED (N,N,N',N'-tetramethylethylenediamine).
Sealed glass plates (1 mm-thick spacers and comb).
Bulldog clips.
50 mL syringe with a 21-gauge needle.
144
Williams and Goodeve
2.3. Loading and Running the Gel
1.
2.
3.
4.
5.
6.
7.
8.
One precast CSGE gel, prepared as in Subheading 3.1.
One gel running rig.
One power pack (range 100 –1000 V).
2 L of 0.5X TTE buffer (dependent on capacity of gel running rig reservoir).
Glycerol loading buffer.
Heteroduplexed DNA samples (see Subheading 1.7.).
Positive and negative control samples (see Note 8).
50 mL syringe with a 21-gauge needle.
2.4. Staining and Viewing the Gel
1. One CSGE gel (loaded and electrophoresed for 16 –17 h).
2. Two large staining trays, large enough to accommodate the plain glass plate (e.g.,
photographic developer tray; one for staining and one for destaining).
3. Plate separator (e.g., plastic wedge tool from Hoeffer).
4. 2 L of 0.5X TTE.
5. 2 L of deionized water.
6. Ethidium bromide (10 mg/mL).
7. Sharp scalpel.
8. Two sheets of 3MM blotting paper (Whatman) (area should be larger than that of
the gel).
9. Water bottle containing deionized water.
10. Hand-held UV light (302 nm).
11. UV transilluminator (302 nm).
12. Gel documentation system.
3. Methods
3.1. Gel Preparation
1. For 175 mL of CSGE gel mix (10% 99:1 acrylamide:BAP, 0.5X TTE, 15%
formamide, 10% ethylene glycol), mix:
Sterile water
81.38 mL
99:1 acrylamide:BAP
43.75 mL
20X TTE
4.38 mL
Formamide
26.25 mL
Ethylene glycol
17.50 mL
2. To polymerize the gel, add 1.75 mL of 10% APS and 100 µL TEMED (see
Note 9).
3. Mix well and pour into prepared sealed glass plates. (The gel mix can be injected
into the space between the plates using the 50-mL syringe. To minimize the
occurrence of air bubbles, the gel mix should be introduced down the inside edge
of the plate.)
4. Once full, the plate should be laid horizontally with the open end elevated slightly
(place top, open end of glass plate on a universal).
Conformation-Sensitive Gel Electrophoresis
145
5. Insert comb into the mouth of the glass plates at the required well depth. (To
prevent the introduction of air bubbles, the gel plates can be overfilled before
comb insertion).
6. Clamp the gel plates together with bulldog clips, starting from the bottom of the
plates. Allow the gel mix to run out of the mouth of the plates and past the comb.
7. Check that the comb has not been dislodged and clamp firmly into place.
8. Leave the gel to polymerize for at least 1 h in this position, checking regularly for
leaks. If leaks do occur, top up gently with the remaining gel mix.
3.2. Loading and Running the Gel
1. Remove comb from precast CSGE gel (see Note 10).
2. Slit the tape at the bottom of the gel with a scalpel blade to allow buffer access
and place gel in electrophoresis apparatus.
3. Add 0.5X TTE to fill reservoirs.
4. Gently clean wells with 0.5X TTE buffer from reservoir using 50 mL syringe and
needle (see Note 11).
5. Prerun gel at 750 V for 1 h.
6. Turn off power and clean out all wells again with 0.5X TTE (see Note 11).
7. Pipet 2 µL aliquots of loading buffer onto parafilm (parafilm can be temporarily
attached to the workbench by wetting with a small amount of water).
8. Mix 2 – 8 µL of heteroduplexed sample with 2 µL loading buffer and load onto the
CSGE gel (see Notes 2 and 5).
9. Depending on the speed of sample loading, wells should be washed out every
four to five wells with the syringe containing 0.5X TTE buffer. Care must be
taken not to elute samples already loaded onto the gel.
10. Once all samples have been loaded, electrophorese at 400 V (10 V/cm) for 16–17 h
at room temperature (the second dye front, xylene cyanol, will run at about 200 bp).
3.3. Staining and Viewing the Gel
1. Make space on a workbench close to the gel documentation system (e.g., darkroom).
2. Fill staining tray with 2 L of 0.5X TTE and add 200 µL of EtBr (10 mg/mL) and
mix well.
3. Add 2 L of water to the destaining tray.
4. Turn off electrophoresis power supply from gel rig and take CSGE gel to the
designated staining area.
5. Place gel face up on the work surface and remove sealing tape. The CSGE gel
can be exposed by removing the top, siliconized, lugged plate with a plate separator. The CSGE gel should stick to the plain glass plate (see Notes 12 and 13).
6. Carefully lower gel and plate into staining tray (gel face up) and leave for 10 min.
7. Drain off excess buffer and lower gel into destaining tray for 10–15 min (gel face up).
8. After destaining, carefully drain off excess water and place plate and gel on work
surface (gel face up).
9. The CSGE gel can be transferred from the glass plate to 3MM blotting paper by
covering the gel with two sheets of 3MM paper. Apply firm pressure to obtain
good contact between the gel and blotting paper.
146
Williams and Goodeve
10. Carefully peel back the blotting paper, ensuring that the CSGE gel is firmly
attached.
11. Place gel face up on the work surface.
12. Locate bands by visualizing the gel with a hand-held UV light (302 nm) and
excise relevant portions of DNA band containing gel using the scalpel blade (see
Notes 13 and 14).
13. Wet the surface of the UV transilluminator with deionized water from the water
bottle.
14. Place the excised gel section face down on the wet transilluminator.
15. Wet the 3MM paper with water from the water bottle and peel off the 3MM
paper, leaving the excised gel section on the UV transilluminator (see Note 15).
16. Visualize bands in the gel using the UV transilluminator and document results
(see Note 16).
3.4. Gel Banding Patterns
The CSGE results often reflect the nature of the nucleotide change. The
variation in enhancement or retardation of DNA migration of heteroduplexes
from homoduplexes will mainly depend on the type or nature of the nucleotide
change. The overall fragment size, sequence composition, and flanking nucleotide sequence at the mutation site will also play a role in the degree of DNA
band separation during polyacrylamide gel electrophoresis.
Small insertions or deletions of one or a few base pairs produce the largest
band separations, because of an increased conformational change from wildtype DNA. In these cases, all four possible reannealled conformations can
often be seen on CSGE gels (Figs. 2 and 3). Single-nucleotide substitutions
produce less marked band separations, because of the small conformational
change induced. Results obtained from CSGE gels detecting different nucleotide substitutions, insertions, or deletions will vary dramatically.
Most banding patterns produced by single-nucleotide substitutions can be
easily identified when compared to wild-type homoduplex DNA. Some heteroduplexes only induce a slight retardation or enhancement of migration during polyacrylamide gel electrophoresis. These CSGE patterns consist of a
single band, which is slightly thicker in width than wild-type DNA. These “fatter” bands can mimic an overloaded well and the nucleotide substitution can be
overlooked. An extensive visual examination of the CSGE gel is essential for
comparing all samples with normal or wild-type DNA. After gel documentation, all altered banding patterns must be investigated, either by a repeat CSGE,
possibly with loading less DNA, or direct sequencing of the sample. All
samples displaying altered CSGE migration should then be sequenced to determine the nature of the nucleotide change (see Chapter 10).
Conformation-Sensitive Gel Electrophoresis
147
Fig 2. FVIII gene, exon 6 (423 bp): Lane 1, negative control, heteroduplexed against
self; lane 2, heteroduplexed sample with an A to G substitution; lane 3, heteroduplexed
sample with a 2-bp insertion of CC; lane 4, heteroduplexed sample with a single-base
deletion of a T.
Fig 3. FVIII gene, exon 8 (547 bp): Lane 1, negative control heteroduplexed against
self; lane 2, heteroduplexed sample with an A to G substitution; lane 3, heteroduplexed
sample with an A to G substitution and a C to T substitution, hence the different banding pattern; lane 4, heteroduplexed sample with an A to G substitution.
Figs. 2 and 3. CSGE gel stained with ethidium bromide and visualized under UV
light. All samples have been mixed with a negative control or wild-type sample of
equal concentration and subjected to the heteroduplexing reaction, 98°C for 5 min,
65°C for 30 min). Each lane contains a total of 5 µL heteroduplexed PCR product
mixed with 2 µL dye and electrophoresed at 400 V for 17 h on a 10% polyacrylamide
get (99:1, acrylamide:BAP), 0.5X TTE, 15% formamide, 10% ethylene glycol).
148
Williams and Goodeve
4. Notes
1. Stock of 40% (w/v) acrylamide: 2.105% (w/v) N,N-methylene bisacrylamide
ratio 19:1.
2. Both well preparation and sample loading are an essential part in obtaining
reproducible results. When loading the gel, keep the sample volume to a minimum and allow it to cover the bottom few millimeters of the well.
3. Homemade PCR buffer (10X) is 166 mM (NH4)2SO4, 670 mM Tris-HCl, pH 8.8,
67 mM MgCl2, 2% β-Mercaptoethanol, and 1 mg/mL bovine serum albumin
(BSA). The latter two ingredients are added immediately prior to use. Commercial PCR buffer (1X) is 16 mM (NH4)2SO4, 67 mM Tris-HCl, pH 8.8, 0.1%
Tween-20.
4. DNA thermocyclers, hot blocks, hot ovens, and water baths can all be used for
heteroduplexing PCR product.
5. This will give a total sample volume of 10 µL, of which 2 – 8 µL can be loaded
onto the CSGE gel. Where PCR product volume is limited, each PCR product
can be reduced to, for example, 3 µL, providing a total volume to load of 5 µL.
Where one PCR sample is at a lower concentration, volumes mixed should be
adjusted to produce equal DNA concentrations to be mixed together.
6. Care must be taken when handling solid acrylamide. Always read safety guidelines before attempting to make solutions.
7. Ethidium bromide is mutagenic. Care must be taken in its use and disposal.
8. A “heterozygous” positive control sample should be loaded with each CSGE run
to ensure that the gel has run properly and is capable of heteroduplex detection.
Samples with a known polymorphism or mutation genotype can be used. A negative control must also be included where wild-type DNA is heteroduplexed to
self. For samples that require mixing with wild-type DNA, the same wild-type
DNA should also be used in the negative control. A negative control should be
incorporated into the CSGE screening procedure for each DNA fragment studied, for comparison with band characteristics of heteroduplexed samples.
9. The CSGE gels should be prepared, polymerized, and electrophoresed on the
same day. Keeping the CSGE gel overnight, even in a cold room, may affect
results.
10. Combs must be removed from the gel without disfiguring the wells. The loaded
sample will take up the shape of the well, so avoid loading misshapen wells.
These can be marked on the glass plates with a marker pen prior to loading and
then avoided during loading. Vacuum pressure may also cause wells to collapse
when the comb is removed. Two methods are available to remove combs; in both
instances, unpolymerized liquid acrylamide is first removed by blotting the area
around the comb with blue roll or tissue, enabling air to enter the well space more
freely. The first method involves carefully coaxing the comb out of the well space
at the same time as allowing air to enter the well space. The second method
involves the separation of the lugged glass plate from the cast gel. With the gel
laid flat and open face up on the bench, a sharp object, such as the point of a pair
of scissors, can be inserted in the center of the gel plate between the comb and the
Conformation-Sensitive Gel Electrophoresis
11.
12.
13.
14.
15.
16.
149
plate (in a gap between the teeth of the comb) and rotated slightly. The gel will be
seen to come away from the glass plate and the comb can be removed with ease.
This will not affect the running of the gel.
The syringe can be filled from the top reservoir, providing that there is buffer
remaining to cover the wells. Take care when placing the needle onto the syringe.
With constant pressure, the needle tip can be inserted into each well, but avoiding
touching the well base. Salts collecting at the base of the well will be seen as a
viscous liquid.
The CSGE gels can stretch when mishandled, mainly at the edges where the gel
has come away from the glass plate. Care must be taken to avoid agitating the gel
when staining and destaining. A CSGE gel that has become unstuck from the
plain glass plate will grow a few centimeters in all directions. Therefore, stretching the gel can affect the results and must be avoided.
Make a note of the orientation of the gel. Cut a corner off each segment of the gel
to indicate the location of the first sample loaded.
To help to locate the DNA bands when using the hand-held UV light, samples of
similar size should be loaded in clusters. The detection of minor changes is
improved when samples are loaded adjacent to a wild-type sample or negative
control. Samples will not be visualized with a hand-held UV light before the gel
is transferred from the glass plate to the blotting paper.
The procedure of transferring the CSGE gel with 3MM paper can be repeated, if
required, to reposition the gel for accurate documentation.
It is important to document all CSGE results. Banding patterns can vary from
large band separations to slightly thicker bands when compared with the negative
control. All banding patterns that differ from the negative control must be treated
as a positive result until proven otherwise.
References
1. Ganguly, A., Rock, M. J., and Prockop, D. J. (1993) Conformation-sensitive gel
electrophoresis for rapid detection of single-base differences in double-stranded
PCR products and DNA fragments: evidence for solvent induced bends in DNA
heteroduplexes. Proc. Natl. Acad. Sci. USA 90, 10,325 –10,329.
2. Bhattacharyya, A. and Lilley, D. M. J. (1989) The contrasting structures of mismatched DNA sequences containing looped-out bases (bulges) and multiple mismatches (bubbles). Nucl. Acids Res. 17, 6821– 6840.
3. Ganguly, A. and Prockop, D. J. (1995) Detection of mismatched bases in double
stranded DNA by gel electrophoresis. Electrophoresis 16, 1830–1835.
4. Williams, I. J. Abuzenadah, A. Winship, P. R. Preston, F. E. Dolan, G. Wright, J.
et al. (1998) Precise carrier diagnosis in families with haemophilia A: use of conformation sensitive gel electrophoresis for mutation screening and polymorphism
analysis. Thromb. Haemost. 79, 723–726.
5. Hinks, J. L., Winship, P. R., Makris, M., Preston, F. E., Peake, I. R., and
Goodeve, A. C. (1999) Conformation sensitive gel electrophoresis for precise
haemophilia B carrier analysis. Br. J. Haematol. 104, 915–918.
150
Williams and Goodeve
6. Körkkö, J., Annunen, S., Pihlajamaa, T., Prockop, D. J., and Ala-Kokko, L. (1998)
Conformation sensitive gel electrophoresis for simple and accurate detection of
mutations: Comparison with denaturing gradient gel electrophoresis and nucleotide sequencing. Proc. Natl. Acad. Sci. USA 95, 1681–1685.
7. Ganguly, G., Dhulipala, R., Godmilow, L., and Ganguly, A. (1998) High throughput fluorescence-based conformation-sensitive gel electrophoresis (F-CSGE)
identifies six unique BRCA2 mutations and an overall low incidence of BRCA2
mutations in high-risk BRCA1-negative breast cancer families. Hum. Genet. 102,
549–556.
8. Ganguly, A. and Williams, C. (1997) Detection of mutations in multi-exon genes:
Comparison of conformation sensitive gel electrophoresis and sequencing strategies with respect to cost and time for finding mutations. Hum. Mut. 9, 339–343.
9. Williams, C. J., Rock, M., Considine, E., McCarron, S., Gow, P., Ladda, R., et al.
(1995) Three new point mutations in type II procollagen (COL2A1) and identification of a fourth family with the COL2A1 Arg519(Cys base substitution using
conformation sensitive gel electrophoresis. Hum. Mol. Genet. 4, 309–312.
10. Williams, C. J., Ganguly, A., Considine, E., McCarron, S., Prockop, D. J., WalshVockley, C., et al. (1996) A-2(G Transition at the 3' acceptor splice site of IVS17
characterises the COL2A1 gene mutation in the original stickler syndrome kindred. Am. J. Med. Genet. 63, 461–467.
11. Beauchamp, N. J., Daly, M. E., Makris, M., Preston, F. E., and Peake, I. R. (1998)
A novel mutation in intron K of the PROS1 gene causes aberrant RNA splicing
and is a common cause of protein S deficiency in a UK thrombophilia cohort.
Thromb. Haemost. 79, 1086–1091.
12. Abuzenadah, A. M., Gursel, T., Ingerslev, J., Nesbitt, I. M., Peake, I. R., and
Goodeve, A. C. (1999) Mutational analysis of the von Willebrand disease.
Thromb. Haemost. (Suppl. A) Abstract 887.
13. Gari, M., Goodeve, A. C., Wilson, G., Winship, P. R., Langabeer, S., Linch, D.,
et al. (1999) c-kit proto-oncogene exon 8 in frame deletion plus insertion mutations in acute myeloid leukaemia. Br. J. Haematol. 10, 894–900.
14. Markoff, A., Sormbroen, H., Bogdanova, N., Priesler-Adams, S., Ganev, V.
Dworniczak, B., et al. (1998) Comparison of conformation-sensitive gel electrophoresis and single-strand conformation polymorphism analysis for detection of
mutations in the BRCA1 gene using optimised conformation analysis protocols.
Eur. J. Hum. Genet. 6, 145–150.
SSCP/Heteroduplex Analysis
151
16
SSCP/Heteroduplex Analysis
Andrew J. Wallace
1. Introduction
Single-strand conformation (SSCP) and heteroduplex analysis are separate
mutation scanning methods in their own right. They are, however, unusual in
that they can be carried out simultaneously on a single gel.
The technique of SSCP analysis was originally described in 1989 (1). It
involves the heat denaturation of polymerase chain reaction (PCR) amplified
DNA followed by electrophoresis under nondenaturing conditions. The fragments in the original protocol were visualized by radiolabeling and autoradiography, although a variety of nonisotopic methods are now available,
including silver staining (2), fluorescent labels (3), and ethidium bromide staining (4). The SSCP technique relies on the propensity for single-stranded DNA
(ssDNA) in nondenaturing conditions to take on a three-dimensional, or secondary, structure that is highly sequence dependent. Consequently, sequence
differences can cause alterations to the DNA’s secondary structure. Because
the electrophoretic mobility of DNA under nondenaturing conditions is dependent on its shape as well as other factors like charge, point mutations can give
rise to mobility shifts. The gels used for SSCP are usually native acrylamide,
typically with a low level of crosslinking (49:1), although there is a great deal
of variability between published protocols. The low level of crosslinking gives
a large pore size, thus permitting efficient separation of the bulky structures
that ssDNA forms under these conditions. The detection efficiency of SSCP
is highly variable, the most important parameter to consider is fragment size.
The optimum sensitivity is with fragments as small as 150 bp, where under a
single condition, 90% of mutations are detected (5).
Heteroduplexes are hybrid DNA molecules that, although largely matched,
have one or more mismatched base pairs. Heteroduplexes have been used as a
From: Methods in Molecular Biology, vol. 187: PCR Mutation Detection Protocols
Edited by: B. D. M. Theophilus and R. Rapley © Humana Press Inc., Totowa, NJ
151
152
Wallace
tool to scan for point mutations since 1992 (6). They typically appear on native
polyacrylamide gels as one or two bands of reduced mobility relative to the
homoduplex DNA. The mismatched bases present in heteroduplexes are thought
to affect electrophoretic mobility by inducing bends in the DNA (7). Because two
different DNA sequence variants must be present to form heteroduplexes, they
may need to be created for some types of analysis. For example, in order to
analyze male samples for loci on the X chromosome by heteroduplex analysis,
heteroduplexes can be created by mixing, denaturing, and annealing the test
sample PCR amplification with a known normal control amplification. In
heterozygotes, however, heteroduplexes form as a natural by product of PCR
reactions. During the latter stages of PCR amplification, when the polymerase
activity is limiting, some of the denatured ssDNA can spontaneously reanneal
without primer extension with an opposite strand from the other allele, thus
creating heteroduplex DNA.
Heteroduplex analysis is carried out by electrophoresis of the fragment of
interest on long (usually polyacrylamide) gels with low ratios of crosslinking.
Heteroduplexes have been visualized using radioisotopes (6), silver staining
(2), and ethidium bromide staining (8). Fluorescent labeling should also be
theoretically possible. The detection efficiency of heteroduplex analysis has
been reported to approach 90% under ideal conditions (7) and the optimum
size, 250–500 bp, is not as tightly defined as SSCP.
Combined SSCP/heteroduplex analysis exploits the tendency for a proportion of the DNA denatured during sample preparation for SSCP to spontaneously reanneal to form dsDNA and, hence, heteroduplexes when there are
sequence differences in the sample. The gel conditions for both SSCP and heteroduplex analysis are compatible and so it is possible to get “two techniques
for the price of one.” There are, however, some limitations to the technique;
foremost among these is that the dsDNA, with which the heteroduplexes are
associated, have a much higher mobility than the SSCPs formed by the ssDNA.
This limits the electrophoresis time in order to retain the dsDNA on the gel,
reducing the resolution of the SSCPs. In practice, the loss of sensitivity is more
than made up for by the complementarity between the two techniques, a point
evinced by the observation that every one of 134 different cystic fibrosis transmembrane conductance regulator (CFTR) mutations are detectable by a combined SSCP/heteroduplex strategy (9). Consequently, a combined SSCP/
heteroduplex approach is now used more frequently by laboratories than either
technique alone.
2. Materials
2.1. Preparation and Electrophoresis of SSCP/Heteroduplex Gels
1. S2 or SA32 sequencing gel system (Gibco-BRL; cat. nos. S2–21105-036 and
SA32–31096-027) (see Note 1).
SSCP/Heteroduplex Analysis
153
2. 1-mm-thick combs and spacers. These are a nonstandard thickness and need to
be custom-made to order.
3. Acrylamide powder preweighed (49:1 acrylamide:bis-acrylamide) (e.g., Sigma;
cat. no. A0924). Dissolve according to the manufacturer’s instructions with
deionized water to make a 40% stock solution and store at 4°C. Use within 1 mo
(see Notes 2 and 3).
4. TEMED (N,N,N',N'-tetramethylethylenediamine) (e.g., Sigma; cat. no. T7024).
5. 10% Ammonium persulfate solution (10% AMPS) (e.g., Sigma; cat. no. A9164).
Make up fresh on the day of use.
6. 10X TBE electrophoresis buffer (e.g., Gibco-BRL; cat. no. 15581-036). Use
within 1 mo of opening.
7. Formamide loading buffer: 10 mL deionized formamide, 200 µL of 0.5 M
EDTA, pH 8.0, 15 mg xylene cyanol, 3 mg bromophenol blue. Store at room
temperature.
8. Electrophoresis power pack capable of maintaining 600 V and with a voltage
preset.
9. Access to a 4°C cold room or cold cabinet with power supply (see Note 4).
10. Flat gel loading tips (e.g., Life Sciences International; cat. no. PP000-0GEL-F01).
2.2. Silver Staining and Drying of SSCP/Heteroduplex Gels
1. Plastic photographic style staining trays (e.g., Jencons Scientific; part no.
682-172).
2. Orbital shaker.
3. Silver staining solution 1: 10% industrial methylated spirit, 0.5% glacial acetic
acid. Store at room temperature. Solution 1 may be recycled up to 10 times.
4. Silver staining solution 2: 0.1% AgNO 3. Prepare as a 10X stock solution (1%
AgNO3). Store at room temperature in a brown bottle. Prepare and store the 1X
working solution in a clear bottle so that any precipitate is clearly visible, an
indication that the solution should not be used. Both the 10X stock and the 1X
working solution should be stored out of direct sunlight. The 1X working solution
may be reused to stain up to three gels.
5. Silver staining solution 3: 1.5% NaOH, 0.15% formaldehyde (see Note 5). This
solution is labile and the formaldehyde should only be added immediately prior
to use. The 1.5% NaOH may be made up in bulk and stored at room temperature.
6. Silver staining solution 4: 0.75% Na 2CO3. Make as a 10X stock and dilute down
as necessary;, store the 10X stock at room temperature.
7. Gel drying frame and platform (e.g., Pharmacia Biotech; part no. 80-6122-37 and
80-6122-94).
8. Cellophane sheets (e.g., Pharmacia Biotech; part no. 80-6121-99).
3. Methods
3.1. Preparation and Electrophoresis of SSCP/Heteroduplex Gels
1. Wash a suitable comb, pair of glass plates, and spacers thoroughly with warm
water and a household detergent. Rinse with deionized water and dry with disposable tissues.
154
Wallace
2. Lay the glass plates on a clean section of the bench and wipe with a disposable
tissue soaked in 100% ethanol.
3. Smear the spacers with Pritt™ or an equivalent paper adhesive to prevent them
from slipping while assembling and pouring the gel. Assemble the glass plates
and spacers as shown in Fig. 1A,B using four strong binder clips to to hold the
plates together.
4. Lay the gel plates, short plate uppermost, on a box or upturned Eppendorf rack on
a flat section of benching.
5. For an 8% gel for the SA32 system, place the following reagents in a clean dry
beaker:
15 mL 40% (49:1) acrylamide solution;
7.5 mL of 10X TBE solution;
52 mL dH2O;
90 µL TEMED.
For the S2 system all these volumes should be doubled (see Notes 2, 4, and 6).
6. Add 500 µL (for SA32 gel) or 1 mL (for S2 gel) of freshly prepared 10% AMPS
solution to the acrylamide solution and mix thoroughly by gently swirling.
7. Carefully draw the acrylamide solution into a 50-mL disposable syringe, avoiding introducing air bubbles.
8. Rest the nozzle of the syringe on the protruding portion of the long glass plate,
about 2 mm from the edge of the short plate, and slowly expel the contents of the
syringe. The acrylamide solution should run down between the plates quite evenly
by capillary action (Fig. 1A). The syringe will need to be refilled three to four
times for the S2 system. Gently tapping the glass plates just ahead of the
acrylamide solution can help to prevent the formation of trapped air bubbles.
9. Once the acrylamide has completely filled the space between the plates, any air
bubbles can be removed using a hook-shaped “bubble catcher.” The comb should
then be carefully inserted while avoiding the introduction of further air bubbles.
The gel should be left to polymerize at room temperature for at least 1 h preferably 2 h.
10. Remove the comb and straighten any uneven wells using an old gel loading tip.
11. Place the gel in the electrophoresis apparatus and firmly tighten the four locking
nuts. Close the drain tap for the upper buffer chamber and fill the upper buffer
chamber with 1X TBE. Check for leaks by leaving the gel for 10 min and inspecting the lower buffer chamber.
12. Fill the lower buffer chamber with 1X TBE and leave the whole apparatus to
equilibrate for at least 4 h at 4°C (see Notes 4 and 7).
13. Combine the PCR amplification with an equal volume of formamide loading
buffer (typically 10 µL) and mix well (see Notes 8–10).
14. Place the samples on a heated block or thermal cycler set at 94°C for 3 min then
snap-chill in a bath of crushed ice.
15. Load between 6 and 12 µL of each sample (the optimum volumes depend on the
size of well and amplification efficiency) in each well using flat gel loading tips.
SSCP/Heteroduplex Analysis
155
Fig. 1. Assembly of glass plates for S2/SA32 sequencing system and pouring without tape: (A) view from above to illustrate the pouring of the gel on a horizontal bench
using a syringe; (B) profile view to illustrate the position of the foam block against the
short upper plate, which forms a watertight seal against the gel tank gasket.
16. Electrophorese for typically 16 h at a constant voltage of 370 V (for SA32 gel) or
450 V (for S2 gel).
17. After 16 h the xylene cyanol should have run to the end of the aluminum cooling
plate on an 8% gel. Double-stranded DNA (heteroduplexes) of about 180 bp
comigrates with the xylene cyanol on an 8% gel, although there can be considerable sequence-dependent variability. It is best to determine optimum electrophoresis times empirically.
3.2. Silver Staining and Drying of SSCP/Heteroduplex Gels
1. Slide one of the spacers out from between the glass plates and gently prise apart
with a plastic spatula or other nonmetal instrument. Ensure that the gel is attached
to the lowermost plate before completely removing the upper plate. Mark the gel
orientation by removing a corner adjacent to lane 1. For S2 gels, cut the gel vertically in half for staining by applying pressure on the gel with the edge of a ruler.
156
Wallace
2. Carefully lift the bottom edge of the gel and fold over a 10-cm length. Repeat this
action until the gel is completely rolled up; then, place the plate in a clean staining tray and dislodge or lift the gel into the tray. For S2 gels, place each half in a
separate tray.
3. Pour on 400 mL of silver staining solution 1 and leave on an orbital shaker for
about 5 min. In the specified trays, the gel should unfurl to a degree but remain
folded in half during the staining process.
4. Pour off solution 1 (see Note 11) and save for reuse. Pour on 500 mL of silver
staining solution 2 and shake gently for 15 min (see Note 12).
5. Pour off solution 2, remembering to reuse for up to three gels. Add 400 mL of
freshly prepared silver staining solution 3 (see Note 5). Place the tray in a fume
cabinet and leave for 20 min, shaking occasionally. A small amount of powdery
black precipitate should be observed when solution 3 is added and the bands
slowly appear on the gel during this stage.
6. Pour off solution 3 and rinse the gel twice with deionized water. Add 400 mL of
silver staining solution 4 and leave for 15 min (see Notes 13–15).
7. Take two sheets of precut cellophane and soak in a sink of tap water. The sheets
become pliable when wet; ensure that the whole sheet is adequately soaked.
8. Place a drying frame inner section over the platform, ensuring that the inner section is in the correct orientation. Place a moistened sheet of cellophane over the
inner section, ensuring that the whole of the inner section is covered.
9. Gently slide an old sheet of X-ray film under the gel while still in solution 4.
Carefully pour off solution 4 and rinse the gel briefly twice with tap water. Lift
the gel out of the staining tray using the X-ray film as a support onto a clean area
of benching or plastic sheet. The gel can now be carefully unfolded and unwanted
areas of the gel trimmed away by pressing with the edge of a ruler. If the whole
gel is to be dried down, then the gel will have to be cut in half and dried down in
two separate frames.
10. Transfer the gel onto the cellophane sheet placed over the drying frame and wet
the gel surface with a few milliliters of deionized water from a wash bottle.
11. Carefully lay the second sheet of moistened cellophane over the top of the gel
and frame, taking care not to trap air bubbles between the sheets. Place the outer
section of the drying frame firmly over the inner section’s rubber gasket. The
cellophane should now be drawn taut and the frame can be carefully lifted off the
platorm.
12. Turn the retaining screws 90° to retain the inner frame in position and trim any
surplus cellophane away with a pair of scissors. Wipe away excess water with a
disposable tissue and leave the frame to dry either on a warm shelf for 24 h or in
a 37°C incubator for 6 h (see Note 16).
13. Once the gel is thoroughly dry, dismantle the frame and cut excess cellophane
away from the dried gel with scissors. Seal the cellophane by folding strips of
adhesive tape around all of the edges. This prevents the cellophane from peeling apart.
SSCP/Heteroduplex Analysis
157
Fig. 2. SSCP/heteroduplex (HD) analysis of CFTR exon 3 (309 bp). Lanes 1–10
are test samples; lanes 11–16 are heterozygote mutation controls. The mutant
controls are as follows: lane 11—P67L(nt332c→t); lane 12—R75X(nt355c→t); lane
13—G85E(nt386g→a); lane 14—L88S(nt395t→c); lane 15—E60X(nt310g→t). Lane
16 is from a heterozygote for the polymorphism R75Q(nt356g→a). Exon 3 gives a typical SSCP pattern of two discrete bands corresponding to the forward and reverse strands.
Note how the patterns of shifts are different for each mutation (i.e., the SSCP pattern of
lanes 13 and 14 are quite similar, but their heteroduplex mobility shifts are completely
different). Also note how both lanes 15 and 16 are not discernible by SSCP analysis
alone, but they give rise to clear and characteristic heteroduplex mobility shifts.
14. Store the dried down gels flat and away from moisture. Avoid bending and folding the gels because they are very brittle (see Note 17).
3.3. Interpretation
1. SSCP/heteroduplex gels are straightforward to interpret. Provided that a control
normal sample is loaded onto each gel, an SSCP shift or heteroduplex of differing mobility is indicative of the presence of a sequence difference. Common polymorphisms may complicate interpretation, but the use of controls of known
polymorphism genotype and experience allows the most complex of combinations to be successfully interpreted (see Figs. 2 – 4 for examples of typical data).
2. ssDNA has a much lower mobility than dsDNA in the native acrylamide gels
used for SSCP/heteroduplex analysis. Consequently, the limiting factor for resolution of SSCP shifts is the need to retain the dsDNA on the gel. For maximum
resolution, the dsDNA should be run as close to the end of the gel as possible.
The ssDNA (SSCPs) tends to stain a reddish brown color, whereas the dsDNA
(heteroduplexes) usually stain a dark gray or black color.
3. A homozygote will typically give rise to two distinct SSCP bands corresponding
to the two complementary strands of DNA. Quite often, more than two SSCP
bands are present, some of which stain more weakly than the others. Assuming
that the PCR is optimized and that no background amplification has taken place,
the subsidiary bands are the result of alternative stable conformations.
158
Wallace
Fig. 3. SSCP/heteroduplex analysis of CFTR exon 23 (223 bp). Lanes 1–7 are
test samples; lanes 8 and 9 are control heterozygotes for the mutations
Q1412X(nt4366c→t) and 4279insA, respectively. Note how lane 3 clearly has a
mobility shift different from the two controls. Direct sequencing revealed that this
sample was heterozygous for the 4326∆TC mutation. Also note how Q1412X gives
rise only to a SSCP shift.
4. Occasionally, a fragment only gives rise to a single SSCP band; this is due to
both complementary strands having identical mobilities, and, generally, does not
lead to loss of sensitivity.
5. Rarely, there is no distinct SSCP band present for a given fragment. Closer inspection of the gel usually reveals the presence of a faint in track smear. This appears
to be caused by the fragment adopting a whole range of conformations, each having
only a slight mobility difference from the next. The presence of a mutation seems
to destroy this balance, leading to the creation of a typical SSCP band.
6. When a genuine SSCP shift is present, the relative staining of the normal bands
in the sample will be reduced relative to those of other normal samples on the
SSCP/Heteroduplex Analysis
159
Fig. 4. SSCP/heteroduplex analysis of CFTR Exon 14a. This fragment at 511 bp is
too large to analyze effectively as one fragment and so has been digested with RsaI to
give rise to a 277-bp and 234-bp fragment (10). There is a frequent polymorphism in
exon 14a (nt2694t→g) that is visible as both SSCP and heteroduplex shifts. Lanes 2
and 6 are heterozygotes for this polymorphism. Lanes 1, 3, and 4 are homozygotes for
the faster migrating allele, whereas lane 5 is a homozygote for the slower migrating
allele. Lanes 7 and 8 are heterozygotes for the polymorphism but also are heterozygotes for the mutations 2711∆T and W846X1(nt2669g→a), respectively. Note how
the presence of these mutations within the same fragment as the polymorphism modifies the appearance of the polymorphism, allowing them to be clearly differentiated.
same gel that have amplified with the same efficiency. This is the result of the
ssDNA being spread over a larger gel volume. This effect can be used to filter out
false positives resulting from spurious amplification.
7. Excess primers left over in unpurified PCR reactions reannealing to the ssDNA
after gel loading can lead to a third set of bands intermediate in mobility to the
160
Wallace
ssDNA and dsDNA. Although they usually show a similar pattern to the standard SSCPs, they can occasionally highlight differences that are not detected
elsewhere.
8. Heteroduplexes usually show as bands of reduced mobility relative to the
homoduplex dsDNA. They are often more weakly staining than the homoduplex
DNA (see Note 8).
9. Occasionally, the homoduplex DNA itself displays mobility shifts. This may be
the result of the presence of an insertion/deletion mutation leading to an alteration in molecular weight. Some single-base substitutions can also give the same
effect. This is thought to be caused by the base substitution causing the DNA to
bend to a greater or lesser degree, thus affecting mobility.
10. Frequently, homozygous normal samples will give rise to two homoduplex bands;
the reason for this is not known.
4. Notes
1. Fluorescent SSCP/heteroduplex analysis is possible. Both the Perkin-Elmer 377
fluorescent analyzer and the 310 capillary electrophoresis instrument have temperature control and are thus suitable for this technique. There are several advantages to this approach. Fluorescent analysis permits multiplexing by dye color, thus
increasing productivity. The gel images are also analyzed and stored electronically, thus avoiding the need to dry down and store gels. The internal size standards commonly used in fluorescent analysis also makes comparisons between
samples more objective (11). However, the major drawback is one of cost, not
only in capital equipment and software but also the fluorescently labeled primers.
2. There are commercial gel matrices specifically marketed for SSCP and heteroduplex analysis, such as Hydrolink and MDE™. They do have different characteristics from the 49:1 acrylamide recommended here. They tend to work out to be
quite expensive for routine use.
3. Acrylamide is a cumulative neurotoxin. Great care should be taken when handling acrylamide powder, solution, and gels. Gloves should be worn at all times
when handling acrylamide. A face mask and fume cabinet should also be used
when adding water to preweighed bottles of acrylamide powder.
4. Gel additives are recommended in many SSCP protocols to improve detection
efficiency. The addition of glycerol in particular is reported to enhance the sensitivity of SSCP analysis (9). Gels containing glycerol should also be run at room
temperature, thus offering an alternative method to workers without access to a
cold room or cabinet. We have found that the detection rate of heteroduplex analysis is compromised in the presence of glycerol, so we can only recommend its use
as an additional condition to enhance the detection rate when this needs to be
maximized. The addition of 10% sucrose to SSCP gels has also been used to
enhance the sensitivity of SSCP (9).
5. Formaldehyde is usually sold as a 37% solution; remember to take this into account
when calculating volumes for solution 3.
SSCP/Heteroduplex Analysis
161
6. There is some evidence that the addition of mild denaturants like 10% urea (6) or
10% ethanediol and 15% formamide (7) can enhance the efficiency of heteroduplex analysis. We have found that these additives reduce the efficiency of SSCP
analysis and are not recommended for combined SSCP/heteroduplex analysis.
7. Replicate gels can vary markedly in appearance; the major causes of variability are
gel quality and environmental factors. Take great care when measuring reagents
and always use fresh 10% AMPS solution. Try to get into a routine so that gels
are always poured at a certain time of the day and left to polymerize and then
equilibrate at 4°C for the same time. Your results will become more reproducible, although some variability should still be expected.
8. The formation of heteroduplex DNA is dependent on spontanous reannealing in
the formamide loading buffer or during the earliest phase of electrophoresis.
Some fragments reanneal very poorly, preventing efficient heteroduplex analysis
and thus reducing the mutation detection rate. This problem can be overcome
simply by preloading the gel with a proportion of the sample in formamide loading buffer (usually 25% of the final volume to be loaded) before heat denaturation of the sample. The remainder of the sample can then be loaded after
denaturation in the same wells and electrophoresis commenced.
9. Larger fragments can be analyzed without loss of detection efficiency by cutting
the sample with an appropriate restriction enzyme to yield fragments of optimum
size (200–250 bp) (Fig. 4) (10). Running both restricted and unrestricted samples
in the same lane can increase efficiency still further because some loss of heteroduplex detection efficiency has been noted within 50 bp of the end of fragments (7).
10. If the gene under analysis is X-linked or mitochondrial in origin, or if the mutation
could be homozygous or hemizygous, the samples should be mixed with a known
normal control DNA and then subjected to a single round of denaturation and renaturation in order to encourage the formation of heteroduplexes prior to loading.
11. Pouring solutions off can be difficult, the gels are large and can easily tear. The
talc on some latex gloves can also mark the gels. Placing a piece of old X-ray
film over the gel while pouring off the solutions helps to support the gel, preventing it from tearing. It also prevents gloves from marking the gels.
12. Contaminating salts or alkali can make silver salts precipitate out in solution 2,
causing the gel to become milky white in appearance. If you continue to stain in
solution 3 once this has happened, these areas will turn black and the gel will be
unreadable. The gel can often be saved by washing twice in dH2O and then
immersing in 2.5% ammonium hydroxide for 15 min followed by two further
washes in dH 2O. Silver staining can then be recommenced with solution 1. However, prevention is better than cure, the most common causes of this are dirty
staining trays and contact with gloves that have been used to prepare solution 3.
Always wash trays thoroughly before use and change gloves after preparing
solution 3 if you need to subsequently pour off solution 2.
13. Sometimes, we have observed gels with bands that fade and disappear while drying down; this is due to solution 4 being made up incorrectly.
162
Wallace
14. It is not possible to isolate and reamplify from silver stained bands with the given
protocol because of the inhibitory effect of residual silver ions on PCR. However, if solution 4 is substituted for a 50 mM solution of EDTA (pH 8.0), then this
chelates the remaining silver ions and permits reamplification from the band of
interest. We have found this to be particularly useful for isolating minority alleles in mosaic samples.
15. Silver-stained gels can be temporarily stored by heat sealing in plastic. However,
the gels are delicate and easily crushed and tend to dry out after 2 –3 yr.
16. High-percentage acrylamide gels (i.e., over 9%) are prone to cracking while drying down. Try to dry these slowly at room temperature rather than in an incubator, as this minimizes cracking.
17. Sometimes, a salty deposit builds up on the surface of old gels, making them
difficult to read. This can be removed by spraying the gel with a little household
polish and then rubbing the gel firmly with a soft cloth.
References
1. Orita, M., Iwahana, H., Kanazawa, H., Hayashi, K., and Sekiya, T. (1989) Detection of polymorphisms of human DNA by gel electrophoresis as single-strand
conformation polymorphisms. Proc. Natl. Acad. Sci. USA 86, 2766 – 2770.
2. Tassabehji, M., Newton, V. E., Turnbull, K., Seemanova, E., Kunze, J., Sperling,
K., et al. (1994) PAX3 gene structure and mutations: close analogies between
Waardenburg syndrome and the Splotch mouse. Hum. Mol. Genet. 7, 1069–1074.
3. Makino, R., Yazyu, H., Kishimoto, Y., Sekiya, T., Hayashi, K. (1992) F-SSCP:
fluorescence-based polymerase chain reaction single-strand conformation polymorphism (PCR-SSCP) analysis. PCR Meth. Applic. 2, 10–13.
4. Hongyo, T., Buzard, G. S., Calvert, R. J., and Weghorst, C. M. (1993) ‘Cold
SSCP’: a simple, rapid and non-radioactive method for optimized single-strand
conformation polymorphism analyses. Nucl. Acids Res. 21, 3637– 3642.
5. Sheffield, V. C., Beck, J. S., Kwitek, A. E., Sandstrom, D. W., and Stone, E. M.
(1993) The sensitivity of single-strand conformation polymorphism analysis for
the detection of single base substitutions. Genomics 16, 325 – 332.
6. White, M. B., Carvalho, M., Derse, D., O’Brien, S. J., and Dean, M. (1992)
Detecting single base substitutions as heteroduplex polymorphisms. Genomics
12, 301–306.
7. Ganguly, A., Rock, M. J., and Prockop, D. J. (1993) Conformation-sensitive gel
electrophoresis for rapid detection of single-base differences in double-stranded
PCR products and DNA fragments: evidence for solvent-induced bends in DNA
heteroduplexes. Proc. Natl. Acad. Sci. USA 90, 10,325 –10,329.
8. Keen, J., Lester, D., Inglehearn, C, Curtis, A., and Bhattacharya, S. (1991) Rapid
detection of single base mismatches as heteroduplexes on Hydrolink gels. Trends
Genet. 7, 5.
9. Ravnik-Glavac, M., Glavac, D., and Dean, M. (1994) Sensitivity of single-strand
conformation polymorphism and heteroduplex method for mutation detection in
the cystic fibrosis gene. Hum. Mol. Genet. 3, 801– 807.
SSCP/Heteroduplex Analysis
163
10. Lee, H.-H., Lo, W.-J., and Choo, K.-B. (1992) Mutational analysis by a combined
application of the multiple restriction fragment-single strand conformation polymorphism and the direct linear amplification sequencing protocols. Anal.
Biochem. 205, 289 – 293.
11. Inazuka, M., Wenz, H. M., Sakabe, M., Tahira, T., and Hayashi, K. (1997) A
streamlined mutation detection sysytem: multicolor post-PCR fluorescence labeling and single-strand conformational polymorphism analysis by capillary electrophoresis. Genome Res. 7, 1094–1103.
150
Wells
CFLP Analysis for Genotyping and Mutation Detection
165
17
Cleavase® Fragment Length Polymorphism
Analysis for Genotyping and Mutation Detection
Laura Heisler and Chao-Hung Lee
1. Introduction
DNA sequencing is the gold standard in DNA diagnostics and is the only
absolute means of establishing the identity of a new mutation. However, the
clinical cost of obtaining this information is often prohibitive, particularly when
large DNA fragments are interrogated for the presence of any of a number of
either known or previously undescribed genetic alterations (1). Instead, several
mutation scanning methods have been developed to eliminate the need to
sequence every nucleotide when it is only the precise identity of one or a few
nucleotides that is clinically significant. Until now such methods have provided only a “yes” or “no” answer in determining whether a test sample differs
from a known reference. Relatively few methods have been proven capable
of unambiguously identifying unique nucleic acid variants, particularly when
multiple sequence changes occur (2). Consequently, the majority of existing
mutation scanning methods are unsuitable for PCR-based genotyping applications in which regions of sequence variability are used to categorize isolates
for their similarities to known variants.
Third Wave Technologies has pioneered a novel mutation and polymorphism screening method that accurately and precisely distinguishes nucleic acid
variants (3). This approach relies on enzymatic cleavage of characteristic structures formed by single-stranded nucleic acids. On sequential denaturation and
renaturation, both single-stranded DNA and RNA molecules assume threedimensional conformations that are a precise reflection of their nucleic acid
sequences (4). This principle is the foundation of several mutation scanning
techniques, such as single-strand conformation polymorphism (SSCP) and
dideoxy fingerprinting (5,6). Instead of relying on direct observation of these
From: Methods in Molecular Biology, vol. 187: PCR Mutation Detection Protocols
Edited by: B. D. M. Theophilus and R. Rapley © Humana Press Inc., Totowa, NJ
165
166
Heisler and Lee
Fig. 1. Structures recognized by the Cleavase I enzyme. The Cleavase I enzyme is
a structure-specific nuclease that recognizes the junctions between single- and doublestranded regions of nucleic acids, i.e., so-called hairpins or stem loops. Cleavage
occurs on the 5' side of such structures (see arrow). These intrastrand structures are
formed when nucleic acid molecules are denatured and then allowed to cool.
structures, e.g., by noting subtle differences in how different DNA strands
migrate through nondenaturing gels, the Third Wave Technologies’ enzymebased approach uses a structure-specific endonuclease engineered from the
nuclease domain of Taq DNA polymerase, dubbed the Cleavase® I enzyme, to
cut DNA strands wherever these structures occur (3) (Fig. 1). By analogy to
restriction fragment length polymorphism analysis, Third Wave has named
their method Cleavase Fragment Length Polymorphism (CFLP®) analysis.
The Cleavase I enzyme rapidly and specifically cleaves these structures,
many of which are formed on a given DNA fragment, albeit transiently, in
equilibrium with alternative, mutually exclusive structures. The CFLP method
is thus able to elucidate a considerable amount of information about the sequence
content of a DNA fragment without relying on cumbersome high-resolution
analysis of each base. Each unique DNA sequence produces a distinctive collection of structures that, in turn, results in the generation of a singular fingerprint for that sequence. This capability makes the CFLP technology suitable
for diverse mutation scanning applications, including genotyping (1,3,7–14).
Furthermore, the CFLP reaction is unaffected by the length of the DNA fragment and can be used to analyze far longer stretches of DNA than is currently
possible with other methods, up to at least 2.7 kb (unpublished data).
1.2. Visualizing Sequence Differences in CFLP Fingerprints
The CFLP method comprises the steps of separation of DNA strands by
heating, formation of intrastrand structures on cooling with rapid enzymatic
cleavage of these structures before they are disrupted by reannealing of the
complementary strands, and separation and visualization of the resulting “structural fingerprint” (Fig. 2). When closely related DNA fragments, such as a
wild-type and a mutant version of a gene, are compared, the CFLP fingerprints
CFLP Analysis for Genotyping and Mutation Detection
167
Fig. 2. CFLP reaction. The CFLP reaction itself is a simple three-step procedure
that relies on the use of temperature to change some of the physical characteristics of
DNA molecules.
exhibit strong familial resemblance to one another such that they share the
majority of bands produced. The sequence differences are revealed as changes
in one or several bands. These unique band changes are visualized as mobility
shifts, the appearance or disappearance of bands, and/or significant differences
in band intensity (Fig. 3).
168
Heisler and Lee
Fig. 3. CFLP analysis of the ITS regions of P. carinii. PCR products spanning the
ITS1 and ITS2 regions of P. carinii, 534 bp long and labeled on the 5' ends of both
strands with TET, were subjected to CFLP analysis. Approximately 250 fmol of
labeled PCR product was analyzed in the “ramped” reactions and approx 150 fmol in
the single temperature reactions. The DNA aliquots were supplemented with DNA
dilution buffer. The ramping assay was performed as described in Subheading 3.2.
The genotypes of the samples from which the DNA was amplified are indicated above
the lanes. Lanes marked “mw” contain molecular weight markets with fragment sizes
as indicated. The gel was electrophoresed at constant wattage (20 W) until a bromophenol blue market dye, loaded in a far lane (not shown), reached the bottom of the
gel. The gel cassette was scanned on a Hitachi FMBIO-100 fluorescence imager with
a 585-nm emission filter.
CFLP Analysis for Genotyping and Mutation Detection
169
CFLP analysis is exquisitely sensitive to the presence of minor sequence
variations and can detect changes involving one or more bases, including missense mutations, with >95% sensitivity and 100% specificity. Because the
CFLP method results in an easily examined pattern, rather than base-by-base
analysis of each sequence, the value of this approach may be even more pronounced in genotyping applications. In these cases, what is sought is the rapid
identification of compound sequence variations occurring throughout an amplified fragment. Rapid inspection of the patterns generated by CFLP analysis of
fragments containing multiple, dispersed base changes has proven to be an
effective approach to classifying bacterial and viral sequences according to
genotype (1,3,11).
Pneumocystis carinii f. sp. hominis is the leading cause of pneumonia and
the most commonly transmitted life-threatening opportunistic infection among
AIDS patients (15). To establish the origin of particular infections, verify
localized outbreaks, and determine whether an individual has sustained multiple, coincident infections, researchers have attempted to classify individual
P. carinii strains based on sequence variability among isolates (16). Sequence
variation in the internal transcribed spacer (ITS) regions of the rRNA genes of
P. carinii can be used for such genotypic identification (17). The region located
between the 18S and 5.8S rRNA genes is called ITS1, and that between the 5.8S
and 26S rRNA genes is ITS2. Among the two regions, approx 60 different ITS
sequences have been characterized by direct DNA sequencing (18). Sequence
variation occurs throughout these 161- and 192-bp regions, respectively, and
the majority of sequence changes within each ITS have been determined to be
significant in establishing type (18).
The suitability of the CFLP scanning method for differentiating sequences
in the ITS region of five cloned P. carinii sequences belonging to different
types was investigated. The ITS region was amplified by polymerase chain
reaction (PCR), and the 5' ends of both strands were labeled by using
tetrachlorofluorescein (TET) sense strand labeled primers (see Note 1). The
amplified products were purified and then partially digested with the Cleavase
I enzyme. The samples were analyzed in duplicate sets, one of which was subjected to CFLP digestion at a predetermined, optimized reaction temperature,
whereas the other was digested under conditions in which the temperature was
continually increased, or “ramped” (see Subheading 3.2. and Note 2).
The results indicate that the CFLP method is highly effective in reproducibly distinguishing different P. carinii types (Fig. 3). An inspection of the fingerprints generated from these samples reveals a high degree of similarity
overall, indicative of the fact that only a few bases are altered in the variants,
with some marked differences that reflect those base changes. In Fig. 3, there
are several examples of bands that appear in some lanes but that are absent in
170
Heisler and Lee
others, as well as bands that appear shifted in some lanes relative to others.
Unique bands, indicated by arrows, are apparent, e.g., in lanes Bm. In other
cases, the most notable difference is a composite shifting downward of a substantial portion of the pattern, indicative of a small deletion, such that the fragments are shortened relative to the labeled 5′ ends (e.g., lanes Ed and Di, as
indicated by brackets).
Note that the patterns generated by the ramping procedure appear to be
enhanced relative to the single temperature procedure in several places. In particular, note the appearance of additional bands between 82 and 118 bp. This
improvement in the richness of the patterns is likely due to the fact that certain
substrate structures may not be as favored at a single temperature, as is used in
the conventional approach, but rather emerge as the temperature changes over
the course of the ramping reaction. In some cases the ramping approach not
only eliminates the need for preliminary optimization steps but may also serve
to improve the sensitivity of the CFLP method.
2. Materials
2.1. Preparation of End-Labeled PCR-Amplified Fragments
2.1.1. PCR Reagents
1.
2.
3.
4.
5.
Sterile double-distilled H2O.
10X PCR buffer: 500 mM KCl, 100 mM Tris-HCl, pH 9.0, 15 mM MgCl2.
dNTP (deoxynucleotide) mix: 0.2 mM each dNTP in sterile double-distilled H2O.
Mineral oil or wax overlay.
Oligonucleotide primers at a concentration of 10 µM, at least one of which is
labeled with a fluorescent dye (e.g., tetrachlorofluorescein, fluorescein) or a moiety detectable by chemiluminescence (e.g., biotin, digoxyigenin).
2.1.2. Post-PCR Fragment Purification
1. Exonuclease I: Available at 10 U/µL from Amersham Pharmacia Biotech (Arlington Heights, IL), cat. no. E70073Z, or at 20 U/µL from Epicentre Technologies
(Madison, WI), cat. no. X40505K.
2. High Pure PCR Product Purification Kit (HPPPPK), available from Roche
Molecular Biochemicals (Indianapolis, IN), cat. no. 1732668.
3. Sterile double-distilled H2O or T10E0.1: 10 mM Tris-HCl, pH 8.0, 0.1 mM EDTA,
pH 8.0.
2.2. CFLP Analysis
1. Cleavase I enzyme (25 U/µL) in Cleavase enzyme dilution buffer: 20 mM TrisHCl, pH 8.0, 50 mM KCl, 0.05% Tween® 20, 0.05% Nonidet™ P 40, 100 µg/mL
bovine serum albumin, and 50% (v/v) glycerol.
2. DNA dilution buffer: 5 mM MOPS, pH 7.5.
CFLP Analysis for Genotyping and Mutation Detection
171
3.
4.
5.
6.
10X CFLP buffer: 100 mM MOPS, pH 7.5, 0.5% Tween 20, 0.5% Nonidet P 40.
2 mM MnCl2.
10 mM MgCl2.
Stop solution (for nonfluorescent gel-based detection): 95% formamide, 10 mM
EDTA, pH 8.0, 0.05% xylene cylanol, 0.05% bromophenol blue (see Note 3).
7. Stop solution (for fluorescent gel-based detection): 95% formamide, 10 mM
EDTA, pH 8.0, 0.05% crystal violet (see Note 3).
8. Sterile double-distilled H 2O.
9. Thin-walled reaction tubes (200 or 500 µL).
2.3. Gel Electrophoresis
1. Gel solution: 6–10% acrylamide⬊bis (19⬊1) solution, 7 M urea, 0.5X Tris-borate
EDTA (TBE) buffer.
2. 0.5X TBE gel running buffer (pH 8.3): 44.5 mM Tris, 44.5 mM borate, 1 mM
EDTA, pH 8.0.
3. Ammonium persulfate (10% [w/v]).
4. TEMED.
5. Teflon flat-bottomed combs and spacers (0.5 mM thick) (2).
6. Glass plates (20 × 20 cm), nonfluorescing for use with fluorescence imager or
standard for chemiluminescence detection.
7. Gel electrophoresis support.
8. Power supply capable of supplying up to 2000 V.
2.4. Visualization of CFLP Patterns
2.4.1. Fluorescence Detection
1. Hitachi FMBIO ®-100 Fluorescent Method Bio-Image Analyzer (Hitachi Software, San Bruno, CA) or Molecular Dynamics 595 FluorImager™ (Molecular
Dynamics, Sunnyvale, CA).
2. Lint-free laboratory wipes.
3. Lens paper.
4. Nonfluorescing detergent, e.g., RBS 35 Detergent Concentrate (Pierce, Rockford, IL).
2.4.2. Chemiluminescence Detection
1. 10X SAAP: 1 M NaCl, 0.5 M Tris-base, pH 10.0.
2. 1X SAAP, 0.1% sodium dodecyl sulfate (SDS): 100 mM NaCl, 50 mM TrisBase, pH 10.0, 0.1% SDS (w/v).
3. 1X SAAP, 1 mM MgCl2: 100 mM NaCl, 50 mM Tris-base, pH 10.0, 1 mM MgCl2.
4. Sequenase Images™ 5X Blocking Buffer (cat. no. US75354; Amersham
Pharmacia Biotech).
5. Streptavidin-Alkaline-Phosphatase Conjugate (cat. no. US11687; Amersham
Pharmacia Biotech).
6. CDP-Star™ substrate (cat. no. MS250R; Tropix, Bedford, MA).
172
7.
8.
9.
10.
11.
12.
13.
14.
15.
16.
Heisler and Lee
Isopropanol.
Latex gloves (powder free).
X-ray film.
Positively charged nylon membrane, pore size 0.2 µm (e.g., Nytran® Plus Membrane, Schleicher and Schuell, Keene, NH).
Blotting paper (20 × 20 cm) (cat. no. 28303-100; VWR Scientific).
Sealable plastic bags.
Forceps.
Small plastic containers for processing membranes.
Darkroom/film-developing facilities.
Permanent laboratory marker.
3. Methods
3.1. Purification of PCR-Generated Fragments (see Note 1)
PCR amplification should be performed according to established protocols
for the particular locus in question. When PCR products are visualized by gel
electrophoresis followed by sensitive detection of the label to be used to visualize CFLP products, contamination by labeled primers and prematurely truncated single-stranded PCR products is evident. These contaminating DNA
species are effectively removed by the procedures noted. In particular, the
HPPPPK procedure has been proven effective for eliminating lower molecular
weight (i.e., >100 bp) DNA species, whereas Exonuclease I digestion is effective for removing larger DNA species. An alternative to the HPPPPK columns
in conjunction with Exonuclease I digestion is to precipitate with 1 vol of isopropanol following Exonuclease I digestion.
If a single, labeled product is detected following PCR and HPPPPK and
Exonuclease I digestion, then proceed with CFLP analysis. If more than one
product is detected, then optimization of the PCR reaction or gel isolation of
the desired product is necessary. The following protocol describes the method
for Exonuclease I digestion:
1. Following PCR amplification, incubate the reaction mixture at 70°C for 10 min.
2. Bring the reaction mixture to 37°C.
3. Add 1 U of Exonuclease I/µL of original PCR reaction mixture (e.g., 100 U to a
100-µL reaction mixture).
4. Incubate for 30 min at 37°C.
5. Inactivate the reaction by heating at 70°C for 30 min.
6. Following Exonuclease I digestion, apply the reaction mixtures to the HPPPPK
spin columns according to the manufacturer’s suggested procedures. The supplied elution buffer should be replaced with either sterile double-distilled H2O or
T10E0.1, pH 8.0.
CFLP Analysis for Genotyping and Mutation Detection
173
3.2. Preparation and Performance of CFLP Reactions
Prior to performing CFLP analysis, it is strongly recommended that the quality and quantity of the PCR-generated fragments following purification be
checked. This can be done by visualizing the label used (i.e., by fluorescence
analysis or chemiluminescence detection) on an aliquot of the DNA in a small
denaturing polyacrylamide gel.
As seen in Fig. 3, there are two alternative approaches to be taken in configuring the CFLP reaction. The initial configuration of the assay involves performing the reaction under an abbreviated matrix of reaction times and
temperatures in order to identify the optimal conditions for generation of a
pattern with a broad spectrum of evenly distributed bands (temperature/time
optimization). Alternatively, recent studies have demonstrated that the use of a
programmable thermal cycler enables informative patterns to be generated by
increasing the reaction temperature throughout the course of the reaction, specifically from 25 to 85°C at a rate of 0.1°C/s for a total ramping time of 10 min.
In some genetic systems, such as P. carinii, the ramping approach appears to
generate somewhat more even distributions of fragments and has improved
mutation detection sensitivity. Furthermore, provided suitable thermal cyclers
are available, the ramping approach is simpler and requires less DNA, since
optimization reactions need not be run prior to analysis of test samples. The
following protocol describes the method of performing CFLP analysis utilizing either the single temperature or ramping procedure:
1. Aliquot the desired amount of end-labeled DNA (approx 100 – 200 fmol) into a
thin-walled reaction tube (200 or 500 µL, depending on the capacity of the thermal cycler). Bring the DNA to a final volume of 13 µL with DNA dilution buffer,
if necessary.
2. In a separate tube, prepare an enzyme master mix that contains the following for
each reaction: 2 µL of 10X CFLP buffer, 2 µL 2 mM MnCl2, 1 µL of Cleavase I
enzyme, 2 µL of 10 mM MgCl2 (optional, see Note 4), and DNA dilution buffer
to a final volume of 7 µL (if needed).
3. To denature samples, place tubes containing DNA in a programmable thermal
cycler (or heat block) and incubate at 95°C for 15 s. If the single temperature
method is used proceed to step 4. If the ramping method is to be used proceed to
step 5.
4. Temperature/time optimization: After the 15-s denaturation step, set the thermal
cycler to the desired reaction temperature (or place the tubes in a heat block held
at reaction temperature if no thermal cycler is available). Optimal times and temperatures can be determined by examining matrices of different reaction times
(e.g., 1, 3, and 5 min) and temperatures (40, 50, and 55°C). Choose the conditions that yield the richest and most even pattern (see Note 5). Incubate the
CFLP reactions for the amount of time determined to be optimal, holding the
174
Heisler and Lee
temperature constant. After the incubation period, stop the reactions with 16 µL
of stop solution. Proceed to Subheading 3.3.
5. Ramping: After the 15-s denaturation step, set the thermal cycler to 35°C. As
soon as the thermal cycler reaches 35°C, add 7 µL of the enzyme/buffer mixture.
Mix well by pipetting up and down several times. Incubate the CFLP reactions
for 15 s at 35°C. Program the thermal cycler to increase in temperature at a rate of
0.1°C/s to 85°C, or set to ramp for an 8-min period from 35 to 85°C. On reaching
85°C, stop the reactions with 16 µL stop solution (see Note 3).
3.3. Separation of CFLP Fragments
1. Prepare a denaturing polyacrylamide gel, choosing a percentage of acrylamide
(19⬊1) appropriate for the size of the fragment being analyzed (see Note 6).
2. Prerun the gel for approx 30 min before loading the samples at sufficient wattage
to warm the gel (e.g., 18 – 20 W).
3. Heat denature the CFLP reactions at 80°C for 2 min immediately prior to loading onto the gel. The best resolution is achieved when the samples are fully
denatured.
4. Load 5 –10 µL of the appropriate CFLP reaction per well. The remainder of the
reactions can be stored at 4°C or –20°C for later analysis.
5. Continue electrophoresis until sufficient separation of the CFLP fragments is
achieved (the time will depend on the fragment size and the percentage of
acrylamide used).
3.4. Visualization of CFLP Patterns
3.4.1. Fluorescence Imaging of CFLP Patterns
1. Following gel electrophoresis, thoroughly wash the outside of the gel plates using
nonfluorescent soap.
2. Dry and wipe clear with lens paper to remove residual debris.
3. Place the gel carefully in the fluorescence scanning unit (Hitachi FMBIO-100 or
Molecular Dynamics 595).
4. Scan using the correct wavelength or filter for the fluorescent group to be detected.
3.4.2. Chemiluminescence Detection of CFLP Patterns
1. After electrophoresis, wearing powder-free latex gloves that have been washed
with isopropanol (see Note 7), carefully separate the glass plates to expose the
acrylamide gel.
2. Cut a piece of Nytran Plus membrane (Schleicher and Schuell) to fit the gel size
and moisten by applying 5–10 mL of 0.5X TBE.
3. Carefully place the moistened membrane onto the gel, avoiding lifting and repositioning the membrane, and smooth out air bubbles with a clean pipet. Transfer
starts immediately, so the membrane should not be picked up and repositioned
once it has come into contact with the gel.
4. Cover the membrane with two pieces of precut blotting paper, cover with a glass
plate, and place a binder clip on each side of the sandwiched gel. Alternatively,
CFLP Analysis for Genotyping and Mutation Detection
5.
6.
7.
8.
9.
10.
11.
12.
13.
14.
15.
16.
17.
18.
175
for large gels (i.e., 20 × 20 cm or larger), place an approx 2-kg weight on top of
the sandwich.
Allow the DNA to transfer onto the membrane for 4–16 h (e.g., overnight, if
convenient) at room temperature.
After the transfer, disassemble the sandwiched gel and remove the membrane by
carefully moistening it with distilled water. Mark the DNA side (i.e., the side
touching the gel during transfer) using a permanent laboratory marker.
Rinse a dish thoroughly with isopropanol (see Note 7) and fill with 0.2 mL/cm2
of 1X blocking buffer (e.g., 100 mL for a 20 × 20 cm membrane).
Transfer the membrane to the dish containing the blocking buffer and allow to
rock gently for 15 min.
Repeat the 15-min wash with fresh blocking buffer and discard the buffer.
Add 2 µL of Streptavidin-Alkaline-Phosphatase Conjugate to 50 mL of fresh blocking buffer (or add conjugate to the blocking buffer at a volume ratio of 1⬊4000).
Pour the conjugate/blocking buffer mixture onto the blocked membrane and rock
gently for 15 min.
Remove the conjugate and rinse for 5 min with 0.1% SDS/1X SAAP buffer,
0.5 mL/cm2 each (200 mL for a 20 × 20 cm membrane). Repeat twice, for a total
of three washes.
Remove the SDS and rinse 5 min with 0.5 mL/cm2 1 mM MgCl2/1X SAAP buffer.
Repeat twice, for a total of three washes.
Place the membrane in a sealable bag and add 4 mL of CDP-Star (or 0.01 mL/cm2).
Seal the bag and spread the CDP-Star gently over the membrane for 3 – 5 min.
Completely remove the CDP-Star and any air bubbles. Transfer the membrane
while still in the bag to a film exposure cassette.
In the darkroom, expose the membrane to X-ray film. Initially expose for 30 min.
For subsequent exposures, adjust the time for clarity and intensity (see Note 8).
Develop the film.
4. Notes
1. Depending on the objective of the analysis in question, the DNA can be labeled
on either strand or on both strands using this approach. Single end labeling, i.e.,
of the sense or the antisense strand, permits some degree of localization of the
base change(s) corresponding to the observed pattern changes (3). The sensitivity of the CFLP method is approx 90% for single-stranded analysis and >95% for
two-strand analysis. While double end labeling precludes this localization, it
affords more sensitive mutational analysis.
2. It has been determined empirically that samples analyzed according to the ramping procedure require approximately twofold more DNA than do those analyzed
by the conventional method. This is likely because in the ramping procedure,
digestion occurs throughout the course of the temperature increase and optimally
cleaves different hairpins at different temperatures.
3. The choice of dyes used in the stop solution depends on the system used to visualize the CFLP patterns. If chemiluminescence detection is used, then the stop
176
4.
5.
6.
7.
8.
Heisler and Lee
solution should include 0.05% bromophenol blue and 0.05% xylene cyanol (Subheading 2.2., item 6). If fluorescent scanning is used, then a dye that migrates
with opposite polarity, such as crystal violet (0.05%), is preferable, because dyes
that migrate into the gel fluoresce at the wavelengths used to detect the fluorescent dyes, thereby obscuring a portion of the CFLP pattern. Note that when a dye
with opposite polarity is used, it is advisable to load 3 – 5 µL of stop solution
containing bromophenol blue and xylene cyanol in a lane that does not contain
CFLP reactions in order to monitor the progress of gel electrophoresis.
MgCl2 dramatically reduces the rate of cleavage in the CFLP reaction. When MgCl2
is added to a final concentration of 1 mM in the presence of standard MnCl2 concentrations of 0.2 mM, the rate of cleavage is slowed by as much as 10-fold. This
reduced reaction rate can be useful for analysis of DNA fragments that assume
highly favored secondary structures that are rapidly cleaved in the CFLP reaction. The presence of such structures is readily identified by the appearance of a
structural fingerprint comprising one or two prominent bands. When 1 mM MgCl2
is added, the optimal time and temperature of digestion should be reevaluated to
reflect the reduced rate of cleavage (see Note 5).
The structural fingerprint produced by CFLP digestion is a collection of fragments
resulting from partial digestion, usually of 5' end labeled fragments. Because
the CFLP reaction is a partial digestion and because the formation of the substrate secondary structures depends on reaction temperature, it is possible to
modulate the extent of digestion through variations in the duration and temperature of the reaction. Specifically, lower temperatures stabilize secondary structure formation whereas higher temperatures reduce the number of structures
formed by a given molecule. Similarly, longer reaction times lead to increased
accumulation of smaller cleavage products. The most informative fingerprints
are those that contain a relatively even distribution of low and high molecular
weight products, including a fraction of full-length, uncut DNA. Ensuring that
the entire size distribution of cleavage products is visible increases the likelihood
of detecting the products that reflect the presence of a polymorphism.
The percentage of polyacrylamide to be used is dictated by the size of the PCR
fragment being analyzed. Appropriate percentages of polyacrylamide for various
size ranges are well established (19).
The objective of this step is to minimize carryover of alkaline phosphatase from
previous reactions and from exogenous sources (e.g., skin). Throughout this procedure, it is of paramount importance to minimize contamination by this ubiquitous enzyme.
An alkaline phosphatase reaction with the chemiluminescence substrate produces a long-lived signal, especially on membranes. Light emission increases of
>300-fold are seen in the first 2 h on application of the substrate onto nylon
membranes, with the chemiluminescence signal persisting up to several days.
Because film exposure times range from minutes to several hours, multiple images
may be acquired. Varying film exposure times enables the user to optimize
signal to noise.
CFLP Analysis for Genotyping and Mutation Detection
177
Acknowledgments
We wish to acknowledge the efforts of Mary Oldenburg, Senior Technical
Scientist, Third Wave Technologies, in performing much of the CFLP reaction
optimization as well as in providing critical commentary on the manuscript.
References
1. Sreevatsan, S., Bookout, J. B., Ringpis, F. M., Pottathil, M. R., Marshall, D. J.,
de Arruda, M., Murvine, C., Fors, L., Pottathil, R. M., and Barathur, R. R.
(1998) Algorithmic approach to high-throughput molecular screening for alpha
interferon-resistant genotypes in hepatitis C patients. J. Clin. Microbiol. 36,
1895 – 1901.
2. Cotton, R. G. H. (1997) Slowly but surely towards better scanning for mutations.
Trends Genet. 13, 43 – 46.
3. Brow, M. A., Oldenberg, M., Lyamichev, V., Heisler, L., Lyamicheva, N., Hall,
J., Eagan, N., Olive, D. M., Smith, L., Fors, L., and Dahlberg, J. (1996) Differentiation of bacterial 16S rRNA genes and intergenic regions and Mycobacterium
tuberculosis katG genes by structure-specific endonuclease cleavage. J. Clin.
Microbiol. 34, 3129 – 3137.
4. Orita, M., Suzuki, Y., Sekiya, T., and Hayashi, K. (1989) Rapid and sensitive
detection of point mutations and DNA polymorphisms using the polymerase chain
reaction. Genomics 5, 874 – 879.
5. Hayashi, K. (1991) PCR-SSCP: a simple and sensitive method for detection of
mutations in the genomic DNA. PCR Meth. Applica. 1, 34 –38.
6. Sarkar, G., Yoon, H., and Sommer, S. S. (1992) Dideoxy fingerprinting (ddE):
a rapid and efficient screen for the presence of mutations. Genomics 13, 441– 443.
7. Sreevatsan, S., Bookout, J. B., Ringpis, F. M., Mogazeh, S. L., Kreiswirth, B. N.,
Pottathil, R. R., and Barathur, R. R. (1998) Comparative evaluation of cleavase
fragment length polymorphism with PCR-SSCP and PCR-RFLP to detect antimicrobial agent resistance in Mycobacterium tuberculosis. Mol. Diagn. 3, 81– 91.
8. Tahar, R. and Basco, L. K. (1997) Analysis of Plasmodium falciparum multidrugresistance (pfmdr1) gene mutation by hairpin-dependent cleavage fragment length
polymorphism. Mol. Biochem. Parasitol. 88, 243 – 247.
9. Wartiovaara, K., Hytonen, M., Vuori, M., Paulin, L., Rinne, J., and Sariola, H.
(1998) Mutation analysis of the glial cell line-derived neurotrophic factor gene in
Parkinson’s disease. Exp. Neurol. 152, 307–309.
10. Schlamp, C., Poulsen, G. L., Nork, M., and Nickells, R. W. (1997) Nuclear exclusion of wild-type p53 in immortalized human retinoblastoma cells. J. Natl. Cancer Inst. 89, 1530–1536.
11. Marshall, D. J., Heisler, L. M., Lyamichev, V., Murvine, C., Olive, D. M., Ehrlich,
G. D., Neri, B. P., and de Arruda, M. (1997) Determination of hepatitis C virus
genotypes in the United States by Cleavase Fragment Length Polymorphism
analysis. J. Clin. Microbiol. 35, 3156 – 3162.
178
Heisler and Lee
12. Rainaldi, G., Marchetti, S., Capecchi, B., Meneveri, R., Piras, A., and Leuzzi, R.
(1998) Absence of mutations in the highest mutability region of the p53 gene in
tumour-derived CHEF18 Chinese hamster cells. Mutagenesis 13, 153–155.
13. Rossetti, S., Englisch, S., Bresin, E., Pignatti, P. F., and Turco, A. E. (1997)
Detection of mutations in human genes by a new rapid method: cleavage fragment length polymorphism analysis (CFLPA). Mol. Cell. Probes 11, 155 –160.
14. Eisinger, F., Jacquemier, J., Charpin, C., Stoppa-Lyonnet, D., Bressacde Paillerets, B., Peyrat, J.-P., Longy, M., Guinebretiere, J.-M., Sauvan, R.,
Noguichi, T., Birnbaum, D., and Sobol, H. (1998) Mutations at BRCA1: the medullary breast carcinoma revisited. Cancer Res. 58, 1588 –1592.
15. Centers for Disease Control and Prevention (1989) AIDS Weekly Surveillance
Report, Centers for Disease Control and Prevention, Atlanta, GA.
16. Latouche, S., Ortona, E., Masers, E., Margutti, P., Tamburrini, E., Siracusano, A.,
Guyot, K., Nigou, M., and Roux, P. (1997) Biodiversity of Pneumocystis carinii
hominis: typing with different DNA regions. J. Clin. Microbiol. 35, 383 – 387.
17. Lu, J.-J., Bartlett, M. S., Shaw, M. M., Queener, S. F., Smith, J. W., Ortiz-Rivera,
M., Leibowitz, M. J., and Lee, C.-H. (1994) Typing of Pneumocystis carinii strains
that infect humans based on nucleotide sequence variations of internal transcribed
spacers of rRNA genes. J. Clin. Microbiol. 32, 2904 –2912.
18. Lee, C.-H., Tang, X., Jin, S., Li, B., Bartlett, M. S., Helweg-Larsen, J., Olsson,
M., Lucas, S. B., Roux, P., Cargnel, A., Atzori, C., Matos, O., and Smith, J. W.
(1998) Update on Pneumocystis carinii f. sp. hominis typing based on nucleotide
sequence variations in internal transcribed spacer regions of rRNA genes. J. Clin.
Microbiol. 36, 734–741.
19. Sambrook, J., Fritsch, E. F., and Maniatis, T. (eds.) (1989) Molecular Cloning:
A Laboratory Manual, Cold Spring Harbor Laboratory Press, Cold Spring Harbor, NY.
Genotyping Using DNA MassArray™ Technology
179
18
Automated Genotyping Using
the DNA MassArray™ Technology
Christian Jurinke, Dirk van den Boom, Charles R. Cantor,
and Hubert Köster
1. Introduction
1.1. Markers Used for Genetic Analysis
The ongoing progress in establishing a reference sequence as part of the
Human Genome Project (1) has revealed a new challenge: the large-scale identification and detection of intraspecies sequence variations, either between
individuals or populations. The information drawn from those studies will lead
to a detailed understanding of genetic and environmental contributions to the
etiology of complex diseases.
The development of markers to detect intraspecies sequence variations has
evolved from the use of restriction fragment length polymorphisms (RFLPs) to
microsatellites (short tandem repeats [STRs]) and very recently to single nucleotide polymorphisms (SNPs).
Although RFLP markers (2) are useful in many applications, they are often
of poor information content, and their analysis is cumbersome to automate.
STR markers (3), by contrast, are fairly highly informative (through their highly
polymorphic number of repeats) and easy to prepare using polymerase chain
reaction (PCR)-based assays with a considerable potential for automation.
However, using conventional gel electrophoresis-based analysis, typing of large
numbers of individuals for hundreds of markers still remains a challenging task.
Within the last few years, much attention has been paid to discovery and
typing (scoring) of SNPs and their use for gene tracking (4,5). SNPs are
biallelic single-base variations, occurring with a frequency of at least 1 SNP/
1000 bp within the 3 billion bp of the human genome. Recently, a study on the
From: Methods in Molecular Biology, vol. 187: PCR Mutation Detection Protocols
Edited by: B. D. M. Theophilus and R. Rapley © Humana Press Inc., Totowa, NJ
179
180
Jurinke et al.
sequence diversity in the human lipoprotein lipase gene suggested that the frequency of SNPs might be much higher (6). The diversity in plant DNA, which
would be relevant for agricultural applications, is five to seven times larger
than in human DNA (7).
Even though the use of SNPs as genetic markers seems to share the same
limitations as relatively uninformative RFLPs, when used with modern scoring
technologies, SNPs exhibit several advantages. Most interesting for gene tracking is that SNPs exist in the direct neighborhood of genes and also within genes.
Roughly 200,000 SNPs are expected (4) in protein coding regions (so-called
cSNPs) of the human genome. Furthermore, SNPs occur much more frequently
than STRs and offer superior potential for automated assays.
1.2. Demand for Industrial Genomics
1.2.1. Genetics
The efforts of many researchers are dedicated to the exploration of the
genetic bases of complex inherited diseases or disease predispositions. Studies
are performed to identify candidate or target genes that may confer a predisposition for a certain disease (8). Linkage analysis can be done as a genome wide
screening of families; association or linkage disequilibrium analysis can be done
with populations. Either approach can use STR or SNP markers. Once a potential candidate gene is discovered, a particular set of markers is compared
between affected and unaffected individuals to try to identify functional allelic
variations. To understand the genotype-to-phenotype correlation of complex
diseases, several hundred markers need to be compared among several hundred
individuals (9,10). To get an impression of the complexity of the data produced
in such projects, imagine a certain multifactorial disease in which predisposition is linked to, e.g., 12 genes. Consider that each of those 12 genes can be
present in just two different alleles. The resulting number of possible genotypes
(2 homozygotes and 1 heterozygote = 3 for each gene) is 312 = 531,441.
The whole process of drug development, including hunting for new target
genes and especially the subsequent validation (significant link to a certain
disease), will benefit from high-throughput, high-accuracy genomic analysis
methods. Validated target genes can also be used for a more rational drug development in combination with genetic profiling of study populations during clinical trials.
1.2.2. Pharmacogenetics
Traits within populations, such as the ABO blood groups, are phenotypic
expressions of genetic polymorphism. This is also the case for variations in
response to drug therapy. When taken by poor metabolizers, some drugs cause
exaggerated pharmacological response and adverse drug reactions. For example,
Genotyping Using DNA MassArray™ Technology
181
tricyclic antidepressants exhibit order of magnitude differences in blood concentrations depending on the enzyme status of patients (11). Pharmacogenetics
is the study of genetic polymorphism in drug metabolism. Today, pharmaceutical companies screen individuals for specific genetic polymorphisms before
entry into clinical trials to ensure that the study population is both relevant and
representative. Targets for such screenings are cytochrome P450 enzymes or
N-acetyltransferase isoenzymes (NAT1 and NAT2). Potential drug candidates
affected by polymorphic metabolism include antidepressants, antipsychotics,
and cardiovascular drugs.
1.2.3. Current Technologies
In addition to candidate gene validation and pharmacogenetics, many other
applications such as clinical diagnostics, forensics, as well as the human sequence
diversity program (12) are dealing with SNP scoring. In agricultural approaches,
quantitative trait loci can be explored, resulting in significant breeding advances.
Methods are required that provide high-throughput, parallel sample processing; flexibility; accuracy; and cost-effectiveness to match the different needs
and sample volumes of such efforts.
Large-scale hybridization assays performed on microarrays have enabled
relatively high-throughput profiling of gene expression patterns (13). However, several issues must be considered in attempting to adapt this approach
for the large-scale genotyping of populations of several hundred individuals.
Hybridization chips for SNP scoring can potentially analyze in parallel several
hundred SNPs per chip—with DNA from one individual. Therefore, several
hundred hybridization chips would be needed for projects with larger populations. If during the course of a study an assay needs to be modified or new
assays have to be added, all chips might have to be completely remanufactured.
Also, note that DNA hybridization lacks 100% specificity. Therefore, highly
redundant assays have to be performed, providing a statistical result with a
false-negative error rate of up to 10% for heterozygotes (14). Finally, because
of the inherent properties of repeated sequences, hybridization approaches are
hardly applicable to STR analysis.
1.3. DNA MassArray Technology
Within the last decade, mass spectrometry (MS) has been developed to a
powerful tool no longer restricted to the analysis of small compounds (some
hundred Daltons) but also applicable to the analysis of large biomolecules
(some hundred thousand Daltons). This improvement is mainly based on the
invention of soft ionization techniques. A prominent example is matrix assisted
laser desorption/ionization (MALDI) time-of-flight (TOF) MS, developed in
the late 1980s by Karas and Hillenkamp (15).
182
Jurinke et al.
Fig. 1. Schematic drawing of the MALDI-TOF MS process, as used in the DNA
MassArray method.
The general principle of MS is to produce, separate, and detect gas-phase
ions. Traditionally, thermal vaporization methods are used to transfer molecules into the gas phase. Most biomolecules, however, undergo decomposition under these conditions. Briefly, in MALDI MS, the sample is embedded in
the crystalline structures of small organic compounds (called matrix), and the
cocrystals are irradiated with a nanosecond ultraviolet-laser beam. Laser energy
causes structural decomposition of the irradiated crystal and generates a
particle cloud from which ions are extracted by an electric field. After acceleration, the ions drift through a field-free path (usually 1 m long) and finally
reach the detector (e.g., a secondary electron multiplier) (see Fig. 1). Ion masses
(mass-to-charge ratios, m/z) are typically calculated by measuring their TOF,
which is longer for larger molecules than for smaller ones (provided their initial energies are identical). Because predominantly single-charged
nonfragmented ions are generated, parent ion masses can easily be determined
from the spectrum without the need for complex data processing and are accessible as numerical data for direct processing.
The quality of the spectra, which is reflected in terms of resolution, mass
accuracy, and also sensitivity, is highly dependent on sample preparation and
the choice of matrix compound. For this reason, the early applications of
MALDI-TOF MS were mostly for analyzing peptides and proteins. The discovery of new matrix compounds for nucleic acid analysis (16) and the develop-
Genotyping Using DNA MassArray™ Technology
183
ment of solid-phase sample conditioning formats (17,18) enabled the analysis
of nucleic acid reaction products generated in ligase chain reaction or PCR (19).
The more demanding DNA sequence determination with MALDI-TOF MS
can be addressed using exonucleolytic digestion (20), Sanger sequencing (21),
or solid-phase Sanger sequencing approaches (22). These approaches are currently restricted to comparative sequencing, and the read length is limited to
about 100 bases. Further improvements in reaction design and instrumentation
(23) will surely lead to enhanced efficacy and longer read length. For
genotyping applications, this limitation is not relevant because scientists at
Sequenom (San Diego, CA) developed the primer oligo base extension
(PROBE) reaction especially for the purpose of assessing genetic polymorphism
by MS (24). The PROBE assay format can be used for the analysis of deletion,
insertion, or point mutations, and STR, and SNP analysis, and it allows the
detection of compound heterozygotes. The PROBE process comprises a
postPCR solid-phase primer extension reaction carried out in the presence of
one or more dideoxynucleotides (ddNTPs) and generates allele-specific terminated extension fragments (see Fig. 2). In the case of SNP analysis, the PROBE
primer binding site is placed adjacent to the polymorphic position. Depending
on the nucleotide status of the SNP, a shorter or a longer extension product is
generated. In the case of heterozygosity, both products are generated. After
completion of the reaction, the products are denatured from the solid phase and
analyzed by MALDI-TOF MS. In the example given in Fig. 2, the elongation
products are expected to differ in mass by one nucleotide. Figure 3 presents
raw data for a heterozygous DNA sample analyzed by this PROBE assay. The
two SNP alleles appear as two distinct mass signals. Careful assay design makes
a high-level multiplexing of PROBE reactions possible.
In the case of STR analysis, a ddNTP composition is chosen that terminates
the polymerase extension at the first nucleotide not present within the repeat
(25). For length determination of a CA repeat, a ddG or ddT termination mix is
used. Even imperfect repeats harboring insertion or deletion mutations can be
analyzed with this approach. Figure 4 displays raw data from the analysis of a
human STR marker in a heterozygous DNA sample. Both alleles differ by four
CA repeats. The DNA polymerase slippage during amplification generates a
pattern of “stutter fragments” (marked with an asterisk in Fig. 4). In the case of
heterozygotes that differ in just one repeat, the smaller allele has higher intensities than the larger allele, because allelic and stutter signals are added together.
A DNA MassArray compatible STR portfolio with a 5-cM intermarker distance is currently under development at Sequenom.
When compared to the analysis of hybridization events by detecting labels,
even on arrays, the DNA MassArray approach differs significantly. The
PROBE assay is designed to give only the relevant information. The mass spec-
184
Jurinke et al.
Fig. 2. Reaction scheme for the BiomassPROBE reaction.
Fig. 3. Raw data of SNP analysis (heterozygous sample) using the BiomassPROBE
reaction.
Genotyping Using DNA MassArray™ Technology
185
Fig. 4. Raw data of microsatellite analysis (heterozygous sample) using the
BiomassPROBE reaction. Signals marked with an asterisk are stutter fragments (see
Subheading 1.3.).
trometric approach enables direct analyte detection with 100% specificity and
needs no redundancy. This accuracy and efficacy is combined with sample
miniaturization, bioinformatics, and chip-based technologies for parallel processing of numerous samples.
Now, the use of an advanced nanoliquid handling system based on piezoelectric pipets combined with surface-modified silicon chips permits an automated
scanning of 96 samples in about 10 min. Currently, up to 10 SpectroCHIPs
(960 samples) can be analyzed in one automated run using a Bruker/Sequenom
SpectroSCAN mass spectrometer (see Fig. 5). The SpectroSCAN mass spectrometer addresses each position of the chip sequentially, collects the sum of
10 laser shots, processes and stores the data, and proceeds to the next spot of the
chip. In Fig. 6, 96 raw data spectra from a heterozygous sample are depicted
resulting from a SpectroCHIP with one sample spotted 96 times. Using a proprietary algorithm, masses as well as signal intensities are automatically analyzed and interpreted. After completion of analysis, the results are transferred
to a database and stored as accessible genetic information (see Fig. 7). The database also provides a tool for visual control and comparison of spectra with theoretically expected results (see Fig. 8).
The DNA MassArray throughput in terms of genetic information output
depends on the chosen scale. Using microtiter plates and 8-channel pipets,
the analysis of 192 genotypes (two 96-well microtiter plates) a day is routine
work. With the use of automated liquid handling stations, the throughput can
be increased by a factor of about four. An automated process line was been
developed during the last year to increase the throughput to an industrial scale.
The automated process line integrates biochemical reactions including PCR
setup, immobilization, PROBE reaction sample conditioning, and recovery
186
Jurinke et al.
Fig. 5. Sample holder for 10 SpectroCHIPs for use in the SpectroSCAN mass
spectrometer.
from the solid-phase into a fully automated process with a throughput of about
10,000 samples per day.
2. Materials
2.1. PCR and PROBE Reaction
1. Dynabeads M-280 Streptavidin (Dynal, Oslo, Norway).
2. Separate PROBE stops mixes for ddA, ddC, ddG, and ddT (500 µM of the respective ddNTP and 500 µM of all dNTPs not present as dideoxynucleotides)
(MassArray Kit; Sequenom).
3. 2X B/W buffer: 10 mM Tris-HCl, pH 7.5, 1 mM EDTA, 2 M NaCl (all components from Merck, Darmstadt, Germany).
4. 25% Aqueous NH4OH (Merck, Darmstadt, Germany).
5. 10 mM Tris-HCl, pH 8.0 (Merck).
6. AmpliTaq Gold (Perkin-Elmer, Foster City, CA).
7. AmpliTaq FS (Perkin-Elmer).
8. Magnetic particle concentrator for microtiter plate or tubes (Dynal).
9. Specific PCR and PROBE primer (see Note 1).
Genotyping Using DNA MassArray™ Technology
187
Fig. 6. Raw data generated during the analysis of one sample spotted 96 times on a SpectroCHIP.
188
Jurinke et al.
Fig. 7. Sequenom data analysis software reports for automated sex typing using the
DNA MassArray.
Fig. 8. Tool for visual comparison of spectra with the theoretical results.
Genotyping Using DNA MassArray™ Technology
189
2.2. Nanoliquid Handling and SpectroCHIPs
1. SpectroCHIP (Sequenom).
2. SpectroJET (Sequenom).
2.3. SpectroCHIP Analysis
1. SpectroSCAN (Sequenom).
2. SpectroTYPER (Sequenom).
3. Methods
3.1. PCR and PROBE Reaction
The following steps can be performed either in microtiter plates using multichannel manual pipettors or automated pipetting systems or on the singletube scale.
3.1.1. Preparation of PCR
Perform one 50-µL PCR per PROBE reaction with 10 pmol of biotinylated
primer and 25 pmol of nonbiotinylated primer (see Note 2).
3.1.2. Immobilization of Amplified Product
1. For each PCR use 15 µL of streptavidin Dynabeads (10 mg/mL).
2. Prewash the beads twice with 50 µL of 1X B/W buffer using the magnetic rack.
3. Resuspend the washed beads in 50 µL of 2X B/W buffer and add to 50 µL of
PCR mix.
4. Incubate for 15 min at room temperature. Keep the beads resuspended by gentle
rotation.
3.1.3. Denaturation of DNA Duplex
1.
2.
3.
4.
5.
Remove the supernatant by magnetic separation.
Resuspend the beads in 50 µL of 100 mM NaOH (freshly prepared).
Incubate for 5 min at room temperature.
Remove and discard the NaOH supernatant by magnetic separation.
Wash three times with 50 µL of 10 mM Tris-HCl, pH 8.0.
3.1.4. PROBE Reaction
1. Remove the supernatant by magnetic separation, and add the following PROBE
mix: 3 µL of 5X reaction buffer, 2 µL of PROBE nucleotide mix (ddA, ddC, ddG,
or ddT with the respective dNTPs), 2 µL of PROBE primer (20 pmol), 7.6 µL of
H2O, 0.4 µL of enzyme (2.5 U).
2. The PROBE temperature profile comprises 1 min at 80°C, 3 min at 55°C, followed by 4 min at 72°C. Cool slowly to room temperature. Keep the beads resuspended by gentle rotation (see Notes 3 and 4).
190
Jurinke et al.
3.1.5. Recovery of PROBE Products
1. After the reaction is completed, remove the supernatant by magnetic separation.
2. Wash the beads twice with 50 µL of 10 mM Tris-HCl, pH 8.0.
3. Resuspend the beads in 5 µL of 50 mM NH4OH (freshly aliquoted from 25%
stock solution).
4. Incubate for 4 min at 60°C.
5. Transfer the supernatant to a microtiter plate, and discard (or store) the beads.
3.2. SpectroCHIP Loading (see Note 5)
1.
2.
3.
4.
Fill containers with ultrapure water.
Initialize the nanoplotter.
Place the SpectroCHIP and microtiter plate on the nanoplotter (see Note 6).
Start the sample spotting program.
3.3. SpectroCHIP Scanning
1.
2.
3.
4.
5.
Place the loaded SpectroCHIP on the sample holder.
Insert the sample holder into the SpectroSCAN.
Define which spots or chips have to be analyzed.
Choose analysis method and start the automated run.
Transfer the data to the processing server.
4. Notes
1. For PCR as well as PROBE primers it is useful to verify the masses before use.
Primers that are not completely deprotected (mass shift to higher masses) or
mixed with n-1 synthesis products should not be used.
2. Use asymmetric primer concentrations in PCR, with the nonbiotinylated primer
in excess.
3. The length of the PROBE primer should not exceed 20-25 bases; try to have C or
G at the 3' end, and avoid mismatches, especially at the 3' end.
4. The second temperature step in the PROBE program (55°C) depends on the
primer length.
5. After the reaction, the beads can be stored for further reactions in Tris-HCl buffer
at 4°C.
6. Be sure to handle SpectroCHIPs with gloves and avoid any contact with moisture.
References
1. Collins, F. S., Patrinos, A., Jordan, E., Chakravarti, A., Gesteland, R., Walters, L.,
and the members of DOE and NIH planning groups. (1998) New goals for the
U.S. human genome project: 1998-2003. Science 282, 682 – 689.
2. Botstein, D., White, D. L., Skolnick, M., and Davis, R. W. (1980) Construction of
a genetic linkage map in man using restriction fragment length polymorphisms.
Am. J. Hum. Genet. 32, 314 –331.
Genotyping Using DNA MassArray™ Technology
191
3. Weber, J. L. and May, P. E. (1989) Abundant class of human DNA polymorphisms which can be typed using the polymerase chain reaction. Am. J. Hum.
Genet. 44, 388 – 396.
4. Collins, F. S., Guyer, M. S., and Chakravarti, A. (1997) Variations on a theme:
Cataloging human DNA sequence variation. Science 278, 1580–1581.
5. Kruglyak, L. (1997) The use of a genetic map of biallelic markers in linkage studies. Nat. Genet. 17, 21–24.
6. Nickerson, D. A., Taylor, S. L., Weiss, K. M., Clark, A. G., Hutchinson, R. G.,
Stengard, J., Salomaa, V., Vartiainen, E., Boerwinkle, E., Sing, C.F. (1998) DNA
sequence diversity in a 9.7-kb region of the human lipoprotein lipase gene. Nature
Genet. 19, 233 – 240.
7. Sun, G. L., Diaz, O., Salomon, B., von Bothmer, R. (1999) Genetic diversity in
Elymus caninus as revealed by isozyme, RAPD, and microsatellite markers.
Genome 42, 420 – 431.
8. Gusella, J. F., Wexler, N. S., Conneally, P. M., Naylor, S. L., Anderson, M. A.,
Tanzi, R. E., Watkins, P. C., Ottina, K., Wallace, M. R., and Sakaguchi, A. Y.
(1983) A polymorphic DNA marker genetically linked to Huntigton’s disease.
Nature 306, 234 – 238.
9. Risch, N. and Merikangas, K. (1996) The future of genetic studies of complex
human diseases. Science 273, 1516 –1517.
10. Risch, N. and Teng, J. (1998) The relative power of family-based and case-control designs for linkage disequilibrium studies of complex human diseases.
Genome Res. 8, 1273–1288.
11. Larrey, D., Berson, A., Habersetzer, F., Tinel, M., Castot, A., Babany, G.,
Letteron, P., Freneaux, E., Loeper, J., and Dansette, P. (1989) Genetic predisposition to drug hepatotoxicity: role in hepatitis caused by amineptine, a tricyclic antidepressant. Hepatology 10, 168–173.
12. Collins, F. S., Brooks, L. D., and Chakravarti, A. (1998) A DNA polymorphism discovery resource for research on human genetic variation. Genome Res. 8, 1229–1231.
13. Christopoulos, T. K. (1999) Nucleic acid analysis. Anal. Chem. 71, 425R– 438R.
14. Hacia, J. G. (1999) Resequencing and mutational analysis using oligonucleotide
microarrays. Nat. Genetics Suppl. 21, 42 – 47.
15. Karas, M. and Hillenkamp, F. (1988) Laser desorption ionization of proteins with
molecular masses exceeding 10,000 daltons. Anal. Chem. 60, 2299 – 2301.
16. Wu, K. J., Steding, A., and Becker, C. H. (1993) Matrix-assisted laser desorption
time-of-flight mass spectrometry of oligonucleotides using 3-Hydroxypicolinic acid
as an ultraviolet-sensitive matrix. Rapid Commun. Mass Spectrom. 7, 142–146.
17. Tang, K., Fu, D., Kötter, S., Cotter, R. J., Cantor, C. R., and Köster, H. (1995)
Matrix-assisted laser desorption/ionization mass spectrometry of immobilized
duplex DNA probes. Nucleic Acids Res. 23, 3126 – 3131.
18. Jurinke, C., van den Boom, D., Jacob, A., Tang, K., Wörl, R., and Köster, H.
(1996) Analysis of ligase chain reaction products via matrix assisted laser desorption/ionization time-of-flight mass spectrometry. Anal. Biochem. 237, 174–181.
192
Jurinke et al.
19. Jurinke, C., Zöllner, B., Feucht, H.-H., Jacob, A., Kirchhübel, J., Lüchow, A., van
den Boom, D., Laufs, R., and Köster, H. (1996) Detection of Hepatitis B virus
DNA in serum samples via nested PCR and MALDI-TOF mass spectrometry.
Genet. Anal. 13, 67–71.
20. Pieles, U., Zurcher, W., Schar, M., and Moser, H. E. (1993) Matrix-assisted laser
desorption ionization time-of-flight mass spectrometry: a powerful tool for the
mass and sequence analysis of natural and modified oligonucleotides. Nucl. Acids
Res. 21, 3191– 3196.
21. Köster, H., Tang, K., Fu, D. J., Braun, A., van den Boom, D., Smith, C. L., Cotter,
R. J., and Cantor, C. R. (1996) A strategy for rapid and efficient DNA sequencing
by mass spectrometry. Nat. Biotechnol. 14, 1123–1129.
22. Fu, D. J., Tang, K., Braun, A., Reuter, D., Darnhofer-Demar, B., Little, D. P.,
O’Donnell, M. J., Cantor, C. R., and Köster, H. (1998) sequencing exons 5 to 8
of the p53 gene by MALDI-TOF mass spectrometry. Nature Biotechnol. 16,
381–384.
23. Berkenkamp, S., Kirpekar, F., and Hillenkamp, F. (1998) Infrared MALDI mass
spectrometry of large nucleic acids. Science 281, 260 –262.
24. Braun, A., Little, D. P., and Köster, H. (1997) Detecting CFTR gene mutations
by using primer oligo base extension and mass spectrometry. Clin. Chem. 43,
1151–1158.
25. Braun, A., Little, D. P., Reuter, D., Muller-Mysock, B., and Köster, H. (1997)
Improved analysis of microsatellites using mass spectrometry. Genomics 46,
18 – 23.
Bioinformatics
193
19
An Introduction to Bioinformatics
Henry Brzeski
The purpose of this chapter is to illustrate how to obtain information on
DNA and protein sequences from databases. This is most conveniently
achieved using a Web browser (Netscape or Internet Explorer). This chapter is
loosely based on a course given by the author at the University of Hertfordshire
from a set of Web pages that facilitate Internet navigation by using hyperlinks
and allow sequences to be copied from the Web page and pasted into the relevant search engine. (The online version of this information can be found at
http://www.herts.ac.uk/natsci/Bio/informatics.htm.)
Many simple queries about protein and DNA sequences can now be answered
using a Web browser. The purpose of this chapter is to give you a flavor of the
sorts of things which are now possible, but first it is necessary to explain some of
the jargon. If you know all about the World Wide Web (WWW or “the Web”),
URLs, and hyperlinks then you can bypass the introductory information.
1. Introduction
1.1. The World Wide Web
The World Wide Web and the Internet were not invented by Bill Gates! It
was originally put together in the 1960s by, primarily, the US Department of
Defense (DOD) to ensure continuity of communication during a war. The DOD
relied on the fact that every computer connected to its lines could communicate
with any other computer. However, to make the system impregnable to attack,
there was not a straightforward connection between each computer. Instead,
multiple computers were connected to each other. As a result of this form of
connection, there was always more than one way to connect between A and J.
It may have been A-B-C-G-J, it may have been A-C-H-I-J, or it may have
been, A-G-C-I-J, etc. This provided the resilience to possible attempts at disFrom: Methods in Molecular Biology, vol. 187: PCR Mutation Detection Protocols
Edited by: B. D. M. Theophilus and R. Rapley © Humana Press Inc., Totowa, NJ
193
194
Brzeski
ruption. The original work was done by the Advanced Research Projects
Agency, and the network was known as ARPAnet. Later on, academic institutions saw this as a wonderful way for researchers to communicate and so they
started to connect their computers to this international network or “Internet.”
This gave rise to the ability to communicate via e-mail and also allowed collaborators to share large amounts of data by transferring the files rapidly via
the Internet rather than by mailing a pile of disks or tapes. Now the Internet is
being used for advertising and other commercial purposes.
1.2. Navigating on the Web
The files on computers scattered around the world must all have a unique
name so that you can access each one specifically. This means that their names
sometimes can be rather complex. Initially, it is necessary to tell your Web
browser where to go to pick up a specific page. (The address of this page is
given a jargon name; it is a “URL,” which stands for Universal Resource Locator.) However, navigating (surfing) on the Internet would be tedious if surfers
had to type in these names continually. They would soon get bored with typing
“http://www.expasy.ch/prosite/,” one of the addresses we will used later.) For
this reason navigation is accomplished by using “hyperlinks” displayed in the
now ubiquitous Web browsers. Hyperlinks can readily be identified on Web
pages, because they are usually represented as underlined text in color, or as a
button that is ‘pressed’ by clicking on it with the computer mouse and cursor.
If the pointer is positioned over the hyperlink the address or URL it represents
will appear in the status bar at the bottom of the browser window. Single click
on the hyperlink and the Web browser will load the page at the new address.
Hyperlinks can refer to different places in the same document or to totally new
addresses. Hyperlinks should be traversed with care, as it is all to easy to follow links without thinking and end up miles from home, both figuratively and
literally. It is usually possible to retrace the original path by pressing the Back
button, but take care, this does not always work. All Web browsers record a
history of traversed links, which can be used to connect rapidly to recently
visited sites.
1.3. Databases and the Web
Since the early days of DNA and protein sequencing, such information has
been deposited in computer databases so that many individuals could access this
information. When the World Wide Web greatly expanded the reach of networked computers, it was not long before the Web browser became the interface
between a very widely scattered population of researchers and the programs that
could sift through the large amounts of data that were being accumulated.
Bioinformatics
195
2. DNA Databases
In the following sections, I will introduce the reader to a few of the programs
available via the Web for finding and analyzing biochemical information.
2.1. Using Entrez to Search for Relevant Database Entries
Sooner or later a project reaches the point when it is necessary to devise
primers to amplify known sequences from cells. This section describes how to
obtain sequences for known genes/mRNAs, making it possible to devise primers to characterize genes/mRNAs. The National Center for Biotechnology
Information (NCBI) has a very powerful computer with an easy-to-use Webbased interface for accessing sequence information. Follow these instructions
to find sequences of particular genes/mRNAs.
1. Start a Web browser (Netscape or Internet Explorer) by clicking on its icon.
2. Go to File/Open in the menubar, enter http://www.ncbi.nlm.nih.gov/Entrez/ in the
dialog box and press the OK button. This will not load the file into a new window.
3. This will load the Entrez page which allows users to quiz the databases available
at NCBI for textual information connected with any required topic.
4. Click on the Nucleotide hyperlink.
5. In the text box enter ‘p53’ and press the Search button.
6. This very simple search will find many records (note the button with Retrieve N
records at the top right hand side of the page).
7. These matches or ‘hits’ will consist of database entries containing partial and complete genomic or cDNA sequences from Homo sapiens and many other species.
8. Press the Back button on the browser.
9. Change the query to p53 & human (the “&” tells the server to find all records
which contain both the word “p53” and the word “human”—an example of Boolean logic) and press the Search button. (You can find out more about Boolean
expressions by clicking on Detailed help on the Entrez page: scroll to the top of
the page, find the section labeled For Experts Only, and click on Entering Complex Boolean Expressions.)
10. This query finds fewer records. You can adjust your query using various required
words and Boolean operators. By adding extra keywords, e.g., “complete,”
“mRNA,” etc., you can fine tune your search and hit fewer documents.
11. Once the list is manageable, press the Retrieve N records to receive the first
summary page of hits.
12. Each hit contains a checkbox, an accession number (the ID of the record), a brief
summary of the entry (taken from the file), and various related links.
13. Check the boxes of the relevant hits and then press the Display button to retrieve
the actual record(s).
14. Each record contains a number of fields that describe the sequence, e.g., the
organism, whether the sequence is genomic or derived from mRNA, or relevant
196
Brzeski
published information. Depending on the sequence, the record may contain information on biologically important areas of the sequence, e.g., promoters, start
AUG, introns, etc.) followed by the final, and most important, part of the record,
the sequence itself.
2.2. Searching for Database Entries That Match a Sequence
The first step of the human genome sequencing project has involved identifying those DNA sequences most important for a cell. These code for proteins
synthesized by the cell, which defines the cell’s enzymatic complement and
therefore its function. For this reason, people have been isolating the mRNAs
expressed in cells, converting them to DNA (cDNA), cloning and sequencing
them in their thousands. These expressed sequences are given the jargon name
of Expressed Sequence Tag (EST) and will define the proteins made by a cell.
As the sequencing of the human genome progresses, the function of more and
more DNA/protein sequences will be identified. It is now routine to generate
many ESTs and then to compare them with sequences in the databases to
determine their function. A number of such ESTs are given in Table 1 (2 –8)
along with one bacterial gene (1). The next procedure illustrates how to compare these sequences against the DNA databanks using Basic Local Alignment
Search Tool (BLAST) to find out what they code for.
1. Identify a sequence to use (this can be an in house sequence or one of those
provided in Table 1). Copy the sequence to your clipboard.
2. Open your Web browser and go to http://www.ncbi.nlm.nih.gov/BLAST/. Click
on Basic BLAST Search to load a page containing the search form.
3. Paste the copy on the clipboard into the search window.
4. Use the default conditions for the search, i.e., blastn.
5. Press the Search button and wait while the sequence is compared to the databases and the matches displayed. (There is now a formal queuing system at NCBI,
and you will wait for your results as explained on the page.)
The Washington University-Merck collaboration for EST sequencing (http://
genome.wustl.edu/est/esthmpg.html) generates a large amount of sequencing
information, and pictures of every sequencing gel are available at this site.
The Washington University Medical School Genome Sequencing Centre
(http://genome.wustl.edu/gsc/index.shtml) is also involved in sequencing the
human genome and information can be found here.
2.2.1. Interpreting the Results
The results from the NCBI BLAST server are presented both graphically and
textually. The graphical view shows the query sequence as a thick red line with
base numbers attached to it. Below this are a series of thin lines which represent matches to the query sequence. The length of the line indicates that part of
Bioinformatics
197
Table 1
Number
1
2
3
4
5
6
7
8
Sequence
GGAAAGAAATGCATAAGCTTTTGCCATTC
TCACCGGATTCAGTCGTCACTCATGGTGATT
TCTCACTTGATAACCTTATTTTTGACGAGG
GGAAATTAATAGGTTGTATTGATGTTGGAC
GAGTCGGAATCGCAGACCGATACCAGGATC
TTGCCATCCTATGGAACTGCCTCGGTGAGT
TTTCTCCTTCATTACAGAAACGGCTTTTTCA
AAAATATGGTATTGATAATCCTGATATGA
ATAAATTGCAGTTTCATTTGATGCTCGATG
AGTTTTTCTAATCAGAATTGGTTAATTGGT
TGTAACACTGGCAGAGCATTACGCTGACT
TGACGGGACGGCGGCTTTGTT
TCCTGGNTCTGTTCTTCATCTTCACCTACTTCAAAGTTCCTGAGACTAAA
GGCCAAATTTGAAGAGCTCAACATGGATCTGTTCCGGTCTACTATGAAGC
GATGTCCAGAAGAATATTCAGGACTTAACGGCTNCAGGNTTTTAACAAAA
ATTGGCAGCCACACGGTGCTGGAGCTGCTGGAGGCTGGCTACTTGCCTGT
CATCGTGGAGAAGCCCTTCGGGAGGGACCTGCAGAGCTCTGACCGGCTGT
GCCCTGTCGAGACACTTGCCTTCTTCACCCAGCTAATCTGTAGGGCTGGA
TACATAATGTATTTATATATTTTTTGTATAATCACTATCTTTGTATTTAC
the query sequence which matches the hit sequence. The color represents the
quality of the match.
Below the picture is a list of files which correspond to these matches sorted
in match-quality order. The first hyperlink is to the file containing the entire
sequence. This is followed by a very brief description of the file. The next
number is a numerical score which represents how good the match was. This
score is hyperlinked to the actual match found between your query sequence
and the match itself. Finally, the last number gives the statistical significance
of the match (the E value) and the chances of finding this match by chance.
2.3. Designing PCR Primers
2.3.1. Designing Primers for PCR Using xprimer
xprimer is a Web-based primer design package. Go to http://alces.med.
umn.edu/xprimerinfo.html to see a detailed explanation of the various conditions that the primers must fulfil.
The purpose of this exercise is to learn how to design primers using xprimer
and the sequence in Table 2 (insert.seq) as the template. This sequence represents an insert in a plasmid plus 50 –100 bp of vector sequence on either side.
198
Brzeski
Table 2
insert.seq
TGTGAGCGGATAACAATTTCACACAGGAAACAGCTATGACCATGAT
TACGAAAGGTGCTTTTGGGGGCCGTCAGGGTCGAGGGTTCCTATTT
CCTGGTCTATGGGGTCCCCGGCTTCGGGAAAGATAATGAAAGCCT
CATCAGCAGGGAGGAGTTTTTAGGGGGGGTCCGCATGGGGGTCCC
CCAAGCGACCGAATTGGCGGCTGAGGCCGTGGTGCTTCATTACAC
CGATTTTCGAGCTCGGTACCCGGGGATCCTCTAGAGTCGACCTGC
AGGCATGCAAGCTTGGCACTGGCCGTCGTTTTACAACGTCGTGAC
TGGGAAAACCCTGGCGTTACCCAACTTAATCGC
1. Start a Web browser (Netscape or Internet Explorer) by clicking on the relevant icon.
2. Go to File/Open in the menubar, enter http://alces.med.umn.edu/webprimers.
html in the dialog box and press the OK button.
3. After connection the Web browser will open the Primer selection (image) window.
4. Click in the Query sequence: text box (towards the bottom of the page).
5. Paste or type the sequence into this text. Don’t worry about any spaces which
might appear.
6. It is possible to fine tune the search parameters, i.e., primer length or Tm difference, by altering the values in the various list boxes but for the moment use the
suggested defaults.
7. Press the Submit button.
8. After a few seconds/minutes the results will be returned in the form of a GIF file
(it has a ‘.gif’ file extension). This is a format for displaying images on a computer, and it is not possible to copy and paste primer sequences from here! If you
want to copy and paste sequences then use the Text version of xprimer available
from the Primer selection (image) window.
9. Compare these sequences with those of the M13 forward (GTTTTCCCAGTCACGAC) and reverse (GGAAACAGCTATGACCATG) primers. Note: The
terms forward and reverse used for M13 primers are not the same as the terms
used for forward and reverse primers.
10. Do they match?
11. Can you find these sequences in insert.seq? Remember that these are PCR primer
sequences and will be given in a 5' to 3' direction for each strand. Remember
insert.seq is single stranded and does not include the complementary strand.
12. Do they match?
2.3.2. Checking the Suitability of Your Primers
The final part of primer design is to ensure that the chosen sequences will
be specific for the required DNA target. This is achieved by repeating the
BLAST search performed earlier. However, in this instance the two PCR primers should be used as the queries to ensure that there are no other sequences
in the database which might be amplified along with your own sequence.
Bioinformatics
199
This is obviously not a guarantee against mis-primes, but it will help avoid
the more obvious problems, such as unknowingly including regions containing repeated sequences.
2.4. The Human Genome Project
The chromosomal location of completed human DNA sequences can be
found at (http://www.ncbi.nlm.nih.gov/genemap/). This Web address contains
data on all chromosomes. Selection of a chromosome number will display a
figure which contains three parts. First, there are three different ways of displaying the mapping data: two RH (radiation hybrid G3 and GB4) and one
genetic map. Second, a drawing of the gene density on this particular chromosome is shown, and, third, the chromosome is drawn as an ideogram. Below
this is a wealth of information on what has been sequenced and its relevance, if
known. This site is continually updated.
Clicking on a region on the GB4 or G3 map will display the available
sequencing information below the mapping data. All this information contains
hypertext links to the actual sequencing data itself.
2.4.1. Genes Associated with Human Diseases
The Online Mendelian Inheritance in Man (OMIM) Web site, edited by
Dr. Victor A. McKusick and his colleagues at Johns Hopkins University, and
elsewhere, contains information on a large number (10,000) of diseases that
have been identified as being linked with particular genes. This site can be
accessed at http://www3.ncbi.nlm.nih.gov/omim and provides not only a
description of the clinical symptoms of the disease but also the genetic lesion
that gives rise to it.
It is possible to display the results from a search of this site in two different ways.
1. Searching the Gene map (http://www3.ncbi.nlm.nih.gov/Omim/searchmap.
html) accesses the database using the name of the disease of interest and will
display the result in the order in which the genes are found on the chromosome.
2. Searching the Morbid map (http://www3.ncbi.nlm.nih.gov/Omim/searchmorbid.
html) will allow a search of the database using the name of the disease of interest
(or a general descriptive term such as anemia) and will display, in alphabetical
order, a list of diseases found that contain the keyword(s). The list contains information on the chromosome location and details of the genetics and clinical symptoms of the disease.
2.5. Sequencing Genomes
The genomes of the following species have been or are being sequenced,
and data can be found at the given Web site.
200
•
•
•
•
•
•
•
•
Brzeski
Human (http://www.ornl.gov/TechResources/Human_Genome/home.html).
Mouse (http://www.informatics.jax.org).
Escherrichia coli (http://www.genetics.wisc.edu).
Haemophilus influenzae (http://www.tigr.org/tdb/mdb/hidb/hidb.html).
Caenorhabditis elegans (http://www.sanger.ac.uk/Projects/C_elegans).
Arabidopsis thaliana (http://genome-www.stanford.edu/Arabidopsis).
Rice (http://www.dna.affrc.go.jp:82).
Yeast (http://genome-www.stanford.edu/Saccharomyces).
A more exhaustive list can be found at http://www.ncbi.nlm.nih.gov/Entrez/
Genome/org.html.
3. Protein Databases
3.1. The Databases
There are essentially three databases: the Protein Information Resource
(PIR ®; http://pir.georgetown.edu), SWISS-PROT ® (http://www.expasy.ch/
prosite) and OWL (http://www.biochem.ucl.ac.uk/bsm/dbbrowser/OWL/
OWL.html).
3.2. The Sequence Retrieval System (SRS)
SRSWWW is a World Wide Web interface to the Sequence Retrieval System
(SRS). It can be accessed at a number of different Web sites. SRSWWW is
widely used because of the simplicity of Web browsers as an interface.
Detailed instructions on how to use SRS can be found in the SRS online
manual (http://www.expasy.ch/srs5/man/srsman.html). Here I will introduce
the basics of the program. In essence, SRS will allow the construction of a
query that will look for the requested information in a number of databases.
This is not as straightforward as it may seem because different databases organize the data into different fields, so it is necessary to construct the query with
care. SRS ensures that this query construction is as simple as possible.
There are a number of SRS Web sites at which users can search various databases. Compare the SRS page at Heidelberg (http://www.embl-heidelberg.de/
srs5; set up to find nucleic acid and protein database entries) with the version of
SRS at SWISS-PROT (http://www.expasy.ch/srs5).
1.
2.
3.
4.
Go to the SWISS-PROT SRS page (http://www.expasy.ch/srs5).
Press the Start button to Start a new SRS session.
Click on the TREMBL check box to deselect it.
A detailed explanation of the databases are available by clicking on the
hyperlinked database name.
5. Press the Continue button.
6. Type oxygen in the first field (leave the default All text in the drop-down list
box) in the SRS: Query Form Page.
Bioinformatics
201
7. Press the Do query button.
8. This search will find over 1000 entries.
9. Press the Back button on your Web browser to return to the SRS: Query Form
Page.
10. Click on the drop down list box to the left of the first text field and select
Description.
11. Press the Do query button.
12. This search will find about 100 entries.
13. Press the Back button to return to the SRS: Query Form Page.
14. On the next line change All text to Organism.
15. Type Homo sapiens in the adjacent text box.
16. Press the Do query button.
17. This search will find just less than 10 entries.
18. This query is looking for database entries in SWISS-PROT that contain only the
word “oxygen” in the Description field and “Homo sapien” in the Organism
field. (It is possible to change this to an OR search in the drop down list box
adjacent to the Do query button.)
19. Using this search technique it is possible to find entries from one or many databases using only one set of search parameters.
3.3. Searching for Database Entries That Match a Sequence
The first step of the human genome sequencing project has involved identifying those DNA sequences most important for a cell: the ones coding for proteins synthesized by the cell and, hence, which define the cell’s enzymatic
complement and thus its function. For this reason, people have been isolating
the mRNAs expressed in cells, converting them to DNA (cDNA), cloning and
sequencing them in their thousands. These expressed sequences (cDNAs)
define those proteins made by a cell and are given the jargon name Expressed
Sequence Tag (EST). As the sequencing of the human genome progresses, the
functions of more and more DNA/protein sequences are identified. It is now
routine to generate many ESTs, which are then sequenced and translated into
proteins that can be compared with the protein databases to determine their
function. You will find a number of such protein sequences derived from ESTs
in Table 3. Compare these against the protein databanks using Basic Local
Alignment Search Tool (BLAST) to find out what they code for:
1. Choose a sequence to use (this can be an in-house sequence or one of those provided in Table 3).
2. Copy the sequence to your clipboard.
3. Now click on Basic BLAST SEARCH at (http://www.ncbi.nlm.nih.gov/BLAST/)
to load a page containing the search form.
4. Paste the copy on the clipboard into the search window.
202
Brzeski
Table 3
Number
1
2
3
4
5
6
7
8
Sequence
GDAAKNQLTSNPENTVFDAKRLI
EKASGKKIPYKVVARREGDVAACY
KLGKSFEMLILGRFIIGVYCGL
KGRTFDEIASGFRQGGASQSDKTPEELFHP
DDERNGWPVEQVWKEMHKLLPFSPDSVV
WRIFTPLLHQIELEKPKPIPYIYGSRG
PGAPGGGGGMYPPLIPTRVPTPSNGAPEIP
AVFYYSTSIFEKAGVQQPVYATIG
5. Click in the Program drop down list box, which at present says blastn (blast
nucleic acid), and choose blastp to carry out a blast search on the protein databases. Now press the Search button and wait while the chosen sequence is compared to the databases and the matches displayed.
3.3.1. Interpreting the Results
The results from the NCBI BLAST server are presented both graphically and
textually. The graphical view shows the query sequence as a thick red line
with base numbers attached to it. Below this are a series of thin lines which
represent matches to the query sequence. The length of the line indicates which
part of the query sequence matches the hit sequence. The color represents the
quality of the match.
Below the picture is a list of files corresponding to these matches and sorted
in match-quality order. The first hyperlink (blue and underlined) is to the file
containing the entire sequence. This is followed by a very brief description of
the file. A numerical score represents how good the match was. This score is
hyperlinked to the actual match found between your query sequence and the
match itself. Finally, the last number gives the statistical significance of the
match (the E value) and the chances of finding this match by chance.
Note that the color of the line represents a hit of poor quality. However,
clicking on the hyperlinked colored line will display the matching sequence,
which will be very similar. The reason for the apparently poor match is that the
chance of finding such a short sequence match is high and so the score will be
correspondingly low.
3.4. Aligning Protein Sequences Using CINEMA
There are two commonly used programs for sequence alignment:
CLUSTALW and pileup. One of these programs (CLUSTALW) can be accessed
using a Web browser and a Java Applet called CINEMA (Colour Interactive
Bioinformatics
203
Editor for Multiple Alignment). This applet will access local or database
sequences over the Internet and then, once they have been retrieved, align them.
The alignments are color coded. If you wish to modify the alignment, it is
possible using the CINEMA interface.
The purpose of an alignment is to compare two sequences and align the
related regions to identify conserved and non-conserved regions. This alignment is built on the underlying assumption that the two sequences being
aligned have evolved from a common precursor. If this evolutionary relationship is, in fact, true, then substitution, addition, or deletion of amino acids will
be a rare occurrence because of the evolutionary constraints on biological
function; the relationship is scored by assigning positive and negative values
to matches and mismatches. However, not all amino acid changes are necessarily equally disadvantageous (for instance, the substitution of one hydrophobic amino acid with another is less likely to cause dramatic changes in
protein structure than substituting a hydrophobic amino acid with a polar one).
Each substitution has a “cost” associated with it and this cost is contained in
tables which have such names as PAM-30, PAM-70, BLOSUM-80, and
BLOSUM-62. This concept of “cost” is also true for the introduction of gaps
into either sequence (addition or deletion of amino acids). The introduction of
gaps is an undesirable event and so the introduction of gaps carries penalties
in the summation of the final score.
There are penalties to pay for mismatches and introduction of gaps into an
alignment. Depending on the specific aims of your own particular alignment,
you might want to change these penalties (press the Advanced button in the
CLUSTALW interface window). If you do so, then the results you obtain will
probably be different. The default values suggested by the program are a good
starting point. Don’t be afraid to experiment with these penalties to look for
less obvious similarities.
The CINEMA home page can be found at http://www.biochem.ucl.ac.uk/
bsm/dbbrowser/CINEMA2.1. Alternatively, if this server is proving slow, then
try one of the mirror sites at Venus Internet (http://www.venus.co.uk/cinema)
or The Weizmann Institute (http://bioinformatics.weizmann.ac.il/CINEMA).
1. Go to the CINEMA home page (http://www.biochem.ucl.ac.uk/bsm/dbbrowser/
CINEMA2.1) directly into a Web browser.
2. In the top window click on Applet here under the CINEMA logo.
3. This will load a separate window entitled CINEMA which contains multiple color
sequences.
4. Select File/Clear all in the menu bar to give a clean starting window.
5. Select Pluglets/Load pluglets in the menu bar.
6. This opens the Load Pluglet window, and you should select Clustal and then
press the Load Pluglets button. AutoAlign will appear in the menu bar.
204
Brzeski
7. Press the Close button in the Load Pluglet window.
8. Use SRS at SWISS-PROT to find human globin sequences (All text = globin,
Organism = Homo sapiens) and note the SWISS-PROT file names, e.g., HBA
HUMAN.
9. In the CINEMA window.
EITHER
a. Press the DB seq button
b. In the Load database sequence window, delete Enter ID code here and then
EITHER
i. Enter the OWL code (use the protein ID code, e.g., opsd_sheep, not accession number).
OR
i. Change the Database name to SWISSPROT (or PIR) in the drop down list
box at the top of the window.
ii. Enter the SWISS-PROT (PIR) code, e.g., hba_human (this is not case
sensitive).
c. Press the Get sequence button.
d. The requested sequence will be loaded into the CINEMA window.
e. Repeat this procedure until you have accumulated all your sequences.
OR (if the OWL server is down)
a. Load a database file in the browser window (e.g., from SWISS-PROT) by
clicking on the relevant hyperlink.
b. Find the protein sequence at the end of the file.
c. Drag the mouse across the sequence to select it (you will know it is selected
because the sequence is now seen as white text on a black background; don’t
worry if you have selected numbers.
d. Choose Edit/Copy from the menu bar
e. Click on the button labeled CINEMA in the task bar at the foot of the screen.
f. Click on the Seq Editor button.
g. Give your sequence a title in the Accession name window.
h. Click in the large text window at the bottom and
EITHER
i. Press Ctrl-V to paste your sequence from the clipboard
OR
i. Right click in the window then select Paste from the Shortcut menu.
ii. Press the Add sequence button.
iii. Press the Clear All button then repeat this procedure until you have
included all the required sequences.
10. Select AutoAlign/Clustal interface in the menu bar.
11. In the CLUSTALW interface window note that you have a series of dark gray buttons with white text on them which will indicate the progress of the alignment.
12. In the CLUSTALW interface window enter a name for your job and then press the
Submit job button.
Bioinformatics
205
a. You can fine tune your search by pressing the Advanced button. This will give
you the opportunity of using a different scoring matrix (default is PAM 250) or
by altering the criteria used for the alignment, e.g., by changing the penalties
for opening or extending a gap.
13. When the alignment has been performed the dark gray buttons will change to
light gray and the text will become blue.
14. The alignment will be loaded into the CINEMA window so you should clear this
first by switching to the CINEMA window and choosing File/Clear all from the
menu bar.
15. Move back to the CLUSTALW interface window and view your alignment by
pressing the Load Alignment button.
16. Note that
a. The amino acids are color coded according to their properties, e.g., Polar positive—H, K, R (Blue); Polar negative—D, E (Red); Polar neutral—S, T, N, Q
(Green); Non-polar aliphatic-A, V, L, I, M (White); Non-polar aromatic-F, Y,
W (Purple); P, G (Brown); and C (Yellow). Colors can be viewed and modified by pressing the COLORS button.
b. Where gaps have been introduced this is indicated with a - (dash).
c. You can move through the aligned sequences using the scroll bars on the
CINEMA window.
3.5. Comparing 2D Gels in Databases from Different Tissues
Identifying differences between two 2D gels is not always easy. Using the
Flicker program it is possible to compare two 2D gels on the screen at the same
time, and this program will make differences between the two gels more obvious by making the unique spots flicker.
1. Go to the Flicker Web site, http://www-lmmb.ncifcrf.gov/flicker.
2. Scroll down the page until you see C) Lists of 2D PAGE gel images—you pick
two from each list to compare (in Section 1.1), then locate 6.T-lymphocyte
phosphoproteins from IL-2/IL-4 dependent cell line 2D gel studies and click
on this. The reason for choosing these gels are that they contain only phosphoproteins; this makes the patterns simpler and so differences are more easily seen.
3. Click on the hyperlink Select two gels and Flicker Compare them and then
accept the default choices, i.e., lymphocyte-T_mouse_32P_59g-PPDB - G1phase in the upper window and lymphocyte-T_mouse_32P_59h-PPDB - G2/
M-phase in the lower window.
4. Press the Go Flicker button.
5. This may take some time to display the gels but you will eventually see a new
page with two 2D gels, one from each stage of the cell cycle, at the bottom of
the window.
6. Each gel image will have a set of cross hairs in blue. Look at the two gels and
a. Decide on a common spot,
206
Brzeski
b. Press and hold down the Control key (Ctl), and
c. Click on the common spot with the mouse in each gel.
7. This will move the gel image and position the cross hairs onto the spot. If you are
not happy with the position then repeat this procedure.
8. Scroll back up the screen and click in the Flicker box to check it. The two images
will be viewed in quick succession so that small changes can be easily seen.
3.6. Comparing 2D Gels in House from Different Tissues (Flicker)
This is relatively easy to accomplish as long as you can download your 2D
gels onto a Web server that can be accessed using a normal Web addressing
system.
1. Log onto the Flicker home page, http://www-lmmb.ncifcrf.gov/flicker.
2. Once you have connected with the Flicker page you should scroll down the page
until you see 4. Flicker compare images from any two URLs, then scroll further until you get to Enter two images URLs:.
3. Click in the Left image box and type http://www.herts.ac.uk/natsci/Bio/
2Dimages/Image10alt.gif (or select, copy, and paste!).
EITHER
a. Click in the Right image box and type in the gel address, i.e., http://www.
herts. ac.uk/natsci/Bio/2Dimages/Image12alt.gif (or select, copy, and paste!)
OR
a. Drag the mouse cursor across the whole of the address you have just typed in
step 3 to highlight it.
b. Hold down (Ctrl).
c. Press and release the C key to copy the address to the clipboard.
d. Click in the Right image box.
e. Hold down Ctrl.
f. Press and release the V key to paste the address into the box.
g. Edit the address to give http://www.herts.ac.uk/natsci/Bio/2Dimages/
Image12alt.gif (or select, copy, and paste!).
4. Now press the Go Flicker button.
5. The relevant gels and the program to view them will now be downloaded. This
may take some time but you will eventually see a new page with your two 2D
gels. These will be found at the bottom of the window, and if you can’t see them
then scroll down the window.
6. Each gel image will have a set of cross hairs in blue. Look at the two gels and
decide on a common spot, press and hold down Ctl, and click on the common spot
with the mouse in each gel. This will move the gel image and position the cross
hairs on the spot. If you are not happy with the position then repeat this procedure.
7. Now scroll back up the screen and click in the Flicker box to check it. The two
images will be viewed in quick succession so that small changes can be easily
seen.
Bioinformatics
207
4. URLs Cited
Chromosomal location of genes, http://www.ncbi.nlm.nih.gov/genemap
Chromosomal location of completed human DNA sequences, http://www.ncbi.
nlm.nih.gov/genemap
CINEMA, http://www.biochem.ucl.ac.uk/bsm/dbbrowser/CINEMA2.1
Entrez, NCBI http://www.ncbi.nlm.nih.gov/Entrez
fFlicker (comparing two images), http://www-lmmb.ncifcrf.gov/flicker
Genes associated with human diseases, http://www3.ncbi.nlm.nih.gov/omim
Genomes which have been or are being sequenced:
Human, http://www.ornl.gov/TechResources/Human Genome/home.html
Mouse, http://www.informatics.jax.org
E. coli, http://www.genetics.wisc.edu
Haemophilus influenzae, http://www.tigr.org/tdb/mdb/hidb/hidb.html
Caenorhabditis elegans, http://www.sanger.ac.uk/Projects/C elegans
Arabidopsis thaliana, http://genome-www.stanford.edu/Arabidopsis
Rice, http://www.dna.affrc.go.jp:82
Yeast, http://genome-www.stanford.edu/Saccharomyces
A list can be found at http://www.ncbi.nlm.nih.gov/Entrez/Genome/org.html
Human genome, http://www.ornl.gov/TechResources/Human Genome/research.
html
Human diseases which have been identified as being linked with particular genes.
This site can be accessed at the NCBI home page, http://www3.
ncbi.nlm.nih.gov/omim
OWL, http://www.biochem.ucl.ac.uk/bsm/dbbrowser/OWL/OWL.html
PCR primers, xprimer, http://alces.med.umn.edu/xprimerinfo.html and http://
alces.med.umn.edu/webprimers.html
Positioning ORFs on 2D gels, http://expasy.hcuge.ch/ch2d
ProDom (protein domains), http://protein.toulouse.inra.fr/prodom.html
Protein Information Resource (PIR), http://pir.georgetown.edu
SWISS-PROT, http://www.expasy.ch/sprot/sprot-top.html
Sequence retrieval system (SRS), http://www.expasy.ch/srs5/man/srsman.html
or http://www.embl-heidelberg.de/srs5/ c) http://www.expasy.ch/srs5/
Searching the OMIM Gene Map, http://www3.ncbi.nlm.nih.gov/Omim/
searchmap.html
Searching the OMIM Morbid Map, http://www3.ncbi.nlm.nih.gov/Omim/
searchmorbid.html
The address of the online version of this chapter, http://www.herts.ac.uk/natsci/
Bio/informatics.htm
Washington University-Merck collaboration for EST sequencing, http://genome.
wustl.edu/est/esthmpg.html
Washington University Medical School Genome Sequencing Center, http://
genome. wustl.edu/gsc/index.shtml
208
Brzeski
4.1. Other URLs Concerned with Bioinformatics
1. University College London, A Taste of Bioinformatics, http://www.biochem.
ucl.ac.uk/bsm/dbbrowser/jj. The aim of this tutorial is to provide a gentle introduction to sequence and structure function analysis.
2. DNA Learning Center Cold Spring Harbor Laboratory, Online DNA Sequence
Analysis and Comparison Tutorial, http://vector.cshl.org/SequenceAnlaysis
Exercise/index1.html.
This tutorial uses reference human mitochondrial DNA sequences and online
resources to:
• Search for like DNA sequences in online databanks
• Locate DNA sequences in genomes
• Compare modern human DNA sequences
• Compare modern human DNA sequences to Neanderthal
• Compare modern human DNA sequences to other organisms
3. EMBnet, DNA analysis tutorial, http://www.ie.embnet.org/other/tut.html.
This tutorial considers three popular sets of DNA and protein sequence analysis programs:
• The Staden Package, from Rodger Staden et al., MRC Laboratory of Molecular Biology, Cambridge, UK
• The Wisconsin Package (GCG), from the Genetics Computer Group, Inc.,
Madison, WI.
• EGCG (Extended GCG) from a consortium of researchers mostly based in
Europe at EMBnet Nodes.
4. University of Adelaide, A tutorial on sequence analysis: From sequence to structure, http://www.microbiology.adelaide.edu.au/learn/index.html
An unusual tutorial by Harry Mangalam subtitled, “one person’s cautionary
tale of model building.”
Index
209
Index
A
ABI PRISM, 111, 122
Agarose, see Gel electrophoresis
Amplification refractory mutation
system (ARMS), see ASO-PCR
Alkaline phosphatase, 18
Allele-specific oligo PCR (ASO-PCR),
44, 47,
cycling conditions, 49
primer design, 49
Autoradiography, 20, 32, 69
B
Basic Local Alignment Search Tool
(BLAST), 196, 201
Big Dye™ Terminators, 66, 71, 119
Bioinformatics, 193
BiomassPROBE, 184, 185
Biotin, 57
Bovine serum albumin, 13
Bromophenol blue, 4, 9
C
CA repeat, 30
CDP-Star™, 171
Capillary electrophoresis, 160
Capillary transfer, see Southern
blotting
Chemical cleavage of mismatch
(CCM), 109
Chemiluminescence detection, 174
Chromosome paint, 73
CINEMA, 203
Cleavase fragment length
polymorphism (CFLP), 165
Clustal analysis, 120, 202
Competitive in situ suppression, 86
Complementary DNA (cDNA), 40
Conformation sensitive gel
electrophoresis (CSGE), 137
Counter staining, 82
Cycle sequencing, see Sequencing
Cystic fibrosis, 152, 157, 158, 159
D
DAPI, 78
Databases, genetic, 194
Denaturing gradient gel electrophoresis
(DGGE), 109, 125,
preparation of, 130
gel staining of, 132
Denaturing high performance liquid
chromatography, 110
Dideoxy fingerprinting, 165
Digoxygenin, 19
Dimethylsulfoxide, 44
Dithiothreitol (DTT), 41
DNA,
affinity capture, 60
end-labeling, 17, 170
extragenic, 29
GC content, 44, 49, 62
hairpin structures, 44
internal labeling, 13
intragenic, 29
interphase, 73
isolation, 115
melting temparature (Tm), 44,
126, 128
metaphase, 73
209
210
mitochondrial, 51, 58
misincorporation, 51
PCR of, see Polymerase chain reaction
paraffin embedded, 37
probes, see Probes
random primer labeling, 13
restriction of, 31
size standards, 6,
staining, 8
visualization, 8
DNA polymerase I, 13
Duchenne muscular dystrophy
(DMD), 88
DYEnamic dyes, 66
Dynabeads, 61
E
EMBnet, 208
Ethidium bromide, 1, 42, 147
Exonuclease I, 71, 170
Expressed sequence tag (EST), 196
F
Factor VIII deficiency, 29
Fill-in reaction, 17
Flicker, 205
Fluorescence, 15, 19, 73
Fluorescent in situ hybridization
(FISH), 73,
multicolor, 75
Fluoricon, 61
Formaldehyde, 153, 160
Fragile X syndrome, 39
G
Gel electrophoresis,
agarose, 1, 97,
low melting temperature, 3
size separation, 3, 4
polyacrylamide, 1, 94, 119, 171,
formulation of, 10, 119
denaturing, 4, 130, 141, 153,
destaining of, 10
Index
N,N'-methylene-bis-acrylamide, 3
SDS-PAGE, 94
two-dimensional, 206
Gel drying, 155
Geneclean, 67, 71, 122
Genome sequencing, 199
Giemsa banding, 75
Glycogen, 79
Gradient maker, 129
H
High performance liquid
chromatography (HPLC), 61
Hemophilia A, 29, 109, 110
Heteroduplex analysis, 151
Heteroplasmic mutations, 58
Heterozygosity, 30
Hexanucleotides, 14
Histopaque, 111
Human genome project, 179, 199
Hybond, 25, 26, 31
Hybridization, 30, 31, 32, 80
Hydrolink, 160
Hyperfilm, 32
I
Ion exchange column, 61
Immunoprecipitation, 100
Industrial genomics, 180
Internal transcribed spacer, 169
K
Kinase reaction, 17
Klenow polymerase, 14, 19
L
Labeling, of DNA, see DNA
Linear amplification, 65
Luciferase, 99
Lymphocyte, isolation of, 111
M
MALDI-TOF, 181
Index
Mass array technology, 179
Mass spectrometry, 181
M13, 139
Melting domains, 126
Microcon, 67, 71
Maloney murine leukemia virus
(MMLV), 41
N
Nanoliquid, 189
National Center for Biotechnoloy
Information (NCBI), 195
Nick translation, 13, 76
Nylon, 23
Nucleon II, 103
O
Oligo-dT primer, 44, 102
Online Mendelian Inheritance in Man
(OMIM), 199
Osmium tetroxide, 114, 117
P
P1 artificial chromosomes (PAC), 78
Pharmacogenetics, 180
Polyacrylamide, see Gel
electrophoresis
Polyethylene glycol (PEG), 44
Polymerase chain reaction (PCR), 37,
allele-specific, see ASO-PCR
betaine, 43
expand system, 52
GC clamp, 126
Gene Ampl XL, 52
hot start, 43, 53, 96, 105
nested, 39
long-range, 39, 51, 120
magnesium, 55
multiplex, 39
primer-dimers, 43
primer design, 140
purification, 70, 172
211
RT-PCR, 44, 88, 92, 112, 120
Reverse transcriptase, see Reverse
transcriptase
secondary, 116
Taq Plus™, 52
template DNA, 53
Probes, 13, 17,
centromeric, 75
detection, 82, 83
multiprobe, 75
plasmid, 78
repetitive sequence, 73, 80
single copy, 75, 80
Protein Information Resource (PIR), 200
Protein truncation test (PTT), 87
Propidium iodide (PI), 78
PWO DNA polymerase, 39
Push column, 15
R
Rainbow markers, 95, 105
Redivue™, 94
Restriction enzymes, 17, 30
Restriction length fragment
polymorphism (RFLP), 29
Reverse transcriptase, 39, 52, 92,
112, 116
Rhodamine-DUTP, 15
RNA, 42,
extraction, 115
rRNA, 169
RNeasy extraction, 102
RNAse inhibitor, 41
S
Sephadex, 14, 15, 21
Sequence navigator, 114
Sequence Retrieval System (SRS), 200
Sequencing, of DNA,
automated, 66
Maxam-Gilbert sequencing, 17
mini-sequencing, see Solid phase
mini-sequencing
212
Index
PCR cycle, 65
Sanger, 65, 183
stutter fragments, 183
Sex typing, 188
Short tandem repeats (STR), 179
Sigmacote, 6
Silver staining, 153
Single nucleotide polymorphism
(SNP), 179
Single strand conformation
polymorphism (SSCP),
109, 151
Solid phase mini-sequencing, 57
Southern blotting, 23, 30, 31
SpectroCHIP, 185, 189
Streptavidin, 57
Stringency, 76, 77, 82
SWISS-PROT, 200
TEMED (N,N,N',N' tetramethylethylenediamine), 4, 7, 98
Tetramethylammonium chloride
(TMAC), 43
Thermal cycler, 38, 148
Transcend detection system, 104
Transilluminator, 7, 24
Trichloroacetic acid (TCA), 21
Tris-acetate (TAE), 2,
formulation of, 9
Tris-borate (TBE), 2,
formulation of, 9
TRIzol, 102
T
Variable number tandem repeats
(VNTR), 29
Von Willebrand disease, 141
Taq polymerase, 38, 49, 60, 93
Temperature denaturing gradient gel
electrophoresis (TGGE), 126
T4 polynucleotide kinase, 17
T7 RNA polymerase, 87
U
Ultraviolet radiation, 2
Uracil N-glycosylase, 43
V
X
X primer, 197
Xylene cyanol, 4, 9
METHODS IN MOLECULAR BIOLOGY • 187
TM
Series Editor: John M.Walker
PCR Mutation Detection Protocols
Edited by
Bimal D. M. Theophilus
Department of Haematology, Birmingham Children’s Hospital NHS Trust, Birmingham, UK
Ralph Rapley
Department of Biosciences, University of Hertfordshire, Hatfield, UK
Application of DNA technology to the identification of disease-causing mutations has become
widespread in recent years. PCR Mutation Detection Protocols provides biological and clinical investigators with a comprehensive collection of new, recent, and updated PCR-based screening methods
suitable for detecting the presence of both known and novel mutations. The methods cover point
mutations (e.g., ASO-PCR, SSCP, DGGE, chemical cleavage), deletions (multiplex PCR, FISH, blotting), non-sense mutations (PTT), and more. The new and exciting techniques of DNA array analysis,
along with such recently developed experimental methods as conformation-sensitive gel electrophoresis, are also included. Additional coverage is given to the direct use of DNA sequencing as a
detection method in its own right and to the characterization of mutations previously located by other
screening techniques. Each chapter explains the basic theory behind the technique and provides
valuable notes essential for its successful execution.
Comprehensive and highly practical, PCR Mutation Detection Protocols assures both seasoned
and novice investigators access to the highly productive and readily reproducible PCR-based mutation
detection methods, techniques that are laying the groundwork for many of today’s major scientific and
medical advances.
FEATURES
• All the key PCR-based mutation detection methods
in a readily reproducible format
• Methods for detecting a known mutation or
screening for new mutations
• New techniques of DNA array analysis
• Experimental methods such as conformationsensitive gel electrophoresis
CONTENTS
Agarose and Polyacrylamide Gel Electrophoresis. Internal
Labeling of DNA Probes. End-Labeling of DNA Probes.
Southern Blotting of Agarose Gels by Capillary Transfer.
Restriction Fragment Length Polymorphism. PCR: Principles, Procedures, and Parameters. Allele-Specific Oligonucleotide PCR. Long-Range PCR. Analysis of Nucleotide
Sequence Variations by Solid-Phase Minisequencing.
Cycle Sequencing of PCR Products. Fluorescent In Situ
Hybridization. The Protein Truncation Test. Mutation
Detection in Factor VIII cDNA from Lymphocytes of Hemophilia A Patients by Solid Phase Fluorescent Chemical
Cleavage of Mismatch. Denaturing Gradient Gel Electrophoresis. Conformation-Sensitive Gel Electrophoresis.
SSCP/Heteroduplex Analysis. Cleavase® Fragment
Length Polymorphism Analysis for Genotyping and Mutation Detection. Automated Genotyping Using the DNA
MassArray™ Technology. An Introduction to Bioinformatics. Index.
90000
Methods in Molecular BiologyTM • 187
PCR MUTATION DETECTION PROTOCOLS
ISBN: 0-89603-617-0
humanapress.com
9 780896 036178