1
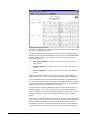
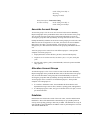
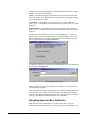
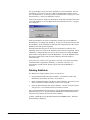
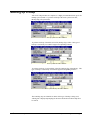
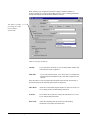
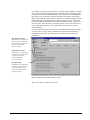
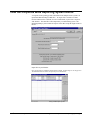
The variable should be given a description that will appear in the title or legend
when the graph is viewed. Next, select the Type of Formula from the pull down list.
Then, build a formula by selecting the datafields and expressions. See Chapter 10
Setting up User-Defined Formulas and Expressions for more information.
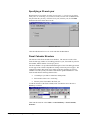
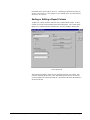
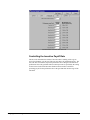
Specifying the Graph’s Default View
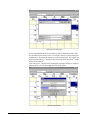
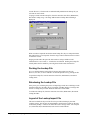
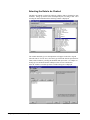
After at least one variable is set up, the line graph can be viewed. Default values are
automatically established for the type of graph, Y-axis scale, accounts and years to
be plotted. These values can be changed while viewing the graph by both an
administrator or lower level user. The changes made by a lower level user are only
temporary and never saved in the layout. The changes made by an administrator can
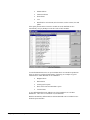
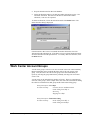
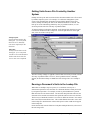
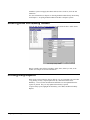
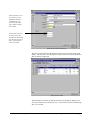
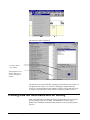
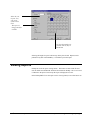
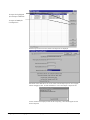
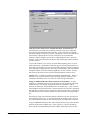
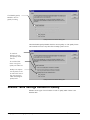
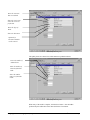
be either temporary or permanent. To allow saving changes made while viewing the
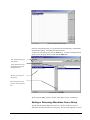
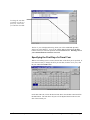
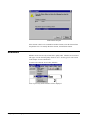
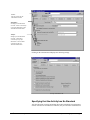
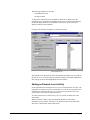
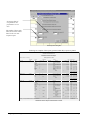
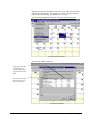
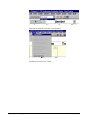
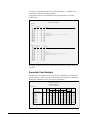
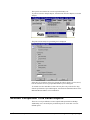
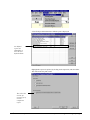
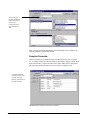
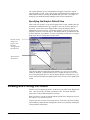
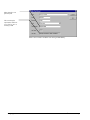
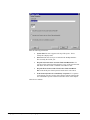
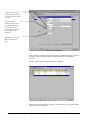
graph, check the save settings box as shown below.
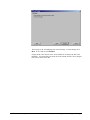
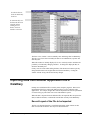
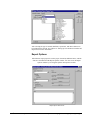
To allow saving
changes to a
graph’s scale
and other
viewing options
check this box.
Then click the
Next button.
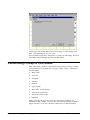
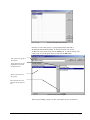
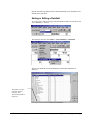
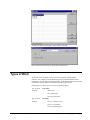
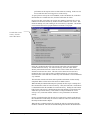
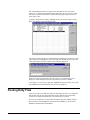
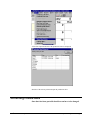
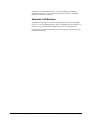
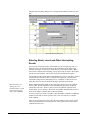
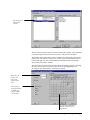
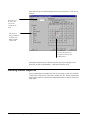
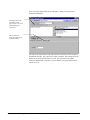
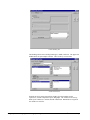
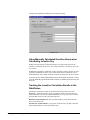
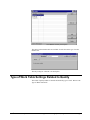
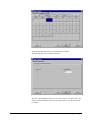
Click the Next button to change the graph’s default view. The View Line Graph
window is displayed. At this point, the process is actually the same as if you were
only viewing the graph. However, after saving the changes to the default view, you
will be returned to the Edit Line Graph window where you can save the graph layout
to disk.
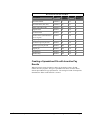
Viewing and Printing Pie Charts
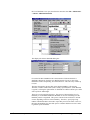
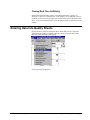
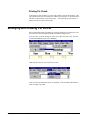
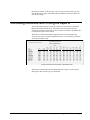
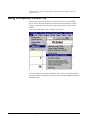
All users can view and print pie charts. On the screen, pie charts can be displayed in
color. On a color printer, pie charts are printed in color. On a black and white
printer, they can be printed with distinctive patterns.
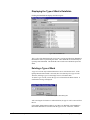
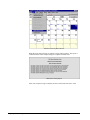
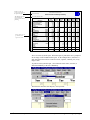
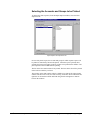
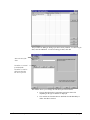
When a pie chart is viewed, the settings and time period can be changed by any level
user. This is a very interactive process.
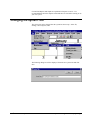
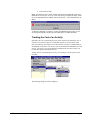
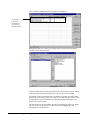
To print a pie chart, it is first viewed on the screen. If necessary, the chart’s settings
can be modified. When the chart is displayed as desired, it is printed by clicking the
viewing window’s Print button.
238 • Chapter 16: Charts and Graphs
User’s Guide to ProRep