1
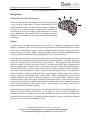
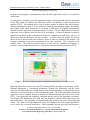
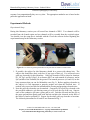
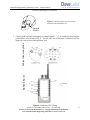
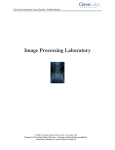
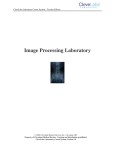
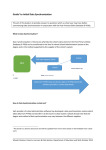
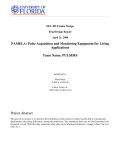
Biomedical Engineering Laboratory Course - Student Edition
Electroencephalography II Laboratory
© 2005 Cleveland Medical Devices Inc., Cleveland, OH.
Property of Cleveland Medical Devices. Copying and distribution prohibited.
CleveLabs Biomedical Engineering Laboratory Course Version 3.0
Biomedical Engineering Laboratory Course - Student Edition
Electroencephalography II Laboratory
Introduction
Several neurological disorders exist that can have an impact
on brain function. Often these disorders can be examined
by reviewing the electroencephalograph or EEG signal.
Quantitative features of the EEG signal in both the temporal
and spectral domain can be used for diagnosis. One
important clinical disorder that can be diagnosed using the
EEG signal is seizures. Seizures and status epilepticus can
be potentially life threatening conditions. For convulsive
seizures, visual observation is usually used in the
emergency department setting to establish the diagnosis.
However, non-convulsive seizures (NCS) may produce
altered mental state or behavior with only subtle,
ambiguous, or absent motor components. Typically the
clinical features include coma, psychomotor retardation,
drowsiness, inattentiveness, aphasia, limb posturing,
abnormal eye movements, cortical blindness, automatisms,
delusions, paranoia, and agitation. In unresponsive patients,
physicians typically look for ocular deviation or nystagmoid eye movements, periodic facial or
eyelid twitching, or unexplained fluctuation in responsiveness. However, by definition, there are
no convulsions (including twitching) in a true non-convulsive seizure. Thus, clinicians are left
with only a vague hint that a seizure may be occurring, but not a diagnosis. The only way to
definitively diagnose NCS is by EEG recordings, rather than by clinical observation.
During this laboratory session, students will record EEG from the surface of their scalp. They
will collect four channels of their own normal EEG signals and compare it to EEG signals in an
abnormal clinical database. Students will examine quantitative features of the EEG signal that
can be useful in the diagnosis of neurological disorders.
Equipment required:
• CleveLabs Kit
• CleveLabs Course Software
• Seven (7) Gold cup electrodes
• Conductive Gel
• Gauze and skin preparation
• Microsoft Excel®, MATLAB®, or LabVIEW™
© 2005 Cleveland Medical Devices Inc., Cleveland, OH.
Property of Cleveland Medical Devices. Copying and distribution prohibited.
CleveLabs Biomedical Engineering Laboratory Course Version 3.0
1
Biomedical Engineering Laboratory Course - Student Edition
Electroencephalography II Laboratory
Background
Clinical Disorders and EEG Responses
There are approximately 100 million visits to emergency rooms
every year in the United States. Of these, approximately 8-10%
of the emergency room visits involve acute cerebral dysfunction
or injury, or 8-10 million people. Utilizing EEG recordings in
the emergency room may improve clinical outcomes in a large
patient population. One reason for EEG screenings not being a
standard of care includes the lack of appropriate EEG monitoring
technology.
Epilepsy
As stated above, an important application of the EEG is to diagnose neurological disorders.
Epilepsy is a disease of the nervous system that is characterized by uncontrolled activity of part
or all of the central nervous system. There are different kinds of epilepsy, such as grand mal,
petit mal, and focal epilepsy. Epileptic seizures are characterized by usually synchronized neural
activity, resulting in abnormally large amplitude EEG activity during an attack.
Grand mal epilepsy involves neuronal discharges in all areas of the brain, including the cortex,
the deeper parts of the cerebrum, and even the brain stem and thalamus. Generally, grand mal
attacks last anywhere from a few seconds to a few minutes. During grand mal the individual
may lose control of visceral and motor control. Petit mal involves the basic thalamocortical
brain activating system. Often referred to as absence epilepsy, an individual suffering from a
petit mal attack will lose consciousness for up to thirty seconds, experience several twitch-like
contractions in the head and neck regions, and then resume previous activities. Occasionally, a
petit mal attack can initiate a grand mal attack. Focal epilepsy usually results from localized
organic lesions or abnormalities such as scar tissue. These abnormalities can cause rapid
neuronal discharge that spread to adjacent regions in a wave-like fashion. When the wave
reaches the motor cortex, the person experiences Jacksonian epilepsy, where muscles contract
progressively down the body. Multi-channel EEG recordings can be used to identify the location
of the earliest component of the seizure activity. Such a trigger zone may be removable by
surgery to eliminate the seizure disorder.
Researchers are developing electronic devices to automatically detect these abnormal bursts, or
'spikes', of electrical activity in the brain. If the onset of a seizure could be detected early
enough, then it may be possible to intervene by administering drugs or electrical stimulation to
the brain before an attack occurs. A problem with this technique, however, is that these rhythmic
spikes occur quite often in normal EEG's as well.
© 2005 Cleveland Medical Devices Inc., Cleveland, OH.
Property of Cleveland Medical Devices. Copying and distribution prohibited.
CleveLabs Biomedical Engineering Laboratory Course Version 3.0
2
Biomedical Engineering Laboratory Course - Student Edition
Electroencephalography II Laboratory
Seizure Activity
Certain patterns in the EEG signal indicate seizure activity. These patterns include spikes, sharp
waves, and spike-and-wave discharges. Spikes and sharp waves occur during seizures resulting
from partial epilepsy. Partial epilepsy means that there is increased neuronal activity in only part
of the brain. Generalized epilepsy, on the other is indicated by spike-and-wave discharges.
These discharges are seen throughout the brain.
Grand Mal
Grand mal epilepsy is a condition is a type of generalized epilepsy where there is extreme neural
activity in all parts of the brain. These discharges originate in the brainstem portion of the
reticular activating system (RAS). A discharge transmitted to the spinal cord will result in a
tonic seizure. The EEG during grand mal attack shows a signal that is synchronous and that has
a high-voltage magnitude. This signal has the same periodicity as normal alpha waves. Grand
mal attacks have been shown to be brought on by hyperexcitability of the neurons that make up
the RAS structure or by abnormality in the local neuronal pathways.
Non-Convulsive Seizures
As described above non-convulsive seizures can be particularly dangerous since little to no
clinical observations can be made to diagnose the condition. The abnormal electrical activity of
the brain can exist and cause damage before a diagnosis is made. Even more severe than NCS,
Non-Convulsive Status Epilepticus (NCSE) is also not only prevalent, but also more dangerous, due
to its longer, continuous duration. No universally accepted definition for NCSE exists. However, in
general, episodes must be continuous or recurrent for longer than 30 minutes without improvement
in the patient’s clinical state.
Visual Evoked Potentials
While it is not a clinical disorder, EEG patterns can also be created by visual stimuli. Visual
evoked potentials are the components of the EEG that arise in response to a visual stimulus.
EEG is recorded while patients are subjected to visual stimuli. Visual evoked can be used to
examine the visual pathway. Abnormalities can indicate lesions of the optical nerve or multiple
sclerosis.
Electroencephalography Analysis Methods
As explained above and as you will see in lab course software examples, there are different types
of EEG patterns that can be produced by the brain based on electrode location, environmental
inputs, and clinical conditions. One method for diagnosing abnormalities is through a visual
inspection of the EEG signals by a trained clinician. However, a trained physician is not always
readily available to review these recordings. Therefore, it may be advantageous to use a
© 2005 Cleveland Medical Devices Inc., Cleveland, OH.
Property of Cleveland Medical Devices. Copying and distribution prohibited.
CleveLabs Biomedical Engineering Laboratory Course Version 3.0
3
Biomedical Engineering Laboratory Course - Student Edition
Electroencephalography II Laboratory
computer based program to quantitatively assess the EEG signal and classify it as a particular
clinical state.
Several tools are available to provide quantitative analysis of temporal and spectral components
of the EEG signal. In addition, this laboratory session will introduce a joint time-frequency
analysis (JFTA). This method allows users to analyze signals in both the time and frequency
domains simultaneously (Fig 4). It is a useful tool to analyze non-stationary signals. Essentially,
this method yields which frequencies are occurring at what times. A graphical representation
illustrates how the signal power spectrum changes over time. The basic approach is to divide the
signal into several discrete intervals that can be overlapped. A Fourier transform can then be
applied to each block of data to illustrate the frequency components of each block. The size of
the discrete intervals determines the time accuracy. In other words, the smaller the discrete
blocks of time is, the better the time resolution. However, there is a tradeoff to this method. The
frequency resolution is inversely proportional to the time resolution. This is known as the
window effect. The small the discrete interval of time, the less resolution of frequency is
provided. The algorithm described above is known as a short-time Fourier transform (STFT).
Figure 1. A joint time-frequency analysis can be useful for analyzing many physiological signals.
Other algorithms that can be used in the JFTA method include an adaptive spectrogram, a ChoiWilliams distribution, a Cone-shaped distribution, Wigner-Ville distribution, and the Gabor
spectrum. Each algorithm has a unique impact on the time and frequency resolutions that can be
achieved, cross-term interference, and computational speed. The Gabor algorithm expands the
signal into a set of weighted frequency-modulated Gaussian functions and is the inverse of the
STFT. It has good time and frequency resolution and the speed of the algorithm is moderate.
The Wigner-Ville distribution gives high time and frequency resolution but suffers from cross
term interference. This algorithm is computationally fast and does not suffer from windowing
effects. The Cohen’s class algorithms such as the Choi-Willimas, and Cone shaped distributions
act to reduce this crossterm interference. Both algorithms provide good time and frequency
© 2005 Cleveland Medical Devices Inc., Cleveland, OH.
Property of Cleveland Medical Devices. Copying and distribution prohibited.
CleveLabs Biomedical Engineering Laboratory Course Version 3.0
4
Biomedical Engineering Laboratory Course - Student Edition
Electroencephalography II Laboratory
response, but computationally they are very slow. The appropriate method to use is based on the
particular application at hand.
Experimental Methods
Experimental Setup
During this laboratory session you will record four channels of EEG. Two channels will be
recorded from the frontal region and two channels will be recorded from the occipital region.
You should view the setup movie included with the CleveLabs software before beginning the
experimental setup for this laboratory session.
Figure 2: Two of the six gold cup electrodes will be placed at O1 and O2 to monitor EEG.
1. If possible, the subject for this laboratory should be a person with shorter hair. The
subject also should have their scalp free of any types of hair gel. You will need seven
gold cup electrodes for this laboratory. Gold cup electrodes will be placed at locations
O1, O2, Fp1, and Fp2 (Figs2, 4) to measure EEG, on each mastoid as references, and at
FpZ (middle of the forehead) for the ground. The mastoid processes (A1 and A2) are the
bony structures that you can feel behind the ears (Fig 3). Before applying electrodes to
the subject it is first important to properly prepare and clean the electrode sites. If
needed, refer to previous labs for information on cleaning and preparing electrode sites.
2. Now the gold cup electrodes can be attached. Generously fill a gold cup electrode with
the provided conductive gel allowing some gel to fill over the top of the cup. Squeeze
some of the conductive gel onto a gauze pad as well. Push the electrode into the gel on
the gauze pad and then gently push aside the hair and place the electrode on the back of
the subject’s head at position O1. Repeat for the other gold cup electrode at locations.
The electrode placements for O1 and O2 are illustrated in Fig 2.
© 2005 Cleveland Medical Devices Inc., Cleveland, OH.
Property of Cleveland Medical Devices. Copying and distribution prohibited.
CleveLabs Biomedical Engineering Laboratory Course Version 3.0
5
Biomedical Engineering Laboratory Course - Student Edition
Electroencephalography II Laboratory
Figure 3: The mastoid processes are the bony
structures located behind the ears.
Mastoid
Process
Subject Rec ording Sites
3. Connect gold cup leads and jumpers to channel inputs 1, 2, 3, 4, and the ground using the
picture below as a reference (Fig 4). The left side view of the head is symmetrical to the
right side view as seen in the top down view.
Fp Z
BioRadio Inputs
A1
Fp Z
Fp 1
Jumper
A1
Fp 2
O1
A2
O2
Figure 4: Laboratory EEGI Setup
© 2005 Cleveland Medical Devices Inc., Cleveland, OH.
Property of Cleveland Medical Devices. Copying and distribution prohibited.
CleveLabs Biomedical Engineering Laboratory Course Version 3.0
6
Biomedical Engineering Laboratory Course - Student Edition
Electroencephalography II Laboratory
Procedure and Data Collection
1. Run the CleveLabs Course software. Log in and select the “Electroencephalography II”
laboratory session under the Advanced Physiology subheading and click on the “Begin
Lab” button.
2. Turn the BioRadio ON.
3. Your BioRadio should be programmed to the “LabEEGII” configuration.
4. Click on the “Raw EEG” data Tab and then on the green “Start” button.
5. You should begin to see four channels of EEG scrolling across the screen. Set the time
scale to show a 2 second window of data. Click on “Screen Capture” to capture a picture
of this to your report. This may not look like EEG yet because you are not filtering out
high frequency noise that may be contaminating the signal such as 60Hz noise.
6. Save approximately 30 seconds of data to a file with the subject sitting relaxed and
looked at the screen. Name the file “EEGrelaxed”.
7. Now save approximately 30 seconds of data to a file with the subject sitting relaxed and
looking at the screen. However, the subject should make a few rapid blinks
approximately every few seconds during the data recording. Name this file “EEGblinks”.
8. Now save approximately 30 seconds of data to a file with the subject sitting relaxed and
looking at the screen. However, the subject should shake their head a few times during
the data recording. Name this file “EEGmotion”.
9. Now click on the tab labeled “Sample EEG”. From the drop down menu select each type
of EEG signal from the sample database and examine its temporal characteristics as it
scrolls on the screen. Each signal is approximately one minute long and will repeat when
it finishes. You should save each of these signals to a data files with the corresponding
name for later analysis.
10. Next click on the tab labeled “Time-Frequency Analysis”. This section will allow you to
complete a joint time frequency analysis on the data file. Select a file from the drop
down box and click on the “Go” button. This will produce a JTFA in the window.
11. Try using each of the sample data files and different JTFA methods and examine the
effects on the results.
© 2005 Cleveland Medical Devices Inc., Cleveland, OH.
Property of Cleveland Medical Devices. Copying and distribution prohibited.
CleveLabs Biomedical Engineering Laboratory Course Version 3.0
7
Biomedical Engineering Laboratory Course - Student Edition
Electroencephalography II Laboratory
Data Analysis
1.
Using the post-processing toolbox, MATLAB, or LabVIEW, open the saved data files
EEGrelaxed and grandmal. Examine the temporal and spectral features of the signal and
describe how you would generate an automated program for detecting seizure activity.
2.
Using the post-processing toolbox, MATLAB, or LabVIEW, open the save data files
EEGrelaxed, EEGblinks, EEGmotion, and Grandmal. Analyze the signal in both the
time and frequency domains. Note how the intentionally generated artifacts in the
subject generated data files compare to the seizure activity in the sample data files.
Discussion Questions
1. Why is it important to use EEG recordings to confirm non-convulsive seizures?
2. Is it difficult to distinguish seizure activity from certain types of noise that can exist in an
EEG recording? If so, why?
3. Describe any quantitative features you found in the time domain that may be useful for
quantifying specific cardiac rhythms.
4. Describe any quantitative features you found in the frequency domain that may be useful
for quantifying specific cardiac rhythms.
5. Knowing that seizures generally involve slower brain rhythms, and that spiking behavior
usually precedes seizure onset, suggest what factors an automated program should look
for when doing automatic EEG analysis. How would noise be dealt with in this
automated program?
6. What are the benefits of using a JFTA method to analyze data compared to only using a
spectral or temporal analysis technique?
7. Discuss the tradeoffs between using each type of JFTA method to analyze a biomedical
signal. Are there particular reasons to use a specific type of method?
8. What effect does the window size have on a JTFA plot using the STFT method? What
impact does it have on the resolution of the plot?
© 2005 Cleveland Medical Devices Inc., Cleveland, OH.
Property of Cleveland Medical Devices. Copying and distribution prohibited.
CleveLabs Biomedical Engineering Laboratory Course Version 3.0
8
Biomedical Engineering Laboratory Course - Student Edition
Electroencephalography II Laboratory
References
1. Guyton and Hall. Textbook of Medical Physiology, 9th Edition, Saunders, Philadelphia,
1996.
2. Kandel ER, Schwartz JH, Jessel, TM. Essentials of Neuroscience and Behavior.1995.
3. Kooi, Kenneth A. Fundamentals of Electroencephalography, Harper & Row, Hagerstown,
MD. 2nd Ed. 1978.
4. National Instruments Corporation. Signal Processing Toolset User’s Manual. December
2002 Edition.
5. Goldberger AL, Amaral LAN, Glass L, Hausdorff JM, Ivanov PCh, Mark RG, Mietus JE,
Moody GB, Peng CK, Stanley HE. PhysioBank, PhysioToolkit, and PhysioNet: Components
of a New Research Resource for Complex Physiologic Signals. Circulation 101(23):e215e220
[Circulation
Electronic
Pages;
http://circ.ahajournals.org/cgi/content/full/101/23/e215]; 2000 (June 13).
© 2005 Cleveland Medical Devices Inc., Cleveland, OH.
Property of Cleveland Medical Devices. Copying and distribution prohibited.
CleveLabs Biomedical Engineering Laboratory Course Version 3.0
9