1
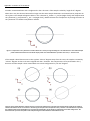
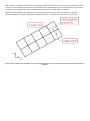
Figure 1: geometry for tilting the sample
The grey scale adjusters alter the colour limits to specified minimum and maximum values. Values less than cmin map
to cmin and values greater than cmax map to cmax. Those values between cmin and cmax are mapped linearly in grey
scale.
7. The “Lorentz TEM image” button on the right hand side simulates a Lorentz TEM image. White contrast means more
intensity reaching the screen, black contrast, less intensity. The “Electric Component LTEM image” buttons enables
the computation of an LTEM image with only electric and no magnetic contrast. Equally, if a magnetic component
LTEM image is required, just set the mean inner potential to zero. The “Profile” button shows the outline of the
structure considered. If this looks wrong but there are no yellow warning boxes, this could mean that the number of
meshes in the x and y directions are the wrong way around.