1
NightTrace Manual
0890398-080
June 2002
Copyright 2002 by Concurrent Computer Corporation. All rights reserved. This publication or any part thereof is
intended for use with Concurrent products by Concurrent personnel, customers, and end–users. It may not be
reproduced in any form without the written permission of the publisher.
The information contained in this document is believed to be correct at the time of publication. It is subject to change
without notice. Concurrent makes no warranties, expressed or implied, concerning the information contained in this
document.
To report an error or comment on a specific portion of the manual, photocopy the page in question and mark the
correction or comment on the copy. Mail the copy (and any additional comments) to Concurrent Computer Corporation, 2881 Gateway Drive, Pompano Beach, FL 33069-4324. Mark the envelope “Attention: Publications Department.” This publication may not be reproduced for any other reason in any form without written permission of the
publisher.
The license management portion of this product is based on:
Élan License Manager
Copyright 1989-1994 Elan Computer Group, Inc.
All rights reserved.
NightTrace, KernelTrace, NightView, NightStar, Power Hawk, RedHawk, and MAXAda are trademarks of Concurrent Computer Corporation.
Élan License Manager is a trademark of Élan Computer Group, Inc.
PowerPC is a trademark of International Business Machines, Corp.
Motif, OSF, and OSF/Motif, X Window System and X are trademarks of The Open Group
Printed in U. S. A.
Revision History:
Level:
Effective With:
Original Release -- August 1992
000
NightTrace 1.0
Current Release -- June 2002
080
NightTrace 5.1
Preface
Scope of Manual
This manual is a reference document and users guide for NightTraceTM, a graphical, interactive debugging and performance analysis tool, and KernelTraceTM, a tool that collects
and textually analyzes system performance.
Structure of Manual
A brief description of the chapters and appendixes in this manual follows:
• Chapter 1 contains introductory material on NightTrace.
• Chapter 2 gives the syntax and examples of NightTrace library calls.
• Chapter 3 introduces the NightTrace Session Manager and its usage.
• Chapter 4 describes the ntraceudcommand line user daemon.
• Chapter 5 describes how to invoke the ntrace display utility.
• Chapter 6 shows how to view trace event logs with ntrace.
• Chapter 7 illustrates ntrace display objects and their creation.
• Chapter 8 shows how to configure ntrace display objects.
• Chapter 9 defines NightTrace expressions.
• Chapter 10 tells about NightTrace’s built-in tools.
• Chapter 11 describes kernel tracing.
This manual also contains three appendixes, a glossary, and an index.
• Appendix A describes performance tuning.
• Appendix B describes graphical user interface (GUI) customization.
• Appendix C provides answers to common questions.
The glossary contains an alphabetical list of NightTrace, X TM , and MotifTM words and
phrases used in this manual and their definitions. The index contains an alphabetical list of
topics, names, etc. found in the manual.
Man page descriptions of programs, system calls, subroutines, and file formats appear in
the system manual pages.
3
NightTrace Manual
Syntax Notation
The following notation is used throughout this guide:
italic
Books, reference cards, and items that the user must specify
appear in italic type. Special terms and comments in code may
also appear in italic.
list bold
User input appears in list bold type and must be entered
exactly as shown. Names of directories, files, commands, options
and man page references also appear in list bold type.
list
Operating system and program output such as prompts and messages and listings of files and programs appears in list type.
Keywords also appear in list type.
emphasis
Words or phrases that require extra emphasis use emphasis type.
window
Keyboard sequences and window features such as button, field,
and menu labels and window titles appear in window type.
[]
Brackets enclose command options and arguments that are
optional. You do not type the brackets if you choose to specify
such option or arguments.
{}
Braces enclose mutually exclusive choices separated by the pipe
(|) character, where one choice must be selected. You do not type
the braces or the pipe character with the choice.
...
An ellipsis follows an item that can be repeated.
Ì
An arrow separates a menu bar item from a pull-down menu entry.
The window images in this manual come from a Motif environment. If you are using
another environment, your windows may differ slightly from those presented here.
Referenced Publications
The following publications are referenced in this document:
0830048
HN6200 Architecture Reference Manual
0830046
HN6800 Architecture Manual
0890240
hf77 Fortran Reference Manual
0890300
X Window® System User’s Guide
0890378
C: A Reference Manual
0890380
OSF/MotifTM Documentation Set (3 volumes)
0890395
NightViewTM1 User’s Guide
0890423
PowerMAX OSTM2 Programming Guide
0890429
System Administration Volume 1
1. NightView is a trademark of Concurrent Computer Corporation
2. PowerMAX OS is a trademark of Concurrent Computer Corporation
4
Preface
0890430
System Administration Volume 2
0890460
Compilation Systems Volume 2 (Concepts)
0890466
PowerMAX OSTM Real-Time Guide
0890474
NightTraceTM Pocket Reference
0890516
MAXAdaTM Reference Manual
0891019
Concurrent C Reference Manual
0891055
ÉlanTM3 License Manager Release Notes
0891082
Real-Time Clock and Interrupt Module User’s Guide
PowerPCTM4 604 RISC Microprocessor User’s Manual (not available from Concurrent Computer Corporation)
3. Élan License Manager is a trademark of Elan Computer Group, Inc.
4. PowerPC is a trademark of International Business Machines, Corp.
5
NightTrace Manual
6
Contents
Chapter 1 Introduction
Overview . . . . . . . . . . . . . . . . . . . . . . . . . . . . . . . . . . . . . . . . . . . . . . . . . . . . . . . . . .
What is NightTrace? . . . . . . . . . . . . . . . . . . . . . . . . . . . . . . . . . . . . . . . . . . . . . . . . .
User and Kernel Tracing. . . . . . . . . . . . . . . . . . . . . . . . . . . . . . . . . . . . . . . . . . .
Timestamp Source Selection . . . . . . . . . . . . . . . . . . . . . . . . . . . . . . . . . . . . . . .
Trace-Point Placement . . . . . . . . . . . . . . . . . . . . . . . . . . . . . . . . . . . . . . . . . . . .
Languages Supported . . . . . . . . . . . . . . . . . . . . . . . . . . . . . . . . . . . . . . . . . . . . .
Processes and CPUs . . . . . . . . . . . . . . . . . . . . . . . . . . . . . . . . . . . . . . . . . . . . . .
Information Displayed . . . . . . . . . . . . . . . . . . . . . . . . . . . . . . . . . . . . . . . . . . . .
Searches and Summaries . . . . . . . . . . . . . . . . . . . . . . . . . . . . . . . . . . . . . . . . . .
Logging and Analysis . . . . . . . . . . . . . . . . . . . . . . . . . . . . . . . . . . . . . . . . . . . . . . . .
The User Trace Event Logging Procedure . . . . . . . . . . . . . . . . . . . . . . . . . . . .
The Kernel Trace Event Logging Procedure . . . . . . . . . . . . . . . . . . . . . . . . . . .
The Trace Event Analysis Procedure . . . . . . . . . . . . . . . . . . . . . . . . . . . . . . . . .
Recommended Reading . . . . . . . . . . . . . . . . . . . . . . . . . . . . . . . . . . . . . . . . . . . . . . .
1-1
1-1
1-2
1-2
1-2
1-3
1-3
1-3
1-3
1-3
1-4
1-5
1-6
1-7
Chapter 2 Adding Library Calls to Your Application
Overview . . . . . . . . . . . . . . . . . . . . . . . . . . . . . . . . . . . . . . . . . . . . . . . . . . . . . . . . . .
Language-Specific Source Considerationfcs. . . . . . . . . . . . . . . . . . . . . . . . . . . . . . .
C.............................................................
Fortran . . . . . . . . . . . . . . . . . . . . . . . . . . . . . . . . . . . . . . . . . . . . . . . . . . . . . . . .
Ada . . . . . . . . . . . . . . . . . . . . . . . . . . . . . . . . . . . . . . . . . . . . . . . . . . . . . . . . . . .
Inter-Process Communication and Library Routines . . . . . . . . . . . . . . . . . . . . . . . .
Understanding NightTrace Library Calls . . . . . . . . . . . . . . . . . . . . . . . . . . . . . . . . .
trace_begin(). . . . . . . . . . . . . . . . . . . . . . . . . . . . . . . . . . . . . . . . . . . . . . . . . . . .
trace_open_thread() . . . . . . . . . . . . . . . . . . . . . . . . . . . . . . . . . . . . . . . . . . . . . .
trace_event() and Its Variants . . . . . . . . . . . . . . . . . . . . . . . . . . . . . . . . . . . . . . .
trace_enable(), trace_disable(), and Their Variants . . . . . . . . . . . . . . . . . . . . . .
trace_flush() and trace_trigger(). . . . . . . . . . . . . . . . . . . . . . . . . . . . . . . . . . . . .
trace_close_thread() . . . . . . . . . . . . . . . . . . . . . . . . . . . . . . . . . . . . . . . . . . . . . .
trace_end() . . . . . . . . . . . . . . . . . . . . . . . . . . . . . . . . . . . . . . . . . . . . . . . . . . . . .
Disabling Tracing . . . . . . . . . . . . . . . . . . . . . . . . . . . . . . . . . . . . . . . . . . . . . . . . . . .
Compiling and Linking . . . . . . . . . . . . . . . . . . . . . . . . . . . . . . . . . . . . . . . . . . . . . . .
C Example . . . . . . . . . . . . . . . . . . . . . . . . . . . . . . . . . . . . . . . . . . . . . . . . . . . . .
Fortran Example . . . . . . . . . . . . . . . . . . . . . . . . . . . . . . . . . . . . . . . . . . . . . . . . .
Ada Example . . . . . . . . . . . . . . . . . . . . . . . . . . . . . . . . . . . . . . . . . . . . . . . . . . .
Exercise: Instrumenting Code . . . . . . . . . . . . . . . . . . . . . . . . . . . . . . . . . . . . . . . . .
2-1
2-1
2-1
2-2
2-2
2-3
2-3
2-5
2-9
2-10
2-16
2-20
2-22
2-23
2-24
2-24
2-25
2-25
2-25
2-25
Chapter 3 NightTrace Session Manager
Using the NightTrace Session Manager . . . . . . . . . . . . . . . . . . . . . . . . . . . . . . . . . .
NightTrace Session Manager Menu Bar . . . . . . . . . . . . . . . . . . . . . . . . . . . . . .
NightTrace. . . . . . . . . . . . . . . . . . . . . . . . . . . . . . . . . . . . . . . . . . . . . . . . . .
Open Session . . . . . . . . . . . . . . . . . . . . . . . . . . . . . . . . . . . . . . . . . . . .
3-1
3-2
3-2
3-4
7
NightTrace Manual
Save Session . . . . . . . . . . . . . . . . . . . . . . . . . . . . . . . . . . . . . . . . . . . . .
Unsaved Changes . . . . . . . . . . . . . . . . . . . . . . . . . . . . . . . . . . . . . . . . .
Daemons . . . . . . . . . . . . . . . . . . . . . . . . . . . . . . . . . . . . . . . . . . . . . . . . . . .
Login . . . . . . . . . . . . . . . . . . . . . . . . . . . . . . . . . . . . . . . . . . . . . . . . . .
Enter Password . . . . . . . . . . . . . . . . . . . . . . . . . . . . . . . . . . . . . . . . . . .
Attach Daemons . . . . . . . . . . . . . . . . . . . . . . . . . . . . . . . . . . . . . . . . . .
Options. . . . . . . . . . . . . . . . . . . . . . . . . . . . . . . . . . . . . . . . . . . . . . . . . . . . .
Refresh Interval . . . . . . . . . . . . . . . . . . . . . . . . . . . . . . . . . . . . . . . . . .
Tools . . . . . . . . . . . . . . . . . . . . . . . . . . . . . . . . . . . . . . . . . . . . . . . . . . . . . .
Help . . . . . . . . . . . . . . . . . . . . . . . . . . . . . . . . . . . . . . . . . . . . . . . . . . . . . . .
Session Configuration File Name Area . . . . . . . . . . . . . . . . . . . . . . . . . . . . . . .
Daemon Details Area . . . . . . . . . . . . . . . . . . . . . . . . . . . . . . . . . . . . . . . . . . . . .
Daemon Control Area . . . . . . . . . . . . . . . . . . . . . . . . . . . . . . . . . . . . . . . . . . . . .
Enable / Disable Trace Events . . . . . . . . . . . . . . . . . . . . . . . . . . . . . . . . . . .
Daemon Definition Dialog. . . . . . . . . . . . . . . . . . . . . . . . . . . . . . . . . . . . . . . . . . . . .
Import Daemon Definition . . . . . . . . . . . . . . . . . . . . . . . . . . . . . . . . . . . . . . . . .
General . . . . . . . . . . . . . . . . . . . . . . . . . . . . . . . . . . . . . . . . . . . . . . . . . . . . . . . .
Target . . . . . . . . . . . . . . . . . . . . . . . . . . . . . . . . . . . . . . . . . . . . . . . . . . . . . .
Trace Events Output . . . . . . . . . . . . . . . . . . . . . . . . . . . . . . . . . . . . . . . . . .
User Trace . . . . . . . . . . . . . . . . . . . . . . . . . . . . . . . . . . . . . . . . . . . . . . . . . . . . . .
Locking Policies . . . . . . . . . . . . . . . . . . . . . . . . . . . . . . . . . . . . . . . . . . . . .
Shared Memory . . . . . . . . . . . . . . . . . . . . . . . . . . . . . . . . . . . . . . . . . . . . . .
Timestamp Heartbeat . . . . . . . . . . . . . . . . . . . . . . . . . . . . . . . . . . . . . . . . . .
User Event Buffer . . . . . . . . . . . . . . . . . . . . . . . . . . . . . . . . . . . . . . . . . . . .
Events . . . . . . . . . . . . . . . . . . . . . . . . . . . . . . . . . . . . . . . . . . . . . . . . . . . . . . . . .
Load Event Names. . . . . . . . . . . . . . . . . . . . . . . . . . . . . . . . . . . . . . . . . . . .
Runtime. . . . . . . . . . . . . . . . . . . . . . . . . . . . . . . . . . . . . . . . . . . . . . . . . . . . . . . .
Scheduling . . . . . . . . . . . . . . . . . . . . . . . . . . . . . . . . . . . . . . . . . . . . . . . . . .
CPU Bias . . . . . . . . . . . . . . . . . . . . . . . . . . . . . . . . . . . . . . . . . . . . . . . . . . .
NUMA . . . . . . . . . . . . . . . . . . . . . . . . . . . . . . . . . . . . . . . . . . . . . . . . . . . . .
Policies . . . . . . . . . . . . . . . . . . . . . . . . . . . . . . . . . . . . . . . . . . . . . . . . .
Streaming . . . . . . . . . . . . . . . . . . . . . . . . . . . . . . . . . . . . . . . . . . . . . . . . . . . . . .
Streaming Options . . . . . . . . . . . . . . . . . . . . . . . . . . . . . . . . . . . . . . . . . . . .
3-6
3-8
3-9
3-10
3-11
3-12
3-14
3-14
3-14
3-16
3-17
3-17
3-20
3-22
3-25
3-27
3-28
3-29
3-31
3-33
3-34
3-36
3-36
3-37
3-37
3-39
3-41
3-42
3-43
3-43
3-44
3-45
3-45
Chapter 4 Generating Trace Event Logs with ntraceud
Overview . . . . . . . . . . . . . . . . . . . . . . . . . . . . . . . . . . . . . . . . . . . . . . . . . . . . . . . . . .
The ntraceud Daemon . . . . . . . . . . . . . . . . . . . . . . . . . . . . . . . . . . . . . . . . . . . . . . . .
The Default User Daemon Configuration . . . . . . . . . . . . . . . . . . . . . . . . . . . . . . . . .
ntraceud Modes . . . . . . . . . . . . . . . . . . . . . . . . . . . . . . . . . . . . . . . . . . . . . . . . . . . . .
ntraceud Options . . . . . . . . . . . . . . . . . . . . . . . . . . . . . . . . . . . . . . . . . . . . . . . . . . . .
Option to Get Help (-help) . . . . . . . . . . . . . . . . . . . . . . . . . . . . . . . . . . . . . . . . .
Option to Get Version Information (-version) . . . . . . . . . . . . . . . . . . . . . . . . . .
Option to Disable the IPL Register (-ipldisable) . . . . . . . . . . . . . . . . . . . . . . . .
Option to Prevent Page Locking (-lockdisable) . . . . . . . . . . . . . . . . . . . . . . . . .
Option to Establish File-Wraparound Mode (-filewrap). . . . . . . . . . . . . . . . . . .
Option to Establish Buffer-Wraparound Mode (-bufferwrap) . . . . . . . . . . . . . .
Option to Define Shared Memory Buffer Size (-memsize) . . . . . . . . . . . . . . . .
Option to Set Timeout Interval (-timeout) . . . . . . . . . . . . . . . . . . . . . . . . . . . . .
Option to Set the Buffer-Full Cutoff Percentage (-cutoff) . . . . . . . . . . . . . . . . .
Option to Select Timestamp Source (-clock) . . . . . . . . . . . . . . . . . . . . . . . . . . .
Option to Reset the ntraceud Daemon (-reset) . . . . . . . . . . . . . . . . . . . . . . . . . .
Option to Quit Running ntraceud (-quit) . . . . . . . . . . . . . . . . . . . . . . . . . . . . . .
8
4-1
4-1
4-2
4-4
4-5
4-7
4-8
4-9
4-11
4-12
4-13
4-16
4-17
4-18
4-19
4-20
4-21
Contents
Option to Present Statistical Information (-stats) . . . . . . . . . . . . . . . . . . . . . . . .
Option to Disable Logging (-disable). . . . . . . . . . . . . . . . . . . . . . . . . . . . . . . . .
Option to Enable Logging (-enable). . . . . . . . . . . . . . . . . . . . . . . . . . . . . . . . . .
Invoking ntraceud . . . . . . . . . . . . . . . . . . . . . . . . . . . . . . . . . . . . . . . . . . . . . . . . . . .
Exercise: Logging Trace Events . . . . . . . . . . . . . . . . . . . . . . . . . . . . . . . . . . . . . . . .
4-22
4-24
4-26
4-28
4-29
Chapter 5 Invoking the ntrace Display Utility
Overviewc . . . . . . . . . . . . . . . . . . . . . . . . . . . . . . . . . . . . . . . . . . . . . . . . . . . . . . . . .
X and NightTrace Vocabulary . . . . . . . . . . . . . . . . . . . . . . . . . . . . . . . . . . . . . . . . . .
System Environment . . . . . . . . . . . . . . . . . . . . . . . . . . . . . . . . . . . . . . . . . . . . . . . . .
Invoking ntrace . . . . . . . . . . . . . . . . . . . . . . . . . . . . . . . . . . . . . . . . . . . . . . . . . . . . .
ntrace Options . . . . . . . . . . . . . . . . . . . . . . . . . . . . . . . . . . . . . . . . . . . . . . . . . . . . . .
ntrace Arguments. . . . . . . . . . . . . . . . . . . . . . . . . . . . . . . . . . . . . . . . . . . . . . . . . . . .
Understanding Trace Event Files . . . . . . . . . . . . . . . . . . . . . . . . . . . . . . . . . . . .
Understanding Event-Map Files. . . . . . . . . . . . . . . . . . . . . . . . . . . . . . . . . . . . .
Understanding Page Configuration Files . . . . . . . . . . . . . . . . . . . . . . . . . . . . . .
ntrace Tables . . . . . . . . . . . . . . . . . . . . . . . . . . . . . . . . . . . . . . . . . . . . . . . .
String Tables. . . . . . . . . . . . . . . . . . . . . . . . . . . . . . . . . . . . . . . . . . . . .
Pre-Defined String Tables . . . . . . . . . . . . . . . . . . . . . . . . . . . . . . . . . .
Format Tables. . . . . . . . . . . . . . . . . . . . . . . . . . . . . . . . . . . . . . . . . . . .
Pre-Defined Format Tables . . . . . . . . . . . . . . . . . . . . . . . . . . . . . . . . .
Configuring Display Pages . . . . . . . . . . . . . . . . . . . . . . . . . . . . . . . . . . . . .
ntrace User Interface . . . . . . . . . . . . . . . . . . . . . . . . . . . . . . . . . . . . . . . . . . . . . . . . .
Using the Mouse. . . . . . . . . . . . . . . . . . . . . . . . . . . . . . . . . . . . . . . . . . . . . . . . .
Understanding Pointer Shapes . . . . . . . . . . . . . . . . . . . . . . . . . . . . . . . . . . . . . .
Anticipating Window Layout . . . . . . . . . . . . . . . . . . . . . . . . . . . . . . . . . . . . . . .
Resizing Windows . . . . . . . . . . . . . . . . . . . . . . . . . . . . . . . . . . . . . . . . . . . . . . .
ntrace Notation Conventions . . . . . . . . . . . . . . . . . . . . . . . . . . . . . . . . . . . . . . . . . . .
ntrace Global Window . . . . . . . . . . . . . . . . . . . . . . . . . . . . . . . . . . . . . . . . . . . . . . . .
Message Display Area . . . . . . . . . . . . . . . . . . . . . . . . . . . . . . . . . . . . . . . . . . . .
Menu Bar . . . . . . . . . . . . . . . . . . . . . . . . . . . . . . . . . . . . . . . . . . . . . . . . . . . . . .
NightTrace Menu Item . . . . . . . . . . . . . . . . . . . . . . . . . . . . . . . . . . . . . . . .
New Page . . . . . . . . . . . . . . . . . . . . . . . . . . . . . . . . . . . . . . . . . . . . . . .
Default Page. . . . . . . . . . . . . . . . . . . . . . . . . . . . . . . . . . . . . . . . . . . . .
Open Config File . . . . . . . . . . . . . . . . . . . . . . . . . . . . . . . . . . . . . . . . .
Read Event-Map File . . . . . . . . . . . . . . . . . . . . . . . . . . . . . . . . . . . . . .
Exit . . . . . . . . . . . . . . . . . . . . . . . . . . . . . . . . . . . . . . . . . . . . . . . . . . . .
Tools Menu Item . . . . . . . . . . . . . . . . . . . . . . . . . . . . . . . . . . . . . . . . . . . . .
Help Menu Item . . . . . . . . . . . . . . . . . . . . . . . . . . . . . . . . . . . . . . . . . . . . .
The File Selection Dialog Box . . . . . . . . . . . . . . . . . . . . . . . . . . . . . . . . . . . . . . . . .
Typing in the Exact File Name . . . . . . . . . . . . . . . . . . . . . . . . . . . . . . . . . . . . . .
Scrolling Through Existing File Names . . . . . . . . . . . . . . . . . . . . . . . . . . . . . . .
Typing in a Filter (File Name Pattern) . . . . . . . . . . . . . . . . . . . . . . . . . . . . . . . .
Exercise: Displaying Trace Events . . . . . . . . . . . . . . . . . . . . . . . . . . . . . . . . . . . . . .
5-1
5-1
5-2
5-3
5-3
5-8
5-9
5-9
5-11
5-12
5-13
5-14
5-17
5-20
5-20
5-21
5-21
5-22
5-22
5-24
5-24
5-25
5-25
5-26
5-26
5-27
5-28
5-30
5-31
5-32
5-32
5-33
5-33
5-33
5-34
5-35
5-35
Chapter 6 Viewing Trace Event Logs with ntrace
Overview . . . . . . . . . . . . . . . . . . . . . . . . . . . . . . . . . . . . . . . . . . . . . . . . . . . . . . . . . .
Mouse Button Operations . . . . . . . . . . . . . . . . . . . . . . . . . . . . . . . . . . . . . . . . . . . . .
The Grid. . . . . . . . . . . . . . . . . . . . . . . . . . . . . . . . . . . . . . . . . . . . . . . . . . . . . . . . . . .
Viewing Strategy . . . . . . . . . . . . . . . . . . . . . . . . . . . . . . . . . . . . . . . . . . . . . . . . . . . .
The Interval Scroll Bar . . . . . . . . . . . . . . . . . . . . . . . . . . . . . . . . . . . . . . . . . . . . . . .
6-1
6-3
6-4
6-5
6-7
9
NightTrace Manual
The Interval Push Buttons . . . . . . . . . . . . . . . . . . . . . . . . . . . . . . . . . . . . . . . . . . . . .
The Interval Control Area . . . . . . . . . . . . . . . . . . . . . . . . . . . . . . . . . . . . . . . . . . . . .
Reading Fields . . . . . . . . . . . . . . . . . . . . . . . . . . . . . . . . . . . . . . . . . . . . . . . . . .
Editing Single Fields. . . . . . . . . . . . . . . . . . . . . . . . . . . . . . . . . . . . . . . . . . . . . .
Editing Multiple Fields . . . . . . . . . . . . . . . . . . . . . . . . . . . . . . . . . . . . . . . . . . . .
Field Editing. . . . . . . . . . . . . . . . . . . . . . . . . . . . . . . . . . . . . . . . . . . . . . . . . . . . . . . .
Editing Text Fields . . . . . . . . . . . . . . . . . . . . . . . . . . . . . . . . . . . . . . . . . . . . . . .
Positioning Within Text Fields . . . . . . . . . . . . . . . . . . . . . . . . . . . . . . . . . . . . . .
6-8
6-11
6-11
6-12
6-14
6-16
6-16
6-18
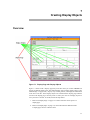
Chapter 7 Creating Display Objects
Overview . . . . . . . . . . . . . . . . . . . . . . . . . . . . . . . . . . . . . . . . . . . . . . . . . . . . . . . . . .
The Display Page . . . . . . . . . . . . . . . . . . . . . . . . . . . . . . . . . . . . . . . . . . . . . . . . . . . .
Display Page Modes. . . . . . . . . . . . . . . . . . . . . . . . . . . . . . . . . . . . . . . . . . . . . . . . . .
Edit Mode . . . . . . . . . . . . . . . . . . . . . . . . . . . . . . . . . . . . . . . . . . . . . . . . . . . . . .
View Mode . . . . . . . . . . . . . . . . . . . . . . . . . . . . . . . . . . . . . . . . . . . . . . . . . . . . .
Operations on Display Objects . . . . . . . . . . . . . . . . . . . . . . . . . . . . . . . . . . . . . . . . .
Creating Display Objects . . . . . . . . . . . . . . . . . . . . . . . . . . . . . . . . . . . . . . . . . .
Selecting Display Objects . . . . . . . . . . . . . . . . . . . . . . . . . . . . . . . . . . . . . . . . . .
Moving Display Objects . . . . . . . . . . . . . . . . . . . . . . . . . . . . . . . . . . . . . . . . . . .
Resizing Display Objects . . . . . . . . . . . . . . . . . . . . . . . . . . . . . . . . . . . . . . . . . .
Display Objects . . . . . . . . . . . . . . . . . . . . . . . . . . . . . . . . . . . . . . . . . . . . . . . . . . . . .
GridLabel . . . . . . . . . . . . . . . . . . . . . . . . . . . . . . . . . . . . . . . . . . . . . . . . . . . . . .
DataBox . . . . . . . . . . . . . . . . . . . . . . . . . . . . . . . . . . . . . . . . . . . . . . . . . . . . . . .
Column . . . . . . . . . . . . . . . . . . . . . . . . . . . . . . . . . . . . . . . . . . . . . . . . . . . . . . . .
StateGraph. . . . . . . . . . . . . . . . . . . . . . . . . . . . . . . . . . . . . . . . . . . . . . . . . . . . . .
EventGraph . . . . . . . . . . . . . . . . . . . . . . . . . . . . . . . . . . . . . . . . . . . . . . . . . . . . .
DataGraph . . . . . . . . . . . . . . . . . . . . . . . . . . . . . . . . . . . . . . . . . . . . . . . . . . . . . .
Ruler . . . . . . . . . . . . . . . . . . . . . . . . . . . . . . . . . . . . . . . . . . . . . . . . . . . . . . . . . .
Editing Operations . . . . . . . . . . . . . . . . . . . . . . . . . . . . . . . . . . . . . . . . . . . . . . . . . . .
Select All. . . . . . . . . . . . . . . . . . . . . . . . . . . . . . . . . . . . . . . . . . . . . . . . . . . . . . .
Deselect All. . . . . . . . . . . . . . . . . . . . . . . . . . . . . . . . . . . . . . . . . . . . . . . . . . . . .
Delete . . . . . . . . . . . . . . . . . . . . . . . . . . . . . . . . . . . . . . . . . . . . . . . . . . . . . . . . .
File Operations. . . . . . . . . . . . . . . . . . . . . . . . . . . . . . . . . . . . . . . . . . . . . . . . . . . . . .
Save. . . . . . . . . . . . . . . . . . . . . . . . . . . . . . . . . . . . . . . . . . . . . . . . . . . . . . . . . . .
Save As ... . . . . . . . . . . . . . . . . . . . . . . . . . . . . . . . . . . . . . . . . . . . . . . . . . . . . . .
Close . . . . . . . . . . . . . . . . . . . . . . . . . . . . . . . . . . . . . . . . . . . . . . . . . . . . . . . . . .
7-1
7-2
7-3
7-4
7-4
7-4
7-5
7-6
7-7
7-7
7-8
7-12
7-12
7-13
7-14
7-15
7-16
7-17
7-17
7-18
7-18
7-18
7-18
7-18
7-19
7-19
Chapter 8 Configuring Display Objects
Overview . . . . . . . . . . . . . . . . . . . . . . . . . . . . . . . . . . . . . . . . . . . . . . . . . . . . . . . . . .
Common Configuration Parameters. . . . . . . . . . . . . . . . . . . . . . . . . . . . . . . . . . . . . .
Display Object Name . . . . . . . . . . . . . . . . . . . . . . . . . . . . . . . . . . . . . . . . . . . . .
Event List . . . . . . . . . . . . . . . . . . . . . . . . . . . . . . . . . . . . . . . . . . . . . . . . . . . . . .
If-Expression. . . . . . . . . . . . . . . . . . . . . . . . . . . . . . . . . . . . . . . . . . . . . . . . . . . .
Then-Expression . . . . . . . . . . . . . . . . . . . . . . . . . . . . . . . . . . . . . . . . . . . . . . . . .
CPU List . . . . . . . . . . . . . . . . . . . . . . . . . . . . . . . . . . . . . . . . . . . . . . . . . . . . . . .
PID List. . . . . . . . . . . . . . . . . . . . . . . . . . . . . . . . . . . . . . . . . . . . . . . . . . . . . . . .
TID List. . . . . . . . . . . . . . . . . . . . . . . . . . . . . . . . . . . . . . . . . . . . . . . . . . . . . . . .
Node List. . . . . . . . . . . . . . . . . . . . . . . . . . . . . . . . . . . . . . . . . . . . . . . . . . . . . . .
Foreground Color . . . . . . . . . . . . . . . . . . . . . . . . . . . . . . . . . . . . . . . . . . . . . . . .
Background Color. . . . . . . . . . . . . . . . . . . . . . . . . . . . . . . . . . . . . . . . . . . . . . . .
Font . . . . . . . . . . . . . . . . . . . . . . . . . . . . . . . . . . . . . . . . . . . . . . . . . . . . . . . . . . .
10
8-1
8-1
8-4
8-4
8-4
8-5
8-6
8-7
8-8
8-9
8-9
8-9
8-9
Contents
Text Justify . . . . . . . . . . . . . . . . . . . . . . . . . . . . . . . . . . . . . . . . . . . . . . . . . . . . .
Text Gravity . . . . . . . . . . . . . . . . . . . . . . . . . . . . . . . . . . . . . . . . . . . . . . . . . . . .
Configuration Form Push Buttons . . . . . . . . . . . . . . . . . . . . . . . . . . . . . . . . . . . . . . .
Specific Configuration Parameters . . . . . . . . . . . . . . . . . . . . . . . . . . . . . . . . . . . . . .
GridLabel . . . . . . . . . . . . . . . . . . . . . . . . . . . . . . . . . . . . . . . . . . . . . . . . . . . . . .
DataBox . . . . . . . . . . . . . . . . . . . . . . . . . . . . . . . . . . . . . . . . . . . . . . . . . . . . . . .
StateGraph . . . . . . . . . . . . . . . . . . . . . . . . . . . . . . . . . . . . . . . . . . . . . . . . . . . . .
EventGraph. . . . . . . . . . . . . . . . . . . . . . . . . . . . . . . . . . . . . . . . . . . . . . . . . . . . .
DataGraph. . . . . . . . . . . . . . . . . . . . . . . . . . . . . . . . . . . . . . . . . . . . . . . . . . . . . .
Ruler . . . . . . . . . . . . . . . . . . . . . . . . . . . . . . . . . . . . . . . . . . . . . . . . . . . . . . . . . .
8-9
8-10
8-10
8-11
8-12
8-13
8-14
8-16
8-17
8-19
Chapter 9 Using Expressions
Overview . . . . . . . . . . . . . . . . . . . . . . . . . . . . . . . . . . . . . . . . . . . . . . . . . . . . . . . . . .
Expressions Menu . . . . . . . . . . . . . . . . . . . . . . . . . . . . . . . . . . . . . . . . . . . . . . . . . . .
Expression Dialog Boxes . . . . . . . . . . . . . . . . . . . . . . . . . . . . . . . . . . . . . . . . . .
Expression Configuration Forms . . . . . . . . . . . . . . . . . . . . . . . . . . . . . . . . . . . .
Expressions . . . . . . . . . . . . . . . . . . . . . . . . . . . . . . . . . . . . . . . . . . . . . . . . . . . . . . . .
Operators . . . . . . . . . . . . . . . . . . . . . . . . . . . . . . . . . . . . . . . . . . . . . . . . . . . . . .
Operands. . . . . . . . . . . . . . . . . . . . . . . . . . . . . . . . . . . . . . . . . . . . . . . . . . . . . . .
Constants . . . . . . . . . . . . . . . . . . . . . . . . . . . . . . . . . . . . . . . . . . . . . . . . . . . . . .
Macros . . . . . . . . . . . . . . . . . . . . . . . . . . . . . . . . . . . . . . . . . . . . . . . . . . . . . . . .
Functions . . . . . . . . . . . . . . . . . . . . . . . . . . . . . . . . . . . . . . . . . . . . . . . . . . . . . .
Function Parameters . . . . . . . . . . . . . . . . . . . . . . . . . . . . . . . . . . . . . . . . . .
Function Terminology . . . . . . . . . . . . . . . . . . . . . . . . . . . . . . . . . . . . . . . . .
Trace Event Functions. . . . . . . . . . . . . . . . . . . . . . . . . . . . . . . . . . . . . . . . .
id() . . . . . . . . . . . . . . . . . . . . . . . . . . . . . . . . . . . . . . . . . . . . . . . . . . . .
arg() . . . . . . . . . . . . . . . . . . . . . . . . . . . . . . . . . . . . . . . . . . . . . . . . . . .
arg_dbl() . . . . . . . . . . . . . . . . . . . . . . . . . . . . . . . . . . . . . . . . . . . . . . . .
num_args() . . . . . . . . . . . . . . . . . . . . . . . . . . . . . . . . . . . . . . . . . . . . . .
pid() . . . . . . . . . . . . . . . . . . . . . . . . . . . . . . . . . . . . . . . . . . . . . . . . . . .
raw_pid() . . . . . . . . . . . . . . . . . . . . . . . . . . . . . . . . . . . . . . . . . . . . . . .
lwpid() . . . . . . . . . . . . . . . . . . . . . . . . . . . . . . . . . . . . . . . . . . . . . . . . .
thread_id() . . . . . . . . . . . . . . . . . . . . . . . . . . . . . . . . . . . . . . . . . . . . . .
task_id() . . . . . . . . . . . . . . . . . . . . . . . . . . . . . . . . . . . . . . . . . . . . . . . .
tid(). . . . . . . . . . . . . . . . . . . . . . . . . . . . . . . . . . . . . . . . . . . . . . . . . . . .
cpu() . . . . . . . . . . . . . . . . . . . . . . . . . . . . . . . . . . . . . . . . . . . . . . . . . . .
offset() . . . . . . . . . . . . . . . . . . . . . . . . . . . . . . . . . . . . . . . . . . . . . . . . .
time() . . . . . . . . . . . . . . . . . . . . . . . . . . . . . . . . . . . . . . . . . . . . . . . . . .
node_id() . . . . . . . . . . . . . . . . . . . . . . . . . . . . . . . . . . . . . . . . . . . . . . .
pid_table_name() . . . . . . . . . . . . . . . . . . . . . . . . . . . . . . . . . . . . . . . . .
tid_table_name() . . . . . . . . . . . . . . . . . . . . . . . . . . . . . . . . . . . . . . . . .
node_name(). . . . . . . . . . . . . . . . . . . . . . . . . . . . . . . . . . . . . . . . . . . . .
process_name() . . . . . . . . . . . . . . . . . . . . . . . . . . . . . . . . . . . . . . . . . .
task_name() . . . . . . . . . . . . . . . . . . . . . . . . . . . . . . . . . . . . . . . . . . . . .
thread_name() . . . . . . . . . . . . . . . . . . . . . . . . . . . . . . . . . . . . . . . . . . .
Multi-Event Functions . . . . . . . . . . . . . . . . . . . . . . . . . . . . . . . . . . . . .
event_gap() . . . . . . . . . . . . . . . . . . . . . . . . . . . . . . . . . . . . . . . . . .
event_matches() . . . . . . . . . . . . . . . . . . . . . . . . . . . . . . . . . . . . . .
State Functions . . . . . . . . . . . . . . . . . . . . . . . . . . . . . . . . . . . . . . . . . . . . . .
Start Functions . . . . . . . . . . . . . . . . . . . . . . . . . . . . . . . . . . . . . . . . . . .
start_id() . . . . . . . . . . . . . . . . . . . . . . . . . . . . . . . . . . . . . . . . . . . .
start_arg() . . . . . . . . . . . . . . . . . . . . . . . . . . . . . . . . . . . . . . . . . . .
9-1
9-1
9-2
9-2
9-4
9-4
9-5
9-5
9-6
9-9
9-12
9-13
9-19
9-19
9-20
9-21
9-21
9-22
9-23
9-23
9-24
9-25
9-25
9-26
9-27
9-27
9-28
9-29
9-29
9-30
9-30
9-31
9-32
9-32
9-32
9-33
9-34
9-34
9-35
9-35
11
NightTrace Manual
start_arg_dbl() . . . . . . . . . . . . . . . . . . . . . . . . . . . . . . . . . . . . . . . .
start_num_args() . . . . . . . . . . . . . . . . . . . . . . . . . . . . . . . . . . . . . .
start_pid() . . . . . . . . . . . . . . . . . . . . . . . . . . . . . . . . . . . . . . . . . . .
start_raw_pid() . . . . . . . . . . . . . . . . . . . . . . . . . . . . . . . . . . . . . . .
start_lwpid() . . . . . . . . . . . . . . . . . . . . . . . . . . . . . . . . . . . . . . . . .
start_thread_id() . . . . . . . . . . . . . . . . . . . . . . . . . . . . . . . . . . . . . .
start_task_id() . . . . . . . . . . . . . . . . . . . . . . . . . . . . . . . . . . . . . . . .
start_tid() . . . . . . . . . . . . . . . . . . . . . . . . . . . . . . . . . . . . . . . . . . . .
start_cpu() . . . . . . . . . . . . . . . . . . . . . . . . . . . . . . . . . . . . . . . . . . .
start_offset() . . . . . . . . . . . . . . . . . . . . . . . . . . . . . . . . . . . . . . . . .
start_time() . . . . . . . . . . . . . . . . . . . . . . . . . . . . . . . . . . . . . . . . . .
start_node_id() . . . . . . . . . . . . . . . . . . . . . . . . . . . . . . . . . . . . . . .
start_pid_table_name() . . . . . . . . . . . . . . . . . . . . . . . . . . . . . . . . .
start_tid_table_name(). . . . . . . . . . . . . . . . . . . . . . . . . . . . . . . . . .
start_node_name() . . . . . . . . . . . . . . . . . . . . . . . . . . . . . . . . . . . . .
End Functions. . . . . . . . . . . . . . . . . . . . . . . . . . . . . . . . . . . . . . . . . . . .
end_id() . . . . . . . . . . . . . . . . . . . . . . . . . . . . . . . . . . . . . . . . . . . . .
end_arg() . . . . . . . . . . . . . . . . . . . . . . . . . . . . . . . . . . . . . . . . . . . .
end_arg_dbl() . . . . . . . . . . . . . . . . . . . . . . . . . . . . . . . . . . . . . . . .
end_num_args(). . . . . . . . . . . . . . . . . . . . . . . . . . . . . . . . . . . . . . .
end_pid() . . . . . . . . . . . . . . . . . . . . . . . . . . . . . . . . . . . . . . . . . . . .
end_raw_pid() . . . . . . . . . . . . . . . . . . . . . . . . . . . . . . . . . . . . . . . .
end_lwpid() . . . . . . . . . . . . . . . . . . . . . . . . . . . . . . . . . . . . . . . . . .
end_thread_id() . . . . . . . . . . . . . . . . . . . . . . . . . . . . . . . . . . . . . . .
end_task_id() . . . . . . . . . . . . . . . . . . . . . . . . . . . . . . . . . . . . . . . . .
end_tid() . . . . . . . . . . . . . . . . . . . . . . . . . . . . . . . . . . . . . . . . . . . .
end_cpu(). . . . . . . . . . . . . . . . . . . . . . . . . . . . . . . . . . . . . . . . . . . .
end_offset() . . . . . . . . . . . . . . . . . . . . . . . . . . . . . . . . . . . . . . . . . .
end_time() . . . . . . . . . . . . . . . . . . . . . . . . . . . . . . . . . . . . . . . . . . .
end_node_id() . . . . . . . . . . . . . . . . . . . . . . . . . . . . . . . . . . . . . . . .
end_pid_table_name(). . . . . . . . . . . . . . . . . . . . . . . . . . . . . . . . . .
end_tid_table_name() . . . . . . . . . . . . . . . . . . . . . . . . . . . . . . . . . .
end_node_name() . . . . . . . . . . . . . . . . . . . . . . . . . . . . . . . . . . . . .
Multi-State Functions . . . . . . . . . . . . . . . . . . . . . . . . . . . . . . . . . . . . . .
state_gap() . . . . . . . . . . . . . . . . . . . . . . . . . . . . . . . . . . . . . . . . . . .
state_dur() . . . . . . . . . . . . . . . . . . . . . . . . . . . . . . . . . . . . . . . . . . .
state_matches() . . . . . . . . . . . . . . . . . . . . . . . . . . . . . . . . . . . . . . .
state_status() . . . . . . . . . . . . . . . . . . . . . . . . . . . . . . . . . . . . . . . . .
Offset Functions. . . . . . . . . . . . . . . . . . . . . . . . . . . . . . . . . . . . . . . . . . . . . .
offset_id() . . . . . . . . . . . . . . . . . . . . . . . . . . . . . . . . . . . . . . . . . . . . . . .
offset_arg() . . . . . . . . . . . . . . . . . . . . . . . . . . . . . . . . . . . . . . . . . . . . . .
offset_arg_dbl() . . . . . . . . . . . . . . . . . . . . . . . . . . . . . . . . . . . . . . . . . .
offset_num_args(). . . . . . . . . . . . . . . . . . . . . . . . . . . . . . . . . . . . . . . . .
offset_pid() . . . . . . . . . . . . . . . . . . . . . . . . . . . . . . . . . . . . . . . . . . . . . .
offset_raw_pid() . . . . . . . . . . . . . . . . . . . . . . . . . . . . . . . . . . . . . . . . . .
offset_lwpid() . . . . . . . . . . . . . . . . . . . . . . . . . . . . . . . . . . . . . . . . . . . .
offset_thread_id() . . . . . . . . . . . . . . . . . . . . . . . . . . . . . . . . . . . . . . . . .
offset_task_id(). . . . . . . . . . . . . . . . . . . . . . . . . . . . . . . . . . . . . . . . . . .
offset_tid() . . . . . . . . . . . . . . . . . . . . . . . . . . . . . . . . . . . . . . . . . . . . . .
offset_cpu(). . . . . . . . . . . . . . . . . . . . . . . . . . . . . . . . . . . . . . . . . . . . . .
offset_time() . . . . . . . . . . . . . . . . . . . . . . . . . . . . . . . . . . . . . . . . . . . . .
offset_node_id() . . . . . . . . . . . . . . . . . . . . . . . . . . . . . . . . . . . . . . . . . .
offset_pid_table_name(). . . . . . . . . . . . . . . . . . . . . . . . . . . . . . . . . . . .
offset_tid_table_name() . . . . . . . . . . . . . . . . . . . . . . . . . . . . . . . . . . . .
12
9-36
9-37
9-37
9-38
9-39
9-39
9-40
9-41
9-41
9-42
9-42
9-43
9-44
9-44
9-45
9-45
9-46
9-47
9-47
9-48
9-48
9-49
9-50
9-51
9-51
9-52
9-52
9-53
9-54
9-54
9-55
9-55
9-56
9-56
9-57
9-57
9-58
9-58
9-59
9-60
9-60
9-61
9-61
9-62
9-63
9-63
9-64
9-64
9-65
9-66
9-66
9-67
9-67
9-68
Contents
offset_node_name() . . . . . . . . . . . . . . . . . . . . . . . . . . . . . . . . . . . . . . .
offset_process_name() . . . . . . . . . . . . . . . . . . . . . . . . . . . . . . . . . . . . .
offset_task_name(). . . . . . . . . . . . . . . . . . . . . . . . . . . . . . . . . . . . . . . .
offset_thread_name() . . . . . . . . . . . . . . . . . . . . . . . . . . . . . . . . . . . . . .
Summary Functions. . . . . . . . . . . . . . . . . . . . . . . . . . . . . . . . . . . . . . . . . . .
min(). . . . . . . . . . . . . . . . . . . . . . . . . . . . . . . . . . . . . . . . . . . . . . . . . . .
max() . . . . . . . . . . . . . . . . . . . . . . . . . . . . . . . . . . . . . . . . . . . . . . . . . .
avg() . . . . . . . . . . . . . . . . . . . . . . . . . . . . . . . . . . . . . . . . . . . . . . . . . . .
sum() . . . . . . . . . . . . . . . . . . . . . . . . . . . . . . . . . . . . . . . . . . . . . . . . . .
min_offset() . . . . . . . . . . . . . . . . . . . . . . . . . . . . . . . . . . . . . . . . . . . . .
max_offset() . . . . . . . . . . . . . . . . . . . . . . . . . . . . . . . . . . . . . . . . . . . . .
summary_matches() . . . . . . . . . . . . . . . . . . . . . . . . . . . . . . . . . . . . . . .
Format and Table Functions . . . . . . . . . . . . . . . . . . . . . . . . . . . . . . . . . . . .
get_string() . . . . . . . . . . . . . . . . . . . . . . . . . . . . . . . . . . . . . . . . . . . . . .
get_item() . . . . . . . . . . . . . . . . . . . . . . . . . . . . . . . . . . . . . . . . . . . . . . .
get_format() . . . . . . . . . . . . . . . . . . . . . . . . . . . . . . . . . . . . . . . . . . . . .
format() . . . . . . . . . . . . . . . . . . . . . . . . . . . . . . . . . . . . . . . . . . . . . . . .
Qualified Events . . . . . . . . . . . . . . . . . . . . . . . . . . . . . . . . . . . . . . . . . . . . . . . . .
Qualified States . . . . . . . . . . . . . . . . . . . . . . . . . . . . . . . . . . . . . . . . . . . . . . . . .
9-68
9-69
9-69
9-70
9-70
9-71
9-71
9-72
9-72
9-73
9-73
9-74
9-75
9-75
9-77
9-79
9-80
9-81
9-83
Chapter 10 Using the Built-In Tools
Overview . . . . . . . . . . . . . . . . . . . . . . . . . . . . . . . . . . . . . . . . . . . . . . . . . . . . . . . . . .
Searching for Points of Interest . . . . . . . . . . . . . . . . . . . . . . . . . . . . . . . . . . . . . . . . .
Search Form Radio Buttons . . . . . . . . . . . . . . . . . . . . . . . . . . . . . . . . . . . . . . . .
Search Form Push Buttons . . . . . . . . . . . . . . . . . . . . . . . . . . . . . . . . . . . . . . . . .
Search Form Fields. . . . . . . . . . . . . . . . . . . . . . . . . . . . . . . . . . . . . . . . . . . . . . .
Summarizing Statistical Information . . . . . . . . . . . . . . . . . . . . . . . . . . . . . . . . . . . . .
Summarize Form Radio Buttons . . . . . . . . . . . . . . . . . . . . . . . . . . . . . . . . . . . .
Summarize Form Fields . . . . . . . . . . . . . . . . . . . . . . . . . . . . . . . . . . . . . . . . . . .
Summarize Form Push Buttons . . . . . . . . . . . . . . . . . . . . . . . . . . . . . . . . . . . . .
Menu Bar . . . . . . . . . . . . . . . . . . . . . . . . . . . . . . . . . . . . . . . . . . . . . . . . . . . . . .
File Operations . . . . . . . . . . . . . . . . . . . . . . . . . . . . . . . . . . . . . . . . . . . . . .
Save Text . . . . . . . . . . . . . . . . . . . . . . . . . . . . . . . . . . . . . . . . . . . . . . .
Save Text As ... . . . . . . . . . . . . . . . . . . . . . . . . . . . . . . . . . . . . . . . . . .
Close. . . . . . . . . . . . . . . . . . . . . . . . . . . . . . . . . . . . . . . . . . . . . . . . . . .
Summary Display Area . . . . . . . . . . . . . . . . . . . . . . . . . . . . . . . . . . . . . . . . . . .
Event Summaries . . . . . . . . . . . . . . . . . . . . . . . . . . . . . . . . . . . . . . . . . . . . . . . .
State Summaries . . . . . . . . . . . . . . . . . . . . . . . . . . . . . . . . . . . . . . . . . . . . . . . . .
Exercise: Using the Search Tool . . . . . . . . . . . . . . . . . . . . . . . . . . . . . . . . . . . . . . . .
Exercise: Using the Summarize Tool . . . . . . . . . . . . . . . . . . . . . . . . . . . . . . . . . . . .
10-1
10-1
10-2
10-3
10-4
10-5
10-6
10-6
10-8
10-9
10-9
10-10
10-10
10-10
10-10
10-11
10-12
10-14
10-15
Chapter 11 Tracing the Kernel
Overview . . . . . . . . . . . . . . . . . . . . . . . . . . . . . . . . . . . . . . . . . . . . . . . . . . . . . . . . . .
Default Kernel Trace Points . . . . . . . . . . . . . . . . . . . . . . . . . . . . . . . . . . . . . . . . . . .
Context Switch Trace Event . . . . . . . . . . . . . . . . . . . . . . . . . . . . . . . . . . . . . . . .
Interrupt Trace Events . . . . . . . . . . . . . . . . . . . . . . . . . . . . . . . . . . . . . . . . . . . .
Exception Trace Events . . . . . . . . . . . . . . . . . . . . . . . . . . . . . . . . . . . . . . . . . . .
Syscall Trace Events. . . . . . . . . . . . . . . . . . . . . . . . . . . . . . . . . . . . . . . . . . . . . .
Kernel Trace Points Not Enabled By Default . . . . . . . . . . . . . . . . . . . . . . . . . . . . . .
Page Fault Event. . . . . . . . . . . . . . . . . . . . . . . . . . . . . . . . . . . . . . . . . . . . . . . . .
Protection Fault Event . . . . . . . . . . . . . . . . . . . . . . . . . . . . . . . . . . . . . . . . . . . .
11-1
11-1
11-2
11-2
11-3
11-4
11-5
11-5
11-5
13
NightTrace Manual
Viewing Kernel Trace Event Files . . . . . . . . . . . . . . . . . . . . . . . . . . . . . . . . . . . . . . .
Kernel Display Pages . . . . . . . . . . . . . . . . . . . . . . . . . . . . . . . . . . . . . . . . . . . . .
RCIM Default Kernel Display Page . . . . . . . . . . . . . . . . . . . . . . . . . . . . . .
CPU Information . . . . . . . . . . . . . . . . . . . . . . . . . . . . . . . . . . . . . . . . . . . . .
Running Process Information . . . . . . . . . . . . . . . . . . . . . . . . . . . . . . . . . . .
Node Information . . . . . . . . . . . . . . . . . . . . . . . . . . . . . . . . . . . . . . . . . . . .
Context Switch Information . . . . . . . . . . . . . . . . . . . . . . . . . . . . . . . . . . . .
Interrupt Information . . . . . . . . . . . . . . . . . . . . . . . . . . . . . . . . . . . . . . . . . .
Exception Information . . . . . . . . . . . . . . . . . . . . . . . . . . . . . . . . . . . . . . . . .
Syscall Information . . . . . . . . . . . . . . . . . . . . . . . . . . . . . . . . . . . . . . . . . . .
Color Information . . . . . . . . . . . . . . . . . . . . . . . . . . . . . . . . . . . . . . . . . . . .
Kernel String Tables . . . . . . . . . . . . . . . . . . . . . . . . . . . . . . . . . . . . . . . . . . . . . .
Kernel Reference . . . . . . . . . . . . . . . . . . . . . . . . . . . . . . . . . . . . . . . . . . . . . . . . . . . .
Interrupts . . . . . . . . . . . . . . . . . . . . . . . . . . . . . . . . . . . . . . . . . . . . . . . . . . . . . . .
Non-Device-Related Interrupts . . . . . . . . . . . . . . . . . . . . . . . . . . . . . . . . . .
Device-Related Interrupts . . . . . . . . . . . . . . . . . . . . . . . . . . . . . . . . . . . . . .
Exceptions. . . . . . . . . . . . . . . . . . . . . . . . . . . . . . . . . . . . . . . . . . . . . . . . . . . . . .
Syscalls . . . . . . . . . . . . . . . . . . . . . . . . . . . . . . . . . . . . . . . . . . . . . . . . . . . . . . . .
11-6
11-6
11-7
11-9
11-10
11-11
11-11
11-12
11-13
11-15
11-16
11-16
11-18
11-19
11-19
11-20
11-20
11-21
Appendix A Performance Tuning
Overview . . . . . . . . . . . . . . . . . . . . . . . . . . . . . . . . . . . . . . . . . . . . . . . . . . . . . . . . . .
Preventing Trace Events Loss . . . . . . . . . . . . . . . . . . . . . . . . . . . . . . . . . . . . . . . . . .
Ensuring Accurate Timings . . . . . . . . . . . . . . . . . . . . . . . . . . . . . . . . . . . . . . . . . . . .
Optimizing File System and CPU Usage. . . . . . . . . . . . . . . . . . . . . . . . . . . . . . . . . .
Conserving Disk Space . . . . . . . . . . . . . . . . . . . . . . . . . . . . . . . . . . . . . . . . . . . . . . .
Conserving Memory and Accelerating ntrace . . . . . . . . . . . . . . . . . . . . . . . . . . . . . .
A-1
A-1
A-3
A-3
A-4
A-4
Appendix B GUI Customization
Overview . . . . . . . . . . . . . . . . . . . . . . . . . . . . . . . . . . . . . . . . . . . . . . . . . . . . . . . . . .
Default X-Resource Settings for ntrace . . . . . . . . . . . . . . . . . . . . . . . . . . . . . . . . . . .
Examples . . . . . . . . . . . . . . . . . . . . . . . . . . . . . . . . . . . . . . . . . . . . . . . . . . . . . . . . . .
Exercise: Customizing Display Colors . . . . . . . . . . . . . . . . . . . . . . . . . . . . . . . . . . .
B-1
B-2
B-5
B-5
Appendix C Answers to Common Questions
Illustrations
Figure 1-1.
Figure 1-2.
Figure 2-1.
Figure 2-2.
Figure 2-3.
Figure 3-1.
Figure 3-2.
Figure 3-3.
Figure 3-4.
Figure 3-5.
Figure 3-6.
Figure 3-7.
Figure 3-8.
14
Example of Instrumented C Code . . . . . . . . . . . . . . . . . . . . . . . . . . . . .
Example of a User Display Page with Display Objects . . . . . . . . . . . . .
Inter-Process Communication and Library Routines . . . . . . . . . . . . . . .
entry_exit.c Before Instrumentation . . . . . . . . . . . . . . . . . . . . . . . . . . .
entry_exit.c After Instrumentation . . . . . . . . . . . . . . . . . . . . . . . . . . . .
NightTrace Session Manager . . . . . . . . . . . . . . . . . . . . . . . . . . . . . . . .
NightTrace Menu . . . . . . . . . . . . . . . . . . . . . . . . . . . . . . . . . . . . . . . . .
Open Session dialog . . . . . . . . . . . . . . . . . . . . . . . . . . . . . . . . . . . . . . .
Save Session dialog . . . . . . . . . . . . . . . . . . . . . . . . . . . . . . . . . . . . . . . .
Unsaved Changes dialog . . . . . . . . . . . . . . . . . . . . . . . . . . . . . . . . . . . .
Daemons Menu . . . . . . . . . . . . . . . . . . . . . . . . . . . . . . . . . . . . . . . . . . .
Login dialog . . . . . . . . . . . . . . . . . . . . . . . . . . . . . . . . . . . . . . . . . . . . .
Enter Password dialog . . . . . . . . . . . . . . . . . . . . . . . . . . . . . . . . . . . . . .
1-4
1-6
2-4
2-26
2-29
2-2
2-3
2-5
2-7
2-8
2-9
2-11
2-12
Contents
Figure 3-9. Attach Daemons dialog . . . . . . . . . . . . . . . . . . . . . . . . . . . . . . . . . . . . .
Figure 3-10. Options Menu . . . . . . . . . . . . . . . . . . . . . . . . . . . . . . . . . . . . . . . . . . .
Figure 3-11. Refresh Interval dialog . . . . . . . . . . . . . . . . . . . . . . . . . . . . . . . . . . . .
Figure 3-12. Tools Menu . . . . . . . . . . . . . . . . . . . . . . . . . . . . . . . . . . . . . . . . . . . . .
Figure 3-13. Help Menu . . . . . . . . . . . . . . . . . . . . . . . . . . . . . . . . . . . . . . . . . . . . .
Figure 3-14. Session Configuration File Name Area . . . . . . . . . . . . . . . . . . . . . . .
Figure 3-15. Daemon Details Area . . . . . . . . . . . . . . . . . . . . . . . . . . . . . . . . . . . . .
Figure 3-16. Daemon Control Area . . . . . . . . . . . . . . . . . . . . . . . . . . . . . . . . . . . . .
Figure 3-17. Enable / Disable Trace Events dialog . . . . . . . . . . . . . . . . . . . . . . . . .
Figure 3-18. Daemon Definition dialog . . . . . . . . . . . . . . . . . . . . . . . . . . . . . . . . .
Figure 3-19. Import Daemon Definition dialog . . . . . . . . . . . . . . . . . . . . . . . . . . . .
Figure 3-20. Daemon Definition dialog - General . . . . . . . . . . . . . . . . . . . . . . . . .
Figure 3-21. Daemon Definition dialog - User Trace . . . . . . . . . . . . . . . . . . . . . . .
Figure 3-22. Daemon Definition dialog - Events . . . . . . . . . . . . . . . . . . . . . . . . . .
Figure 3-23. Load Event Names dialog . . . . . . . . . . . . . . . . . . . . . . . . . . . . . . . . . .
Figure 3-24. Daemon Definition dialog - Runtime . . . . . . . . . . . . . . . . . . . . . . . . .
Figure 3-25. Daemon Definition dialog - Streaming . . . . . . . . . . . . . . . . . . . . . . . .
Figure 5-1. Window Components . . . . . . . . . . . . . . . . . . . . . . . . . . . . . . . . . . . . . .
Figure 5-2. Global Window for a Single Trace Event File . . . . . . . . . . . . . . . . . . .
Figure 5-3. Global Window File Menu . . . . . . . . . . . . . . . . . . . . . . . . . . . . . . . . . .
Figure 5-4. New Display Page . . . . . . . . . . . . . . . . . . . . . . . . . . . . . . . . . . . . . . . . .
Figure 5-5. A Default Display Page . . . . . . . . . . . . . . . . . . . . . . . . . . . . . . . . . . . .
Figure 5-6. The Open Config File Dialog Box . . . . . . . . . . . . . . . . . . . . . . . . . . . .
Figure 5-7. The Read Event-Map File Dialog Box . . . . . . . . . . . . . . . . . . . . . . . . .
Figure 5-8. Global Window Help Menu . . . . . . . . . . . . . . . . . . . . . . . . . . . . . . . . .
Figure 6-1. A Display Page in View Mode . . . . . . . . . . . . . . . . . . . . . . . . . . . . . . .
Figure 6-2. The Grid . . . . . . . . . . . . . . . . . . . . . . . . . . . . . . . . . . . . . . . . . . . . . . . .
Figure 6-3. Deciding What to Do Next in View Mode . . . . . . . . . . . . . . . . . . . . . .
Figure 6-4. The Interval Scroll Bar . . . . . . . . . . . . . . . . . . . . . . . . . . . . . . . . . . . . .
Figure 6-5. The Interval Push Buttons . . . . . . . . . . . . . . . . . . . . . . . . . . . . . . . . . . .
Figure 6-6. The Interval Control Area . . . . . . . . . . . . . . . . . . . . . . . . . . . . . . . . . . .
Figure 6-7. Amount of Scrolling Due to Increment Value . . . . . . . . . . . . . . . . . . .
Figure 7-1. Display Page with Display Objects . . . . . . . . . . . . . . . . . . . . . . . . . . .
Figure 7-2. Elements of a Display Page . . . . . . . . . . . . . . . . . . . . . . . . . . . . . . . . .
Figure 7-3. Edit and View Mode Buttons . . . . . . . . . . . . . . . . . . . . . . . . . . . . . . . .
Figure 7-4. Button Functions on a Mouse . . . . . . . . . . . . . . . . . . . . . . . . . . . . . . . .
Figure 7-5. Create Display Objects Menu . . . . . . . . . . . . . . . . . . . . . . . . . . . . . . . .
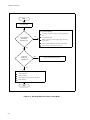
Figure 7-6. Display Object Use Flowchart . . . . . . . . . . . . . . . . . . . . . . . . . . . . . . .
Figure 7-7. GridLabel Examples . . . . . . . . . . . . . . . . . . . . . . . . . . . . . . . . . . . . . . .
Figure 7-8. DataBox Examples . . . . . . . . . . . . . . . . . . . . . . . . . . . . . . . . . . . . . . . .
Figure 7-9. Column Example . . . . . . . . . . . . . . . . . . . . . . . . . . . . . . . . . . . . . . . . .
Figure 7-10. StateGraph Example . . . . . . . . . . . . . . . . . . . . . . . . . . . . . . . . . . . . . .
Figure 7-11. EventGraph Example . . . . . . . . . . . . . . . . . . . . . . . . . . . . . . . . . . . . .
Figure 7-12. DataGraph Examples . . . . . . . . . . . . . . . . . . . . . . . . . . . . . . . . . . . . .
Figure 7-13. Ruler Example . . . . . . . . . . . . . . . . . . . . . . . . . . . . . . . . . . . . . . . . . .
Figure 7-14. Edit Menu . . . . . . . . . . . . . . . . . . . . . . . . . . . . . . . . . . . . . . . . . . . . . .
Figure 7-15. File Menu . . . . . . . . . . . . . . . . . . . . . . . . . . . . . . . . . . . . . . . . . . . . . .
Figure 8-1. Configure Command Menu . . . . . . . . . . . . . . . . . . . . . . . . . . . . . . . . .
Figure 8-2. Left-, Center-, and Right-Justified Text . . . . . . . . . . . . . . . . . . . . . . . .
Figure 8-3. Top vs. Bottom Gravity . . . . . . . . . . . . . . . . . . . . . . . . . . . . . . . . . . . . .
Figure 8-4. Configuration Form Push Buttons . . . . . . . . . . . . . . . . . . . . . . . . . . . .
Figure 8-5. GridLabel Configuration Form . . . . . . . . . . . . . . . . . . . . . . . . . . . . . . .
Figure 8-6. DataBox Configuration Form . . . . . . . . . . . . . . . . . . . . . . . . . . . . . . . .
Figure 8-7. StateGraph Configuration Form . . . . . . . . . . . . . . . . . . . . . . . . . . . . . .
2-12
2-14
2-14
2-15
2-16
2-17
2-18
2-20
2-22
2-25
2-27
2-29
2-34
2-38
2-40
2-41
2-45
2-24
2-25
2-26
2-28
2-29
2-31
2-32
2-33
2-2
2-4
2-6
2-7
2-8
2-11
2-14
2-1
2-2
2-3
2-5
2-8
2-12
2-12
2-12
2-13
2-14
2-15
2-16
2-17
2-17
2-18
2-1
2-10
2-10
2-10
2-12
2-13
2-14
15
NightTrace Manual
Figure 8-8. EventGraph Configuration Form . . . . . . . . . . . . . . . . . . . . . . . . . . . . . 2-16
Figure 8-9. DataGraph Configuration Form . . . . . . . . . . . . . . . . . . . . . . . . . . . . . . 2-17
Figure 8-10. Solid vs. No Fill . . . . . . . . . . . . . . . . . . . . . . . . . . . . . . . . . . . . . . . . . 2-18
Figure 8-11. Maximum vs. Minimum Values . . . . . . . . . . . . . . . . . . . . . . . . . . . . . 2-18
Figure 8-12. Ruler Configuration Form . . . . . . . . . . . . . . . . . . . . . . . . . . . . . . . . . . 2-19
Figure 8-13. Mark and Lost Event Markers . . . . . . . . . . . . . . . . . . . . . . . . . . . . . . . 2-19
Figure 9-1. Expressions Menu . . . . . . . . . . . . . . . . . . . . . . . . . . . . . . . . . . . . . . . . .
2-1
Figure 9-2. Macro Dialog Box . . . . . . . . . . . . . . . . . . . . . . . . . . . . . . . . . . . . . . . . .
2-2
Figure 9-3. Configuration Form Push Buttons . . . . . . . . . . . . . . . . . . . . . . . . . . . . .
2-3
Figure 9-4. Macro Configuration Form . . . . . . . . . . . . . . . . . . . . . . . . . . . . . . . . . .
2-7
Figure 9-5. Function Terminology Illustrated . . . . . . . . . . . . . . . . . . . . . . . . . . . . . 2-14
Figure 9-6. States and Events . . . . . . . . . . . . . . . . . . . . . . . . . . . . . . . . . . . . . . . . . . 2-15
Figure 9-7. Qualified Event Configuration Form . . . . . . . . . . . . . . . . . . . . . . . . . . 2-82
Figure 9-8. Qualified State Configuration Form . . . . . . . . . . . . . . . . . . . . . . . . . . . 2-84
Figure 10-1. Tools Menu . . . . . . . . . . . . . . . . . . . . . . . . . . . . . . . . . . . . . . . . . . . . .
2-1
Figure 10-2. The Search Form . . . . . . . . . . . . . . . . . . . . . . . . . . . . . . . . . . . . . . . . .
2-2
Figure 10-3. Summarize Form File Menu . . . . . . . . . . . . . . . . . . . . . . . . . . . . . . . . 2-10
Figure 10-4. The Event Summarize Form . . . . . . . . . . . . . . . . . . . . . . . . . . . . . . . . 2-12
Figure 10-5. The State Summarize Form . . . . . . . . . . . . . . . . . . . . . . . . . . . . . . . . . 2-14
Figure 11-1. Global Window File Menu . . . . . . . . . . . . . . . . . . . . . . . . . . . . . . . . .
2-6
Figure 11-2. Sample Kernel Display Page . . . . . . . . . . . . . . . . . . . . . . . . . . . . . . . .
2-7
Figure 11-3. Node Selection Dialog . . . . . . . . . . . . . . . . . . . . . . . . . . . . . . . . . . . . .
2-8
Figure 11-4. Node Selection Warning Dialog . . . . . . . . . . . . . . . . . . . . . . . . . . . . .
2-9
Figure 11-5. Per-CPU Information . . . . . . . . . . . . . . . . . . . . . . . . . . . . . . . . . . . . . .
2-9
Figure 11-6. CPU Box . . . . . . . . . . . . . . . . . . . . . . . . . . . . . . . . . . . . . . . . . . . . . . .
2-9
Figure 11-7. Running Process Boxes . . . . . . . . . . . . . . . . . . . . . . . . . . . . . . . . . . . . 2-10
Figure 11-8. Node Box . . . . . . . . . . . . . . . . . . . . . . . . . . . . . . . . . . . . . . . . . . . . . . . 2-11
Figure 11-9. Context Switch Lines . . . . . . . . . . . . . . . . . . . . . . . . . . . . . . . . . . . . . 2-11
Figure 11-10. Last Interrupt Box and Interrupt Graph . . . . . . . . . . . . . . . . . . . . . . . 2-12
Figure 11-11. Last Exception Box and Exception Graph . . . . . . . . . . . . . . . . . . . . . 2-13
Figure 11-12. TR_PAGEFLT_ADDR and TR_PROTFLT_ADDR Events . . . . . . . 2-14
Figure 11-13. TR_SWITCHIN vs. TR_PAGEFLT_ADDR and TR_PROTFLT_ADDR
Events. . . . . . . . . . . . . . . . . . . . . . . . . . . . . . . . . . . . . . . . . . . . . . . . . . . . . . . . . . . . . 2-15
Figure 11-14. Last Syscall Box and Syscall Graph. . . . . . . . . . . . . . . . . . . . . . . . . . 2-15
Figure 11-15. Color Key . . . . . . . . . . . . . . . . . . . . . . . . . . . . . . . . . . . . . . . . . . . . . 2-16
Screens
Screen 4-1.
Screen 4-2.
Screen 5-1.
Screen 5-2.
Screen 5-3.
Screen 5-4.
Sample Output from the ntraceud -help Option. . . . . . . . . . . . . . . . . . .
Sample Output from ntraceud -stats Option . . . . . . . . . . . . . . . . . . . . .
Sample Output from the ntrace -help Option. . . . . . . . . . . . . . . . . . . . .
Example of ntrace -listing Output (with instr page fault) . . . . . . . . . . .
Example of ntrace -listing Output (with data page fault) . . . . . . . . . . .
Example of ntrace -filestats Output . . . . . . . . . . . . . . . . . . . . . . . . . . . .
2-7
2-23
2-4
2-5
2-6
2-6
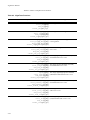
NightTrace Configuration Defaults . . . . . . . . . . . . . . . . . . . . . . . . . . . . .
Mode-Selection Guidelines . . . . . . . . . . . . . . . . . . . . . . . . . . . . . . . . . . .
NightTrace Operating Modes. . . . . . . . . . . . . . . . . . . . . . . . . . . . . . . . . .
ntraceud Disable Sequence #1 . . . . . . . . . . . . . . . . . . . . . . . . . . . . . . . . .
ntraceud Disable Sequence #2 . . . . . . . . . . . . . . . . . . . . . . . . . . . . . . . . .
ntraceud Enable Sequence #1 . . . . . . . . . . . . . . . . . . . . . . . . . . . . . . . . .
2-4
2-5
2-5
2-25
2-25
2-27
Tables
Table 4-1.
Table 4-2.
Table 4-3.
Table 4-4.
Table 4-5.
Table 4-6.
16
Contents
Table 4-7. ntraceud Enable Sequence #2 . . . . . . . . . . . . . . . . . . . . . . . . . . . . . . . . .
Table 5-1. ntrace Pointer Shapes and Their Usage . . . . . . . . . . . . . . . . . . . . . . . . . .
Table 6-1. View-Mode Mouse Button Operations . . . . . . . . . . . . . . . . . . . . . . . . . .
Table 6-2. Manipulating the Interval Scroll Bar . . . . . . . . . . . . . . . . . . . . . . . . . . . .
Table 6-3. Valid Multiple Field Changes . . . . . . . . . . . . . . . . . . . . . . . . . . . . . . . . .
Table 6-4. Making Editing Changes . . . . . . . . . . . . . . . . . . . . . . . . . . . . . . . . . . . . .
Table 6-5. Positioning Within a Text Field . . . . . . . . . . . . . . . . . . . . . . . . . . . . . . . .
Table 7-1. Edit-Mode Mouse Button Operations . . . . . . . . . . . . . . . . . . . . . . . . . . .
Table 8-1. Common Configuration Parameters . . . . . . . . . . . . . . . . . . . . . . . . . . . .
Table 8-2. Examples of If-Expressions. . . . . . . . . . . . . . . . . . . . . . . . . . . . . . . . . . .
Table 8-3. Examples of Then-Expressions . . . . . . . . . . . . . . . . . . . . . . . . . . . . . . . .
Table 9-1. Time Units and Constant Suffixes. . . . . . . . . . . . . . . . . . . . . . . . . . . . . .
Table 9-2. A Comparison of Functions and Macros. . . . . . . . . . . . . . . . . . . . . . . . .
Table 9-3. NightTrace Functions . . . . . . . . . . . . . . . . . . . . . . . . . . . . . . . . . . . . . . .
Table 11-1. Example Logical CPU Mapping . . . . . . . . . . . . . . . . . . . . . . . . . . . . . .
Table 11-2. Non-Device-Related Interrupt Reference . . . . . . . . . . . . . . . . . . . . . . .
Table 11-3. Device-Related Interrupt Reference . . . . . . . . . . . . . . . . . . . . . . . . . . .
Table 11-4. Exception Reference . . . . . . . . . . . . . . . . . . . . . . . . . . . . . . . . . . . . . . .
Table B-1. Meanings of Common Subobjects and Attributes . . . . . . . . . . . . . . . . .
Table B-2. Suggested Colors for X Resources . . . . . . . . . . . . . . . . . . . . . . . . . . . . .
2-27
2-22
2-3
2-8
2-15
2-16
2-18
2-5
2-2
2-5
2-5
2-6
2-6
2-10
2-10
2-19
2-20
2-21
B-2
B-5
Glossary
Index
17
NightTrace Manual
18
1
Introduction
Overview . . . . . . . . . . . . . . . . . . . . . . . . . . . . . . . . . . . . . . . . . . . . . . . . . . . . . . . . . .
What is NightTrace? . . . . . . . . . . . . . . . . . . . . . . . . . . . . . . . . . . . . . . . . . . . . . . . . .
User and Kernel Tracing. . . . . . . . . . . . . . . . . . . . . . . . . . . . . . . . . . . . . . . . . . .
Timestamp Source Selection . . . . . . . . . . . . . . . . . . . . . . . . . . . . . . . . . . . . . . .
Trace-Point Placement . . . . . . . . . . . . . . . . . . . . . . . . . . . . . . . . . . . . . . . . . . . .
Languages Supported . . . . . . . . . . . . . . . . . . . . . . . . . . . . . . . . . . . . . . . . . . . . .
Processes and CPUs . . . . . . . . . . . . . . . . . . . . . . . . . . . . . . . . . . . . . . . . . . . . . .
Information Displayed . . . . . . . . . . . . . . . . . . . . . . . . . . . . . . . . . . . . . . . . . . . .
Searches and Summaries . . . . . . . . . . . . . . . . . . . . . . . . . . . . . . . . . . . . . . . . . .
Logging and Analysis . . . . . . . . . . . . . . . . . . . . . . . . . . . . . . . . . . . . . . . . . . . . . . . .
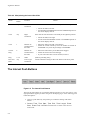
The User Trace Event Logging Procedure . . . . . . . . . . . . . . . . . . . . . . . . . . . .
The Kernel Trace Event Logging Procedure . . . . . . . . . . . . . . . . . . . . . . . . . . .
The Trace Event Analysis Procedure . . . . . . . . . . . . . . . . . . . . . . . . . . . . . . . . .
Recommended Reading . . . . . . . . . . . . . . . . . . . . . . . . . . . . . . . . . . . . . . . . . . . . . . .
1-1
1-1
1-2
1-2
1-2
1-3
1-3
1-3
1-3
1-3
1-4
1-5
1-6
1-7
NightTrace Manual
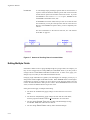
1
Chapter 1 Introduction
1
1
1
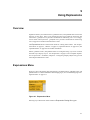
Overview
1
This chapter provides an overview of NightTrace, steps involved in using the toolset, and
recommended readings.
What is NightTrace?
1
The NightTrace toolset is part of the NightStarTM family consisting of an interactive
debugging and performance analysis tool, trace data collection daemons, and an Application Programming Interface (API) allowing user applications to log data values. NightTrace allows you to graphically display information about important events in your application and the kernel, for example, event occurrences, timings, and data values.
NightTrace consists of the following parts:
NightTrace API
Libraries and include files for use in user applications that log
trace events to shared memory
ntrace
A graphical tool that controls daemon sessions and displays
user and kernel trace events in trace event file(s)
ntraceud
A daemon program that copies user applications’ trace events
from shared memory to trace event file(s)
NightTrace is flexible. As a user, you control:
• Selection of user tracing of your application or kernel tracing
• Selection of timestamp source
• Trace-point placement within your application
• The source language of the trace application
• The number of processes and CPUs you gather data on
• The amounts and types of information you display
• Trace event searches and summaries
1-1
NightTrace Manual
User and Kernel Tracing
1
If interactions are important, you can simultaneously capture event information from your
application and from the kernel. Alternatively, you can capture just user events or
pre-defined kernel events.
Timestamp Source Selection
1
By default, an architecture-specific timing source is utilized. For Intel-based machines,
the Intel Time Stamp Counter (TSC register); for Night Hawk 6000 series machine, the
interval timer; for PowerHawk and PowerStack series machines, the Time Base Register
(TBR). However, the Real-Time Clock and Interrupt Module (RCIM) can be also used as
a timestamp source.
The RCIM is an optional hardware module, attached to a single-board computer (SBC),
which contains a tick clock that can be synchronized between several SBCs by way of an
interconnection cable. This synchronized tick clock can be used as a common time base
for both kernel-level tracing and user-level tracing across multiple SBCs. NightTrace supports using the RCIM synchronized tick clock to timestamp trace events and also supports
displaying trace data generated on multiple SBCs having the common time base. The
RCIM also contains a POSIX clock. However, the POSIX clock is not supported as a
timestamp source by NightTrace.
For more information about the RCIM, please see the clock_synchronize(1M),
rcim(7), rcimconfig(1M), and sync_clock(7) man pages.
Trace-Point Placement
1
A trace point is a place of interest in the source code. At each user trace point, you make
your application log some user-specified information along with a timestamp and some
additional system information. This logged information is collectively called a trace
event. In user traces, each trace event has a user-defined trace event ID number, and two
different trace event IDs delimit the boundaries of a user-defined state.
Some typical user trace-point locations include:
• Suspected bug locations
• Process, subprogram, or loop entry and exit points
• Timing points, especially for clocking I/O processing
• Synchronization points/multi-process interaction
• Endpoints of atomic operations
• Endpoints of shared memory access code
Careful trace point placement allows you to easily identify patterns and anomalies in your
application’s behavior.
1-2
Introduction
Kernel trace points and trace events are pre-defined and embedded in the kernel source.
Languages Supported
1
The NightTrace library is callable from C, Fortran and Ada. This means that your
application can be written in any combination of these languages and still log trace events.
Processes and CPUs
1
A user daemon is responsible for actually recording the trace events logged by an application to disk. It can interact with single-process and multi-process applications; the processes may even run on different CPUs. When you log a trace event, NightTrace identifies both the originating process and optionally the CPU. User daemons are initiated and
managed via the session manager in the ntrace graphical tool or via the ntraceud
command line tool.
Information Displayed
1
The ntrace display utility lets you examine some or all trace events. Data appear as
numerical statistics and as graphical images. You can create and configure the graphical
components called display objects or use the defaults. By creating your own display
objects, you can make the graphical displays more meaningful to you. You can customize
display objects to reflect your preferences in content, labeling, position, size, color, and
font.
Searches and Summaries
1
With the ntrace display utility, you can perform searches and summaries. Searches let
you filter out unwanted data and zero-in on trouble spots and specific data. Summaries let
you define characteristics of the trace event data to be summarized in several different
ways.
Logging and Analysis
1
NightTrace supports two activities: trace event logging and trace event analysis.
1-3
NightTrace Manual
The User Trace Event Logging Procedure
1
The following text describes user trace event logging. Follow these steps in the order
shown:
1. Establish a suitable environment for running your application and capturing trace data. Make sure you meet all the system requirements discussed
in the NightTrace Release Notes for the version you are running.
2. Select trace points in your source code. A trace point marks a point in your
application that is important to debugging or performance analysis.
3. Insert a call to a NightTrace trace event logging routine at each trace point
in your source code, so you can later see the trace event information graphically in ntrace. You can manually insert these calls into your source
code or insert them into the final executable with the NightView debugger.
See the NightView User’s Guide for more information.
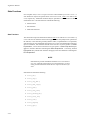
4. Insert calls at appropriate places in your application to initialize the NightTrace trace event logging library and terminate logging. This is necessary
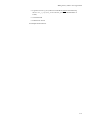
for resource allocation and deallocation, file creation, and flushing trace
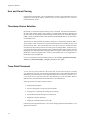
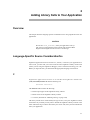
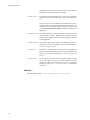
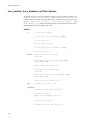
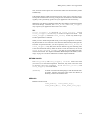
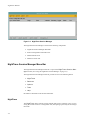
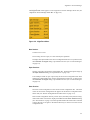
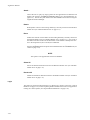
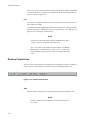
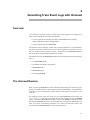
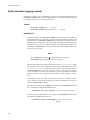
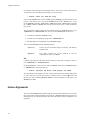
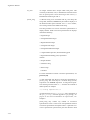
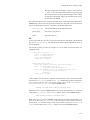
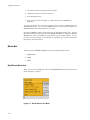
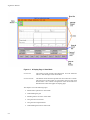
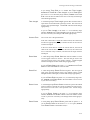
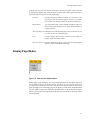
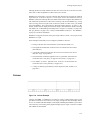
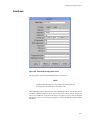
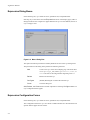
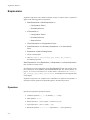
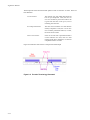
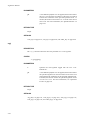
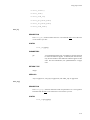
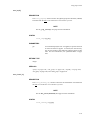
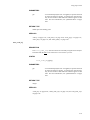
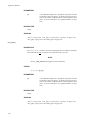
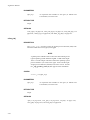
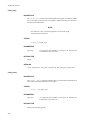
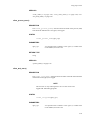
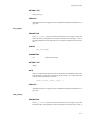
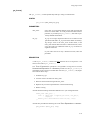
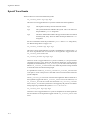
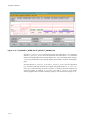
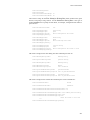
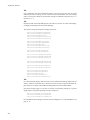
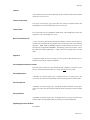
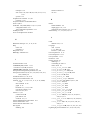
events to disk. Steps 3 and 4 are called instrumenting your code. Figure 1-1
shows instrumented C code.
#include <ntrace.h>
#define START 10
#define END
20
main()
{
trace_begin( "log", 0 );
trace_open_thread( "main_thread" );
trace_event( START );
process();
trace_event( END );
trace_close_thread();
trace_end();
exit( 0 );
}
Figure 1-1. Example of Instrumented C Code
5. Compile and link your application with the NightTrace trace event logging
library. For example:
$ cc main.c process.c -lntrace -lud # for PowerMAX
$ cc main.c process.c -lntrace -lccur_rt # for RedHawk
1-4
Introduction
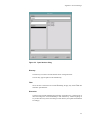
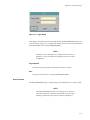
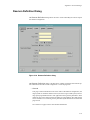
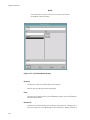
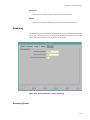
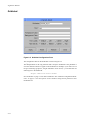
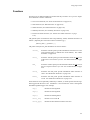
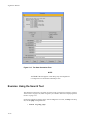
6. Start NightTrace and user the NightTrace Session Manager to define a deamon session used to capture user and/or kernel data. For example:
$ ntrace -mgr &
In the NightTrace Session Manager window, select the Daemon -> New
menu item which brings up a Daemons Definition dialog. Click on the
User Application radio button to define this as a user daemon. Click on
the Stream checkbox to ensure it is now unchecked. Enter the filename
passed to the trace_begin() routine in the text field for the Key File.
Click the OK button.
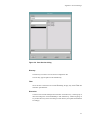
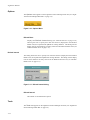
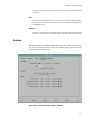
7. Start the user daemon by clicking on the Start button in the Session Manager window. Once the state for the daemon changes to Paused, click
the Resume button.
8. Run your application. As NightTrace trace event logging routines execute,
they write trace event information into a shared memory buffer. Periodically, the user daemon copies this information to a trace event file on disk.
For example:
$ a.out
9. When the application completes, or when you have captured sufficient data
that you now wish to analyze, stop the daemon in the session manager by
pressing the Flush button followed by the Stop button.
10. To display the data, press the Display button in the session manager.
The Kernel Trace Event Logging Procedure
1
Alternatively, to log and view kernel data, invoke the ntrace command and follow these
steps:
$ ntrace -mgr &
1. Define a kernel daemon in the NightTrace Session Manager window by
selecting the Daemon -> New menu item which brings up a Daemons
Definition dialog. Click on the Kernel radio button to define this as a
kernel daemon. Click on the St r e a m checkbox to ensure it is now
unchecked. Enter an output filename, such as /tmp/kernel-data in
the text field for Output File. Click the OK button.
2. Start the kernel daemon by clicking on the Start button in the NightTrace
Session Manager window. Once the state displayed in the session manager
for the daemon changes to Paused, click the Resume button.
3. Allow the daemon to capture data for a few seconds, then click on the
Flush button followed by the Stop button.
4. To display the kernel data, click on the Display button. This will cause a
default kernel page to pop up. Repeatedly click on the Zoom Out button
on that page until you see data in the display pane. Note: if any display
page is already open, clicking the Display button will not automatically
1-5
NightTrace Manual
create a kernel display page. In such a case, open a default kernel page
from the main NightTrace dialog.
The Trace Event Analysis Procedure
Figure 1-2. Example of a User Display Page with Display Objects
5. Iteratively locate and analyze significant data.
• Search for trace events of interest. You do this by controlling the
window that displays a portion of the trace event file. This window is
called the interval. You can control the interval by zooming in or out,
scrolling, searching for specific trace events, or jumping to portions
of the trace event file.
• Display summary information. This information may be about your
entire trace session or the characteristics of particular trace events
and states in this trace session.
1-6
1
Introduction
Recommended Reading
1
Referenced publications appear in the front of this manual. Related text books that are
useful resources for general background information follow.
X Window System User’s Guide
This text book by Valerie Quercia and Tim O’Reilly is published by O’Reilly &
Associates, Inc. It is available under publication number 0890300. This text book
introduces X terminology and concepts. It also discusses several popular window
managers, the xterm terminal emulator, X resources, and X desk accessories.
OSF/Motif Style Guide
This text book is published by Prentice-Hall, Inc. It and its companion books
OSF/Motif User’s Guide and OSF/Motif Programmer’s Guide are packaged together
under publication number 0890380. This text book introduces Motif terminology
and concepts. It also provides information about Motif features.
1-7
NightTrace Manual
1-8
2
Adding Library Calls to Your Application
Overview . . . . . . . . . . . . . . . . . . . . . . . . . . . . . . . . . . . . . . . . . . . . . . . . . . . . . . . . . .
Language-Specific Source Considerationfcs. . . . . . . . . . . . . . . . . . . . . . . . . . . . . . .
C.............................................................
Fortran . . . . . . . . . . . . . . . . . . . . . . . . . . . . . . . . . . . . . . . . . . . . . . . . . . . . . . . .
Ada . . . . . . . . . . . . . . . . . . . . . . . . . . . . . . . . . . . . . . . . . . . . . . . . . . . . . . . . . . .
Inter-Process Communication and Library Routines . . . . . . . . . . . . . . . . . . . . . . . .
Understanding NightTrace Library Calls . . . . . . . . . . . . . . . . . . . . . . . . . . . . . . . . .
trace_begin(). . . . . . . . . . . . . . . . . . . . . . . . . . . . . . . . . . . . . . . . . . . . . . . . . . . .
trace_open_thread() . . . . . . . . . . . . . . . . . . . . . . . . . . . . . . . . . . . . . . . . . . . . . .
trace_event() and Its Variants . . . . . . . . . . . . . . . . . . . . . . . . . . . . . . . . . . . . . . .
trace_enable(), trace_disable(), and Their Variants . . . . . . . . . . . . . . . . . . . . . .
trace_flush() and trace_trigger(). . . . . . . . . . . . . . . . . . . . . . . . . . . . . . . . . . . . .
trace_close_thread() . . . . . . . . . . . . . . . . . . . . . . . . . . . . . . . . . . . . . . . . . . . . . .
trace_end() . . . . . . . . . . . . . . . . . . . . . . . . . . . . . . . . . . . . . . . . . . . . . . . . . . . . .
Disabling Tracing . . . . . . . . . . . . . . . . . . . . . . . . . . . . . . . . . . . . . . . . . . . . . . . . . . .
Compiling and Linking . . . . . . . . . . . . . . . . . . . . . . . . . . . . . . . . . . . . . . . . . . . . . . .
C Example . . . . . . . . . . . . . . . . . . . . . . . . . . . . . . . . . . . . . . . . . . . . . . . . . . . . .
Fortran Example . . . . . . . . . . . . . . . . . . . . . . . . . . . . . . . . . . . . . . . . . . . . . . . . .
Ada Example . . . . . . . . . . . . . . . . . . . . . . . . . . . . . . . . . . . . . . . . . . . . . . . . . . .
Exercise: Instrumenting Code . . . . . . . . . . . . . . . . . . . . . . . . . . . . . . . . . . . . . . . . .
2-1
2-1
2-1
2-2
2-2
2-3
2-3
2-5
2-9
2-10
2-16
2-20
2-22
2-23
2-24
2-24
2-25
2-25
2-25
2-25
NightTrace Manual
2
Chapter 2Adding Library Calls to Your Application
2
2
2 fa
Overview
2
This chapter describes language-specific considerations for using NightTrace with user
applications.
CAUTION
Do not call clock_settime() from your application. This system call can corrupt both the system interval timer and Time Base
Register which NightTrace uses for trace event timings.
Language-Specific Source Considerationfcs
2
NightTrace applications must be written in C, Fortran, or Ada. For your applications to
trace events, you must edit your source code and insert NightTrace library routine calls
(unless you are using the NightView debugger). This is called instrumenting your code.
Before you begin this task, you should read the appropriate language section below.
C
2
N i g h t Tr a c e a p p l i ca t i o n s w r i t t e n i n C in cl u d e th e N i g h t Tr a c e h e a d e r f i l e
/usr/include/ntrace.h with the following line:
#include <ntrace.h>
The ntrace.h file contains the following:
• Function prototypes for all NightTrace library routines
• Return values for all NightTrace library routines
• C macros (described in “Disabling Tracing” on page 2-24)
The library routine return values identify the type of error, if any, the NightTrace routine
encountered. If you think you may want to disable the NightTrace library routines in the
future without having to remove them from your source code, then you must include this
file in your application.
2-1
NightTrace Manual
C programs that are multi-thread can also be traced with the NightTrace library routines.
For multi-thread programs, a C thread identifier is stored in each trace event, uniquely
identifying which C thread was running at the time the trace event was logged.
For more information on C, see C: A Reference Manual and the Concurrent C Reference
Manual.
Fortran
2
The Fortran version of the NightTrace library routines follow hf77 function-naming and
argument-passing conventions. For more information on hf77, see the hf77 Fortran
Reference Manual.
All NightTrace library routines return INTEGERS, but because they begin with a “t”,
Fortran implicitly types them as REAL. You must explicitly type them as INTEGER so that
they work correctly. For example, to explicitly type the trace_begin routine, use the
following declaration:
integer trace_begin
Ada
2
Ada applications can access the NightTrace library routines via the Ada package
night_trace_bindings which is included with the MAXAda product (currently
only available on PowerMAX OS systems). The bindings can be found in the bindings/general environment in the source file night_trace.a.
The night_trace_bindings package contains the following:
• An enumeration type consisting of the return values for all NightTrace
library routines
• The bindings that permit Ada applications to call the C routines in the
NightTrace library and to link in the NightTrace library
Many of the NightTrace functions have been overloaded as procedures. These procedures
act as the corresponding functions, except they discard any error return values.
Ada programs that use tasking can also be traced with the NightTrace library routines. For
multitasking programs, an Ada task identifier is stored in each trace event, uniquely
identifying which Ada task was running at the time the trace event was logged.
For more information on Ada, see the section titled “NightTrace Binding” in the MAXAda
Reference Manual.
2-2
Adding Library Calls to Your Application
Inter-Process Communication and Library Routines
2
Your application logs trace events to the shared memory buffer. Later, a user daemon copies trace events from the shared memory buffer to the trace event file. The relationship
between your application and the user daemon and the sequence of library calls needed to
maintain this relationship appears in Figure 2-1.
Understanding NightTrace Library Calls
2
There is a C, Fortran, and Ada version of each NightTrace library routine. These routines
perform the following functions:
• Initialize a trace
• Open the current thread for trace event logging
• Log trace events to shared memory
• Enable and disable specified trace events
• Copy trace events from shared memory to disk
• Close the current thread for trace event logging
• Terminate a trace
See the NightTrace Pocket Reference card for a syntax summary of these routines. The
next sections describe these routines in detail.
2-3
NightTrace Manual
Parent processes follow this sequence:
Child processes follow this sequence:
trace_begin()
trace_open_thread()
log trace events
trace_close_thread()
trace_end()
trace_open_thread()
log trace events
trace_close_thread()
Thread 1
Process A
Thread 2
Process B
Child of B
Shared
Memory
Buffer
Child of B
user
daemon
Task 1
Process C
Task 2
An application written in C can log trace events using:
trace_event()
trace_event_arg()
trace_event_flt()
trace_event_two_flt()
trace_event_dbl()
trace_event_two_dbl()
trace_event_four_arg()
and it can control which trace events are logged and when they are written to disk using:
trace_enable()
trace_enable_range()
trace_enable_all()
trace_disable()
trace_disable_range()
trace_disable_all()
trace_flush()
trace_trigger()
Figure 2-1. Inter-Process Communication and Library Routines
2-4
Trace Event
File
Adding Library Calls to Your Application
trace_begin()
2
The trace_begin() routine initializes the trace mechanism and acquires resources for
your process.
SYNTAX
C:
int trace_begin(char *key_file,
ntconfig_t * config);
Fortran:
integer function trace_begin(trace_file)
character *(*) trace_file
integer config(7)
Ada:
function trace_begin(
trace_file
:
string;
buffer_size
:
integer :=1024*16;
use_spl
:
boolean := true;
use_resched
:
boolean := false;
lock_pages
:
boolean := true;
clock
:
ntclock_t :=
NT_USE_ARCHITECTURE_CLOCK;
shmid_perm
:
integer := 8#666#;
inherit
:
boolean := true)
return ntrace_error;
PARAMETERS
key_file
the user daemon logs trace events to an output file, key_file. When
you invoke the user daemon, you must specify this file’s name. For
the user daemon to log your process’ trace events to this file, the
trace event file parameter in your trace_begin() call must correspond to the key file value on the daemon invocation. The names do
not have to exactly match textually, but they do have to refer to the
same actual pathname; for example, one path name may begin at
your current working directory and the other may begin at the root
directory.
config
For C and Fortran, either a NULL pointer, in which case the default
settings are used, or a pointer to a ntconfig_t structure. For Ada,
the individual members of the structure are supplied directly as
parameters to the routine, with appropriate default values. Both the
user application and the user daemon associated with it must agree
2-5
NightTrace Manual
on the configuration settings (or indicate that the other’s settings may
be preferred).
ntc_buffer_size
The size of the shared memory buffer in units of trace events. The
user daemon default size is 1024*16 events. The size must be greater
or equal to 4096.
ntc_use_spl
Specifies that SPL preemption-control will be used (see
spl_request(3C)). This feature is not available on RedHawk Linux
systems and is automatically translated to ntc_use_resched. The user
daemon default value is TRUE for PowerMAX OS and FALSE for
RedHawk Linux.
ntc_use_resched
Specifies that rescheduling variable preemption-control will be used
(See resched_cntl(2)). The user daemon default value is FALSE for
PowerMAX OS and TRUE for RedHawk Linux.
ntc_lock_pages
Specifies that critical pages will be locked in memory. The user daemon default value is TRUE.
ntc_clock
Specifies which clock to use as a timing source. This value must be
one
of
NT_USE_ARCHITECTURE_CLOCK
or
NT_USE_RCIM_TICK_CLOCK. The user daemon default value is
NT_USE_ARCHITECTURE_CLOCK.
ntc_shmid_perm
Specifies the permissions to use when creating the shared memory
segment. The user daemon default value is 0666.
ntc_daemon_preferred
Specifies that if a user daemon already exists and the configuration
settings differ from these configuration settings, that the user daemon
settings are preferred and these values are ignored (although the
value of ntc_buffer_size specified to this routine must not be larger
than the size set by the daemon).
DESCRIPTION
The trace_begin() routine performs the following operations:
• Verifies that the version of the NightTrace library linked with the
application is compatible with the version used by the user daemon if
it is already running
2-6
Adding Library Calls to Your Application
• Verifies the supplied configuration settings are not in conflict with a
pre-existing daemon or defines the configuration with these settings
if the user daemon does not yet exist.
• Verifies that the RCIM synchronized tick clock is counting if it was
selected as the timestamp source
• Attaches the shared memory buffer (after creating it if needed)
• Initialized the preemption control mechanism
• Locks critical NightTrace library routine pages in memory
• Initializes trace event tracing in this process
(PowerMAX Only) For more information on shared memory and the system’s interrupt priority level (IPL) register, see the PowerMAX OS Real-Time Guide. For information about page-locking privilege (P_PLOCK), see intro(2).
A process that results from the exec(2) system service does not inherit a trace
mechanism. Therefore, if that process is to log trace events, it must initialize the
trace with trace_begin(). Processes that result from a fork in a process that has
already initialized the trace need not call trace_begin().
The trace_begin() routine must be called only once per parent process (unless
a trace_end() call has been made).
For processes using C threads and PowerMAX OS Ada tasks, all threads and tasks
will inherit the trace context of the trace_begin() call that is made by any
thread or task of the process.
RETURN VALUES
Upon successful operation, the trace_begin() routine returns NTNOERROR or
NTLISTEN; the latter in the case where no daemon has yet been started. A list of
trace_begin() return codes follows.
[NTNOERROR]
A daemon has already been started that matches the filename
passed as key_file. The application can begin to log trace
events after calling trace_open_thread().
[NTLISTEN]
All operations where successful, but no user daemon matching
the filename passed as key_file could be found. The application
can continue to make NightTrace API calls but attempts to log
events will fail until a daemon is started, at which point logging of events will succeed.
[NTALREADY]
The application has already initialized the trace without an
intervening trace_end(). Tracing can continue in spite of
this error. Solution: Remove redundant trace_begin()
calls.
[NTBADVERSION] The calling application is linked with the static NightTrace
library and the static library is not compatible with the NightTrace library being used by the user daemon. Solution: Relink
2-7
NightTrace Manual
the application with the static library version which matches
the library version being used by the daemon.
[NTMAPCLOCK]
The selected event timestamp source could not be attached.
Solution: If read access is lacking, see your system administrator.
This can also occur if the RCIM synchronized tick clock is
selected as the event timestamp source but the tick clock is not
counting. Solution: Start the synchronized tick clock by using
the clock_synchronize(1M) command and restart the
application.
[NTPERMISSION] The calling application lacks permission to attach the shared
memory buffer. Solution: Make sure that the same user who
started the user daemon is the current user logging trace events
in the application.
[NTMAPSPLREG] The system’s IPL register could not be attached. Solution: If
read or write access is lacking, see your system administrator
or set ntc_use_spl to FALSE.
[NTPGLOCK]
Permission to lock the text and data pages of the NightTrace
library routines was denied. If the user is not privileged to lock
pages, see your system administrator or set ntc_lock_pages to
FALSE.
[NTNOSHMID]
This can occur if the size of the shared memory buffer exceeds
the system limit (SHMMAX) or the shared memory buffer
already exists but the size required by ntc_buffer_size (which is
roughly ntc_buffer_size * sizeof(ntevent_t)) exceeds the
current size.
SEE ALSO
Related routines include: trace_open_thread(), trace_end()
2-8
Adding Library Calls to Your Application
trace_open_thread()
2
The trace_open_thread() routine prepares the current process C thread or Ada task
for trace event logging.
SYNTAX
C:
int trace_open_thread(char *thread_name);
Fortran:
integer function trace_open_thread(thread_name)
character *(*) thread_name
Ada:
function trace_open_thread(
thread_name : string
)
return ntrace_error;
PARAMETERS
thread_name
In NightTrace every thread of execution to be traced (whether a separate process, or a C thread or Ada task within a process) must be
associated with a name, thread_name, which may be null. NightTrace’s graphical displays and textual summary information show
which threads logged trace events. If the trace_open_thread()
thread name is null, the ntrace display utility uses the global thread
identifier (TID) as a label in these displays. For more information on
global thread identifiers see “TID List” on page 8-8.
Naming your threads can make the displays much more readable.
trace_open_thread() lets you associate a meaningful character
string name with the current threads’ more cryptic numeric TID. If
you provide a character string as the thread name, the ntrace display utility uses it as a label in its displays. Because ntrace may be
unable to display long strings in the limited screen space available,
keep thread names short. (Long thread names cause NightTrace to
log an NT_CONTINUE overhead trace event.)
The following words are reserved in NightTrace and should not be
used in upper case or lower case as thread names: NONE, ALL,
ALLU SER, ALL KERNE L, TRUE, FAL SE, CALC . S ee
“Pre-Defined String Tables” on page 5-14 for more information
about thread names.
NOTE
Thread names must begin with an alphabetic character and consist
solely of alphanumeric characters and the underscore. Spaces and
punctuation are not valid characters.
2-9
NightTrace Manual
DESCRIPTION
A NightTrace “thread” can be a process, C thread or Ada task. For ntrace
displays, trace_open_thread() associates a thread name with the process,
thread or task logging trace events. Each process, including child processes, that
logs trace events must have its own trace_open_thread() call. In addition, C
threads and Ada tasks may call trace_open_thread() individually to associate
unique thread names with their trace events. In this way, the different trace contexts
of multiple processes, threads and tasks can be easily distinguished from each other.
For more information on threads, see “Programming with the Threads Library” in
the PowerMAX OS Programming Guide.
A process that results from the exec(2) system service does not inherit a trace
mechanism. Therefore, if that process is to log trace events, it must call both
trace_begin() and trace_open_thread().
RETURN VALUES
The trace_open_thread() routine returns a zero value (NTNOERROR) on
successful completion. Otherwise, it returns a non-zero value to identify the error
condition. A list of trace_open_thread() error codes follows.
[NTINIT]
The NightTrace library routines were not initialized or they
were initialized but no user daemon has yet been initiated.
Ensure a trace_begin() call precedes this call. If the preceding trace_begin() call returned NTLISTEN, then a
value of NTINIT is not a failure condition and once a user daemon is started, subsequent attempts at logging events will succeed.
[NTINVALID]
An invalid thread name was specified. Solution: Choose a
thread name that meets the requirements mentioned earlier.
[NTRESOURCE]
There are not enough resources to open this thread. Solution:
Ask your system administrator to increase the size of the process table.
[NTPGLOCK]
Permission to lock the text and data pages of the NightTrace
library routines was denied. If the user has insufficient privileges to lock pages, see the system administrator or specify that
page locking is not requested on the trace_begin() call
and/or with the user daemon invocation.
SEE ALSO
Related routines include: trace_begin(), trace_close_thread().
trace_event() and Its Variants
2
The following routines log an enabled trace event and possibly some arguments to the
shared memory buffer.
2-10
Adding Library Calls to Your Application
SYNTAX
C:
int trace_event (int ID);
int trace_event_arg (int ID, long arg);
int trace_event_flt (int ID, float arg);
int trace_event_two_flt (int ID, float arg1, float arg2);
int trace_event_dbl (int ID, double arg);
int trace_event_two_dbl (int ID, double arg1, double arg2);
int trace_event_four_arg (
int ID, long arg1, long arg2,
long arg3, long arg4
);
Fortran:
integer function trace_event (ID)
integer ID
integer function trace_event_arg (ID, arg)
integer ID, arg
integer function trace_event_flt (ID, arg)
integer ID
real arg
integer function trace_event_two_flt (ID, arg1, arg2)
integer ID
real arg1, arg2
integer function trace_event_dbl (ID, arg)
integer ID
double precision arg
integer function trace_event_two_dbl (ID, arg1, arg2)
integer ID
double precision arg1, arg2
integer function trace_event_four_arg (ID, arg1, arg2, arg3, arg4)
integer ID, arg1, arg2, arg3, arg4
Ada:
type event_type is range 0.4095;
(procedures)
procedure trace_event (ID : event_type);
procedure trace_event (ID : event_type; arg : integer);
procedure trace_event (ID : event_type; arg : float);
2-11
NightTrace Manual
procedure trace_event (
ID : event_type;
arg1 : float; arg2 : float
);
procedure trace_event (ID : event_type; arg : long_float);
procedure trace_event (
ID : event_type;
arg1 : long_float; arg2 : long_float
);
procedure trace_event (
ID : event_type;
arg1 : integer; arg2 : integer;
arg3 : integer; arg4 : integer
);
(functions)
function trace_event (ID : event_type)
return ntrace_error;
function trace_event (ID : event_type; arg : integer)
return ntrace_error;
function trace_event (ID : event_type; arg : float)
return ntrace_error;
function trace_event (
ID : event_type;
arg1 : float; arg2 : float
)
return ntrace_error;
function trace_event (ID : event_type; arg : long_float)
return ntrace_error;
function trace_event (
ID : event_type;
arg1 : long_float; arg2 : long_float
)
return ntrace_error;
2-12
Adding Library Calls to Your Application
function trace_event (
ID
: event_type;
arg1 : integer; arg2 : integer;
arg3 : integer; arg4 : integer
)
return ntrace_error;
PARAMETERS
ID
Each trace event has a user-defined trace event ID, ID. This ID is a
valid integer in the range reserved for user trace events (0-4095,
inclusive). See “Pre-Defined String Tables” on page 5-14 for more
information about trace event IDs.
argN
Sometimes it is useful to log the current value of a variable or
expression, arg, along with your trace event. The trace event logging
routines provide this capability. They differ by how many and what
types of numeric arguments they accept. The trace_event() routine takes no args. The trace_event_arg() routine takes a type
long
a r g.
The
trace_event_flt()
and
trace_event_two_flt routines take (floating point) type of
float
a rgs .
The
trace_event_dbl()
and
trace_event_two_dbl() routines take (floating point) type
double args. The trace_event_four_arg() routine takes four
type long args. If you want the ntrace display utility to display
these trace event arguments in anything but decimal integer format,
you can enter the trace event in an event-map file. See “Understanding Event-Map Files” on page 5-9 for more information on
event-map files and formats. Alternatively, you could call the format() function. See “format()” on page 9-80 for details.
Every call to trace_event_four_arg() causes NightTrace to
log an NT_CONTINUE overhead trace event.
DESCRIPTION
A trace point is a place in your application’s source code where you call a trace
event logging routine. Usually this location marks a line that is important to debugging or performance analysis. Ideally, trace events provide enough information to be
useful, but not so much information that it is overwhelming. Meeting these goals
requires careful trace-point planning.
TIP:
To save time re-editing, recompiling, and relinking your application, consider
beginning with a few too many trace points in the source code. You can dynamically
enable or disable specific trace events. You can also save time by using ntrace
options to restrict which trace events are loaded for analysis. See “ntrace Options”
on page 5-3 for details.
Some typical trace points include the following:
• Suspected bug locations
• Process, subprogram, or loop entry and exit points
2-13
NightTrace Manual
• Timing points, especially for clocking I/O processing
• Synchronization points / multi-process interaction
• Endpoints of atomic operations
• Endpoints of shared memory access code
Call one trace event logging routine at each of the trace points you have selected.
When you call this routine, it writes the trace event information (including timings
and any arguments) to a shared memory buffer. By default, if this write fills the
shared memory buffer or causes the buffer-full cutoff percentage to be reached, the
user daemon wakes up and copies the trace event to the trace event file on disk.
Usually each trace event logging routine logs a different trace event ID number. This
lets you easily identify which source line logged the trace event, how often that
source line executed, and what order source lines executed in. However, it is sometimes useful to log the same trace event ID in multiple places. This makes it possible
to group trace events from related, but not identical, activities. In this case, a change
of trace event ID usually separates or subdivides groups.
Probably the most common use of trace events is to identify states. Two different
trace event IDs delimit the boundaries of a state. Most applications log recurring
states with different time gaps (from the end of one instance of a state to the start of
another) and different state durations (from the start of one instance of a state to its
end).
TIP:
Consider putting related trace event IDs within a range. Library routines and user
daemon options let you manipulate trace events by using trace event ID ranges.
By default, all trace events are enabled for logging. The NightTrace library contains
routines that allow you to selectively or globally enable or disable trace events. The
user daemon has options that provide similar control. Attempting to log a disabled
trace event has no effect. See “trace_enable(), trace_disable(), and Their Variants”
on page 2-16 for more information.
TIP:
Consider using symbolic constants instead of numeric trace event IDs. This would
make your calls to NightTrace routines more readable.
Once your application logs all of its trace events, you can look at them and their
arguments graphically with StateGraphs, EventGraphs, and DataGraphs in the
ntrace display utility. See “StateGraph” on page 7-14, “EventGraph” on page
7-15, and “DataGraph” on page 7-16 for more information about these display
objects.
RETURN VALUES
The trace_event(), trace_event_arg(), trace_event_dbl(), and
trace_event_four_arg() routines return a zero value (NTNOERROR) on
successful completion. Otherwise, they return a non-zero value to identify the error
condition. A list of error codes for these routines follows.
2-14
Adding Library Calls to Your Application
[NTINVALID]
An invalid trace event ID has been supplied. Solution: Use
trace event IDs only in the range 0-4095, inclusive.
[NTINIT]
The NightTrace library routines were not initialized or they
were initialized but no user daemon has yet been initiated.
Ensure a trace_begin() and trace_open_thread()
call precede the trace event logging routine call. Once a user
daemon is started, subsequent attempts at logging events will
succeed.
[NTLOSTDATA]
The trace event was lost because the shared memory buffer
was full. This can occur if the user daemon cannot empty the
shared memory buffer quickly enough. Increase the priority of
the user daemon and/or schedule it on a CPU with less activity.
Additionally, the size of the shared memory buffer can be
increased.
SEE ALSO
Related routines include:
trace_flush(), trace_trigger(),
trace_enable(), trace_enable_range(),
trace_enable_all(), trace_disable(),
trace_disable_range(), trace_disable_all()
2-15
NightTrace Manual
trace_enable(), trace_disable(), and Their Variants
2
By default, all trace events are enabled for logging to the shared memory buffer. The
trace_disable(), trace_disable_range(), and trace_disable_all()
routines respectively make your application ignore requests to log one or more trace
ev ents.
The trace_enable(), trace_enable_range(), a nd
trace_enable_all() routines respectively make your application notice previously
disabled requests to log one or more trace events.
SYNTAX
C:
int trace_enable (int ID);
int trace_enable_range (int ID_low, int ID_high);
int trace_enable_all ();
int trace_disable (int ID);
int trace_disable_range (int ID_low, int ID_high);
int trace_disable_all ();
Fortran:
integer function trace_enable (ID)
integer ID
integer function trace_enable_range (ID_low, ID_high)
integer ID_low, ID_high
integer function trace_enable_all ()
integer function trace_disable (ID)
integer ID
integer function trace_disable_range (ID_low, ID_high)
integer ID_low, ID_high
integer function trace_disable_all ()
Ada:
type event_type is range 0..4095;
(procedures)
procedure trace_enable (ID : event_type);
procedure trace_enable (
ID_low : event_type; ID_high : event_type
);
procedure trace_enable_all;
procedure trace_disable (ID : event_type);
2-16
Adding Library Calls to Your Application
procedure trace_disable (
D_low : event_type; ID_high : event_type
);
procedure trace_disable_all;
(functions)
function trace_enable (ID : event_type)
return ntrace_error;
function trace_enable (
ID_low : event_type; ID_high : event_type
)
return ntrace_error;
function trace_enable_all
return ntrace_error;
function trace_disable (ID : event_type)
return ntrace_error;
function trace_disable (
ID_low : event_type; ID_high : event_type
)
return ntrace_error;
function trace_disable_all
return ntrace_error;
PARAMETERS
ID
Each trace event has a user-defined trace event ID, ID. This ID is a
valid integer in the range reserved for user trace event IDs (0-4095,
inclusive). See “trace_event() and Its Variants” on page 2-10 for
more information.
ID_low
It is possible to manipulate groups of trace event IDs by specifying a
range of trace event IDs. ID_low is the smallest trace event ID in the
range.
ID_high
It is possible to manipulate groups of trace event IDs by specifying a
range of trace event IDs. ID_high is the largest trace event ID in the
range.
DESCRIPTION
The enable and disable library routines allow you to select which trace events are
enabled and which are disabled for logging. A discussion of disabling trace events
appears first because initially all trace events are enabled.
Sometimes, so many trace events that it is hard to understand the ntrace display.
Occasionally you know that a particular trace event or trace event range is not interesting at certain times but is interesting at others. When either of these conditions
exist, it is useful to disable the extraneous trace events. You can disable trace events
2-17
NightTrace Manual
temporarily, where you disable and later re-enable them. You can also disable them
permanently, where you disable them at the beginning of the process or at a later
point and never re-enable them.
NOTE
These routines enable and disable trace events in all processes that
rely on the same user daemon to log to the same trace event file.
All disable library routines make your application start ignoring requests to log trace
event(s) to the shared memory buffer. The disable routines differ by how many
trace events they disable. trace_disable() disables one trace event ID.
trace_disable_range() disables a range of trace event IDs, including both
range endpoints. trace_disable_all() disables all trace events. Disabling an
already disabled trace event has no effect.
All enable library routines let you re-enable a trace event that you disabled with a
disable library routine or user daemon. The effect is that your application resumes
noticing requests to log the specified trace event to the shared memory buffer. The
enable routines differ by how many trace events they enable. trace_enable()
enables one trace event ID. trace_enable_range() enables a range of trace
event IDs, including both range endpoints. trace_enable_all() enables all
trace events. Enabling an already enabled trace event has no effect.
TIP:
Consider invoking the user daemon with events disabled instead of calling the
trace_enable() and trace_disable() routines. Using these options saves
you from re-editing, recompiling and relinking your application.
TIP:
If you want to log only a few of your trace events, disable all trace events with
trace_disable_all() and then selectively enable the trace events of interest .
RETURN VALUES
The
trace_disable(),
trace_disable_range(),
trace_disable_all(), trace_enable(), trace_enable_range(),
and trace_enable_all() routines return a zero value (NTNOERROR) on successful completion. Otherwise, they return a non-zero value to identify the error
condition. A list of error codes for these routines follows.
2-18
[NTINIT]
The NightTrace library routines were not initialized. Solution:
Be sure a trace_begin() and trace_open_thread()
call precede the call to the disable or enable routine.
[NTINVALID]
An invalid trace event ID has been supplied. Solution: Use
trace event IDs only in the range 0-4095, inclusive.
Adding Library Calls to Your Application
SEE ALSO
Related routines include:
trace_event(), trace_event_arg(),
trace_event_dbl(), trace_event_four_arg()
2-19
NightTrace Manual
trace_flush() and trace_trigger()
2
The trace_flush() and trace_trigger() routines asynchronously wake the user
and direct it to copy trace events from the shared memory buffer to the trace event file on
disk. Note: These routines do not wait for the copy to complete.
SYNTAX
C:
int trace_flush();
int trace_trigger();
Fortran:
integer function trace_flush()
integer function trace_trigger()
Ada:
(procedures)
procedure trace_flush;
procedure trace_trigger;
(functions)
function trace_flush
return ntrace_error;
function trace_trigger
return ntrace_error;
DESCRIPTION
When the user daemon is idle, it sleeps. The process of copying trace events from
the shared memory buffer to a trace event file is called flushing the buffer. The user
daemon wakes up and flushes the buffer when any of these conditions exist:
• the user daemon’s sleep interval elapses
• The buffer-full cutoff percentage is exceeded
• The shared memory buffer is full of unwritten trace events
• Your application calls trace_flush(), trace_trigger(), or
trace_end()
• No event has been logged in a period of time in which the lower 32
bits of the timestamp source would roll over. It is important to detect
this rollover so that proper ordering of trace events is maintained.
User daemon options let you set limits for the first three conditions above. When
you invoke a user daemon with one of these options and it detects the corresponding
condition, it automatically flushes the buffer. There is one key way that
trace_flush() and trace_trigger() differ from the flush control the user
daemon provides: with trace_flush() and trace_trigger() you decide
when to asynchronously flush the shared memory buffer based on your program
2-20
Adding Library Calls to Your Application
flow, and with certain options the user daemon flushes the shared memory buffer
automatically.
If the shared memory buffer becomes full of trace events, trace events may be lost.
To keep this situation from occurring, configure the user daemon to flush the buffer
regularly. This is particularly good to do if your application will soon be busy.
Waking the user daemon to flush the buffer takes time and this overhead can distort
trace event timings. Therefore, call trace_flush() and trace_trigger()
only in parts of your application where time is not critical.
TIP:
trace_trigger() is identical to trace_flush(), e xc ept
t ra c e _ t r ig g e r ( ) w o r k s o n l y i n b u ff e r- w r a p a r o u n d m o d e . C a l l
trace_trigger() instead of trace_flush() so that only buffer-wraparound’s performance is affected.
When you run in buffer-wraparound mode, you are telling NightTrace to intentionally discard older or less-vital trace events when the shared memory buffer gets full.
In buffer-wraparound mode, you must explicitly call trace_flush() or
trace_trigger(). Only then, does the user daemon copy the remaining trace
events from the shared memory buffer to the trace event file. However, do not call
trace_flush() or trace_trigger() too often or you will reduce the effectiveness of this mode. See “Option to Establish Buffer-Wraparound Mode (-bufferwrap)” on page 4-13 for more information on buffer-wraparound mode.
RETURN VALUES
The trace_flush() and trace_trigger() routines return a zero value
(NTNOERROR) on successful completion. Otherwise, they return a non-zero value
to identify the error condition. A list of trace_flush() a nd
trace_trigger() error codes follows.
[NTFLUSH]
A failure occurred while attempting to flush the shared memory buffer. Solution: Verify the status of the user daemon; if
necessary, restart it and rerun the trace.
SEE ALSO
Related routines include:
trace_event(), trace_event_arg(),
trace_event_dbl(), trace_event_four_arg()
2-21
NightTrace Manual
trace_close_thread()
2
The trace_close_thread() routine disables trace event logging for the current
thread or process.
SYNTAX
C:
int trace_close_thread();
Fortran:
integer function trace_close_thread()
Ada:
function trace_close_thread return
ntrace_error;
DESCRIPTION
A NightTrace thread can be a process, C thread or Ada task. Each thread that C calls
trace_open_thread() must have its own trace_close_thread() call.
For more information on threads, see “Programming with the Threads Library” in
the PowerMAX OS Programming Guide.
RETURN VALUES
The trace_close_thread() routine returns a zero value (NTNOERROR) on
successful completion. Otherwise, it returns a non-zero value to identify the error
condition. A list of trace_close_thread() error codes follows.
[NTINIT]
The NightTrace library routines were not initialized. Solution:
Call trace_close_thread() only once if you previously
called trace_open_thread().
SEE ALSO
Related routines include:trace_open_thread(), trace_end()
2-22
Adding Library Calls to Your Application
trace_end()
2
The trace_end() routine frees resources and terminates trace event tracing in your process.
SYNTAX
C:
int trace_end();
Fortran:
integer function trace_end()
Ada:
function trace_end
return ntrace_error;
DESCRIPTION
Generally, call trace_end() only once per logging process.However, for
processes using C threads or Ada tasks, trace_end() must also be called by
any individual threads or tasks that have previously called trace_begin().
trace_end() performs the following operations:
• Terminates trace event tracing in this process or thread
• Flushes trace events from the shared memory buffer to the trace
event file
• Detaches the shared memory buffer, timestamp source, and interrupt
priority level (IPL) register
• Notifies the user daemon that the current process has finished logging trace events
RETURN VALUES
The trace_end() routine returns a zero value (NTNOERROR) on successful
completion. Otherwise, it returns a non-zero value to identify the error condition. A
list of trace_end() error codes follows.
[NTFLUSH]
A failure occurred while attempting to flush the shared memory buffer. Solution: Verify the status of the user daemon; if
necessary, restart it and rerun the trace.
[NTNODAEMON]
There is no user daemon with a trace event file name that
matches the one on the trace_begin() call attached to the
shared memory region. This condition is not always detectable. Solution: Use the ntrace display utility to analyze
your logged trace events.
SEE ALSO
Related routines include:trace_begin(), trace_close_thread()
2-23
NightTrace Manual
Disabling Tracing
2
There are four ways to disable tracing in your application:
• For C applications, put a #include <ntrace.h> in your source code.
You must either recompile your application with the -DNNTRACE
preprocessor option or insert the following preprocessor control statement
before the #include <ntrace.h>.
#define NNTRACE
The NightTrace header file, ntrace.h, contains macro counterparts for each
NightTrace library routine. When you define NNTRACE, the compiler treats your
NightTrace routine calls as if they were macro calls that always return a success
(zero) status. For more information on preprocessor options, see cpp(1).
Use a command similar to the following one to turn off tracing in your application,
fl_sim.c.
$ cc -DNNTRACE fl_sim.c -lud
By disabling tracing this way, you have to rebuild your application, but you save
compilation and execution time.
• Call the trace_disable_all() routine near the top of the source,
recompile, and relink your application with the NightTrace library. (For
more information about this routine, see “trace_enable(), trace_disable(),
and Their Variants” on page 2-16.) If your application calls any of the
enable routines, this method is not entirely effective.
By disabling tracing this way, you have to rebuild your application, and there is no
saving in compilation time or execution time.
• Start a user daemon with all events disabled.
By disabling tracing this way, you do not have to rebuild your application, but there
is no saving in compilation time or execution time.
• Do not start a user daemon.
By disabling tracing this way, you do not have to rebuild your application, but there
is no saving in compilation or execution time.
Compiling and Linking
2
You must link in the NightTrace library so that your application can initialize its trace
mechanism and log trace events. The name of this library depends on your source
language. C and Fortran applications must link in the /usr/lib/libntrace.a
library.
2-24
Adding Library Calls to Your Application
C Example
2
$ cc fl_sim.c -lntrace -lud # for PowerMAX OS
$ cc fl_sim.c -lntrace -lccur_rt # for RedHawk Linux
This step:
• Compiles the fl_sim.c application
• Links in the NightTrace library
• Creates an executable named a.out if there were no major errors
For more information on compiling and linking C programs, see the Concurrent C
Reference Manual.
Fortran Example
2
$ hf77 turn_matrix.f -lntrace -lud # for PowerMAX OS
$ hf77 turn_matrix.f -lntrace -lccur_rt # for RedHawk
Linux
This step:
• Compiles the turn_matrix.f application
• Links in the NightTrace library
• Creates an executable named a.out if there were no major errors
For more information on compiling and linking hf77 programs, see the hf77 Fortran
Reference Manual.
Ada Example
2
For a complete example on accessing the NightTrace library routines from an Ada application, see the section titled “NightTrace Binding” in the MAXAda Reference Manual.
Exercise: Instrumenting Code
2
Putting library calls in your application is called instrumenting your code. The following
application is in /usr/lib/NightTrace/examples/entry_exit.c.
2-25
NightTrace Manual
#include <sys/types.h>
#include <time.h>
#include <stdio.h>
void take_a_nap( sleep_str )
struct timespec sleep_str;
{
printf( "Sleeping for %.3f
seconds\n”,
(float) sleep_str.tv_nsec /
1e+09 );
nanosleep( &sleep_str, NULL );
/* make the spacing between states
obvious */
sleep_str.tv_nsec = 30000000;
nanosleep( &sleep_str, NULL );
}
main()
{
int i;
struct timespec sleep_str;
for( i=0; i<10; ++i )
{
sleep_str.tv_nsec = ( rand() %
1000 ) * 1000000;
take_a_nap( sleep_str );
}
exit( 0 );
}
Figure 2-2. entry_exit.c Before Instrumentation
Make a copy of this file in your directory, and call it entry_exit.c. Make the
following changes by inserting trace event library calls at appropriate places in the
application:
• Start the trace session and log trace events to a file named log
• Open a thread named timings
• Log trace event NAP_START (with trace event ID 10) and the (type long)
number of nanoseconds to sleep (sleep_str.tv_nsec) before the first
nanosleep call in take_a_nap
2-26
Adding Library Calls to Your Application
• Log trace event NAP_END (with trace event ID 20) after the first nanosleep
call in take_a_nap. (NAP_START and NAP_END form the boundaries of
a state.)
• Close the thread
• End the trace session
An example solution follows.
2-27
NightTrace Manual
/* For brevity, no return values are
checked */
#include
#include
#include
#include
<ntrace.h>
<sys/types.h>
<time.h>
<stdio.h>
#define NAP_START 10
#define NAP_END
20
void take_a_nap( sleep_str )
struct timespec sleep_str;
{
/* NAP_START & NAP_END are the
boundaries of a state */
trace_event_arg( NAP_START,
sleep_str.tv_nsec );
printf( "Sleeping for %.3f
seconds\n”,
(float) sleep_str.tv_nsec / 1e+09
);
nanosleep( &sleep_str, NULL );
trace_event( NAP_END );
/* make the spacing between states
obvious */
sleep_str.tv_nsec = 30000000;
nanosleep( &sleep_str, NULL );
}
main()
{
int i;
struct timespec sleep_str;
trace_begin( "log” );
trace_open_thread( "timings” );
for( i=0; i<10; ++i )
{
sleep_str.tv_nsec = ( rand() %
1000 ) * 1000000;
take_a_nap( sleep_str );
}
trace_close_thread();
trace_end();
exit( 0 );
}
2-28
Adding Library Calls to Your Application
Figure 2-3. entry_exit.c After Instrumentation
This exercise continues in “Exercise: Logging Trace Events” on page 4-29.
2-29
NightTrace Manual
2-30
3
NightTrace Session Manager
Using the NightTrace Session Manager . . . . . . . . . . . . . . . . . . . . . . . . . . . . . . . . . .
NightTrace Session Manager Menu Bar . . . . . . . . . . . . . . . . . . . . . . . . . . . . . .
NightTrace. . . . . . . . . . . . . . . . . . . . . . . . . . . . . . . . . . . . . . . . . . . . . . . . . .
Open Session . . . . . . . . . . . . . . . . . . . . . . . . . . . . . . . . . . . . . . . . . . . .
Save Session. . . . . . . . . . . . . . . . . . . . . . . . . . . . . . . . . . . . . . . . . . . . .
Unsaved Changes. . . . . . . . . . . . . . . . . . . . . . . . . . . . . . . . . . . . . . . . .
Daemons . . . . . . . . . . . . . . . . . . . . . . . . . . . . . . . . . . . . . . . . . . . . . . . . . . .
Login . . . . . . . . . . . . . . . . . . . . . . . . . . . . . . . . . . . . . . . . . . . . . . . . . .
Enter Password. . . . . . . . . . . . . . . . . . . . . . . . . . . . . . . . . . . . . . . . . . .
Attach Daemons . . . . . . . . . . . . . . . . . . . . . . . . . . . . . . . . . . . . . . . . . .
Options . . . . . . . . . . . . . . . . . . . . . . . . . . . . . . . . . . . . . . . . . . . . . . . . . . . .
Refresh Interval . . . . . . . . . . . . . . . . . . . . . . . . . . . . . . . . . . . . . . . . . .
Tools . . . . . . . . . . . . . . . . . . . . . . . . . . . . . . . . . . . . . . . . . . . . . . . . . . . . . .
Help . . . . . . . . . . . . . . . . . . . . . . . . . . . . . . . . . . . . . . . . . . . . . . . . . . . . . . .
Session Configuration File Name Area . . . . . . . . . . . . . . . . . . . . . . . . . . . . . . .
Daemon Details Area . . . . . . . . . . . . . . . . . . . . . . . . . . . . . . . . . . . . . . . . . . . . .
Daemon Control Area. . . . . . . . . . . . . . . . . . . . . . . . . . . . . . . . . . . . . . . . . . . . .
Enable / Disable Trace Events. . . . . . . . . . . . . . . . . . . . . . . . . . . . . . . . . . .
Daemon Definition Dialog . . . . . . . . . . . . . . . . . . . . . . . . . . . . . . . . . . . . . . . . . . . .
Import Daemon Definition . . . . . . . . . . . . . . . . . . . . . . . . . . . . . . . . . . . . . . . . .
General . . . . . . . . . . . . . . . . . . . . . . . . . . . . . . . . . . . . . . . . . . . . . . . . . . . . . . . .
Target. . . . . . . . . . . . . . . . . . . . . . . . . . . . . . . . . . . . . . . . . . . . . . . . . . . . . .
Trace Events Output . . . . . . . . . . . . . . . . . . . . . . . . . . . . . . . . . . . . . . . . . .
User Trace. . . . . . . . . . . . . . . . . . . . . . . . . . . . . . . . . . . . . . . . . . . . . . . . . . . . . .
Locking Policies . . . . . . . . . . . . . . . . . . . . . . . . . . . . . . . . . . . . . . . . . . . . .
Shared Memory . . . . . . . . . . . . . . . . . . . . . . . . . . . . . . . . . . . . . . . . . . . . . .
Timestamp Heartbeat . . . . . . . . . . . . . . . . . . . . . . . . . . . . . . . . . . . . . . . . .
User Event Buffer . . . . . . . . . . . . . . . . . . . . . . . . . . . . . . . . . . . . . . . . . . . .
Events . . . . . . . . . . . . . . . . . . . . . . . . . . . . . . . . . . . . . . . . . . . . . . . . . . . . . . . . .
Load Event Names . . . . . . . . . . . . . . . . . . . . . . . . . . . . . . . . . . . . . . . . . . .
Runtime . . . . . . . . . . . . . . . . . . . . . . . . . . . . . . . . . . . . . . . . . . . . . . . . . . . . . . .
Scheduling . . . . . . . . . . . . . . . . . . . . . . . . . . . . . . . . . . . . . . . . . . . . . . . . . .
CPU Bias . . . . . . . . . . . . . . . . . . . . . . . . . . . . . . . . . . . . . . . . . . . . . . . . . . .
NUMA. . . . . . . . . . . . . . . . . . . . . . . . . . . . . . . . . . . . . . . . . . . . . . . . . . . . .
Policies . . . . . . . . . . . . . . . . . . . . . . . . . . . . . . . . . . . . . . . . . . . . . . . . .
Streaming . . . . . . . . . . . . . . . . . . . . . . . . . . . . . . . . . . . . . . . . . . . . . . . . . . . . . .
Streaming Options. . . . . . . . . . . . . . . . . . . . . . . . . . . . . . . . . . . . . . . . . . . .
3-1
3-2
3-2
3-4
3-6
3-8
3-9
3-10
3-11
3-12
3-14
3-14
3-14
3-16
3-17
3-17
3-20
3-22
3-25
3-27
3-28
3-29
3-31
3-33
3-34
3-36
3-36
3-37
3-37
3-39
3-41
3-42
3-43
3-43
3-44
3-45
3-45
NightTrace Manual
3
Chapter 3NightTrace Session Manager
3
3
3
The NightTrace Session Manager allows users to manage user and kernel NightTrace daemons. It provides users with the ability to define a session consisting of one or more daemon definitions which can be saved for future use. These definitions include daemon collection modes and settings, daemon priorities and CPU bindings, and data output formats,
as well as the trace event types that are logged by that particular daemon.
Using the NightTrace Session Manager, users can manage multiple daemons simultaneously on multiple target systems from a central location.
The NightTrace Session Manager offers the user the ability to start, stop, pause, and
resume execution of any of the daemons under its management. The user may also view
statistics as trace data is being gathered as well as dynamically enable and disable events
while a particular daemon is executing.
In addition to sending trace output to a file for later analysis, the NightTrace Session Manager also offers a streaming output method. When streaming, trace output is sent directly
to the NightTrace display buffer for immediate analysis even while additional trace data is
being collected.
Using the NightTrace Session Manager
3
The NightTrace Session Manager provides users with the ability to define a session that
can be saved for future use.
A session is simply a collection of one or more daemon definitions.
Individual daemons within a session may or may not be related to each other in any meaningful way. One might use a session simply to hold several daemon definitions that are
commonly used, but not necessarily all at the same time.
When creating and saving sessions, only the daemon definitions are being created or
saved, not the trace data that may be captured using the daemons.
3-1
NightTrace Manual
Figure 3-1. NightTrace Session Manager
The NightTrace Session Manager consists of the following components:
• NightTrace Session Manager Menu Bar
• Session Configuration File Name Area
• Daemon Details Area
• Daemon Control Area
NightTrace Session Manager Menu Bar
3
The NightTrace Session Manager menu bar is a part of the NightTrace Session Manager window (see “Using the NightTrace Session Manager” on page 3-1).
The NightTrace Session Manager menu bar provides access to the following menus:
• NightTrace
• Daemons
• Options
• Tools
• Help
Each menu is described in the sections that follow.
NightTrace
3
The NightTrace menu contains session-related items such as initiating a new session,
saving the current session to a configuration file, and opening a previously-saved configuration file.
3-2
NightTrace Session Manager
The N ig h tTra ce menu appears on the NightTrace Session Manager menu bar (see
“NightTrace Session Manager Menu Bar” on page 3-2).
Figure 3-2. NightTrace Menu
New Session
Creates a new session.
If an existing session is open, it is first closed by this operation.
If changes have been made to the current configuration but have not yet been saved,
the Unsaved Changes dialog is presented to the user (see “Unsaved Changes”
on page 3-8).
Open Session...
Opens a previously-saved session configuration file. Selecting this option brings up
the Open Session dialog (see “Open Session” on page 3-4).
If an attempt is made to open a previously-saved session configuration file when
changes have been made to the current configuration but have not yet been saved,
the Unsaved Changes dialog is presented to the user (see “Unsaved Changes”
on page 3-8).
Save Session
Saves the current configuration to the current session configuration file. The name
of the current session configuration file appears in the Session Configuration File
Name Area (see “Session Configuration File Name Area” on page 3-17).
If the current configuration has not yet been saved, the name in the Session Configuration File Name Area will be displayed as New and the Save Session dialog
(see “Save Session” on page 3-6) will be presented when this menu item is selected
to allow the user to navigate to the desired directory in which to save the session
configuration file.
3-3
NightTrace Manual
Save Session As...
Displays the Save Session dialog (see “Save Session” on page 3-6) allowing the
user to navigate to the desired directory in which to save the session configuration
file. The name of this file will then appear in the Session Configuration File Name
Area (see “Session Configuration File Name Area” on page 3-17).
Close Session
Closes the current session but leaves the NightTrace Session Manager open.
If changes have been made to the current configuration but have not yet been saved,
the Unsaved Changes dialog is presented to the user (see “Unsaved Changes”
on page 3-8).
Close Window
Closes the NightTrace Session Manager but leaves NightTrace open.
If changes have been made to the current configuration but have not yet been saved,
the Unsaved Changes dialog is presented to the user (see “Unsaved Changes”
on page 3-8).
Exit
Closes the NightTrace Session Manager and exits NightTrace completely.
If changes have been made to the current configuration but have not yet been saved,
the Unsaved Changes dialog is presented to the user (see “Unsaved Changes”
on page 3-8).
Open Session
3
The Open Session dialog is a standard file selection dialog that allows the user to navigate to the desired directory and select a previously-saved session configuration file to
open.
NOTE
Filenames are relative to the host system (the system where the
NightTrace GUI is running).
3-4
NightTrace Session Manager
Figure 3-3. Open Session dialog
Directory
The directory in which to find the desired session configuration file.
The user may type the path into this field directly.
Filter
Of all the files contained in the current Directory, display only those Files that
match the specified filter.
Directories
Contains a list of all the subdirectories within the current directory. Selecting any of
these will change the current Directory to that subdirectory. Double-clicking on
any of these directory names will change to that directory and update the Files list
accordingly.
3-5
NightTrace Manual
Files
Within the current Directory, this is a list of the files that match the specified Filter. Any of these filenames can be selected. When selected, the filename appears in
the Selection field.
Selection
The name of the desired session configuration file appears here after being selected
from the Files list. The filename may be manually entered into this field by the
user as well.
Save Session
3
The Save Session dialog is a standard file selection dialog that allows the user to navigate to the desired directory and specify the name of the file to which the session configuration will be saved.
NOTE
Filenames are relative to the host system (the system where the
NightTrace GUI is running).
3-6
NightTrace Session Manager
Figure 3-4. Save Session dialog
Directory
The directory in which to save the session configuration file.
The user may type the path into this field directly.
Filter
Of all the files contained in the current Directory, display only those Files that
match the specified filter.
Directories
Contains a list of all the subdirectories within the current directory. Selecting any of
these will change the current Directory to that subdirectory. Double-clicking on
any of these directory names will change to that directory and update the Files list
accordingly.
3-7
NightTrace Manual
Files
Within the current Directory, this is a list of the files that match the specified Filter. Any of these filenames can be selected. When selected, the filename appears in
the Selection field.
Selection
The name of the file to save the session configuration file to appears here after being
selected from the Files list. The filename may be manually entered into this field
by the user as well.
Unsaved Changes
3
This dialog is presented whenever the user attempts to terminate a session which has
changes that have not yet been saved to the session configuration file.
Figure 3-5. Unsaved Changes dialog
Yes
When the user presses this button, the current configuration is saved to the current
session configuration file. The name of the current session configuration file
appears in the Session Configuration File Name Area (see “Session Configuration
File Name Area” on page 3-17).
If the current configuration has not yet been saved, the Save Session dialog (see
“Save Session” on page 3-6) will be presented to allow the user to navigate to the
desired directory in which to save the session configuration file.
No
When the user presses this button, any unsaved changes are discarded and the termination of the session completes.
Cancel
Cancels the termination action.
Help
Provides online help for this dialog.
3-8
NightTrace Session Manager
Daemons
3
The Daemons menu provides functionality for configuring new and existing daemon
definitions, as well as attaching to and detaching from running daemons.
The Daemons menu appears on the NightTrace Session Manager menu bar (see “NightTrace Session Manager Menu Bar” on page 3-2).
Figure 3-6. Daemons Menu
New...
Opens the Daemon Definition dialog (see “Daemon Definition Dialog” on page
3-25) allowing the user to configure a new daemon definition.
Edit...
Opens the Daemon Definition dialog (see “Daemon Definition Dialog” on page
3-25) for the daemon definition currently selected in the Daemon Details Area (see
“Daemon Details Area” on page 3-17) allowing the user to edit that particular definition.
NOTE
The daemon definition may not be altered while the daemon is
executing.
Delete
Deletes the daemon definition(s) currently selected in the Daemon Details Area (see
“Daemon Details Area” on page 3-17).
The user is prompted for confirmation before the deletion is performed.
3-9
NightTrace Manual
Attach...
Allows the user to query any target system for user application trace daemons and
displays the results in the Attach Daemons dialog (see “Attach Daemons” on
page 3-12). The user may then attach to the desired daemon and control it using the
NightTrace Session Manager.
Detach
Relinquishes control of the running daemon(s) currently selected in the Daemon
Details Area (see “Daemon Details Area” on page 3-17).
Reset
Flushes the contents of trace buffers for the running daemon(s) currently selected in
the Daemon Details Area (see “Daemon Details Area” on page 3-17). Any events in
the buffer at the time of the reset are discarded. Events that have already been written to the output device (file or stream) are unaffected.
Pressing the Reset button also places the selected daemons in a Paused state (see
“State” on page 3-19).
NOTE
This option is not supported for kernel trace daemons.
Select All
Selects all daemon definitions listed in the Daemon Details Area (see “Daemon
Details Area” on page 3-17).
Deselect All
Deselects all daemon definitions listed in the Daemon Details Area (see “Daemon
Details Area” on page 3-17)
Login
3
This dialog is presented when attaching to a daemon on a remote system (see “Attach
Daemons” on page 3-12) or when importing daemon attributes based on a user application
running on a remote system (see “Import Daemon Definition” on page 3-27).
3-10
NightTrace Session Manager
Figure 3-7. Login dialog
After filling in the required fields in the Login dialog, the Enter Password dialog (see
“Enter Password” on page 3-11) is displayed, allowing the user to enter the password for
the specified User on the specified Target System.
NOTE
Passwords are not included in the configuration files written by
NightTrace. They are retained only during the current invocation
of NightTrace.
Target System
The name of the target system to which the user wishes to connect.
User
The login name of the user on the specified Target System.
Enter Password
3
The Enter Password dialog is displayed during user authentication on a target system.
NOTE
The Enter Password dialog is not displayed if a valid password has already been entered for the specified user on the specified target system during the current invocation of NightTrace.
3-11
NightTrace Manual
Figure 3-8. Enter Password dialog
Enter the password for the specified user on the specified target system.
NOTE
Passwords are not included in the configuration files written by
NightTrace. They are retained only during the current invocation
of NightTrace.
Attach Daemons
3
The Attach Daemons dialog is displayed when the user attempts to attach to a daemon
running on a remote target system.
This dialog is presented following user authentication (see “Login” on page 3-10 and
“Enter Password” on page 3-11) on that system.
Figure 3-9. Attach Daemons dialog
3-12
NightTrace Session Manager
Program ID
The process ID (PID) of the user trace daemon on the remote system.
Creator
The login name of the user who owns the user trace daemon on the remote system.
Attach as User
The login name of the user attaching to the user trace daemon. This value defaults
to the user specified in the Login dialog (see “Login” on page 3-10) presented prior
to this dialog.
Key File
The filename which is used to calculate the shared memory segment identifier associated with the logging of user trace events. See “Key File” on page 3-31 for more
information.
The following buttons appear at the bottom of the Attach Daemons dialog and have the
specified meaning:
OK
Attaches to the daemon selected in the list and closes the Attach Daemons dialog.
Attach as User...
Brings up a dialog allowing the user to specify the login name used to attach to the
selected daemon(s). Since the daemon's shared memory is owned by the creator, the
user attaching to the user trace daemon could be relevant in terms of permissions.
Refresh
Queries the target system for active trace daemons.
Cancel
Closes the Attach Daemons dialog without attaching to any of the listed daemons.
Help
Provides online help for this dialog.
3-13
NightTrace Manual
Options
3
The Options menu appears on the NightTrace Session Manager menu bar (see “NightTrace Session Manager Menu Bar” on page 3-2).
Figure 3-10. Options Menu
Refresh Rate...
Displays the Refr esh Inte rva l dialog (see “Refresh Interval” on page 3-14)
allowing the user to specify how often the statistics (displayed in the Daemon
Details Area) are requested and updated for running daemons. This dialog sets the
display rate for those daemons currently selected in the Daemon Details Area (see
“Daemon Details Area” on page 3-17).
Refresh Interval
3
This dialog allows the user to specify how often the statistics (displayed in the Daemon
Details Area) are requested and updated for running daemons. This dialog sets the display
rate for those daemons currently selected in the Daemon Details Area (see “Daemon
Details Area” on page 3-17).
Figure 3-11. Refresh Interval dialog
Refresh Interval
The number of seconds between queries.
Tools
3
The Tools menu appears on the NightTrace Session Manager menu bar (see “NightTrace
Session Manager Menu Bar” on page 3-2).
3-14
NightTrace Session Manager
Figure 3-12. Tools Menu
NightProbe
Opens the NightProbe Data Monitoring application. NightProbe is a real-time
graphical tool for monitoring, recording, and altering program data within one or
more executing programs without significant intrusion. NightProbe can be used in a
development environment as a tool for debugging, or in a production environment to
create a “control panel” for program input and output.
See also:
• NightProbe User’s Guide (0890480)
NightBench Builder
Opens the NightBench Program Development Environment. NightBench is a set of
graphical user interface (GUI) tools for developing software with the Concurrent
C/C++ and MAXAdaTM compiler toolsets.
NOTE
NightBench is currently not available on RedHawk systems.
See also:
• NightBench User’s Guide (0890480)
NightSim Scheduler
Opens the NightSim Application Scheduler. NightSim is a tool for scheduling and
monitoring real-time applications which require predictable, repetitive process execution. With NightSim, application builders can control and dynamically adjust the
periodic execution of multiple coordinated processes, their priorities, and their CPU
assignments.
See also:
• NightSim User’s Guide (0890480)
3-15
NightTrace Manual
NightView Debugger
Opens the NightView Source-Level Debugger. NightView is a graphical
source-level debugging and monitoring tool specifically designed for real-time
applications. NightView can monitor, debug, and patch multiple real-time processes
running on multiple processors with minimal intrusion.
See also:
• NightView User’s Guide (0890395)
Help
3
The Help menu appears on the NightTrace Session Manager menu bar (see “NightTrace
Session Manager Menu Bar” on page 3-2).
Figure 3-13. Help Menu
On Window
Displays the help topic for the current window.
On Item
Gives context-sensitive help on the various menu options, dialogs, or other parts of
the user interface.
Help for a particular item is obtained by first choosing the On Item menu option,
then clicking the mouse pointer on the object for which help is desired (the mouse
pointer will become a floating question mark when the On Item menu item is
selected).
In addition, context-sensitive help may be obtained for the currently highlighted
option by pressing the F1 key. The HyperHelp viewer will display the appropriate
topic.
NightTrace User’s Guide
Opens the online NightTrace User’s Guide.
3-16
NightTrace Session Manager
Bookshelf
Opens a HyperHelp window that lists all of the Concurrent online publications currently available on the local system.
About NightTrace
Displays version and copyright information for the NightTrace product.
Session Configuration File Name Area
3
The area located directly beneath the NightTrace Session Manager Menu Bar displays the
name of the current session configuration file.
Figure 3-14. Session Configuration File Name Area
Session configuration file
The name of the current session configuration file. If the current session configuration has not yet been saved to a file, New will be displayed in this area.
To save the current session configuration to a file, select either the Save Session
(see “Save Session” on page 3-3) or Save Se ssion As... (see “Save Session
As...” on page 3-4) menu item from the NightTrace menu (see “NightTrace” on
page 3-2).
Daemon Details Area
3
The area located directly beneath the Session Configuration File Name Area displays
information about the daemons defined in the current session.
3-17
NightTrace Manual
Figure 3-15. Daemon Details Area
Type
Indicates what type of trace events the daemon is logging.
U
indicates that the associated daemon is logging user trace
events
K
indicates that the associated daemon is logging kernel trace
events
The type of trace event that the daemon is logging is configured by selecting either
the Kernel or the User Application radiobutton in the Trace section on the
General page of the Daemon Definition dialog (see “General” on page 3-28).
Daemon Name
The name of the daemon as configured in the Name field on the General page of
the Daemon Definition dialog (see “Name” on page 3-29).
NOTE
The Daemon Name is merely a label to aid the user in identifying specific daemons with a session. It has no external meaning
and is unrelated to the NightTrace API.
Target
The name of the system on which the associated daemon is running.
The target system is specified in the Target System field on the General page of
the Daemon Definition dialog (see “Target System” on page 3-29).
3-18
NightTrace Session Manager
State
The state of the daemon.
Logging
indicates the daemon is currently capturing events
Not Executing
indicates the daemon has not been started
Paused
indicates the daemon is started but is not capturing
events
While paused, attempts to log events from user applications or via the operating system kernel are discarded.
Note that these are not considered lost events (see “Lost”
on page 3-20).
Pausing
indicates the daemon is going from a Logging state to a
Paused state
Resuming
indicates the daemon is going from a Paused state to a
Logging state
Starting
indicates the daemon is going from a Not Executing
state to a Logging state
Stopping
indicates the daemon is going from a Paused or Logging state to a Not Executing state
Attached
The number of user application threads or processes that are associated with the daemon.
Streaming
Indicates whether or not data from this daemon is being streamed to the NightTrace
display buffer. This is specified by the setting of the Stream checkbox on the
General page of the Daemon Definition dialog (see “Stream” on page 3-31).
Advanced settings with respect to streaming can be found on the Streaming page
of the Daemon Definition dialog (see “Streaming” on page 3-45).
If streaming is not in effect, data will be written to the output file (see “Output File”
on page 3-32) as specified on the General page of the Daemon Definition dialog.
Logged
The number of trace events that have been written to the stream or written to the file
by the associated daemon. See Streaming above.
Buffer
The number of trace events currently held in the buffer.
3-19
NightTrace Manual
These events will be flushed from the buffer either when the Flush Threshold
(see “Flush Threshold” on page 3-37) is reached or when the user flushes them manually (see “Flush” on page 3-21).
Lost
Lost events occur when the daemon cannot keep up with the rate at which events are
being added to the buffer.
To combat this, adjust the Runtime attributes of the daemon by raising its Priority
and/or by changing its CPU Bias to bind it to a specific CPU. (See “Runtime” on
page 3-41 for a description of these settings.)
NOTE
Events that are discarded when a daemon is Paused (see “State”
on page 3-19) are not included in the Lost count.
Also, events that are discarded when the daemon is in Buffer
Wrap mode (see “Buffer Wrap” on page 3-33) (i.e. older events
being discarded in favor of new ones) are not included in the Lost
count.
Daemon Control Area
3
The area located at the bottom of the NightTrace Session Manager contains a number of
buttons which control the daemons currently selected in the Daemon Details Area.
Figure 3-16. Daemon Control Area
Start
Starts execution of the daemon(s) currently selected in the Daemon Details Area.
NOTE
Starting a daemon does not imply that the daemon begins to collect events.
3-20
NightTrace Session Manager
Start operations are time consuming and involve possibly connecting to a target system, user authentication, etc. Once the daemon is started, it is more efficient to utilize the Pause and Resume operations which require less time and resources.
Stop
Stops execution of the daemon(s) currently selected in the Daemon Details Area.
The connection to the target system is terminated by this operation. Once the daemon is started, it may be more efficient to utilize the Pause and Resume operations.
Pause
Pauses the execution of the daemon(s) currently selected in the Daemon Details
Area.
NOTE
When a daemon is paused, incoming trace events are discarded
without notice.
Resume
Resumes execution of the daemon(s) currently selected in the Daemon Details Area.
Once resumed, incoming events are placed into the daemon buffer for subsequent
processing by the daemon.
Flush
Flushes trace events from the buffers associated with the daemon(s) currently
selected in the Daemon Details Area to either the NightTrace display buffer (see
“Stream” on page 3-31) or to the output file (see “Output File” on page 3-32).
Display
When data from the selected daemon(s) is being streamed to the NightTrace display
buffer (as specified by the setting of the Stream checkbox on the General page of
the Daemon Definition dialog (see “General” on page 3-28)), pressing this button causes a flush of the data currently in the trace buffer to the NightTrace display
buffer. If no display pages currently exist, a default display page will be created
when this button is pressed.
NOTE
The user must scroll the NightTrace display in order to see the
most up-to-date data.
3-21
NightTrace Manual
When data from the selected daemon(s) is written to output files, pressing this button causes the data in the output file to be displayed in the NightTrace display.
Trace Events...
Presents the Enable/Disable Trace Events dialog (see “Enable / Disable Trace
Events” on page 3-22) allowing the user to dynamically enable or disable selected
trace event types while a particular daemon is running. A currently executing daemon must be selected from the Daemon Details Area.
Enable / Disable Trace Events
3
The Enable/Disable Trace Events dialog allows the user to dynamically enable or
disable selected trace event types while a particular daemon is running. This dialog is
opened by selecting a currently executing daemon from the Daemon Details Area and
pressing the Trace Events... button in the Daemon Control Area of the NightTrace Session Manager (see “Daemon Control Area” on page 3-20).
Figure 3-17. Enable / Disable Trace Events dialog
3-22
NightTrace Session Manager
Disabled Events
This is a list of user trace or kernel trace event types that are disabled.
Disabled events are not logged to daemon buffers and therefore are not included in
event trace outputs.
Enabled Events
This is a list of user trace or kernel trace event types that are enabled.
Enabled events are allowed to be placed into daemon buffers and are subsequently
transferred to the output device (see “Trace Events Output” on page 3-31).
Enable -->
Moves the selected items from the Disabled Events list or the Trace Event
field to the Enabled Events list.
<-- Disable
Moves the selected items from the Enabled Events list or the Trace Event field
to the Disabled Events list.
Trace Event
Allows the user to enter a particular trace event type (or range of trace event types)
and subseqently Enable --> or Disable --> it.
The user may use th e even t name associate d w ith th e even t typ e (e.g.
TR_SYSCALL_RESUME) or the numerical value of the trace event type (e.g.
4131).
The user may also enter a range of values either using the event names or their
numerical values (e.g. TR_INTERRUPT_ENTRY-TR_EXCEPTION_EXIT
or 4112-4117).
Use Event Names
Allows the user to view the event names of the trace event types in the Disabled
Events and Enabled Events lists instead of their numerical values.
For kernel events , these mappings are provided in the file
/usr/lib/NightTrace/eventmap, which is automatically loaded by the
NightTrace Session Manager.
For user trace events, the user may load user-defined event map files using the
Load Event Names dialog (see “Load Event Names” on page 3-39). Use the
Load Event Names... button to access this dialog.
3-23
NightTrace Manual
Load Event Names...
Allows the user to load various user-defined event map files by presenting the Load
Event Names dialog (see “Load Event Names” on page 3-39).
The user may then view the event names of the user trace event types in the Disabled Events and Enabled Events lists instead of their numerical values by
checking the Use Event Names checkbox on this dialog.
3-24
NightTrace Session Manager
Daemon Definition Dialog
3
The Daemon Definition dialog allows the user to create and modify the various aspects
of a daemon configuration.
Figure 3-18. Daemon Definition dialog
The Daemon Definition dialog is divided into a number of subpages that contain specific information about the current configuration. These subpages are:
-
General
This page contains information such as the name of the daemon configuration, the
target system on which the daemon will run, the user’s login on that system, and settings specifying whether kernel or user application tracing will be performed. Items
related to trace events output such as the names of output and key files and settings
such as whether or not streaming will be performed by this daemon are found on this
page as well.
See “General” on page 3-28 for more detailed information.
3-25
NightTrace Manual
-
User Trace
This page contains settings for user trace daemons such as locking policies associated with the daemon, shared memory permissions, and the duration of the timestamp heartbeat, as well as specifications for the size and flush threshold of the user
event buffer.
See “User Trace” on page 3-33 for more detailed information.
-
Events
This page allows the user to specify which events may be logged while tracing.
See “Events” on page 3-37 for more detailed information.
-
Runtime
This page allows the user to specify the scheduling policy, CPU bias, and memory
binding policies for the daemon.
See “Runtime” on page 3-41 for more detailed information.
-
Streaming
This page allows the user to specify advanced settings with respect to the transfer of
trace data from the daemon to the NightTrace display buffer.
See “Streaming” on page 3-45 for more detailed information.
The following buttons appear at the bottom of the Daemon Definition dialog and have
the specified meaning:
OK
This button applies changes made and closes the Daemon Definition dialog.
Apply
This button applies changes made but leaves the Daemon Definition dialog open.
Reset
This button restores the values of all items to the previously-applied values and
leaves the Daemon Definition dialog open.
Import...
Presents the Import Daemon Definition dialog (see “Import Daemon Definition” on page 3-27) allowing the user to define daemon attributes based on a user
application running on a remote system. The Import Daemon Definition dialog
is presented following user authentication (see “Login” on page 3-10 and “Enter
Password” on page 3-11).
3-26
NightTrace Session Manager
Cancel
This button restores the values of all items to the previously-applied values and
closes the Daemon Definition dialog.
Help
This button brings up the help topic for this page.
Import Daemon Definition
3
This dialog allows the user to define daemon attributes based on a running user application containing NightTrace API calls. The Import Daemon Definition dialog is presented following user authentication (see “Login” on page 3-10 and “Enter Password” on
page 3-11).
The user may select an application, running on the specified target system, from which
they wish to import trace-related attributes.
Figure 3-19. Import Daemon Definition dialog
Program ID
The process ID (PID) of the Program on the remote system.
Program
The name of the user application containing trace_ calls on the remote system.
User
The user who invoked the Program on the remote system.
3-27
NightTrace Manual
Key File
The filename which is used to calculate the shared memory segment identifier associated with the logging of user trace events. See “Key File” on page 3-31 for more
information.
The following buttons appear at the bottom of the Import Daemon Definition dialog
and have the specified meaning:
OK
Imports daemon attributes into the current daemon definition from the user application selected in the list.
Refresh
Queries the specified target system for user applications making trace-related calls.
Cancel
This button closes the Import Daemon Definition dialog without importing any
daemon attributes from any of the listed applications.
Help
Brings up online help for this dialog.
General
3
The General page of the Daemon Definition dialog (see “Daemon Definition Dialog”
on page 3-25) contains information such as the name of the daemon configuration, the target system on which the daemon will run, the user’s login on that system, and settings
specifying whether kernel or user application tracing will be performed. Items related to
trace events output such as the names of output and key files and settings such as whether
or not streaming will be performed by this daemon are found on this page as well.
3-28
NightTrace Session Manager
Figure 3-20. Daemon Definition dialog - General
Target
3
Name
The name for this daemon definition.
This field is automatically populated with the name daemon_x where x is a number, starting at 0, which increments with each new daemon definition.
The Name is merely a label to aid the user in identifying specific daemons with a
session. It has no external meaning and is unrelated to the NightTrace API. The
user may change this to a name of their choosing.
Target System
The system on which this trace daemon will run.
3-29
NightTrace Manual
User
The name of the user on the specified Target System responsible for running this
daemon.
Trace
Indicates what type of trace events this daemon will be logging.
Kernel
Indicates that the daemon is logging kernel trace events.
Kernel events are automatically generated by the operating system kernel
when a kernel daemon is initiated if the operating system kernel was built with
tracing support.
See the PowerMAX OS Real-Time Guide (0890466) for information on configuring the kernel for kernel tracing on a PowerMAX OS system.
For systems running RedHawk Linux, see the Concurrent Real-Time Linux RT User Guide (0898004) for more detailed information.
User Application
Indicates that the daemon is logging user trace events.
User trace events are generated by:
-
user applications that use the NightTrace API
the NightProbe tool (see the description of the To
NightTrace menu item in the chapter titled “Using the Data
Reco rding Window ” in the NightPro be U ser ’s G uide
(0890480).
Timing Source
By default, an architecture-specific clock is used to timestamp trace events. On
NightHawk 6000 Series machines, the interval timer is used; on Power Hawk and
PowerStack systems, it is the PowerPC Time Base Register; on iHawk systems, the
Intel Time Stamp Counter is used.
NightTrace can also specify the Real-Time Clock and Interrupt Module (RCIM) as a
timestamp source (see “Timestamp Source Selection” on page 1-2 for more information). This is most useful when concurrent traces running on multiple systems
are desired. Using the RCIM as a timing device allows NightTrace to present the
user with a synchronized view of concurrent activities on those systems.
Default
Specifies that the architecture-specific clock will be used to timestamp trace
events. On NightHawk 6000 Series machines, the interval timer is used; on
3-30
NightTrace Session Manager
Power Hawk and PowerStack systems, it is the PowerPC Time Base Register;
on iHawk systems, the Intel Time Stamp Counter is used.
RCIM Tick
Specifies that the Real-Time Clock and Interrupt Module (RCIM) tick clock
will be used to timestamp trace events.
NOTE
Use of this option requires that an RCIM board is installed and
configured on the target system.
Trace Events Output
3
Stream
When checked, this specifies that streaming is in effect so that the output trace
events will go directly to the NightTrace display buffer. Otherwise, the output will
be written to the Output File (see below).
Key File
Specifies a filename which is used to calculate the shared memory segment identifier associated with the logging of user trace events. The daemon and the NightTrace API use the ftok(2) service to map the specified filename to a shared memory identifier as used by shmat(2).
NOTE
When the output method is NOT streaming (see Stream above),
the Key File defines the name of the Output File where trace
events are written (see “Output File” on page 3-32).
The Key File is relative to the target system. It does not necessarily need to be
accessible from the host system (the system where the NightTrace GUI is running);
however, that can be convienient for subsequent analysis via NightTrace.
Furthermore, the Key File does not have to pre-exist. If a user application has not
already created it via a NightTrace API call, the daemon will create the file if it does
not exist.
Browse...
Brings up a standard file selection dialog so that the user may navigate to the
desired location of the Key File.
3-31
NightTrace Manual
In order to browse, the Target System (see “Target System” on page 3-29)
must be operational. The file selection dialog invoked by that button shows
files relative to the Target System.
Output File
The name of the file to which trace events are written.
The Output File is relative to the target system. It does not necessarily need to be
accessible from the host system (the system where the NightTrace GUI is running);
however, that can be convienient for subsequent analysis via NightTrace.
NOTE
When the output method is NOT streaming (see Stream above),
the Key File (see “Key File” on page 3-31) defines the name of
the Output File.
Browse...
Brings up a standard file selection dialog so that the user may navigate to the
desired location of the Output File.
In order to browse, the Target System (see “Target System” on page 3-29)
must be operational. The file selection dialog invoked by that button shows
files relative to the Target System.
File Wrap
When checked, allows the user to specify the Maximum File Size for the Key
File/Output File.
Maximum File Size
The maximum number of bytes for the Key File/Output File.
When the Maximum File Size is reached, subsequent events will overwrite
the oldest events. NightTrace automatically detects this and presents events in
chronological order, from oldest to newest. Events that are discarded due to
File Wrap are NOT considered “lost events” (see “Lost” on page 3-20) in
statistics provided by the NightTrace Session Manager or the NightTrace analyzer.
NOTE
For a daemon capturing kernel trace events, the file wrap sizes
that the user specifies are rounded up to a multiple of kernel buffer
sizes. (On PowerMAX OS systems, a kernel trace buffer has a
fixed size of 4096*12 bytes; on RedHawk systems, a kernel trace
buffer is 500000 bytes.)
3-32
NightTrace Session Manager
Buffer Wrap
When this is checked, the daemon will overwrite the least recently recorded events
in the trace buffer when it reaches its maximum size.
For user trace events, the size of the buffer is specified in the Buffer Size field on
the User Trace page of the Daemon Definition dialog (see “User Trace” on
page 3-33).
For kernel trace events, the size of the buffer is defined by the operating system.
On a PowerMAX OS system, a kernel trace buffer has a fixed size of 4096*12 bytes
which holds 4095 kernel events. The total number of trace buffers for kernel events
is specified by the kernel tunable TR_BUFFER_COUNT, the default value of which
is 5.)
NOTE
The value of TR_BUFFER_COUNT may be changed on a PowerMAX OS system via the config command. However, if this
tunable is changed, the kernel must be rebuilt and the system
restarted for the change to take effect.
On RedHawk systems, there are two kernel trace buffers, each of which is 500000
bytes in size.
User Trace
3
The User Trace page of the Daemon Definition dialog (see “Daemon Definition Dialog” on page 3-25) contains settings for locking policies associated with the daemon and
the corresponding user applications using the NightTrace API, shared memory permissions, and the duration of the timestamp heartbeat, as well as specifications of the size and
flush threshold of the user event buffer.
3-33
NightTrace Manual
Figure 3-21. Daemon Definition dialog - User Trace
Locking Policies
3
Spin Lock Protection
The NightTrace API and associated daemons use high-performance, low-intrusion
spin locks to protect critical sections involved in logging and consuming trace
events.
These spin locks require preemption control so that processes on the same CPU
don't preempt a daemon or user process in the middle of a critical section and then
spin forever waiting for it to be unlocked.
The spin locks are held for extremely short periods of time.
Failure to properly select a protection level may result in a process spinning forever
on a CPU in the event of unfortunate preemption.
3-34
NightTrace Session Manager
In more severe cases, the system may hang; this is only a problem if a user-level
interrupt preempts another user process or daemon at an unfortunate time and
attempts to log trace events to the same trace daemon session.
Data corruption of the trace data will not occur in any case.
System priority level (SPL)
This is the safest form of preemption control as it prevents even machine
interrupts from preempting the locking process. This is required when a user
application will be logging events in a user-level interrupt handler (i.e. at system interrupt level).
This is the default locking protection mechanism for PowerMAX OS systems.
NOTE
This mechanism is not available on RedHawk systems. If
selected for RedHawk systems, it is silently translated to the
Rescheduling Variables protection as described below.
Rescheduling Variables
This level of protection is sufficient for user applications that log trace events
as long as no user-level interrupt handlers will be logging trace events.
None
Selecting no protection opens up the real possibility that the user process or
the daemon could preempt each other if they are allowed to operate on the
same CPU.
However, the Runtime subpage allows the user to define the CPU binding
(CPU Bias) and priority (Priority) at which the daemon operates. (See
“Runtime” on page 3-41 for a description of these settings.) Thus, if the user
also takes similar care to schedule their user applications then selecting None
is sufficient.
Page Critical Locking
Page locking is required to prevent preemption while holding a spin lock. Without
this choice, it is possible that a page fault could occur while a spin lock is held,
allowing for a user application or daemon to spin forever.
Lock Pages
When this option is selected, the daemon and user applications associated
with this daemon lock down the required pages and unlock them when the
NightTrace API is terminated.
3-35
NightTrace Manual
Inheritance
When the daemon starts up, certain settings can be inherited from a running user
application that has set up a trace definition.
The NightTrace API trace_begin() call (an enhanced replacement for
trace_start()) allows the user to define the following settings in a user application:
-
those values listed under the Spin Lock Protection and Page
Critical Locking categories on this page
-
the Buffer Size also found on this page
the setting for the Timing Source which appears on the General
page of the Daemon Definition dialog (see “General” on page
3-28)
See “trace_begin()” on page 2-5 for more information on this API.
Inherit settings from running user application
When this is checked, trace settings defined by a running user application are
silently preferred if those definitions differ from those made in the Session
Manager.
If not checked, trace settings defined by user applications must match those in
the current daemon definition.
See above for details on which trace settings may be inherited.
Shared Memory
3
The daemon and the user applications communicate with each other through shared memory. The shared memory segment identifier is calculated from the Key File setting (see
“Key File” on page 3-31).
The shared memory segment is automatically destroyed after the last user application
and/or the daemon exits normally (if the daemon or user applications are aborted, the
shared memory segment will remain; it will be reinitialized on subsequent use).
shmid Permissions
If the daemon is initiated before any user applications, then the shared memory segment will be created with the specified permissions.
Timestamp Heartbeat
3
For performance reasons, NightTrace events normally include only the low 32 bits of a
full 64-bit timestamp. The heartbeat ensures that the daemon logs a full 64-bit timestamp
before the interval of time represented by 32-bits expires. The daemon automatically calculates the heartbeat time when it determines how fast the timing source clock ticks.
3-36
NightTrace Session Manager
Log Heartbeat
The frequency at which a full 64-bit timestamp will be generated.
NOTE
There would be no particular benefit by setting the heartbeat to a
value shorter than the automatically calcuated time unless trace
time anomolies are seen because the daemon is preempted by
higher priority processing and cannot otherwise log the heartbeat
in time.
User Event Buffer
3
Buffer Size
The number of events that can be held in memory before being written to the output
device.
Flush Threshold
The Flush Threshold, expressed as a percentage of the Buffer Size, is the point
at which the daemon begins to transfer events from the user event buffer to the output device (see “Trace Events Output” on page 3-31). The threshold is important so
as not to lose events if the daemon cannot respond quickly enough.
NOTE
If events are being lost, a combination of changing the Buffer
Size, the Flush Threshold, and the runtime Priority (see “Priority” on page 3-42) of the daemon is normally sufficient to prevent event loss.
Events
3
The Events page of the Daemon Definition dialog (see “Daemon Definition Dialog”
on page 3-25) allows the user to specify which trace event types will be handled by the
daemon.
The user may also change this list dynamically while the daemon is executing by pressing
the Trace Even ts... button in the Daemon Control Area of the NightTrace Session
Manager (see “Daemon Control Area” on page 3-20) to bring up the Enable/Disable
Trace Events dialog (see “Enable / Disable Trace Events” on page 3-22).
3-37
NightTrace Manual
Figure 3-22. Daemon Definition dialog - Events
Disabled Events
This is a list of user trace or kernel trace event types that are disabled.
Disabled events are not logged to daemon buffers and therefore are not included in
event trace outputs.
Enabled Events
This is a list of user trace or kernel trace event types that are enabled.
Enabled events are allowed to be placed into daemon buffers and are subsequently
transferred to the output device (see “Trace Events Output” on page 3-31).
Enable -->
Moves the selected items from the Disabled Events list or Trace Event field to
the Enabled Events list.
3-38
NightTrace Session Manager
<-- Disable
Moves the selected items from the Enabled Events list or Trace Event field to
the Disabled Events list.
Trace Event
Allows the user to enter a particular trace event type (or range of trace event types)
and subseqently Enable --> or Disable --> it.
The user may use th e even t name associate d w ith th e even t typ e (e.g.
TR_SYSCALL_RESUME) or the numerical value of the trace event type (e.g.
4131).
The user may also enter a range of values either using the event names or their
numerical values (e.g. TR_INTERRUPT_ENTRY-TR_EXCEPTION_EXIT
or 4112-4117).
Use Event Names
Allows the user to view the event names of the trace event types in the Disabled
Events and Enabled Events lists instead of their numerical values.
For kernel events , these mappings are provided in the file
/usr/lib/NightTrace/eventmap, which is automatically loaded by the
NightTrace Session Manager.
For user trace events, the user may load user-defined event map files using the
Load Event Names dialog (see “Load Event Names” on page 3-39). Use the
Load Event Names... button to access this dialog.
Load Event Names...
Allows the user to load various user-defined event map files by presenting the Load
Event Names dialog (see “Load Event Names” on page 3-39).
The user may then view the event names of the user trace event types in the Disabled Events and Enabled Events lists instead of their numerical values by
checking the Use Event Names checkbox on this dialog.
Load Event Names
3
This dialog allows the user to load various user-defined event map files, thereby enabling
the user to view the event names of the user trace event types instead of their numerical
values in the En able/Disa ble Trace Even ts dialog (see “Enable / Disable Trace
Events” on page 3-22) or on the Events page of the Daemon Definition dialog (see
“Events” on page 3-37).
The user can access this dialog by pressing the Load Event Names... button on either
of the aforementioned dialogs. The Use Event Names checkbox on either of these dialogs allows the user to toggle between viewing the event names and their numerical values.
3-39
NightTrace Manual
NOTE
Event map files are relative to the host system (the system where
the NightTrace GUI is running).
Figure 3-23. Load Event Names dialog
Directory
The directory in which to find the desired event map file.
The user may type the path into this field directly.
Filter
Of all the files contained in the current Directory, display only those Files that
match the specified filter.
Directories
Contains a list of all the subdirectories within the current directory. Selecting any of
these will change the current Directory to that subdirectory. Double-clicking on
3-40
NightTrace Session Manager
any of these directory names will change to that directory and update the Files list
accordingly.
Files
Within the current Directory, this is a list of the files that match the specified Filter. Any of these filenames can be selected. When selected, the filename appears in
the Selection field.
Selection
The name of the desired event map file appears here after being selected from the
Files list. The filename may be manually entered into this field by the user as well.
Runtime
3
The Runtime page of the Daemon Definition dialog (see “Daemon Definition Dialog” on page 3-25) allows the user to specify the scheduling policy, CPU bias, and memory binding policies for the daemon.
Figure 3-24. Daemon Definition dialog - Runtime
3-41
NightTrace Manual
Scheduling
3
Scheduling Policy
POSIX defines three types of policies that control the way a process is scheduled by
the operating system. They are SCHED_FIFO (FI FO), SCHED_RR (R o un d
Robin), and SCHED_OTHER (Time-Sharing). Each of these scheduling policies
is associated with one of the System V scheduler classes. See either the PowerMAX
OS Programming Guide (0890423) or the RedHawk Linux User's Guide (0898004)
for more detailed information regarding these policies and their associated classes.
FIFO
The FIFO (first–in–first–out) policy (SCHED_FIFO) is associated with the
fixed-priority class in which critical processes and LWPs can run in predetermined sequence. Fixed priorities never change except when a user requests a
change.
This policy is almost identical to the Round Robin (SCHED_RR) policy.
The only difference is that a process scheduled under the FIFO policy does
not have an associated time quantum. As a result, as long as a process scheduled under the FIFO policy is the highest priority process scheduled on a particular CPU, it will continue to execute until it voluntarily blocks.
Round Robin
The Round Robin policy (SCHED_RR), like the FIFO policy, is associated
with the fixed-priority class in which critical processes and LWPs can run in
predetermined sequence. Fixed priorities never change except when a user
requests a change.
A process that is scheduled under this policy (as opposed to the FIFO policy)
has an associated time quantum.
Time-Sharing
The Ti m e - S h a r i n g policy (SCHED_OTHER) is associated with the
time-sharing class, changing priorities dynamically and assigning time slices
of different lengths to processes in order to provide good response time to
interactive processes and LWPs and good throughput to CPU-bound processes
and LWPs.
Priority
The Priority is relative to the selected Scheduling Policy (see “Scheduling Policy” on page 3-42) and the range of allowable values is dependent on the operating
system.
3-42
NightTrace Session Manager
For example, on PowerMAX OS systems, the priority values for the FIFO class
include 0..59, where 59 is the most urgent user priority available on the system.
On RedHawk systems, the priority values for the FIFO class include 1..99, where
99 is the most urgent user priority available on the system.
It is recommended that a reasonable urgent priority is specified when using the
FIFO scheduling policy to prevent event loss.
CPU Bias
3
CPU Bias
Selection of a specific CPU or set of CPUs can be advantageous to prevent event
loss, reduce daemon instruction on the rest of the system, and for careful configuration to allow for relaxed Spin Lock Protection (see “Spin Lock Protection” on page
3-34).
All CPUs
Selects all CPUs on the target system.
NUMA
3
On platforms belonging to the local/global/remote subclass of non-uniform memory
access (NUMA) architectures, primary memory is divided into global and local memories.
Global memory is located on a memory board where it is equally distant, in terms of
access time, from all of the CPUs in the system. All CPUs share a single data path to global memory known as the system bus.
Local memory is located on a CPU board where it is closer, in terms of access time, to the
co-resident CPUs. The path between a CPU and its local memory does not include the
system bus. Local memory usage improves the throughput of the system in two ways:
smaller access times for the co-resident CPUs and less system bus contention for the
remaining CPUs.
Applications can influence the page placement decisions made by the kernel by selecting
NUMA policies for different parts of their address spaces. NUMA policies specify where
data should reside in the local/global/remote hierarchy.
NOTE
These settings are ignored for non-NUMA target systems architectures, such as PowerHawk, PowerStack, and iHawk series
machines.
3-43
NightTrace Manual
NOTE
These settings do not affect the memory associated with the trace
buffers. Kernel trace buffers are in kernel memory allocated out
of the global memoy pool and user trace buffers are in shared
memory allocated out of the global memory pool.
Text NUMA Flag
This item selects the NUMA policy to apply to text (code) pages.
Text pages are those pages in private mappings that belong to a file in a file system.
The traditional text segment falls into this category.
See “Policies” in the section below for a list of applicable NUMA policies.
Private Data NUMA Flag
This item selects the NUMA policy to apply to private data pages.
Private data pages are those pages in private mappings that do not belong to a file in
a file system. The traditional stack and data segments fall into this category. Note
that the first time that a process writes to a page in a private, writable mapping to a
file, the page will move from the text category to the private data category.
See “Policies” in the section below for a list of applicable NUMA policies.
Shared Data NUMA Flag
This item selects the NUMA policy to apply to shared data pages. See “Policies” in
the section below for a list of applicable NUMA policies.
U-block NUMA Flag
This item selects the NUMA policy to apply to kernel data structures that contain
the stack used during system calls, the register save area used during context
switches, and miscellaneous other bits of information about the LWP.
See “Policies” in the section below for a list of applicable NUMA policies.
Policies
3
Each of the above flags can be set to one of the following:
Global
Specifies that the designated pages should be placed in global memory.
Soft Local
Specifies that the designated pages be placed in local memory if space is available,
otherwise they should be placed in global memory.
3-44
NightTrace Session Manager
Hard Local
Specifies that the designated pages must be placed in local memory.
Default
Specifies that the default NUMA policy on the target system should be used.
Streaming
3
The Streaming page of the Daemon Definition dialog (see “Daemon Definition Dialog” on page 3-25) allows the user to specify advanced settings with respect to the transfer
of trace data from the daemon to the NightTrace display buffer.
Figure 3-25. Daemon Definition dialog - Streaming
Streaming Options
3
3-45
NightTrace Manual
Stream Buffer Size
The number of bytes for the buffer that the NightTrace Session Manager uses to
hold data from the daemon before sending it to the NightTrace display buffer.
NOTE
This is an internal buffer. You should not need to adjust the size
of this buffer unless NightTrace finds that it cannot transfer data
quickly enough between the daemon and the NightTrace analyzer.
In such a circumstance, the daemon is forced into a Paused state
(see “State” on page 3-19).
3-46
4
Generating Trace Event Logs with ntraceud
Overview . . . . . . . . . . . . . . . . . . . . . . . . . . . . . . . . . . . . . . . . . . . . . . . . . . . . . . . . . .
The ntraceud Daemon . . . . . . . . . . . . . . . . . . . . . . . . . . . . . . . . . . . . . . . . . . . . . . . .
The Default User Daemon Configuration . . . . . . . . . . . . . . . . . . . . . . . . . . . . . . . . .
ntraceud Modes . . . . . . . . . . . . . . . . . . . . . . . . . . . . . . . . . . . . . . . . . . . . . . . . . . . . .
ntraceud Options . . . . . . . . . . . . . . . . . . . . . . . . . . . . . . . . . . . . . . . . . . . . . . . . . . . .
Option to Get Help (-help) . . . . . . . . . . . . . . . . . . . . . . . . . . . . . . . . . . . . . . . . .
Option to Get Version Information (-version) . . . . . . . . . . . . . . . . . . . . . . . . . .
Option to Disable the IPL Register (-ipldisable) . . . . . . . . . . . . . . . . . . . . . . . .
Option to Prevent Page Locking (-lockdisable) . . . . . . . . . . . . . . . . . . . . . . . . .
Option to Establish File-Wraparound Mode (-filewrap) . . . . . . . . . . . . . . . . . .
Option to Establish Buffer-Wraparound Mode (-bufferwrap) . . . . . . . . . . . . . .
Option to Define Shared Memory Buffer Size (-memsize) . . . . . . . . . . . . . . . .
Option to Set Timeout Interval (-timeout) . . . . . . . . . . . . . . . . . . . . . . . . . . . . .
Option to Set the Buffer-Full Cutoff Percentage (-cutoff) . . . . . . . . . . . . . . . . .
Option to Select Timestamp Source (-clock) . . . . . . . . . . . . . . . . . . . . . . . . . . .
Option to Reset the ntraceud Daemon (-reset) . . . . . . . . . . . . . . . . . . . . . . . . . .
Option to Quit Running ntraceud (-quit) . . . . . . . . . . . . . . . . . . . . . . . . . . . . . .
Option to Present Statistical Information (-stats) . . . . . . . . . . . . . . . . . . . . . . . .
Option to Disable Logging (-disable). . . . . . . . . . . . . . . . . . . . . . . . . . . . . . . . .
Option to Enable Logging (-enable). . . . . . . . . . . . . . . . . . . . . . . . . . . . . . . . . .
Invoking ntraceud . . . . . . . . . . . . . . . . . . . . . . . . . . . . . . . . . . . . . . . . . . . . . . . . . . .
Exercise: Logging Trace Events . . . . . . . . . . . . . . . . . . . . . . . . . . . . . . . . . . . . . . . .
4-1
4-1
4-2
4-4
4-5
4-7
4-8
4-9
4-11
4-12
4-13
4-16
4-17
4-18
4-19
4-20
4-21
4-22
4-24
4-26
4-28
4-29
NightTrace Manual
4
Chapter 4Generating Trace Event Logs with ntraceud
4
4
4
Overview
4
A user daemon is required in order to capture trace events logged by user applications.
There are two methods for controlling user daemons:
• Use the graphical user interface provided in the ntrace session manager
dialog as described in the preceeding chapter
• Use the command line tool ntraceud
The interactive session manager is often more convenient and easier to use and additionally offers concurrent viewing of trace events while the application continues to log trace
data; this optional feature is called streaming. Alternatively, the ntraceud command
line tool is useful in scripts where automation is required.
This chapter describes the ntraceud command line tool broken down into the following
topics:
• Τhe ntraceud daemon
• The default user daemon configuration
• ntraceud modes
• ntraceud options
• Invoking ntraceud
The ntraceud Daemon
4
When you start up ntraceud, it creates a daemon background process and returns your
prompt. The daemon creates a shared memory buffer in global memory. Your application
writes trace events into this buffer, and the daemon copies these trace events to a trace
event file.
You supply the name of the trace event file on your ntraceud invocation and in the
trace_begin() library call in your application. If this file does not exist, ntraceud
creates it; otherwise, ntraceud overwrites it. Unless your umask(1) setting overrides
this default, ntraceud creates the file with mode 666, read and write permission to all
users. If you want to maximize performance, use a trace event file that is local to the
system where the ntraceud daemon and your application run.
4-1
NightTrace Manual
A single ntraceud daemon may service several running applications or processes.
Several ntraceud daemons can run simultaneously; the system identifies them by their
distinctive trace event file names. The ntraceud daemon resides on your system
under/usr/bin/ntraceud.
Whenever the daemon is idle, it sleeps. You can control the sleep interval with an
ntraceud option. Logging a trace event may wake the daemon if the buffer-full cutoff
percentage is exceeded or if shared memory becomes full of trace events. Flushing trace
events from the shared memory buffer to disk always wakes the daemon.
The Default User Daemon Configuration
4
Invoking ntraceud with a trace event file argument and without any options will
attempt to start a user daemon with the default user daemon configuration. You can override defaults by invoking ntraceud with particular options. Table 4-1 summarizes these
options. Later sections provide detailed descriptions of these options and operating modes.
However, if a user application has already been initiated, it may have specified a
non-default configuration via the trace_begin() call. If the critical settings in the configuration defined by the user application differ from those specified by ntraceud, then
ntraceud will fail to initialize with an appropriate diagnostic.
In the default configuration, all trace events are enabled for logging. Your application logs
trace events to the shared memory buffer. By default, an architecture-specific timing
source is utilized. For Intel-based machines, the Intel Time Stamp Counter (TSC register); for Night Hawk 6000 series machine, the interval timer; for PowerHawk and PowerStack series machines, the Time Base Register (TBR). However, the Real-Time Clock
and Interrupt Module (RCIM) can be used as a timestamp source by using the -clock
option to ntraceud (see “Option to Select Timestamp Source (-clock)” on page 4-19).
The ntraceud daemon operates in expansive mode. In expansive mode, ntraceud
copies all trace events from the shared memory buffer to the trace event file. This behavior
differs from file-wraparound mode and buffer-wraparound mode. If the trace event file
does not exist when ntraceud starts up, ntraceud creates it; otherwise, ntraceud
overwrites it.
ntraceud and the NightTrace library routines use page locking to prevent page faults
during trace event logging.
ntraceud uses high-performance, low-intrusion spin locks to protect critical sections
involved in logging and consuming trace events.
These spin locks require preemption control so that processes on the same CPU don't preempt a daemon or user process in the middle of a critical section and then spin forever
waiting for it to be unlocked.
The spin locks are held for extremely short periods of time.
Failure to properly select a protection level may result in a process spinning forever on a
CPU in the event of unfortunate preemption.
4-2
Generating Trace Event Logs with ntraceud
In more severe cases, the system may hang; this is only a problem if a user-level interrupt
preempts another user process or daemon at an unfortunate time and attempts to log trace
events to the same trace daemon session.
Data corruption of the trace data will not occur in any case.
<default option>
IPL protection is the safest form of preemption control as it prevents even
machine interrupts from preempting the locking process. This is required
when a user application will be logging events in a user-level interrupt handler (i.e. at system interrupt level).
This is the default preemption control mechanism for PowerMAX OS systems.
NOTE
This mechanism is not available on RedHawk systems. If
selected for RedHawk systems, it is silently translated to the
-resched protection as described below.
-resched
This level of protection is sufficient for user applications that log trace events
as long as no user-level interrupt handlers will be logging trace events. This is
the default preemption control setting for RedHawk Linux.
-ipldisable
Selecting no protection opens up the real possibility that the user process or
the daemon could preempt each other if they are allowed to operate on the
same CPU.
However, appropriate use of CPU bindings and/or priority at which the daemon operates can prevent such occurrences Thus, if the user also takes similar care to schedule their user applications then selecting this is sufficient.
Page locking is required to prevent preemption while holding a spin lock. Without this
choice, it is possible that a page fault could occur while a spin lock is held, allowing for a
user application or daemon to spin forever.
When ntraceud is idle, it sleeps. The process of copying trace events from the shared
memory buffer to a trace event file is called flushing the buffer. ntraceud wakes up and
flushes the buffer when any of these conditions exist:
• ntraceud’s sleep interval elapses
• Τhe buffer-full cutoff percentage is exceeded
• Τhe shared memory buffer is full of unwritten trace events
4-3
NightTrace Manual
• Your application calls trace_flush(), trace_trigger(), or
trace_end()
A summary of NightTrace configuration defaults follows.
Table 4-1. NightTrace Configuration Defaults
Characteristic
Default
Modifying Option
ntraceud sleep interval
5 seconds
-timeout seconds
Buffer-full cutoff percentage
20% full
-cutoff percent
Shared memory buffer size
16K (16,384) trace
events
-memsize count
Flush mechanism
(See above)
-bufferwrap
Trace event file size
Indefinite
-filewrap bytes
Trace events enabled for logging
All
-disable ID and
-enable ID
Page-fault handling
Page locking
-lockdisable
Preemption control
Modify IPL register
(PowerMAX OS)
-ipldisable
Rescheduling variables
(RedHawk Linux)
-resched
ntraceud Modes
4
NightTrace can operate in three modes: expansive (default), file-wraparound, and
buffer-wraparound. As the following two tables show, these modes meet different needs
and have different characteristics. They differ mainly by their handling of the shared
memory buffer and the trace event file on disk.
By default, NightTrace operates in expansive mode. NightTrace operates in file-wraparound mode when you specify the -filewrap option on the ntraceud invocation
line. The ntraceud -bufferwrap option puts NightTrace in buffer-wraparound
mode. See “Option to Establish File-Wraparound Mode (-filewrap)” on page 4-12 and
“Option to Establish Buffer-Wraparound Mode (-bufferwrap)” on page 4-13 for more
information on these options.
It is not possible to combine expansive mode with either file-wraparound or buffer-wraparound mode. Although you can mix file-wraparound and buffer-wraparound modes, it is
not recommended.
Table 4-2 provides some guidelines to help you decide which mode to use.
4-4
Generating Trace Event Logs with ntraceud
Table 4-2. Mode-Selection Guidelines
MODE
Constraint
Expansive
File-Wraparound
Buffer-Wraparound
Trace event
importance
All trace events are
important
Newest trace events
are important
Events just before a
trace_flush()
are important
General
Disk space and memory are plentiful
Disk space is limited
Program will run a
long time
Table 4-3 shows how each NightTrace operating mode reacts to a particular condition.
The process of copying trace events from the shared memory buffer to the trace event file
on disk is called flushing the buffer.
Table 4-3. NightTrace Operating Modes
MODE
Condition
Expansive
File-Wraparound
Buffer-Wraparound
ntraceud sleep
interval exceeded
(-timeout)
Flush the buffer
Flush the buffer
(No reaction)
Buffer-full cutoff
percentage
exceeded
(-cutoff)
Flush the buffer
Flush the buffer
(No reaction)
Shared memory
buffer is full
(-memsize)
Flush the buffer
Flush the buffer
Overwrite the
buffer’s oldest
trace events with
the newest ones
Trace event file is
full (-filewrap)
N/A
Overwrite the
file’s oldest
trace events with
the newest ones
N/A
ntraceud Options
4
ntraceud always copies trace events from the shared memory buffer to the trace event
file, trace_file. You can override some other NightTrace defaults by invoking ntraceud
4-5
NightTrace Manual
with option(s). You can also use options to quit running or reset ntraceud and to obtain
version, statistical, or invocation-syntax information. The full ntraceud invocation
syntax is:
ntraceud
[-help] [-version] [-ipldisable] [-lockdisable]
[-filewrap bytes] [-bufferwrap] [-memsize count]
[-timeout seconds] [-cutoff percent] [-clock source]
[-reset] [-quit] [-quit!] [-stats] [-join]
[[-disable ID[-ID]] [...]] [[-enable ID[-ID]] [...]] trace_file
You can abbreviate all ntraceud options to their shortest unambiguous length, but most
of the examples in this manual use the long option name. These options are
case-insensitive. The following examples are all equivalent:
ntraceud -help
ntraceud -hel
ntraceud -he
ntraceud -h
ntraceud -H
ntraceud -HE
ntraceud -Hel
ntraceud -HELP
You can invoke ntraceud more than once with different options during a single trace
session; each invocation passes additional options and values to the running ntraceud
daemon. Usually you do this to dynamically enable or disable trace events or to obtain
current statistical information. Options that are available only at ntraceud start up are
described that way.
The following sections discuss the ntraceud options.
4-6
Generating Trace Event Logs with ntraceud
Option to Get Help (-help)
4
The ntraceud -help option displays the ntraceud invocation syntax on standard
output.
SYNTAX
ntraceud -help
DESCRIPTION
The ntraceud -help option displays a brief help message showing the complete
invocation syntax for ntraceud. Screen 4-1 shows an example of -help option
output.
usage: ntraceud [-help] [-version] [-ipldisable] [-lockdisable]
[-filewrap bytes] [-bufferwrap] [-memsize count] [-timeout seconds]
[-cutoff percent] [-clock source] [-reset] [-quit] [-stats]
[-disable ID[-ID]] [-enable ID[-ID]] trace_file
General options:
-help
-version
output
Write this message to standard output
Write the current ntraceud version stamp to standard
Options for a new ntraceud daemon:
-ipldisable
Disable use of the IPL register
-lockdisable
Disable use of page locking
-filewrap bytes
Use file wraparound mode with max trace_file size in bytes
-bufferwrap
Use shared memory buffer wraparound mode
-memsize count
Set shared memory buffer size to specified event count
-timeout seconds Set the ntraceud timeout to specified seconds
-cutoff percent
Flush events to disk at specified cutoff level
-clock source
Specify source of event time stamps
Valid values for source are:
default
Use the default system clock
rcim_tick
Use the RCIM synchronized tick clock
Options for an existing ntraceud daemon:
-reset
Reset the ntraceud daemon and the trace_file
-quit
Quit running ntraceud
-stats
Write statistics (resource/environment) to standard output
Options for new and existing ntraceud daemons:
-disable ID[-ID] Disable a specific event ID or ID range from logging
-enable ID[-ID] Enable a specific event ID or ID range to log
Files:
trace_file
Holds events logged by your application and ntraceud
Screen 4-1. Sample Output from the ntraceud -help Option
4-7
NightTrace Manual
Option to Get Version Information (-version)
4
The ntraceud -version option displays the current ntraceud version stamp on
standard output.
SYNTAX
ntraceud -version
DESCRIPTION
The ntraceud -version option displays version stamp information for this
ntraceud daemon.
4-8
Generating Trace Event Logs with ntraceud
Option to Disable the IPL Register (-ipldisable)
4
The ntraceud -ipldisable option disables the default use of the system’s interrupt
priority level (IPL) register by ntraceud and by the NightTrace library routines in your
application.
SYNTAX
ntraceud -ipldisable trace_file
DESCRIPTION
On PowerMAX OS, by default, NightTrace modifies a shared memory region
bound to the system’s interrupt priority level (IPL) register to control preemption.
On RedHawk Linux, by default, NightTrace uses rescheduling variables to prevent
process preemption (this does not prevent preemption by machine interrupts, but
this is not of concern on RedHawk Linux since user applications cannot run at interrupt level).
On PowerMAX OS, if your application lacks read and write privilege to
/dev/spl, the NightTrace daemon and library initialization routine exit with
errors.
On RedHawk Linux, if your application lacks privileges to be able to use rescheding
variables, the NightTrace daemon and library initialization routines will exit with
errors.
If you still want to trace events, you must invoke the ntraceud daemon with the
-ipldisable option. If you use the -ipldisable option, you must start up
ntraceud with it.
You must not use the -ipldisable option if your user-level interrupt routine logs
trace events to the shared memory buffer.
CAUTION
The -ipldisable option should be used with great care to
avoid deadlock. This may occur if more than one LWP, each
biased to run on the same CPU, is logging trace events to a trace
file created by an ntraceud invoked with the -ipldisable
option.
Consider the following scenario: an LWP, preparing to log a trace
event, locks the spin lock to protect the shared memory buffer. It
is preempted by a second LWP which also attempts to log a trace
event. However, due to priority inversion, the first LWP cannot
release the spin lock, causing the second LWP to loop infinitely
4-9
NightTrace Manual
waiting for the spin lock to be released.
This deadlock could be avoided if ntraceud were invoked without the -ipldisable option. This would allow the first LWP to
release the spin lock before being preempted.
SEE ALSO
For more information on the IPL register, see the PowerMAX OS Programming
Guide.
4-10
Generating Trace Event Logs with ntraceud
Option to Prevent Page Locking (-lockdisable)
4
The ntraceud -lockdisable option disables default page locking by ntraceud
and by the NightTrace library routines in your application.
SYNTAX
ntraceud -lockdisable trace_file
DESCRIPTION
You can identify a running ntraceud daemon by its trace event file name,
trace_file.
By default, NightTrace locks its pages in memory. This capability prevents page
faults during trace event logging that could distort trace event timings.
If you lack sufficient privileges required to lock your pages in memory, your
invocation of ntraceud and your application exit with errors. If you still want to
trace events, you must invoke the ntraceud daemon with the -lockdisable
option. This option makes ntraceud and the NightTrace library routines in your
application run without locking their pages in memory. If you use the -lockdisable option, you must start up ntraceud with it.
You must not use the -lockdisable option if your user-level interrupt routine
logs trace events to the shared memory buffer.
4-11
NightTrace Manual
Option to Establish File-Wraparound Mode (-filewrap)
4
By default, the trace event file can grow indefinitely. With the ntraceud -filewrap
option, you can make NightTrace operate in file-wraparound mode, rather than expansive
mode. In file-wraparound mode, you limit the trace event file size.
SYNTAX
ntraceud -filewrap bytes trace_file
DESCRIPTION
The ntraceud -filewrap option lets you specify the maximum byte size, bytes,
of the trace event file, trace_file. Specify the bytes parameter as a number of bytes
or as a number with a K or M suffix to show that the bytes parameter is in kilobyte or
megabyte units, respectively. For example, 12K means 12,288 bytes. If you use the
-filewrap option, you must start up ntraceud with it.
Your application logs enabled trace events into a shared memory buffer. ntraceud
copies these trace events to the trace event file. In expansive mode, this file can
grow indefinitely.
The ntraceud -filewrap option makes NightTrace operate in file-wraparound
mode, rather than in expansive mode. In file-wraparound mode the trace event file
can become full of trace events. When this happens, ntraceud overwrites the
oldest trace events in the beginning of the file with the newest ones, intentionally
discarding the oldest trace events to make room for the newest ones.
In expansive (default) and file-wraparound modes, you control automatic buffer
flushing by setting the ntraceud sleep interval, shared memory size, and
buffer-full cutoff percentage. In contrast, there is no automatic buffer flushing in
buffer-wraparound mode; these values have no effect in this mode.
File-wraparound mode can be beneficial if you are short of disk space. With this
mode, you specify the maximum size of the trace event file, instead of allowing it to
grow indefinitely. Consider using this option if you are interested only in the most
recent of many trace events logged by an application over a long period of time. If
you want to determine how much disk space is available, run the df(1) command
with the -k option and look at the “avail” column.
SEE ALSO
For a comparison of expansive, file-wraparound, and buffer-wraparound modes, see
“ntraceud Modes” on page 4-4.
4-12
Generating Trace Event Logs with ntraceud
Option to Establish Buffer-Wraparound Mode (-bufferwrap)
4
The process of copying trace events from the shared memory buffer to the trace event file
on disk is called flushing the buffer. With the ntraceud -bufferwrap option, you can
make NightTrace operate in buffer-wraparound mode, rather than expansive mode. In
buffer-wraparound mode, the ntraceud daemon flushes only the most recent trace
events, rather than all trace events. Your application asynchronously triggers every buffer
flush.
SYNTAX
ntraceud -bufferwrap trace_file
DESCRIPTION
The ntraceud daemon always logs enabled trace events into a shared memory
buffer. In expansive mode, when the buffer is full (or when some other conditions
exist), ntraceud automatically flushes the buffer to the trace event file, trace_file.
The ntraceud -bufferwrap option makes NightTrace operate in buffer-wraparound mode, rather than in expansive mode. When the buffer is full in buffer-wraparound mode, the application treats the shared memory buffer as a circular queue
and overwrites the oldest trace events with the newest ones, intentionally discarding
the oldest trace events to make room for the newest ones. This overwriting continues
until your application explicitly calls trace_flush(). Only then, does ntraceud copy the remaining trace events from the shared memory buffer to the trace
event file. If you use the -bufferwrap option, you must start up ntraceud with
it.
NOTE
You control automatic buffer flushing by setting the ntraceud
sleep interval and buffer-full cutoff percentage in expansive
(default) mode and in file-wraparound mode. In contrast, there is
no automatic buffer flushing in buffer-wraparound mode; these
values have no effect in this mode. Invoking ntraceud with the
-bufferwrap option, makes ntraceud ignore any -timeout and -cutoff options.
In buffer-wraparound mode, you can estimate the maximum number of trace events
to be written to your trace event file by using the following formula:
max_events = max_events_in_buffer * flush_count
where:
max_events
The maximum number of trace events.
4-13
NightTrace Manual
max_events_in_buffer
The number of trace events the shared memory buffer
can hold. You can set this value when you invoke ntraceud with the -memsize option.
flush_count
The number of trace_flush() calls your application
executes.
For example, if you set your shared memory buffer size to 1000 trace events, then
max_events_in_buffer is 1000. If you expect your three trace_flush()
calls to execute two times each, then flush_count is six (3 * 2). Calculating
max_events gives you about 6000 (1000 * 6) trace events in your trace event file.
Buffer-wraparound mode:
• Can help you with debugging
• Can reduce trace events to a manageable number
• May conserve disk space
Buffer-wraparound mode can be useful in debugging.
Assume that you are debugging a fault in a large application. Follow the steps
below to accomplish your task.
1. Insert a trace_flush() call in your code where you believe the
fault occurs.
2. Compile and link your application.
3. Invoke ntraceud with the -bufferwrap option.
4. Run your application.
When your application executes the trace_flush() call, ntraceud copies all
trace events still in the shared memory buffer to the trace event file. You can then
use the ntrace display utility to graphically analyze only the trace events
immediately preceding the fault.
Buffer-wraparound mode can also be useful in reducing trace events to a
manageable number. In this mode, when the shared memory buffer is full, the
newest trace events overwrite the oldest ones. This means that if the shared memory
buffer becomes full before your application executes the trace_flush() call,
ntraceud copies only the current contents of the buffer to the trace event file. This
way, you can exclude the oldest trace events from your ntrace displays.
In buffer-wraparound mode, ntraceud usually flushes fewer trace events to the
trace event file than in expansive mode. Thus, this mode can conserve disk space.
If you want to determine how much disk space is available, run the df(1)
command with the -k option and look at the “avail” column. Use the following
command to see the system settings for the current, default, minimum, and
maximum shared memory segment size:
$ /etc/conf/bin/idtune -g SHMMAX
See the idtune(1M) man page for more information.
4-14
Generating Trace Event Logs with ntraceud
SEE ALSO
For more information on trace_flush(), see “trace_flush() and trace_trigger()”
on page 2-20. For a comparison of expansive, file-wraparound, and buffer-wraparound modes, see “ntraceud Modes” on page 4-4. For information on limiting the
number of logged trace events, see “Option to Define Shared Memory Buffer Size
(-memsize)” on page 4-16.
4-15
NightTrace Manual
Option to Define Shared Memory Buffer Size (-memsize)
4
By default, the shared memory buffer can hold 16,384 trace events. When the buffer is full
of unwritten trace events, the ntraceud daemon wakes up and copies the trace events to
the trace event file. The ntraceud -memsize option lets you alter the size of the shared
memory buffer.
SYNTAX
ntraceud -memsize count trace_file
DESCRIPTION
The ntraceud -memsize option lets you set the shared memory buffer size.
Specify the count parameter as a maximum number of trace events or as a number
with a K or M suffix to show that the count parameter is in kilobyte or megabyte
units, respectively. For example, 12K means 12,288 trace events. ntraceud
rounds that number up to a full page boundary. A trace event with zero or one
argument takes up 16 bytes; a trace event with more arguments takes up 32 bytes: 16
byt es f or t he basic tr ace even t and o ne ar gumen t and 1 6 by tes for the
NT_CONTINUE overhead trace event and the remaining arguments.
On PowerMAX OS, use the following command to see the system settings for the
current, default, minimum, and maximum shared memory segment size:
$ /etc/conf/bin/idtune -g SHMMAX
See the idtune(1M) man page for more information.
By default, if the shared memory buffer becomes full, ntraceud wakes up and
copies trace events from the shared memory buffer to the trace event file, trace_file.
You can increase the count parameter to prevent trace event loss. If you use the
-memsize option, you must start up ntraceud with it.
By changing the shared memory buffer size, you can:
• Alter the buffer flush frequency
• Control the number of trace events copied to the trace event file in
buffer-wraparound mode
SEE ALSO
For information on limiting the number of logged trace events, see “Option to Establish Buffer-Wraparound Mode (-bufferwrap)” on page 4-13.
4-16
Generating Trace Event Logs with ntraceud
Option to Set Timeout Interval (-timeout)
4
By default, ntraceud sleeps 5 seconds after writing trace events to disk. The
ntraceud -timeout option lets you set this timeout interval.
SYNTAX
ntraceud -timeout seconds trace_file
DESCRIPTION
You can identify a running ntraceud daemon by its trace event file name,
trace_file.
When ntraceud is idle, the daemon sleeps. By default, the sleep interval is a
maximum of 5 seconds. The ntraceud -timeout option lets you establish the
maximum number of seconds, seconds, that the ntraceud daemon sleeps.
Waking the ntraceud daemon incurs overhead that can distort trace event timings;
decreasing the timeout parameter makes it more likely that the daemon will be
awake when needed. You can also decrease the timeout parameter to prevent trace
event loss. Note: If your application does not log events frequently, you can increase
the timeout to reduce the time the daemon runs and consumes CPU cycles.
If you use the -timeout option, you must start up ntraceud with it. If you
invoke ntraceud with both the -timeout and -bufferwrap options,
ntraceud ignores the -timeout option.
ntraceud does not sleep for the full period if:
• Your
application executes a call to
trace_trigger(), or trace_end()
trace_flush(),
• Your application logs a trace event that causes shared memory to
become full or your buffer-full cutoff percentage to be reached
• You specify a timeout parameter which exceeds the time in which the
lower 32 bits of the timestamp source would roll over. This rollover
time varies from architecture to architecture (with a minimum value
of 257.69803 seconds) and is calculated by ntraceud as part of its
initialization. It is important to detect this rollover so that proper
ordering of trace events is maintained. If you specify a timeout interval which exceeds the rollover time, ntraceud uses the rollover
time as the timeout interval, ignoring the value specified.
4-17
NightTrace Manual
Option to Set the Buffer-Full Cutoff Percentage (-cutoff)
4
By default, when the shared memory buffer becomes 20-percent full of unwritten trace
events, the ntraceud daemon wakes up and copies the trace events to the trace event
file. The ntraceud -cutoff option lets you alter this percentage.
SYNTAX
ntraceud -cutoff percent trace_file
DESCRIPTION
The ntraceud -cutoff option lets you set the buffer-full cutoff percentage,
percent, for the shared memory buffer. percent is an integer percentage in the range
0-99, inclusive.
The process of copying trace events from the shared memory buffer to the trace
event file, trace_file, on disk is called flushing the buffer. When a logged trace event
causes the buffer to reach the buffer-full cutoff percentage, ntraceud wakes up
and flushes the buffer.
Waking the ntraceud daemon incurs overhead that can distort trace event timings;
decreasing the shared memory buffer-full cutoff percentage makes it more likely
that the daemon will be wakened by the application. You can also decrease the percent parameter to prevent trace event loss; the effect is an increase in the buffer flush
frequency.
If you use the -cutoff option, you must start up ntraceud with it. If you invoke
ntraceud with both the -cutoff and -bufferwrap options, ntraceud
ignores the -cutoff option.
4-18
Generating Trace Event Logs with ntraceud
Option to Select Timestamp Source (-clock)
4
The ntraceud -clock option allows you to select which timing source will be used to
timestamp events.
SYNTAX
ntraceud -clock source trace_file
DESCRIPTION
The ntraceud -clock option lets you select the timing source used to timestamp
trace events. Valid source values are:
default
the interval timer (NightHawk 6000 Series) or the Time
Base Register (Power Hawk/PowerStack)
rcim_tick
the RCIM synchronized tick clock
If you invoke ntraceud with the -clock option, you must supply a value for the
source.
If rcim_tick is specified for the source and the system on which you are tracing
does not have an RCIM installed or configured or if the RCIM synchronized tick
clock on the system on which you are tracing is stopped, the NightTrace daemon
and library initialization routine exit with errors.
If the -clock option is not specified, the interval timer (NightHawk 6000 Series)
or the Time Base Register (Power Hawk/PowerStack) is used to timestamp trace
events.
4-19
NightTrace Manual
Option to Reset the ntraceud Daemon (-reset)
4
The ntraceud -reset option resets a running ntraceud daemon process.
SYNTAX
ntraceud -reset trace_file
DESCRIPTION
Running ntraceud daemons are located using the shared memory identifier keyed
by the trace event file name, trace_file.
By default, ntraceud overwrites the trace event file if it is not currently in use. In
contrast, the ntraceud -reset option empties the file and prepares the running
daemon for another trace run. Use the -reset option when you are no longer interested in the contents of an active trace event file. You can invoke ntraceud multiple times with the -reset option.
SEE ALSO
For information on quitting an ntraceud session without clearing the trace event
file, see “Option to Quit Running ntraceud (-quit)” on page 4-21.
4-20
Generating Trace Event Logs with ntraceud
Option to Quit Running ntraceud (-quit)
4
The ntraceud -quit and -quit! options terminate a running ntraceud process.
SYNTAX
ntraceud -quit trace_file
ntraceud -quit! trace_file
DESCRIPTION
Running ntraceud daemons are located using the shared memory identifier keyed
by the trace event file name, trace_file.
A process completes its NightTrace session by calling trace_end() or exiting
normally. The -quit and -quit! option instruct ntraceud to terminate tracing.
When -quit is used, ntraceud will wait for all user processes associated with
this daemon that are currently tracing to terminate, whereas use of -quit! skips
this check. The following actions are then taken:
• Remaining trace events are flushed to the trace event file
• The output file is closed
• The shared memory buffer is removed (unless user applications still
exist)
• The running ntraceud daemon terminates
TIP:
You cannot get statistical information after you quit running ntraceud. Consider
getting statistical information before you quit running ntraceud. For statistical
information on your trace session, see “Option to Present Statistical Information
(-stats)” on page 4-22.
Assume that you have invoked ntraceud with the -quit option, and you want to
reinvoke ntraceud with the same trace event file. Your next ntraceud
invocation will automatically overwrite the trace event file.
SEE ALSO
For information on resetting ntraceud and the trace event file for another session,
see “Option to Reset the ntraceud Daemon (-reset)” on page 4-20.
4-21
NightTrace Manual
Option to Present Statistical Information (-stats)
4
The ntraceud -stats option presents a display of statistical information for a running
ntraceud daemon on standard output.
SYNTAX
ntraceud -stats trace_file
DESCRIPTION
Running ntraceud daemons are located using the shared memory identifier keyed
by the trace event file name, trace_file.
The -stats option provides statistical information that tells you about your current
NightTrace configuration and resource use. This information can help you determine if you have adequate resources for your application. If you are interested in
watching changes in the statistics, invoke ntraceud multiple times with the
-stats option.
Specifically, the -stats option provides information on:
• ntraceud mode. ntraceud may run in the following modes:
-
NT_M_DEFAULT, meaning expansive (default) mode
NT_M_FILEWRAP, meaning file-wraparound mode
NT_M_BUFFERWRAP, meaning buffer-wraparound mode
• Shared memory buffer size
• Buffer-full cutoff percentage
• ntraceud timeout interval
• Number of threads or processes logging in your application
• Number of times trace events were lost. This statistic refers to a
situation that infrequently arises during a NightTrace session.
ntraceud may lose some trace events if the trace events enter the
shared memory buffer faster than ntraceud can copy them to the
trace event file. For more information on this topic, see “Preventing
Trace Events Loss” on page A-1.
• Number of automatic buffer flushes (For more information on buffer
flushes, see “trace_flush() and trace_trigger()” on page 2-20.)
• Number of trace events logged to shared memory. ntraceud and
some NightTrace library routines occasionally log predefined trace
events into the shared memory buffer. Therefore, the statistic for
number of trace events logged to shared memory may exceed the
number of times your application logs a trace event.
• Trace event IDs enabled
Screen 4-2 shows a sample of -stats option output.
4-22
Generating Trace Event Logs with ntraceud
$ ntraceud -stats log
NTRACEUD STATISTICS
The ntraceud daemon is running in NT_M_DEFAULT mode.
There is a maximum of 16384 trace events in the shared memory buffer
The buffer-full threshold is 20% or 3276 trace events
The daemon timeout period is 5 seconds
There are 1 thread(s) logging trace events
The shared memory buffer had 0 events lost
There have been 0 unrequested buffer flushes
The total number of trace events logged to shared memory is 5
Enabled Events:
0-4095
Screen 4-2. Sample Output from ntraceud -stats Option
Defaults for s ome of these values exist in the header file
/usr/include/ntrace.h. You can override the default values with
ntraceud options. See Table 4-1 for more information on the default values and
the corresponding options used to override them.
SEE ALSO
For information on trace event loss prevention, see “Option to Establish File-Wraparound Mode (-filewrap)” on page 4-12, “Option to Set Timeout Interval (-timeout)”
on page 4-17, and “Option to Set the Buffer-Full Cutoff Percentage (-cutoff)” on
page 4-18.
4-23
NightTrace Manual
Option to Disable Logging (-disable)
4
By default, all trace events are enabled for logging to the shared memory buffer. The
ntraceud -disable option makes the application ignore requests to log a specific
trace event or range of trace events.
SYNTAX
ntraceud -disable ID [...] trace_file
ntraceud -disable ID_low-ID_high [...] trace_file
DESCRIPTION
Sometimes ntraceud logs so many trace events that it is hard to understand the
ntrace display. Occasionally you know that a particular trace event or trace event
range is not interesting at certain times but is interesting at others. When either of
these conditions exist, it is useful to disable the extraneous trace events. You can
disable trace events temporarily, where you disable and later re-enable them. You
can also disable trace events permanently, where you disable them before the
application runs or during its execution and never re-enable them.
In the first format, the ntraceud -disable option dynamically disables a
specific trace event ID, ID, from logging to the shared memory buffer. In the second
format, the ntraceud -disable option dynamically disables a range of trace
event IDs, ID_low through ID_high, from logging to the shared memory buffer. In
either case, trace event IDs are integers in the range 0-4095, inclusive. At defined
times, ntraceud copies trace events from the shared memory buffer to the trace
event file, trace_file.
NOTE
The -disable option disables trace events in all processes that
rely on the same ntraceud daemon to log to the same trace
event file.
This first format provides the same functionality as the trace_disable() NightTrace library routine. The second format provides the same functionality as the
trace_disable_range() NightTrace library routine. One advantage of using
the -disable option rather than the library routine is that you do not have to
re-edit, recompile, and relink your application. For more information on disable
library routines, see “trace_enable(), trace_disable(), and Their Variants” on page
2-16.
Note: In the following text, the names of the trace event files are varied for interest.
You can start up ntraceud with the -disable (-d) option. You can also
re-invoke ntraceud with this option while ntraceud is running. Furthermore,
using the -disable option to disable an already disabled trace event has no effect.
For example, assume that you invoke ntraceud three times, sequentially, before
your application terminates and that ntraceud has not logged to the ntoutput
file before.
4-24
Generating Trace Event Logs with ntraceud
$ ntraceud -d4 ntoutput -- trace event 4 is disabled
$ ntraceud -d7 ntoutput -- trace events 4 & 7 are now disabled
$ ntraceud -d4 ntoutput -- no effect; trace events 4 & 7 disabled
There may be any number of -disable options on an ntraceud invocation line.
The following example illustrates this fact.
$ ntraceud -d10 -d15 mytrace -- trace events 10 & 15 are disabled
You may specify a hyphenated trace event range on the ntraceud invocation line.
The following example depicts this case.
$ ntraceud -d23-25 traceoutput -- events 23, 24, and 25 disabled
The following two sequences show how important timing can be when you use the
-disable option. The same steps appear in both sequences, but their order differs.
When the first sequence ends, nothing has been logged and all trace events are
enabled. In contrast, when the second sequence ends, trace event 52 has been logged
once and is now disabled.
Table 4-4. ntraceud Disable Sequence #1
From the Shell
From the Application
Comments
1. Invoke ntraceud
All trace events enabled
2. Invoke ntraceud -d52
Trace event 52 disabled
3. Start application
4.
Call trace_event(52)
Trace event 52 not logged
5.
Call trace_enable(52)
Trace event 52 enabled
Table 4-5. ntraceud Disable Sequence #2
From the Shell
From the Application
Comments
1. Invoke ntraceud
All trace events enabled
2. Start application
Trace event 52 enabled
3.
Call trace_event(52)
Trace event 52 logged
4.
Call trace_enable(52)
No effect
5. Invoke ntraceud -d52
Trace event 52 disabled
SEE ALSO
For information on enabling trace events, see “Option to Enable Logging (-enable)”
on page 4-26 and “trace_enable(), trace_disable(), and Their Variants” on page 2-16.
4-25
NightTrace Manual
Option to Enable Logging (-enable)
4
By default, all trace events are enabled for logging to the shared memory buffer. The
ntraceud -enable option makes the application notice previously disabled requests to
log a specific trace event or a range of trace events.
SYNTAX
ntraceud -enable ID [...] trace_file
ntraceud -enable ID_low-ID_high [...] trace_file
DESCRIPTION
In the first format, the ntraceud -enable option dynamically re-enables a
specific disabled trace event ID, ID, for logging to the shared memory buffer. In the
second format, the ntraceud -enable option dynamically re-enables a range of
disabled trace event IDs, ID_low through ID_high, for logging to the shared memory
buffer. In either case, trace event IDs are integers in the range 0-4095, inclusive. At
defined times, ntraceud copies trace events from the shared memory buffer to the
trace event file, trace_file.
NOTE
The -enable option affects all processes that rely on the same
ntraceud daemon to log to the same trace event file.
The first format provides the same functionality as the trace_enable() NightTrace library routine. The second format provides the same functionality as the
trace_enable_range() NightTrace library routine. One advantage of using
the ntraceud option instead of the library routine is that you do not have to
re-edit, recompile, and relink your application. For more information on enable
library routines, see “trace_enable(), trace_disable(), and Their Variants” on page
2-16.
In the following text, the names of the trace event files are varied for interest.
Unless otherwise stated, all the following examples describe the results of a
non-startup ntraceud invocation.
There may be any number of -enable (-e) options on an ntraceud invocation
line. The following example illustrates this fact.
$ ntraceud -e10 -e15 mytrace -- trace events 10 and 15 enabled
You may specify a hyphenated trace event range on the ntraceud invocation line.
The following example depicts this case.
$ ntraceud -e23-25 traceoutput -- trace events 23, 24, & 25
enabled
4-26
Generating Trace Event Logs with ntraceud
The -enable option acts differently when you use it:
• On ntraceud start up
• On later ntraceud invocations
If you start up ntraceud with the -enable option, the specified trace event(s) are
the only one(s) enabled; all other trace events are disabled. For example, if the following invocation starts up ntraceud, then only trace event 18 is enabled.
$ ntraceud -e18 traceout
When you use the -enable option on non-startup ntraceud invocations, NightTrace adds the specified trace event(s) to the list of enabled trace events. Furthermore, attempting to enable an already enabled trace event has no effect. For
example, assume that you invoke ntraceud four times, sequentially, before your
application terminates and that ntraceud has not logged to the ntoutput file
before.
$
$
$
$
ntraceud
ntraceud
ntraceud
ntraceud
ntoutput
-- all trace events enabled
-d4 -d7 ntoutput -- all except 4 and 7 enabled
-e4 ntoutput
-- all except 7 enabled
-e4 ntoutput
-- no effect; all except 7 enabled
The following two sequences show how important timing can be when you use the
-enable option. The same steps appear in both sequences, but their order differs.
When the first sequence ends, nothing has been logged and all trace events are
enabled. In contrast, when the second sequence ends, trace event 52 has been
logged once and is now disabled.
Table 4-6. ntraceud Enable Sequence #1
From the Shell
From the Application
1. Invoke ntraceud
2.
Comments
All trace events enabled
Start application
3.
Call trace_disable(52)
Trace event 52 disabled
4.
Call trace_event(52)
Trace event 52 not logged
5. Invoke ntraceud -e52
Trace event 52 enabled
Table 4-7. ntraceud Enable Sequence #2
From the Shell
From the Application
1. Invoke ntraceud
2.
All trace events enabled
Start application
3.
Call trace_event(52)
4. Invoke ntraceud -e52
5.
Comments
Trace event 52 logged
No effect
Call trace_disable(52)
Trace event 52 disabled
4-27
NightTrace Manual
SEE ALSO
For information on disabling trace events, see “Option to Disable Logging (-disable)” on page 4-24 and “trace_enable(), trace_disable(), and Their Variants” on
page 2-16.
Invoking ntraceud
4
This section shows a few common ntraceud invocation examples. In each example, the
trace_file argument corresponds to the trace event file name you supply on your call to the
trace_begin() library routine.
Normally, your first ntraceud invocation looks something like the following sample.
ntraceud trace_file
Th e next sample invocation assumes that you lack both page lock pr iv ilege
(-lockdisable) and read and write access to /dev/spl needed to modify the
interrupt priority level register (-ipldisable), or lack sufficient privileges required for
rescheduling variables.
ntraceud -lockdisable -ipldisable trace_file
The following invocation might be used when tuning your NightTrace configuration
because you lost trace events last time.
ntraceud -memsize count -cutoff percent trace_file
There are several times when you may want to use the following invocation. Usually this
invocation is appropriate if you are using trace_flush() calls to debug a fault in your
application or to reduce the number of logged trace events so the ntrace display is more
readable.
ntraceud -bufferwrap trace_file
The following invocation is also useful on several occasions. One example is if you want
to conserve disk space.
ntraceud -filewrap bytes trace_file
The following invocation waits for all user applications associated with the running
ntraceud daemon to terminate, flushes remaining trace events to the trace event file,
closes the file, removes the shared memory buffer, then terminates the running ntraceud.
ntraceud -quit trace_file
Similarly, the following invocation immediately flushes remaning trace events to the trace
file, closes the file, and terminates the running ntraceud daemon. User applications can
continue to run and make NightTrace API calls, but no trace events will be logged. Subsequently, a new user daemon can be initiated and trace events will start beging logged
again:
4-28
Generating Trace Event Logs with ntraceud
ntraceud -quit! trace_file
At this point, you can begin data analysis.
Exercise: Logging Trace Events
4
The following exercise has you log trace events. It is a continuation of “Exercise: Instrumenting Code” on page 2-25.
1. Compile and link entry_exit.c with the ntrace library. Give the
executable the name entry_exit.
2. Start the ntraceud daemon. (Look at the trace_start call to
determine the trace event file name.) You may need some additional
options if you cannot lock pages in memory or cannot read and write to the
IPL register.
3. Execute the entry_exit program.
4. Get the ntraceud daemon to give you statistics.
5. When the program completes, stop the ntraceud daemon.
An example solution follows.
$
$
$
$
$
cc -Xa -o entry_exit entry_exit.c -lntrace -lud
ntraceud log
entry_exit
ntraceud -stats log
ntraceud -quit log
This exercise continues in “Exercise: Displaying Trace Events” on page 5-35.
4-29
NightTrace Manual
4-30
5
Invoking the ntrace Display Utility
Overviewc . . . . . . . . . . . . . . . . . . . . . . . . . . . . . . . . . . . . . . . . . . . . . . . . . . . . . . . . .
X and NightTrace Vocabulary . . . . . . . . . . . . . . . . . . . . . . . . . . . . . . . . . . . . . . . . . .
System Environment . . . . . . . . . . . . . . . . . . . . . . . . . . . . . . . . . . . . . . . . . . . . . . . . .
Invoking ntrace . . . . . . . . . . . . . . . . . . . . . . . . . . . . . . . . . . . . . . . . . . . . . . . . . . . . .
ntrace Options . . . . . . . . . . . . . . . . . . . . . . . . . . . . . . . . . . . . . . . . . . . . . . . . . . . . . .
ntrace Arguments. . . . . . . . . . . . . . . . . . . . . . . . . . . . . . . . . . . . . . . . . . . . . . . . . . . .
Understanding Trace Event Files . . . . . . . . . . . . . . . . . . . . . . . . . . . . . . . . . . . .
Understanding Event-Map Files. . . . . . . . . . . . . . . . . . . . . . . . . . . . . . . . . . . . .
Understanding Page Configuration Files . . . . . . . . . . . . . . . . . . . . . . . . . . . . . .
ntrace Tables . . . . . . . . . . . . . . . . . . . . . . . . . . . . . . . . . . . . . . . . . . . . . . . .
String Tables. . . . . . . . . . . . . . . . . . . . . . . . . . . . . . . . . . . . . . . . . . . . .
Pre-Defined String Tables . . . . . . . . . . . . . . . . . . . . . . . . . . . . . . . . . .
Format Tables. . . . . . . . . . . . . . . . . . . . . . . . . . . . . . . . . . . . . . . . . . . .
Pre-Defined Format Tables . . . . . . . . . . . . . . . . . . . . . . . . . . . . . . . . .
Configuring Display Pages . . . . . . . . . . . . . . . . . . . . . . . . . . . . . . . . . . . . .
ntrace User Interface . . . . . . . . . . . . . . . . . . . . . . . . . . . . . . . . . . . . . . . . . . . . . . . . .
Using the Mouse. . . . . . . . . . . . . . . . . . . . . . . . . . . . . . . . . . . . . . . . . . . . . . . . .
Understanding Pointer Shapes . . . . . . . . . . . . . . . . . . . . . . . . . . . . . . . . . . . . . .
Anticipating Window Layout . . . . . . . . . . . . . . . . . . . . . . . . . . . . . . . . . . . . . . .
Resizing Windows . . . . . . . . . . . . . . . . . . . . . . . . . . . . . . . . . . . . . . . . . . . . . . .
ntrace Notation Conventions . . . . . . . . . . . . . . . . . . . . . . . . . . . . . . . . . . . . . . . . . . .
ntrace Global Window . . . . . . . . . . . . . . . . . . . . . . . . . . . . . . . . . . . . . . . . . . . . . . . .
Message Display Area . . . . . . . . . . . . . . . . . . . . . . . . . . . . . . . . . . . . . . . . . . . .
Menu Bar . . . . . . . . . . . . . . . . . . . . . . . . . . . . . . . . . . . . . . . . . . . . . . . . . . . . . .
NightTrace Menu Item . . . . . . . . . . . . . . . . . . . . . . . . . . . . . . . . . . . . . . . .
New Page . . . . . . . . . . . . . . . . . . . . . . . . . . . . . . . . . . . . . . . . . . . . . . .
Default Page. . . . . . . . . . . . . . . . . . . . . . . . . . . . . . . . . . . . . . . . . . . . .
Open Config File . . . . . . . . . . . . . . . . . . . . . . . . . . . . . . . . . . . . . . . . .
Read Event-Map File . . . . . . . . . . . . . . . . . . . . . . . . . . . . . . . . . . . . . .
Exit . . . . . . . . . . . . . . . . . . . . . . . . . . . . . . . . . . . . . . . . . . . . . . . . . . . .
Tools Menu Item . . . . . . . . . . . . . . . . . . . . . . . . . . . . . . . . . . . . . . . . . . . . .
Help Menu Item . . . . . . . . . . . . . . . . . . . . . . . . . . . . . . . . . . . . . . . . . . . . .
The File Selection Dialog Box . . . . . . . . . . . . . . . . . . . . . . . . . . . . . . . . . . . . . . . . .
Typing in the Exact File Name . . . . . . . . . . . . . . . . . . . . . . . . . . . . . . . . . . . . . .
Scrolling Through Existing File Names . . . . . . . . . . . . . . . . . . . . . . . . . . . . . . .
Typing in a Filter (File Name Pattern) . . . . . . . . . . . . . . . . . . . . . . . . . . . . . . . .
Exercise: Displaying Trace Events . . . . . . . . . . . . . . . . . . . . . . . . . . . . . . . . . . . . . .
5-1
5-1
5-2
5-3
5-3
5-8
5-9
5-9
5-11
5-12
5-13
5-14
5-17
5-20
5-20
5-21
5-21
5-22
5-22
5-24
5-24
5-25
5-25
5-26
5-26
5-27
5-28
5-30
5-31
5-32
5-32
5-33
5-33
5-33
5-34
5-35
5-35
NightTrace Manual
5
Chapter 5Invoking the ntrace Display Utility
5
5
5
Overviewc
5
The trace event display utility, ntrace, is an interactive, graphical debugging and
performance analysis tool. ntrace textually presents trace run statistics. As a tool built
on the X Window System, it can graphically displays user trace events and system trace
events as well as manages the configuration and operation of user and kernel daemons to
collect trace data.
ntrace is flexible: you choose the look of your graphical display pages. ntrace
provides many different built-in graphical components called display objects. You can
color, select, size, position, and group these objects and direct particular trace events to
specific objects; this is called configuring display objects. There are also ways to label
trace events, trace event arguments, and other numeric values.
This chapter covers the following topics:
• X and NightTrace vocabulary
• System environment
• ntrace invocation
• ntrace options
• ntrace arguments
• ntrace user interface
• ntrace notation conventions
• ntrace Global Window
X and NightTrace Vocabulary
5
The Massachusetts Institute of Technology developed a windowing system called the X
Window System, or X for short. If you are unfamiliar with standard X terminology, you
may find the glossary near the end of this manual useful. It contains definitions of words
and phrases about:
• X applications in general
• The ntrace display utility
5-1
NightTrace Manual
• Window components
• Common push buttons and menu item labels
• Mouse operations
System Environment
5
To run the ntrace display utility, you need an installed X server. ntrace uses an X
server to support windowing in trace event displays.
Motif is a user environment based on X. The window images in this manual come from a
Motif environment. If you are using another environment, your windows may differ
slightly from those presented here.
ntrace displays appear on your terminal only if you set your DISPLAY environment
variable. Determine if this variable is set by issuing the following command:
$ echo $DISPLAY
If this variable is not set, you must set it manually to a value based on the name of your X
server. For example, in Bourne shell, set the DISPLAY environment variable for a
terminal named “eagle” this way:
$ DISPLAY=eagle:0.0
$ export DISPLAY
In the Korn shell, this is:
$ export DISPLAY=eagle:0.0
In the C shell, this is:
% setenv DISPLAY eagle:0.0
The .Xdefaults (or .Xresources) file in your login directory establishes default
environmental settings for your X sessions. You may use special ntrace settings in this
file to customize your ntrace displays.
ntrace runs on both monochrome and color monitors. See Appendix B for information
about setting color and other X resources that pertain to ntrace.
TIP:
Experiment with colors and shadings until you find a set you like. To avoid visual fatigue,
use highly-contrasting colors and values sparingly.
For more information on window system concepts or Motif, see “Recommended Reading”
on page 1-7.
5-2
Invoking the ntrace Display Utility
Invoking ntrace
5
The ntrace display utility resides on your system under /usr/bin/ntrace. It is the
graphical user interface to trace event analysis. If you do not have any ntrace-related
files but you still want to try out this tool, just type:
$ ntrace
You can override some default functionality by invoking ntrace with options and
arguments. The full ntrace invocation syntax is:
ntrace
[-help] [-version] [-listing] [-mgr] [-filestats]
[-nohardclock] [-process { all | name | PID } ]
[-start { offset | time{s|u} | percent% } ]
[-end
{ offset | time{s|u} | percent% } ]
[-flat color] [-Xoption ...] [file ...]
Depending on your ntrace options and arguments, when you invoke ntrace, it:
• Loads all trace event information into memory
• Checks the syntax of specifications in each file argument
• Processes each file argument
• Loads any display pages and their objects into memory
• Presents any display pages (See Chapter 6.)
• Displays the Global Window (See “ntrace Global Window” on page
5-25.)
The following sections discuss the ntrace options and arguments.
ntrace Options
5
You can abbreviate all ntrace options to their shortest unambiguous length, but most of
the examples in this manual use the long option name. These options are case-insensitive.
The following examples are all equivalent:
ntrace -help
ntrace -hel
ntrace -he
ntrace -h
ntrace -H
ntrace -HE
ntrace -Hel
ntrace -HELP
ntrace options include:
5-3
NightTrace Manual
Displays the ntrace invocation syntax on standard output
and exits. Screen 5-1 shows an example.
-help
$ ntrace -help
usage: ntrace
[-help] [-version] [-listing]
[-filestats] [-nohardclock] [-process {all | name | PID}]
[-start {offset | time{s|u} | percent%}]
[-end
{offset | time{s|u} | percent%}] [-flat color]
[-Xoption ...] [file ...]
Options that write to standard output:
-help
Write this message to standard output
-version
Write current ntrace version stamp to standard output
-listing
Chronologically list all events to standard output
-filestats
Write simple trace_file statistics to standard output
Options to select events:
-nohardclock
Do not load
-process all
Load kernel
-process name
Load kernel
-process PID
Load kernel
-start offset
Load events
-start time{s|u}
Load events
-start percent%
Load events
-end offset
Load events
-end time{s|u}
Load events
-end percent%
Load events
kernel hardclock interrupt events
events for all user-traced processes
events associated with process_name
events associated with PID
after the specified event offset
after the specified relative time
after the specified percent of total events
before the specified event offset
before the specified relative time
before the specified percent of total events
Options for graphical displays:
-flat color
Color to use for all flat areas and frames
-Xoption
Any standard X Toolkit command line options (see X(1))
Files:
config_file
event_map_file
trace_file
Holds configuration information: display pages,
macro definitions, qualified events, qualified
states and tables
Maps event ID numbers with event tag names
Holds events logged by your application and ntraceud
Screen 5-1. Sample Output from the ntrace -help Option
-version
Displays the current ntrace version stamp on standard output
and exits.
-mgr
Starts the NightTrace graphical interface and pops up the session manager dialog for configuration and control of user and
kernel daemons.
-listing
Chronologically lists all trace events in the trace event file(s) to
standard output and exits. The output includes the following
information about a trace event: relative timestamp, trace event
ID, any trace event argument(s), the global process identifier
(PID) or thread name, and the CPU. The timestamp for the first
trace event is zero seconds (0s). All other timestamps are relative to the first one.
If you supply an event-map file on the invocation line,
ntrace displays symbolic trace event tags instead of numeric
trace event IDs, and ntrace displays trace event arguments in
5-4
Invoking the ntrace Display Utility
the format you specify in the file, rather than the hexadecimal
default format. For more information on event-map files, see
“Understanding Event-Map Files” on page 5-9.
In kernel tracing, the vectors file provides names for system
processes, interrupts, and exceptions.
Screen 5-2 and Screen 5-3 show examples from a kernel trace
event file.
(Note that when viewing a user trace event file, a kernel trace
event file is required in order to resolve which CPU each process was logging trace events from. See Chapter 11 for more
information.)
NOTE
The information associated with the node field appears in this
listing only when NightTrace is configured to use an RCIM to
timestamp events.
5536: cpu=01 TR_PAGEFLT_ADDR pid=scheme
S user instr page fault PC=0x1000fd54
5537: cpu=01 TR_EXCEPTION_SUS pid=scheme
S vector=inst access
5538: cpu=01 TR_SWITCHIN
pid=idle
S arg1=
0
5539: cpu=00 TR_INTERRUPT_ENT pid=idle
S vector=hardclock
level=1
5540: cpu=00 TR_INTERRUPT_EXI pid=idle
S vector=hardclock
level=0
5541: cpu=01 TR_INTERRUPT_ENT pid=idle
S vector=softclock
level=1
5542: cpu=01 TR_INTERRUPT_EXI pid=idle
S vector=softclock
level=0
tid=1241'0
time=
8.305265
tid=1241'0
time=
8.305441
tid=0'0
time=
8.305441
tid=0'0
time=
8.313355
tid=0'0
time=
8.313408
tid=0'0
time=
8.313416
tid=0'0
time=
8.313425
Screen 5-2. Example of ntrace -listing Output (with instr page fault)
5-5
NightTrace Manual
13390: cpu=01 TR_PAGEFLT_ADDR pid=ls
tid=1250'0
S user data page fault addr=0x300ad1c0 (PC=0xb0121fbc)
13391: cpu=01 TR_EXCEPTION_EXI pid=ls
tid=1250'0
S vector=data access
13392: cpu=01 TR_SYSCALL_ENTRY pid=ls
tid=1250'0
S syscall=read device=file
13393: cpu=01 TR_EXCEPTION_ENT pid=ls
tid=1250'0
S vector=data access
13394: cpu=01 TR_PAGEFLT_ADDR pid=ls
tid=1250'0
S kernel data page fault addr=0xe1e18000 (PC=0x000931cc)
13395: cpu=01 TR_EXCEPTION_EXI pid=ls
tid=1250'0
S vector=data access
13396: cpu=01 TR_SYSCALL_EXIT pid=ls
tid=1250'0
S syscall=read device=file
13397: cpu=01 TR_SYSCALL_ENTRY pid=ls
tid=1250'0
S syscall=close device=file
time= 14.194342
time= 14.194460
time= 14.194473
time= 14.194528
time= 14.194534
time= 14.194590
time= 14.194659
time= 14.194715
Screen 5-3. Example of ntrace -listing Output (with data page fault)
-filestats
Displays simple statistics about all trace event file(s)
arguments to standard output, similar to the display on the
Glo bal Window, and exits. (See “ntrace Global Window” on
page 5-25.) The statistics are grouped by trace event file, with
cumulative statistics for all trace event files. The statistics
include: the number of trace event files, their names, the number of trace events logged, and the number of trace events lost.
Screen 5-4 shows an example, with:
log The user trace event file.
map The event-map file.
continuation events The NT_CONTINUE trace events that ntraceud
logs for multi-argument trace events.
amber2> ntrace -filestats n1.cap vectors.cap | p
1 trace event log file read.
Kernel trace event log file: n1.cap.
10916 trace events plus 9863 continuation events.
10916 events saved in memory.
0 trace events lost.
52.4036288s time span, from 0.0000000s to 52.4036288s.
RCIM synchronized tick clock was used to time stamp events.
10916 total events read from disk plus 9863 continuation events.
10916 total events saved in memory; 1 events internal to ntrace.
0 total trace events lost.
52.4036288s total time span saved in memory.
Screen 5-4. Example of ntrace -filestats Output
5-6
Invoking the ntrace Display Utility
By default, when ntrace starts up, it reads and loads all trace events from all trace event
files into memory; therefore, the more trace events in your trace event file(s), the more
memory ntrace uses. The -nohardclock, -process, -start, and -end options
let you prevent the loading, but not the reading, of certain trace events.
-nohardclock
Do not load hardclock interrupts from the kernel trace event
file. This option may save about 15% of the memory ntrace
consumes. For more information on the hardclock interrupt,
see “Hardclock Interrupt Handling” in the PowerMAX OS
Real-Time Guide.
If you invoke ntrace with the -process option, it loads only exceptions and system
calls of processes you specify after the -process; this takes some extra processing time
during ntrace start up. You can invoke ntrace with multiple -process options.
The possible ways to use the -process option include:
-process all
From the NightTrace kernel trace event file, load only exceptions and system calls associated with process(es) in the user
trace event file(s). This implies that you invoke ntrace with
both a kernel trace event file and user trace event file(s).
-process PID
From the NightTrace kernel trace event file, load only exceptions and system calls associated with this global process identifier (PID). Note that a global PID is different than a raw PID.
For more information on global process identifiers see “PID
List” on page 8-7.
-process name
From the NightTrace kernel trace event file, load only exceptions and system calls associated with this process name, name.
This implies that you invoke ntrace with both a kernel trace
event file and user trace event file(s).
-start offset
Load trace events after the specified trace event offset. (See
“The Grid” on page 6-4 for information about trace event offsets.)
-start time{s|u} Load trace events after the specified relative time in seconds
(s) or microseconds (u).
-start percent%
Load trace events after the specified percent of total trace
events. The % is required.
-end offset
Load trace events before the specified trace event offset.
-end time{s|u}
Load trace events before the specified relative time in seconds
(s) or microseconds (u).
-end percent%
Load trace events before the specified percent of total trace
events. The % is required.
For example, the following invocation loads trace events logged between 5 and 15 seconds into the trace session.
$ ntrace -start 5s -end 15s log
5-7
NightTrace Manual
For example, the following invocation skips the first 10% of trace events, loads the next
15% of trace events, and skips the remaining 75% of trace events.
$ ntrace -start 10% -end 25% ulog
If you invoke ntrace with several -start options, ntrace pays attention only to the
last one. The same is true if you invoke ntrace with several -end options. If you
invoke ntrace with both a -start and a -end option and the -end condition precedes
the -start condition, ntrace does not load any real trace events; it loads two dummy
trace events.
You can establish a default windowing environment for all your ntrace sessions in your
.Xdefaults (or .Xresources) file. You can invoke ntrace with X options to:
• Customize an individual ntrace session
• Override any corresponding settings in the .Xdefaults file
• Possibly improve the readability of your ntrace display
You can invoke ntrace with the following options:
-flat color
Color to use for the window edges, scroll bars, push buttons,
and menu bars.
-Xoption
This option includes all of the standard X Tool kit
command-line options (see X(1)).
TIP:
Consider experimenting with these options and then saving their counterpart values in
your .Xdefaults or .Xresources file.
Invoking ntrace on a color X server with no ntrace options and no ntrace settings
in .Xdefaults is nearly equivalent to:
$ ntrace -fg black -bg white -flat gray75 -fn fixed
Your X terminal vendor supplies you with vendor-specific directories and files that pertain
to colors and fonts. The file that contains available colors is called rgb.txt. The
directory for fonts is /usr/lib/X11/fonts. For more information on X options, see
xterm(1) or X(1).
ntrace Arguments
5
You can invoke ntrace with arguments that provide information about trace events, their
tags, other labels, and desired display object layout. ntrace identifies the purpose of a
file argument by its contents; therefore, the order (and number) of these arguments is not
significant.
5-8
Invoking the ntrace Display Utility
SYNTAX
ntrace [-option] [trace_files] [event_map_files]
[config_files][session_files]
ARGUMENTS
trace_files
Trace event files contain sequences of trace events logged by
your application or the operating system kernel and capture by
a user or kernel trace daemon.
event_map_files
Event-map files map short mnemonic trace event tags to
numeric trace event IDs and associates data types with trace
event arguments. This is a hand-edited ASCII file.
config_files
Configuration files define macros, qualified events, qualified
states, string tables, format tables, display objects, and display
pages. These ASCII files are usually created with ntrace.
session_files
Session manager configuration files define a list of deamon
sessions and their individual configuration for quick invocation. These files are created and saved by the session manager
dialog
See the NightTrace Pocket Reference card for a syntax summary of formats for event-map
files, string tables, and format tables.
Understanding Trace Event Files
5
Trace event files are created by user and kernel trace daemons. They consist of header
information and individual trace events and their arguments as logged by user applications
or the operating system. ntrace detects trace event files as specified on the command
line and does the required initialization processing so that the trace events contained in the
files are available for display.
Understanding Event-Map Files
5
ntrace does not require you to use event-map files. However, if you use these file(s),
you can improve the readability of your ntrace displays.
A trace point is a location in the application’s source code where you call a NightTrace
trace event logging routine. Each trace point has a corresponding trace event ID number.
An event-map file allows you to associate meaningful tags or labels with the more cryptic
trace event ID numbers. It also allows you to associate additional information with a trace
event including the number of arguments and the argument conversion specifications or
display formats. Although ntrace does not require you to use event-map files, labels
and correct display formats can make graphical ntrace displays and textual summary
information much more readable.
5-9
NightTrace Manual
You can run ntrace with multiple event-map files; however, if a trace event ID is
multiply-defined, ntrace writes an error message in the message display area of the
Global Window. For more information on the Global Window, see “ntrace Global
Window” on page 5-25.
TIP:
If you used symbolic constants to represent numeric trace event IDs, you may be able to
simply reformat this information in the event-map file.
To load an existing event-map file, either:
• Start an ntrace session with the file name as an argument
• Click on File Ì Read Event-Map File ... on the Global Window
You must create an event-map file with a text editor before you invoke ntrace. The file
contains lines of ASCII text separated by newlines. There is one trace event tag mapping
per line. White space separates each field except the conversion specifications; commas
separate the conversion specifications. ntrace ignores blank lines and treats text
following a # as comments. The syntax for the trace event mappings in the event-map file
follows:
event: ID “event_tag” [ nargs [ conv_spec, ... ] ]
Fields in this file are:
event:
The keyword that begins all trace event name mappings.
ID
A valid integer in the range reserved for user trace events
(0-4095, inclusive). Each time you call a NightTrace trace
event logging routine, you must supply a trace event ID.
event_tag
A character string to be associated with event_ID. Trace event
tags must begin with a letter and consist solely of alphanumeric
characters and underscores.Keep trace event tags short; otherwise, ntrace may be unable to display them in the limited
window space available.
The following words are reserved in ntrace and should not
be used in upper case or lower case as trace event tags: NONE,
ALL, ALLUSER, ALLKERNEL, TRUE, FALSE, CALC.
TIP:
Consider giving your trace events upper case tags in event-map files and giving any
corresponding qualified event the same name in lower case. For more information about
qualified events, see “Qualified Events” on page 9-81.
If your application logs a trace event with one or more numeric arguments, by default
ntrace displays these arguments in decimal integer format. To override this default,
provide a count of argument values and one argument conversion specification or display
format per argument.
nargs
5-10
The number of arguments associated with a particular trace
event. If nargs is too small and you invoke ntrace with the
event-map file and the -listing option, ntrace shows
only nargs arguments for the trace event.
Invoking the ntrace Display Utility
conv_spec
A conversion specification or display format for a trace event
argument. ntrace uses conversion specification(s) to display
the trace event’s argument(s) in the designated format(s). There
must be one conversion specification per argument. Valid conversion specifications for displays include the following:
%dsigned decimal integer (default)
%ounsigned octal integer
%xunsigned hexadecimal integer
%lfsigned double precision, decimal floating point
For more information on these conversion specifications, see
printf(3S).
The following line is an example of an entry in an event-map file:
event: 5 “Error” 2 %x %lf
Trace event ID 5 is an error condition; when appropriate, ntrace displays trace event 5
and labels the trace event “Error.” Trace event 5 also has two (2) arguments. ntrace
displays the first argument in unsigned hexadecimal integer (%x) format and the second
argument in signed double precision decimal floating point (%lf) format. (You may override these conversion specifications when you configure display objects.)
For more information on event-map files, see“Pre-Defined String Tables” on page 5-14,
“Read Event-Map File” on page 5-31, and the ntrace(4) man page. For information
about trace event tags for kernel trace ev en ts, see the /usr/lib/NightTrace/eventmap file
Understanding Page Configuration Files
5
ntrace does not require you to use configuration files. However, using these file(s):
• Allows you to associate macros, qualified events, and qualified states with
particular display page(s)
• Improves the readability of your displays
• Saves you time laying out your display pages
A configuration file is an ASCII file that contains definitions. These definitions look like
initialized C structures. A configuration file can contain any number of the following
definitions:
• Macro, qualified event, and qualified state definitions (See Chapter 9.)
• String table definitions (See “String Tables” on page 5-13.)
• Format table definitions (See “Format Tables” on page 5-17.)
• Display page definitions
5-11
NightTrace Manual
NOTE
The components of a configuration file are often interrelated. For
example, display pages may reference user-defined tables.
ntrace generates an error message if your configuration file
refers to a table before you define it. To avoid this problem, create
your configuration files so that a table definition precedes its
reference(s). There is no similar problem for macros, qualified
events, and qualified states.
If you accidentally define a macro, qualified event, or qualified
state more than once in a configuration file, ntrace flags
subsequent definitions as errors. If you define a string table or
format table more than once in a configuration file, ntrace
merges the two tables; if there are duplicate entries, values come
from the last definition.
Results can be unpredictable if multiple users simultaneously
modify a configuration file. Similarly, ntrace may behave
strangely if you edit your configuration file so that any of your
display objects overlap.
You can create, modify, save, and load configuration files from within ntrace; however,
you must use a text editor to create and modify tables in a configuration file. ntrace
ignores blank lines and treats text between a /* and a */ as comments in configuration
files; however, saving a configuration file removes your comments.
To load an existing configuration file, do one of the following:
• Start an ntrace session with the file name as an argument
• Click on File Ì Open Config File ... on the Global Window
For more information on manipulating configuration files, see “NightTrace Menu Item”
on page 5-26.
ntrace Tables
5
The configuration file may contain two types of tables: string tables and format tables.
Both types of table can improve the readability of your ntrace displays. The only way
to put tables into your configuration file is by text editing the file before you invoke
ntrace. To avoid any forward-reference problems, define all string tables before any
format tables.
A table lets you associate meaningful character strings with the more cryptic integer
values, such as trace event arguments. These character strings may appear in ntrace
displays.
For example, suppose that one trace event’s argument may have the decimal values 2, 5,
and 8. You can define:
• A string that appears when the value is 2
5-12
Invoking the ntrace Display Utility
• A different string that appears when the value is 5
• A third string that appears when the value is 8
The following table names are reserved in ntrace and should not be redefined in upper
case or lower case:
event, pid, tid, boolean, name_pid, name_tid, node_name,
pid_ nodename, tid_nodename, vector, syscall, device,
v e c t o r _ n o d en a m e , s y s c a l l _ n o d e n am e , d e v i c e _n o d e n a m e ,
event_summary, event_arg_summary, event_arg_dbl_summary,
state_summary
The results are undefined if you supply your own version of these tables. For more
information on pre-defined tables, see “Pre-Defined String Tables” on page 5-14,
“Pre-Defined Format Tables” on page 5-20, and “Kernel String Tables” on page 11-16.
TIP:
Put tables in separate configuration files from display pages. This way tables do not get
redefined if you close and reopen a display page during a single ntrace session.
If you define a string table or format table more than once in a configuration file, ntrace
merges the two tables; if there are duplicate entries, values come from the last definition.
String Tables
5
You can log a trace event with one or more numeric arguments. Sometimes these
arguments can take on a nearly fixed set of values. A string table associates an integer
value with a character string. Labeling numeric values with text can make the values easier to interpret.
The syntax for a string table is:
string_table ( table_name ) = {
item = int_const, “str_const” ;
...
[ default_item = “str_const” ; ]
};
You do not need to separate the parts (tokens) of the string table with white space.
String-table tokens are indivisible; although these tokens need not break on the lines
shown, they must appear in the order shown. Include all special characters from the syntax
except the ellipsis (...) and square brackets ([]). The fields in a string table definition
are:
string_table
The keyword that starts the definition of all string tables.
table_name
The unique, user-defined name of this table. This name
describes the relationship of the numeric values in this string
table.
An item line associates an integer value with a character string. This line extends from the
keyword item through the semicolon. You may define any number of item lines in a single string table. The fields in an item line are:
item
The keyword that begins all item lines.
5-13
NightTrace Manual
int_const
An integer constant that is unique within table_name. It may be
decimal, octal, or hexadecimal. Decimal values have no special
prefix. Octal values begin with a zero (0). Hexadecimal values
begin with 0x.
str_const
A character string to be associated with int_const. Keep this
string short; otherwise, ntrace may be unable to display it in
the limited window space available. Use a \n for a newline,
not a carriage return in the middle of the string.
The optional default item line associates all other integer values with a single string. The
fields of the default item line are:
default_item
The keyword that begins all default item lines.
str_const
(See str_const above.)
TIP:
If your table needs only one entry, you may omit the item line and supply only the default
item line. A get_string() call with this table name as the first parameter needs no
second parameter.
ntrace returns a string of the item number in decimal if:
• There is no default item line, and the specified item is not found.
• The string table is not found. (The first time ntrace cannot find a
particular string table ntrace flags it as an error.)
The following lines provide an example of a string table in a configuration file.
string_table (curr_state) = {
item = 3, “Processing Data”;
item = 1, “Initializing”;
item = 99, “Terminating”;
default_item = “Other”;
};
In this example, your application logs a trace event with a numeric argument that identifies the current state (curr_state). This argument has three significant values (3, 1,
and 99). When curr_state has the value 3, the ntrace display shows the string
“Processing Data.” When it has the value 1, the display shows “Initializing.”
When it has the value 99, the display shows “Terminating.” For all other numeric
values, the display shows “Other.”
For more information on string tables and the get_string() function, see
“get_string()” on page 9-75 and the /usr/lib/NightTrace/tables file.
Pre-Defined String Tables
5
The following string tables are pre-defined in ntrace:
event
5-14
A dynamically generated string table internal to ntrace. It
maps all known numeric trace event IDs with symbolic trace
ev ent tag s. A sim ilar association appears in the
/usr/lib/NightTrace/eventmap file; this is an
Invoking the ntrace Display Utility
event-map file that associates trace event IDs with kernel trace
event tags.
This table is indexed by an event code or an event code name.
Examples of using this table are:
get_string(event, 4112)
get_item(event, “TR_INTERRUPT_EXIT”)
pid
A dynamically generated string table internal to ntrace. In
user tracing, it associates global process ID numbers with process names of the processes being traced. In kernel tracing, it
associates process ID numbers with all active process names
and resides in the dynamically generated vectors file.
When analyzing trace event files timestamped by the RCIM
synchronized tick clock, process identifiers are not guaranteed
to be unique across nodes. Therefore, accessing the pid table
may result in an incorrect process name being returned for a
particular process ID. To get the correct process name for a
process ID, the pid table for the node on which the process
identifier occurs should be used instead. The pid table is
maintained for backwards compatibility.
This table is indexed by a process identifier or a process name.
Examples of using this table are:
get_string(pid, pid())
get item(pid, “ntraceud”)
See “PID List” on page 8-7 for more information.
tid
A dynamically generated string table internal to ntrace. In
user tracing, it associates NightTrace thread ID numbers with
thread names. In kernel tracing, this table is not used.
When analyzing trace event files timestamped by the RCIM
synchronized tick clock, thread identifiers are not guaranteed
to be unique across nodes. Therefore, accessing the tid table
may result in an incorrect thread name being returned for a particular thread ID. To get the correct thread name for a thread
ID, the tid table for the node on which the process identifier
occurs should be used instead. The tid table is maintained for
backwards compatibility.
This table is indexed by a thread identifier or a thread name.
Examples of using this table are:
get_string(tid, tid())
get_item(tid, “cleanup_thread”)
See “TID List” on page 8-8 for more information.
5-15
NightTrace Manual
boolean
A string table defined in the /usr/lib/NightTrace/tables file. It associates 0 with false and all other
values with true.
name_pid
A dynamically generated string table internal to ntrace. It
maps all known node ID numbers (which are internally
assigned by ntrace) to the name of the node’s process ID
table).
This table is indexed by a node identifier or a node name.
Examples of using this table are:
get_string(name_pid, node_id())
get_item(name_pid, “system123”)
name_tid
A dynamically generated string table internal to ntrace. It
maps all known node ID numbers (which are internally
assigned by ntrace) to the name of the node’s thread ID
table).
This table is indexed by a node identifier or a node name.
Examples of using this table are:
get_string(name_tid, 1)
get_item(name_tid, “charon”)
node_name
A dynamically generated string table internal to ntrace. It
associates node ID numbers (which are internally assigned by
ntrace) with node names.
This table is indexed by a node identifier or a node name.
Examples of using this table are:
get_string(node_name, node_id())
get_item(node_name, “gandalf”)
pid_nodename
A dynamically generated string table internal to ntrace. In
kernel tracing, it associates process ID numbers with all active
process names for a particular node and resides in that node’s
vectors file. In user tracing, it associates global process ID
numbers with process names of the processes being traced for a
particular node.
This table is indexed by a process identifier or a process name.
Examples of using this table are:
get_string(pid_sbc1, pid())
get_item(pid_engsim, “nfsd”)
tid_nodename
5-16
A dynamically generated string table internal to ntrace. In
kernel tracing, this table is not used. In user tracing, it associates NightTrace thread ID numbers with thread names for a
particular node.
Invoking the ntrace Display Utility
This table is indexed by a thread identifier or a thread name.
Examples of using this table are:
get_string(tid_harpo, 1234567)
get_item(tid_shark, “reaper_thread”)
vector
See “Kernel String Tables” on page 11-16.
syscall
See “Kernel String Tables” on page 11-16.
device
See “Kernel String Tables” on page 11-16.
vector_nodename See “Kernel String Tables” on page 11-16.
syscall_nodenameSee “Kernel String Tables” on page 11-16.
device_nodename See “Kernel String Tables” on page 11-16.
You can use pre-defined string tables anywhere that string tables are appropriate. Use the
get_string() function to look up values in string tables. For information about the
get_string() function, see “get_string()” on page 9-75. For examples of function
calls with these tables, see Table 8-3.
Format Tables
5
Like string tables, format tables let you associate an integer value with a character string;
however, in contrast to a string table string, a format table string may be dynamically
formatted and generated. Labeling numeric values with text can make the values easier to
interpret.
The syntax for a format table is:
format_table ( table_name ) = {
item = int_const, “format_string” [ , “value1” ] ... ;
...
[ default_item = “format_string” [ , “value1” ] ... ; ]
};
You do not need to separate the parts (tokens) of the format table with white space. Format
table tokens are indivisible; although these tokens need not break on the lines shown, they
must appear in the order shown. Include all special characters from the syntax except the
ellipses (...) and square brackets ([]). The fields in a format table are:
format_table
The keyword that begins the definition of all format tables.
table_name
The unique, user-defined name of this table. This name
describes the relationship of the numeric values in this format
table.
An item line associates a single integer value with a character string. This line extends
from the keyword item through the semicolon. You may have any number of item lines
in a single format table. The fields in an item line are:
item
The keyword that begins all item lines.
5-17
NightTrace Manual
int_const
An integer constant that is unique within table_name. This
value may be decimal, octal, or hexadecimal. Decimal values
have no special prefix. Octal values begin with a zero (0).
Hexadecimal values begin with 0x.
format_string
A character string to be associated with int_const. Keep this
string short; otherwise, ntrace may be unable to display it in
the limited window space available. Use a \n for a newline,
not a carriage return in the middle of the string.
The string contains zero or more conversion specifications or
display formats. Valid conversion specifications for displays
include the following:
%iSigned integer
%uUnsigned decimal integer
%dSigned decimal integer
%oUnsigned octal integer
%xUnsigned hexadecimal integer
%lfSigned double precision, decimal floating point
%eSigned decimal floating point, exponential
notation
%cSingle character
%sCharacter string
%%Percent sign
\nNewline
For more information on these conversion specifications, see
printf(3S).
value1
A value associated with the first conversion specification in
format_string. The value may be a constant string (literal)
expression or an ntrace expression. A string literal expression must begin and end with a \\’ and must be enclosed in
double quotes; for example:
“\\’string expression\\’"
An expression may be a get_string() call; a description of
the get_string() function appears in “get_string()” on
page 9-75. F or more inform ation on expressions, see
Chapter 9.
format_string may contain any number of conversion
specifications. There is a one-to-one correspondence between
conversion specifications and quoted values. A particular conversion specification-quoted value pair must match in both
5-18
Invoking the ntrace Display Utility
data type and position. For example, if format_string contains a
%s and a %d, the first quoted value must be of type string and
the second one must be of type decimal integer. If the number
or data type of the quoted value(s) do not match format_string,
the results are not defined.
The optional default item line associates all other integer values with a single format item.
ntrace flags it as an error if an expression evaluates to a value that is not on an item line
and you omit the default item line. The fields of the default item line are:
default_item
The keyword that begins all default item lines.
format_string
(See format_string above.)
value1
(See value1 above.)
TIP:
If your table needs only one entry, you may omit the item line and supply only the default
item line. A get_format() call with this table name as the first parameter needs no
second parameter.
The following lines provide an example of a string table and format table in a
configuration file.
string_table (curr_state) = {
item = 3, “Processing Data”;
item = 1, “Initializing”;
item = 99, “Terminating”;
default_item = “Other”;
};
format_table (event_info) = {
item = 186, “Search for the next time we process data”;
item = 25, “The current state is %s”,
“get_string (curr_state, arg1())”;
item = 999, “Current state is %s, current trace event is %d”,
“get_string (curr_state, arg1())”,
“offset()”;
default_item = “Other”;
};
In this example, the first numeric argument associated with a trace event represents the
current state (curr_state), and the event_info format table represents information
as soc i a te d wi t h t he t ra c e e ve nt IDs . W hen t ra ce eve nt 186 oc c urs, a
get_format(event_info,186) makes ntrace display:
Search for the next time we process data
When trace event 25 occurs, ntrace replaces the conversion specification (%s) with the
result of the get_string() call. If arg1() has the value 1, then ntrace displays:
The current state is Initializing
When trace event 999 occurs, ntrace replaces the first conversion specification (%s)
with the result of the get_string() call and replaces the second conversion
specification (%d) with the integer result of the numeric expression offset(). If
arg(1) has the value 99 and offset() has the value 10, then ntrace displays:
5-19
NightTrace Manual
Current state is Terminating, current trace event is
10
For all other trace events, ntrace displays “Other”.
For more information on get_string(), see “get_string()” on page 9-75. For more
information on format tables and the get_format() function, see “get_format()” on
page 9-79. See also the /usr/lib/NightTrace/tables file. For more information
about arg1(), see “arg()” on page 9-20. For more information about offset(), see
“offset()” on page 9-27.
Pre-Defined Format Tables
5
The following format tables are pre-defined in the /usr/lib/NightTrace/tables
file:
state_summary
Formats statistics about the state matches
summarized, state durations, and state time
gaps. This table provides the default state
summary output format.
event_summary
Formats statistics about the trace event
matches and trace event time gaps. This table
provides the default trace event summary
output format.
event_arg_summary
Formats statistics about the trace event
matches and their type long trace event
arguments.
event_arg_dbl_summary
Formats statistics about the trace event
matches and their type double trace event
arguments.
For more information about summaries, see Chapter 10.
You can use pre-defined format tables anywhere that format tables are appropriate. Use
the get_format() function to look up values in format tables. For information about
the get_format() function, see “get_format()” on page 9-79. For examples of function calls with format tables, see Table 8-3.
Configuring Display Pages
5
The configuration file usually contains display page(s). You use ntrace to put these
display page(s) in your configuration file.
ntrace lets you customize the layout of your ntrace display pages. You do this by
coloring, selecting, sizing, positioning, grouping, and otherwise configuring display
objects on a particular display page. Once you have created a useful display page, you
may save it for future ntrace sessions. Saving a display page is the same as creating or
modifying a configuration file. See Chapter 7 and Chapter 8 for more information.
5-20
Invoking the ntrace Display Utility
Rather than creating your own display page, you can let ntrace create a default display
page for you. For more information on the default display page, see “Default Page” on
page 5-28 and “Kernel String Tables” on page 11-16.
ntrace User Interface
5
ntrace displays textual and graphical information, and it provides you with ways to
manipulate this information. These displays and mechanisms make up the ntrace user
interface.
The next sections describe the following ntrace user interface issues:
• Using the mouse
• Understanding pointer shapes
• Anticipating window layout
• Resizing windows
Using the Mouse
5
It is assumed that your X server has a three-button mouse. By default, mouse button 1 is
the leftmost button, button 2 the middle button, and button 3 the rightmost button. You can
reassign the functions associated with mouse buttons by using xmodmap(1). If you do
not have a three-button mouse or a standard 101-key North American keyboard, see your
system administrator or read sections on input and navigation in the OSF/Motif Style
Guide.
You use the mouse with point-and-click interfaces in ntrace. Each mouse button has a
different purpose. The only mouse button operation you need to know for now is that
clicking mouse button 1 usually does a single selection.
5-21
NightTrace Manual
Understanding Pointer Shapes
5
When you move the mouse, the mouse pointer moves on the screen. You use this pointer
to point to particular parts of the screen. The shape of the pointer shows the current usage.
The following table describes when ntrace uses each pointer shape.
Table 5-1. ntrace Pointer Shapes and Their Usage
Shape
When Used
By default
When a menu action is pending
While moving a display object
While resizing a display object
During display-object placement
During time-consuming operations, for example
while scrolling through a large trace event file
Anticipating Window Layout
5
Your window manager may automatically place a window frame around your windows. It
may also provide you with a means of performing some standard operations, such as
minimizing (also known as iconifying) or maximizing the window size. If your window
manager provides a window frame, then ntrace puts a window title in the title area of
this frame. If you minimize a window, ntrace provides all or part of the window title for
the icon that represents that window.
ntrace windows may contain different mixtures of components. In ntrace the window
components include:
5-22
Invoking the ntrace Display Utility
Menu bars and pull-down menus
A menu bar appears at the top of the window. It consists of labeled
pull-down menu(s). When you select (click on) a pull-down menu,
entries appear in a vertical list. Selecting a menu entry with ellipses
on it, causes a dialog box or form to appear. Entries are grouped by
function with separators dividing groups. Any destructive items
appear last.
Push buttons
A push button is a graphic image of a labeled button on a panel. Push
buttons are evenly-spaced in a horizontal panel at the bottom of the
window. The default push button is highlighted by having a border
around it. Pressing <Enter> makes the default push button take
effect. Push buttons are organized by frequency of use and grouped
by functionality. Push button names are active verbs. The most-commonly-used push buttons in ntrace are: A p p ly, R e s e t , and
Close.
Rather than duplicating functionality in both a menu entry and push
button, ntrace supports the menu entry.
Radio buttons
A radio button is a graphic, labeled diamond-shape that represents a
mutually exclusive selection from related radio buttons. Related
radio buttons usually appear on the same panel, a panel between the
menu bar and the push buttons. The first radio button is the default
one. The selected radio button has a different color than the others.
Scroll regions and scroll bars
A scroll region appears between the menu bar and the push buttons.
The scroll bar is immediately below or to the right of the scroll
region.
Text fields
A text field appears between the menu bar and the push buttons.
While a text field is being edited, it contains a blinking vertical bar
called the text cursor. The text cursor shows your current edit position within the field.
Figure 5-1 illustrates these window components.
5-23
NightTrace Manual
Figure 5-1. Window Components
Resizing Windows
5
You can resize all windows in ntrace. However, many windows require a minimum
size to display information. You can resize some windows only horizontally. When you
make a window wider, ntrace horizontally stretches any push buttons in that window to
take up the new width.
ntrace Notation Conventions
5
This manual uses the following notation convention to reference menu entries.
Menu bars consist of one or more menu items. Clicking on a menu item causes a
pull-down menu to appear. Pull-down menus have selectable entries. This manual lists
menu levels (from menu item to menu entry) in the order in which they appear. An arrow
5-24
Invoking the ntrace Display Utility
( Ì ) separates each menu level from the next. To show the progression from menu item to
menu entry, this manual uses the following notation:
menu item Ì menu entry
For example, if you click on the File menu bar item, you may then select the Exit menu
entry. This manual shows this procedure as:
Click on File Ì Exit
If the menu item consists of more than one word, the procedure is shown as:
Click on File Ì Open Config File ...
ntrace Global Window
5
Unless you invoke ntrace with an option that writes to standard output, ntrace starts
up by displaying the Global Window. The ntrace Global Window consists of:
• A message display area and its associated scroll bar
• A menu bar
Figure 5-2. Global Window for a Single Trace Event File
Message Display Area
5
The message display area of the Global Window presents the following information:
• Version information
5-25
NightTrace Manual
• Trace-session statistics grouped by trace event file
• Cumulative statistics for all trace event files
• Event timestamp source
• Error messages about corrupted or syntactically-incorrect ntrace file
arguments
You can also obtain this statistical information by invoking ntrace with the
-filestats option. If you invoke ntrace without any trace event file arguments,
ntrace displays most of the statistics as zero values.
By default, ntrace is sized to hold twenty lines in the message display area. You can
alter this number by changing the size of the Global Window. To change the Global
Window size, resize your window by using features of your window manager. It is not
necessary to resize a window to see messages 21 and higher; you can scroll through all
messages by using the scroll bar.
Menu Bar
5
The menu bar of the Global Window consists of the following menu items:
• NightTrace
• Tools
• Help
NightTrace Menu Item
5
When you click on the File menu item on the Global Window, the pull-down menu
shown in Figure 5-3 appears.
Figure 5-3. Global Window File Menu
5-26
Invoking the ntrace Display Utility
New Page, Default Page, Default Kernel Page, and Open Config File ...,
can all cause ntrace to bring up a display page. The difference between these menu
items is the origin and content of the display page. The D efa u lt Ke rn el P ag e is
disabled (dimmed) unless you provide a NightTrace kernel trace file. It is discussed in
“Kernel Display Pages” on page 11-6. The rest of these menu entries are discussed later in
this chapter. The regular features of a display page include:
• Create and configure display objects so they graphically depict your trace
session (See Chapter 7 and Chapter 8)
• Examine trace events, states, trace event arguments, and timings using different display objects (See Chapter 6)
• Create, configure, and modify macros, qualified events, and qualified
states (See Chapter 9)
• Search for trace events (See Chapter 10)
• Summarize data into statistics for trace events and states (See Chapter 10)
New Page
5
When you click on File Ì New Page on the Global Window, a display page with a
dotted but otherwise empty grid appears. This menu item is useful if you want to create a
display page from scratch. Most regular features of a display page are immediately
available on a new page. However, you must create and configure display objects before
you can:
• Examine trace events, states, and trace event arguments using different
display objects
• Graphically depict your trace session
NOTE
The new display page comes up in Edit mode. In Edit mode, the
field labels, scroll bar and push buttons on the display page are
disabled (dimmed).
5-27
NightTrace Manual
Figure 5-4. New Display Page
Default Page
5
When you click on F i l e Ì D e f a u l t P a g e on the G l o b a l W i n d o w, an
automatically-generated display page appears. The purpose of the default display page is
to save you time configuring display objects; if this page does not exactly meet your
needs, you can customize it or you can create a new display page. ntrace brings up this
page in View mode. All regular features of a display page are immediately available on a
default page.
Before ntrace displays a default display page, it counts the number of processes in your
trace event file(s). Normally, it then creates and displays a default display page with one
StateGraph per process in the trace event file(s). The StateGraph is configured to show all
user trace events. If there are so many processes that their StateGraphs do not fit on the
screen, then ntrace does not display any StateGraphs.
When analyzing trace events timestamped by an RCIM synchronized tick clock, if a
thread name is not unique in the trace events, ntrace prints a node name along with the
process ID number and thread ID number in the associated GridLabel to identify that
thread.
Figure 5-5 shows a default display page. A brief description of the display objects on this
display page follows. See Chapter 7 for a more detailed description of display objects and
the display page.
5-28
Invoking the ntrace Display Utility
NOTE
The dynamic information that display objects present relates to
the interval, a window into your trace session.
Figure 5-5. A Default Display Page
GridLabel
A textual display object that contains a static user-specified text
string. This object labels other objects for clarity
DataBox
A display object that displays textual or numeric information such as
the trace event ID or tag and the time the trace event occurred. The
information it displays is related to the current time. A DataBox’s
main use is to display data that is variable in nature and does not lend
itself to graphical representation.
Column
A scrollable display object that does not display data itself but holds
graphical display objects: StateGraphs, EventGraphs, DataGraphs,
and Rulers. Its purpose is to define the width of and group together
graphical display objects.
StateGraph
A scrollable display object that graphically displays states as bars
and trace events as vertical lines in a Column. The StateGraph shows
relative chronological positions of trace events and states since the
trace started.
5-29
NightTrace Manual
EventGraph
A scrollable display object that graphically displays trace events as
vertical lines in a Column. It shows relative chronological positions
of trace events since the trace started.
DataGraph
A scrollable display object that graphically displays a trace event
expression as a vertical line or bar in a Column. A DataGraph shows
the relative chronological positions of trace event arguments since
the trace started. The height of the line or bar is proportional to the
value of the expression.
Ruler
A scrollable display object resembling a ruler that graphically
displays the time. A Ruler appears within a Column and shows what
time a trace event occurred in a StateGraph, EventGraph, or DataGraph.
Open Config File
5
A configuration file contains user-created display page(s), macros, qualified events,
qualified states, and/or table definitions. When you click on File Ì Open Config File
... on the Globa l W ind ow, a dialog box appears. This window prompts you for an
existing configuration file name. To avoid any ntrace errors, you must have read
permission for the file. When you open a configuration file, all regular features of a display page are immediately available.
When you open an existing configuration file that contains display page(s), ntrace
displays them. This can save time configuring display objects and let you immediately
begin trace event analysis.
The Open Config File Dialog Box (shown in Figure 5-6) is made up of:
• Α File Name text field
• Α Filter text field
• Α file name scroll region and its scroll bar
• Τhe (default) Open push button
• Τhe Cancel push button
If you decide not to open a configuration file, click on Cancel. This action causes the
O pe n Co nfig File Dialog Bo x to go away. If you still want to open an existing
configuration file, see “The File Selection Dialog Box” on page 5-33.
For more information on configuration files, see “Understanding Page Configuration
Files” on page 5-11.
5-30
Invoking the ntrace Display Utility
Figure 5-6. The Open Config File Dialog Box
Read Event-Map File
5
An event-map file associates user-created mnemonic tags or labels with numeric trace
event IDs. When you click on File Ì Read Event-Map File ... on the Global Window, a dialog box appears. This window prompts you for an existing event-map file. To
avoid any ntrace errors, you must have read permission for this file.
Once ntrace reads an event-map file, it is able to display short trace event tags rather
than less-meaningful trace event IDs. By naming your trace events, you can make your
displays much easier to understand.
The Read Event-Map File Dialog Box is made up of:
• A File Name text field
• A Filter text field
• A file name scroll region and its scroll bar
• The (default) Read push button
• The Cancel push button
If you decide not to read an event-map file, click on Can ce l. This action causes the
Read Event-Map File Dialog Box to go away. If you still want to read an existing
event-map file, see “The File Selection Dialog Box” on page 5-33.
For more information on event-map files, see “Understanding Event-Map Files” on page
5-9.
5-31
NightTrace Manual
Figure 5-7. The Read Event-Map File Dialog Box
Exit
5
When you click on File Ì Exit on the Global Window, ntrace:
• Prompts you to save any unsaved changes, if appropriate
• Discards unsaved changes, if appropriate
• Deallocates memory it used to store trace events
• Exits
ntrace puts up a Warning Dialog Box if you try to exit from ntrace without saving
your display page changes. If you want to save your changes, click on Cancel; as a
result, ntrace removes the dialog box, and you can save your changes. If you do not
want to save your changes, click on OK; this causes ntrace to exit.
Tools Menu Item
5
The tools menu allows you to invoke the session manager, an integral part of the NightTrace graphical interface, in addition to other tools in the NightStar family, including
NightProbe, NightBench, NightSim, and NightView.
5-32
Invoking the ntrace Display Utility
Help Menu Item
5
When you click on the Help menu item on the Global Window, the pull-down menu
shown in Figure 5-8 appears.
Figure 5-8. Global Window Help Menu
The Online Manual item opens the online version of the NightTrace Manual using the
HyperHelp viewer that is shipped as part of the X Window System (x11) product.
The online NightTrace Manual can also be accessed using the nhelp utility shipped with
the X Window System. The manual name is ntrace. For example, from the command
line:
nhelp ntrace
opens the most recently installed version of the NightTrace Manual in the HyperHelp
viewer.
The File Selection Dialog Box
5
The File Selection Dialog Box gives you three ways to find a file:
• Type in the exact file name
• Scroll through existing file names until you see the one you want
• Type in a filter (file name pattern) for ntrace to locate
Typing in the Exact File Name
5
If you know the exact file name, use the following steps to open the file.
1. Type a file name, possibly with leading directory name(s), into the File
Name text field.
2. If you mistype the file name, see “Field Editing” on page 6-16 and correct
the problem.
3. Press <Enter>.
This causes ntrace to remove the File Selection Dialog Box.
5-33
NightTrace Manual
If you have read permission to this file and it is of the right type, ntrace opens the file.
If it is a configuration file, ntrace puts up any display page(s) from this file. If it is an
event-map file, ntrace adds those trace event tags and trace event argument formats to
its internal list.
If opening the file was not successful, ntrace puts up a Warning Dialog Box. The
warning message in the dialog box differs depending on the problem. When you have
read the warning, click on OK. As a result, ntrace removes the dialog box.
If you cause ntrace to bring up this File Se lection D ialog Box again, all fields
contain the same values as when you left this dialog box, except the File Name text field
never comes up with more than a directory name.
Scrolling Through Existing File Names
5
If you would recognize the file name if you saw it, use the following steps to find and open
it.
1. Use the scroll bar to examine the alphabetical list of file and directory
names displayed in the scroll region.
2. Try to find the file name you are seeking.
3. If you find the file:
a. Click on the file name to select and highlight it.
b. Click on Open.
As an alternative to these two steps, you could double click quickly on the file name.
If you have read permission to this file and it is of the right type, ntrace opens the file.
If it is a configuration file, ntrace puts up all display page(s) from this file. If it is an
event-map file, ntrace adds those trace event tags and trace event argument formats to
its internal list.
If opening the file was not successful, ntrace puts up a Warning Dialog Box. The
warning message in the dialog box differs depending on the problem. When you have
read the warning, click on OK. As a result, ntrace removes the dialog box.
If you do not find the file in the list:
1. Click on the directory name under which it resides. This selects and highlights the directory name.
2. Click on Open.
As an alternative to these two steps, you could double click quickly on the directory name.
This causes ntrace to:
• Put the selected directory’s name in the File Name text field
• Change to that directory (cd)
• Display the file and directory names under that directory
5-34
Invoking the ntrace Display Utility
You can repeat the steps in this method until you find the file.
If you cause ntrace to bring up this File Se lection D ialog Box again, all fields
contain the same values as when you left this dialog box.
TIP:
Clicking on the “..” directory causes the scrolled list to be filled with the contents of the
parent directory.
Typing in a Filter (File Name Pattern)
5
If you know only some of the characters in the file name, use the steps below to find and
open it.
1. Type a file name pattern, possibly with leading directory name(s) and
appropriately-placed asterisk(s), into the Filter text field. Each asterisk (*)
in this field represents zero or more characters at this position.
2. If you mistype the field name pattern, see “Field Editing” on page 6-16 and
correct the problem.
3. Press <Enter>.
This causes ntrace to replace the contents of the scroll region with subdirectory names
and file names that match your pattern. To locate your file in the scroll region and open it,
see the “Scrolling Through Existing File Names” on page 5-34.
If you caused ntrace to bring up this File Selection Dialog Box again, all fields
contain the same values as when you left this dialog box.
Exercise: Displaying Trace Events
5
The following exercise has you graphically display the trace events you logged in “Exercise: Logging Trace Events” on page 4-29.
Copy the /usr/lib/NightTrace/examples/entry_exit_page configuration
file to your directory and call it page. (See “Understanding Page Configuration Files” on
page 5-11 for more information about configuration files.)
$ cp /usr/lib/NightTrace/examples/entry_exit_page page
Copy the /usr/lib/NightTrace/examples/entry_exit_map event-map file to
your directory and call it map. (See “Understanding Event-Map Files” on page 5-9 for
more information about event-map files.)
$ cp /usr/lib/NightTrace/examples/entry_exit_map map
Invoke ntrace with the trace event file you created in the last exercise and the
configuration file you just created.
5-35
NightTrace Manual
$ ntrace log page
NightTrace presents a display page. Concentrate on the dotted grid area in the middle and
the row of push buttons at the bottom. Keep clicking on the Zoom Out push button until
the display quits changing. Click on the Ruler around 2 seconds. The display object with
digital “waves” is a StateGraph. It graphically displays trace events and states. The two
“floating” DataBoxes contain textual information about the current trace event and its first
argument, respectively. Notice that the current trace event is identified by its cryptic trace
event ID number. (See “StateGraph” on page 7-14 and “DataBox” on page 7-12 for more
information about StateGraphs and DataBoxes.)
The next few steps get the same display page to show symbolic tags instead of numeric
IDs for trace events.
Close the display page by clicking on File Ì Close. (See “Close” on page 7-19 for more
information about this menu item.)
Read in the event-map file named map by clicking on File Ì Read Event-Map File
.... (See “Read Event-Map File” on page 5-31 for more information about this menu
item.)
Re-open the configuration file named page by clicking on File Ì Open Config File
.... (See “Open Config File” on page 5-30 for more information about this menu item.)
Click on the Refresh push button on the display page. Notice that the current trace event
is now identified by its symbolic tag because that trace event has an entry in the map file.
This exercise continues in “Exercise: Using the Search Tool” on page 10-14.
For practice customizing the graphical user interface, read Appendix B and try “Exercise:
Customizing Display Colors” on page B-5.
5-36
6
Viewing Trace Event Logs with ntrace
Overview . . . . . . . . . . . . . . . . . . . . . . . . . . . . . . . . . . . . . . . . . . . . . . . . . . . . . . . . . .
Mouse Button Operations . . . . . . . . . . . . . . . . . . . . . . . . . . . . . . . . . . . . . . . . . . . . .
The Grid. . . . . . . . . . . . . . . . . . . . . . . . . . . . . . . . . . . . . . . . . . . . . . . . . . . . . . . . . . .
Viewing Strategy . . . . . . . . . . . . . . . . . . . . . . . . . . . . . . . . . . . . . . . . . . . . . . . . . . . .
The Interval Scroll Bar . . . . . . . . . . . . . . . . . . . . . . . . . . . . . . . . . . . . . . . . . . . . . . .
The Interval Push Buttons . . . . . . . . . . . . . . . . . . . . . . . . . . . . . . . . . . . . . . . . . . . . .
The Interval Control Area . . . . . . . . . . . . . . . . . . . . . . . . . . . . . . . . . . . . . . . . . . . . .
Reading Fields . . . . . . . . . . . . . . . . . . . . . . . . . . . . . . . . . . . . . . . . . . . . . . . . . .
Editing Single Fields . . . . . . . . . . . . . . . . . . . . . . . . . . . . . . . . . . . . . . . . . . . . .
Editing Multiple Fields. . . . . . . . . . . . . . . . . . . . . . . . . . . . . . . . . . . . . . . . . . . .
Field Editing . . . . . . . . . . . . . . . . . . . . . . . . . . . . . . . . . . . . . . . . . . . . . . . . . . . . . . .
Editing Text Fields . . . . . . . . . . . . . . . . . . . . . . . . . . . . . . . . . . . . . . . . . . . . . . .
Positioning Within Text Fields . . . . . . . . . . . . . . . . . . . . . . . . . . . . . . . . . . . . . .
6-1
6-3
6-4
6-5
6-7
6-8
6-11
6-11
6-12
6-14
6-16
6-16
6-18
NightTrace Manual
6
Chapter 6Viewing Trace Event Logs with ntrace
6
6
6
Overview
6
ntrace’s display page has two modes: Edit mode and View mode. The words “Edit”
and “View” pertain to the operations you can perform on the graphical display, not the text
fields or scroll bar. This chapter discusses View mode, the mode that displays trace events
and states from your trace event file(s). ntrace displays this information:
• Graphically in configured display object(s) on the grid
• Statistically in fields of the interval control area
• Uniformly on all display page(s). (This means that changes on one page
are reflected on all pages.)
ntrace uses the same display page(s) in both Edit and View modes. However, toggling
between modes changes the interval scroll bar, fields in the interval control area, and the
push buttons. In View mode, the message display area shows some statistics, as well as
errors and warnings. The default mode for an existing display is View mode.
View mode lets you locate interesting parts of your trace session by:
• Shifting with the interval scroll bar
• Clicking on some of the interval push buttons
• Editing some field(s) in the interval control area
• Using the built-in Search tool (See Chapter 10 for more information.)
See Chapter 7 for more information on Edit mode, the components of the display page,
and display objects.
This chapter assumes that you have already created or loaded a display page with
configured display objects. This manual uses the following term conventions:
<Enter>
The key on your keyboard that issues a carriage return and line feed.
<Backspace>
The key on your keyboard that issues a <Ctrl> <h>. In ntrace this
is also <Delete>.
interval
A time period in the trace session that has a specific starting and ending time. It is the “window” into the trace session that appears on the
display page.
6-1
NightTrace Manual
Figure 6-1. A Display Page in View Mode
current time
The instance in time currently being displayed. It occurs within the
interval. Searches begin at the current time.
current time line
The dashed vertical bar that represents the current time in a Column.
This line moves to the location of your pointer when you click with
mouse button 1 in a Column. The position of the current time line
determines the values that appear on display pages.
This chapter covers the following topics:
• Mouse button operations in View mode
• Understanding the grid
• Deciding what to do next in View mode
• Using the interval scroll bar
• Using the interval push buttons
• Understanding the interval control area
6-2
Viewing Trace Event Logs with ntrace
• Field editing
Mouse Button Operations
6
Mouse button operations in View mode appear in Table 6-1 and in the NightTrace Pocket
Reference card. Unfamiliar terminology is defined later in this chapter.
Table 6-1. View-Mode Mouse Button Operations
Button
Use Within a Column
Mouse button 1
Move the current time line to the place where the pointer rests, or put the text cursor
where you clicked in the text field.
Hold down <Ctrl> and
click mouse button 1
Move the mark and the current time line to the place where the pointer rests.
Hold down <Ctrl>,
hold down mouse button 1, and drag horizontally
Move the mark to the beginning point of the drag region, and move the current time line
to the ending point of the drag region. The drag region is highlighted as you drag the
pointer.
Mouse button 2
Write a statistic in the message display area that tells about the trace event where the
pointer rests in a StateGraph or EventGraph.
Hold down <Ctrl> and
click mouse button 2
Write a statistic in the message display area that tells how far the pointer is from the
mark. A positive number means the pointer is to the right of the mark. A negative
number means the pointer is to the left of the mark.
Mouse button 3
Write a statistic in the message display area that tells about the data item where the
pointer rests in a DataGraph.
Hold down <Ctrl> and
click mouse button 3
Write a statistic in the message display area that tells how far the pointer is from the current time line. A positive number means the pointer is to the right of the current time
line. A negative number means the pointer is to the left of the current time line.
6-3
NightTrace Manual
The Grid
6
Figure 6-2. The Grid
The grid is a region of the display page that is filled with parallel rows and columns of
dots. These dots serve as reference points for display-object alignment. You can alter the
grid dimensions by changing the size of the display page. To change the display page size,
resize your window by using features of your window manager.
The trace_open_thread() routine and the ntraceud daemon write overhead trace
events into your trace event file. The tags for these trace events are NT_ASSOC_PID and
NT_ASSOC_TID. In View mode, you may see these trace events in display objects on the
grid. ntrace assigns each trace event in the trace session a unique ordinal number or offset beginning with ordinal number 0. These ordinal numbers appear in the interval control
area and in the message display area. For more information on ordinal trace events, see
“The Interval Control Area” on page 6-11.
Some display objects on the grid contain vertical lines. Each vertical line in a StateGraph
or EventGraph represents a user trace event, kernel trace event, or NightTrace overhead
trace event. If you click on a trace event with mouse button 2, ntrace writes information
about that trace event in the message display area. Each vertical line in a DataGraph
represents a trace event argument. If you click on a data value with mouse button 3,
ntrace writes information about the data value in the message display area. For
information about StateGraphs, EventGraphs, and DataGraphs, see “StateGraph” on page
7-14, “EventGraph” on page 7-15, and “DataGraph” on page 7-16.
If your grid has a Column and you have not already positioned your interval somewhere
else, ntrace displays in the Column the earliest 5 percent of your trace session. Usually
this information is uninteresting and you want to see other parts of your trace session. The
following list shows the ways you can get ntrace to locate interesting parts of your trace
session:
• Scroll through the interval using the interval scroll bar
• Zoom in or zoom out using interval push buttons
• Change the parameters defining the interval by editing its fields
6-4
Viewing Trace Event Logs with ntrace
• Use the Tools Ì Search menu item to search for a specific trace event or
condition. (See Chapter 10 for more information.)
Viewing Strategy
6
ntrace is a flexible tool. Depending on your personal preferences and how much you
know about your trace events, there are several ways to locate intervals of interest. The
following flowchart provides information to help you decide what to do next in View
mode.
6-5
NightTrace Manual
Start
Look at the grid
Do one of the following:
Use interval scroll bar to slowly scroll through total trace
run
Is the displayed
information
interesting yet?
No
Click on Zoom Out
Return to Edit mode, alter the display page, and return
to View mode
Click on Tools
Ì Search and set the search criteria
Change settings in the interval control area
Yes
Could the
display use
improvement?
No
Analyze trace event information
Yes
Do one of the following:
Click on Zoom In
Click on Center
Click on Mark, align the interval, and click on
Zoom Region
Stop
Figure 6-3. Deciding What to Do Next in View Mode
6-6
Viewing Trace Event Logs with ntrace
The Interval Scroll Bar
6
Although by its position it may look as if it scrolls the grid, the interval scroll bar scrolls
the interval. Moving the slider of the interval scroll bar allows you to examine different
intervals in your trace session. By moving the slider, you change the displays in display
objects on the grid and in the interval control area. Changes in the display objects are most
obvious when you have a Column that contains both a StateGraph and a Ruler. For more
information on the interval control area, see “The Interval Control Area” on page 6-11.
See Chapter 7 for more information on display objects.
The interval scroll bar is horizontal and extends the entire width of the grid. The left
arrowhead represents the beginning of the entire trace session, not just the part displayed
on the grid or by the interval control area fields. The right arrowhead represents the end of
the entire trace session.
If you have not already positioned your interval somewhere else, the movable slider of the
interval scroll bar is adjacent to the scroll bar’s left arrowhead. When the slider is here, the
Time Start statistic in the interval control area is 0.0000000 seconds. The length of the
slider is proportionate to the amount of the trace session displayed in the interval. By
default, a display page shows 5% of a trace session.
In the following interval scroll bar descriptions, the fields in the interval control area that
are affected by the interval scroll bar include: Current Time, Time Start, Time End,
Event Start, Event End, and Increment. For more information on these fields, see
“The Interval Control Area” on page 6-11.
Figure 6-4. The Interval Scroll Bar
Manipulating the interval scroll bar in the following ways has the following results.
6-7
NightTrace Manual
Table 6-2. Manipulating the Interval Scroll Bar
Action
Mouse
Button
Click
Any
Location
Left
arrowhead
Result
If the interval scroll bar slider is not already at the leftmost position:
• Moves the slider to the left.
• Scrolls backward Increment seconds or Increment percent of
the current display interval.
Click
Any
Right
arrowhead
If the interval scroll bar slider is not already at the rightmost position:
• Moves the slider to the right.
• Scrolls forward Increment seconds or Increment percent of
the current display interval.
Click
1
Between an
arrowhead and
the slider
• Moves the slider to the side you clicked on.
• Scrolls the current interval by twice the number of seconds in
Increment or by twice the percentage in Increment.
Click or
Drag
2
Between an
arrowhead and
the slider
• Moves the slider where you clicked and/or dragged.
• Scrolls the current interval accordingly.
• If your current time line was not centered, centers it.
Drag
1 or 2
Slider
(Same as preceding entry.)
Press and
Hold
Any
Left or right
arrowhead
Causes animated scrolling of data in the direction the arrow points
The Interval Push Buttons
6
Figure 6-5. The Interval Push Buttons
The interval push buttons let you examine different intervals in your trace session. The
eight push buttons appear just below the grid on the display page. In the following push
button descriptions:
• Click on a push button by first pointing to it and then clicking with mouse
button 1.
• Current Time, Time Start, Time End, Time Length, Event
Sta rt, Ev en t En d , and Eve nt C ou n t refer to fields in the interval
control area.
6-8
Viewing Trace Event Logs with ntrace
Except for the Reset push button, each push button has an effect on:
• The fields in the interval control area
• The display objects on the grid
• The current time line on the grid
The effect of clicking on a particular push button appears next.
Apply (the default)
• Validates any field change(s) in the interval control area and takes
appropriate action.
• Makes corresponding changes to other field(s).
• Possibly updates display objects on the grid.
• Possibly moves the current time line in a Column.
• Is equivalent to pressing <Enter>.
Reset
• Restores changed field(s) in the interval control area to the value(s) they
had immediately after the last Apply or <Enter>. This works only if you
have not already pressed <Enter> or clicked on the Apply push button.
• Is equivalent to pressing <Esc>.
Center
• Centers the interval around the current time line in a Column.
• Makes corresponding changes to Time Start, Time End, Event Start,
and Event End.
Mark
• Sets a mark that points to a particular time. A mark is represented by a
solid triangle on the Ruler. ntrace currently supports only one mark. By
default this mark is at time 0.
• Puts a mark at the current time line of all Rulers.
• Is useful before clicking on Zoom Region.
• Can provide a statistic about the distance between your pointer and the
mark.
Some control sequences pertain to the mark, the current time line, and your pointer.
• Simultaneously pressing <Ctrl> and clicking on mouse button 1 moves the
mark and the current time line to the place where your pointer rests.
• Simultaneously holding down <Ctrl> and clicking on mouse button 2
causes ntrace to write a statistic in the message display area that tells
how far your pointer is from the mark. A positive number means your
6-9
NightTrace Manual
pointer is to the right of the mark. A negative number means your pointer is
to the left of the mark.
• Simultaneously holding down <Ctrl> and clicking on mouse button 3
causes ntrace to write a statistic in the message display area that tells
how far your pointer is from the current time line. A positive number
means your pointer is to the right of the current time line. A negative
number means your pointer is to the left of the current time line.
• Simultaneously holding down <Ctrl>, holding down mouse button 1, and
dragging your pointer horizontally in a Column makes ntrace move the
mark to the beginning point of the drag region and move the current time
line to the ending point of the drag region. The region is highlighted as you
drag the pointer.
Zoom Region
• Sets the interval to be the time between the mark and the current time line
(inclusive).
• Sets Time Start to either the mark or the current time line, whichever is
leftmost.
• Sets Time End to either the mark or the current time line, whichever is
rightmost.
• Centers the current time line in a Column.
• Displays an error message in the message display area if the mark and the
current time line are at the same place.
Zoom In
• Centers the interval around the current time line in a Column.
• Divides Time Length by the value of Zoom Factor; this provides a
microscopic view of a smaller interval.
• Makes corresponding changes to Time Start, Time End, Event Start,
Event Count, and Event End.
Zoom Out
• Centers the interval around the current time line in a Column.
• Multiplies Time Length by the value of Zoom Factor; this provides a
macroscopic view of a larger interval.
• Makes corresponding changes to Time Start, Time End, Event Start,
Event Count, and Event End.
Refresh
• Updates the grid to reflect the result of changes in configuration.
• Is implicit with any action that updates the grid.
• Should be used when you:
6-10
Viewing Trace Event Logs with ntrace
-
Open a display page
Switch to View mode from Edit mode
Change a configuration parameter from View mode
Resize the grid
• Differs from the X window manager’s Refresh which redraws the
windows without notifying ntrace.
The Interval Control Area
6
The interval control area is a region of the display page that contains nine fields of
statistics. If you have not already positioned your interval somewhere else, ntrace
displays in the interval control area the earliest 5 percent of your trace session. Usually
this information is uninteresting and you want to see other parts of your trace session. You
can do two things with the statistics in the interval control area:
• Read the fields to obtain information about the interval
• Edit the fields to change the interval
Figure 6-6. The Interval Control Area
Reading Fields
6
All field values in the interval control area are non-negative numbers. Some fields have
default values. Time fields all display the time in seconds with the “s” suffix. A
description of each field follows. In the following text, interval is the time from Time
Start through Time End.
Time Start
Is the beginning time of the interval in seconds.
Time End
Is the ending time of the interval in seconds.
Time Length
Is the amount of time within this interval in seconds. It is the
difference between Time End and Time Start.
Current Time
Is the present time within the interval in seconds.
Event Start
Is the ordinal number (offset), not the trace event ID, of the first trace
event in this interval.
6-11
NightTrace Manual
Event End
Is the ordinal number (offset), not the trace event ID, of the last trace
event in this interval.
Event Count
Is the quantity of trace events present in this interval. It is the
difference between Event End and Event Start plus one.
Zoom Factor
Is the number of times to magnify (or reduce) the interval each time
you click on Zoom Out (or Zoom In). The default is 2.
Increment
Controls how much the current interval scrolls (and the slider moves)
when you click on an arrowhead of the interval scroll bar or between
an arrowhead and the slider on the interval scroll bar.
This field may contain either a percentage or an absolute amount of
time in seconds. The default is 25%.
Editing Single Fields
6
Changing the interval control area fields allows you to examine different intervals in your
trace session. Usually you modify fields in the interval control area when you already
know something about your trace events and their distribution.
When you press <Enter> or click on the Apply push button at the end of your editing,
ntrace validates the data in each field you modified and takes appropriate action. If
ntrace detects an invalid value, it restores the affected field to its previous value. For
more information on the Apply push button, see “The Interval Push Buttons” on page 6-8.
ntrace displays all times in the interval control area in seconds with the “s” suffix. You
can enter times into time-related fields in the following ways:
• Numeric time. ntrace assumes that the time unit is seconds.
• Numeric time in seconds with a “s” suffix.
• Numeric time in microseconds with a “u” suffix.
The following text explains what constitutes a valid field change and describes the effects
of changing a single field. For general information on field editing, see “Field Editing” on
page 6-16.
Time Start
A valid change keeps Time Start less than the ending time in the
trace session. The new interval starts at the specified time. Time
Length remains unchanged, but other fields, including Time End,
change appropriately.
If you set Time Start to the word start, ntrace resets Time
Start to the start time (0 microseconds) of the trace session.
Time End
6-12
A valid change keeps Time End greater than the beginning time in
the trace session and greater than or equal to Time Length. The
new interval ends at the specified time. Time Le ng th remains
unchanged, but other fields, including Time Start, change appropriately.
Viewing Trace Event Logs with ntrace
If you change Time End so it is smaller than Time Length,
ntrace sets Time End to Time Length. If you set Time End to
the word end or an arbitrarily large number, ntrace resets Time
End to the last time recorded in the trace event file(s) and changes
other fields appropriately.
Time Length
A valid change keeps Time Length greater than 0 and less than or
equal to the last recorded time in the trace session. The new interval
length is the specified length. Time End and other fields change
appropriately.
If you set Time Length to the word all or an arbitrarily large
number, ntrace resets Time Length to the last time recorded in
the trace event file(s) and changes other fields appropriately.
Current Time
The current time is the specified time.
If the new current time is inside the current interval, the current time
line moves appropriately in any Columns and the current interval
remains unchanged.
If the new current time is outside the current interval, the interval
shifts so the current time is centered in the interval, the current time
line is centered in any Columns, and the interval length remains
unchanged.
Event Start
A valid change keeps Event Start less than the number of trace
events logged in the trace session. The new interval starts at the
specified ordinal trace event number (offset). Tim e L e n g t h
remains unchanged, but other fields change appropriately.
If you set Event Start to the word start, ntrace resets Event
Start to 0 and Time Start to 0 microseconds.
Event End
A valid change keeps Event End non-negative. The new interval
ends at the specified ordinal trace event number (offset). Tim e
Length remains unchanged, but other fields change appropriately.
If you set Event End to the word end, or an arbitrarily large number, ntrace resets Event End to the total number of trace events
in your trace event file(s).
Event Count
A valid change keeps Event Count less than or equal to the ordinal
position (offset) of the last trace event recorded in the trace session.
The new trace event count is the specified count. Fields change
appropriately.
If you set Event Count to the word all or an arbitrarily large
number, ntrace resets Event Count to the total number of trace
events in your trace event file(s) and changes other fields appropriately.
Zoom Factor
A valid change keeps Zoom Factor greater than or equal to 1. If
you set Zoom Factor to the word default or a space, ntrace
resets Zoom Factor to the default value, 2.
6-13
NightTrace Manual
Increment
A valid change keeps percentages greater than 0% and less than or
equal to 100% and absolute numbers greater than 0 microseconds
and less than or equal to the end time of the trace session. If you set
I n c r e me n t to the word default or a space, ntrace resets
Increment to the default value, 25%.
If Increment is less than 100% when you click on an interval scroll
bar arrowhead, you see part of the previous interval in this interval.
However, if Increment is equal to 100%, you see a completely new
interval.
For more information on the interval scroll bar, see “The Interval
Scroll Bar” on page 6-7.
Figure 6-7. Amount of Scrolling Due to Increment Value
Editing Multiple Fields
6
Sometimes it makes sense to change multiple fields for a single effect; for example, you
may wish to change both the Time Start and Time End fields or you may wish to
change both the Time Star t and Eve nt Co u nt fields. In these cases, apply your
changes only once, after you have edited each field of interest.
Changing some combinations of fields is not meaningful; for example, you may try to
change both Time Length and Event Count. When ntrace detects a meaningless
combination of changes, it displays an error message in the message display area and
restores the affected fields to their previous values. When ntrace detects an invalid
value, it restores the affected field to its previous value.
Some general rules apply to multiple field editing.
• You must not simultaneously apply changes to more than two trace event
fields.
• You must not simultaneously apply changes to more than two time fields;
for these purposes Current Time is not considered to be a time field.
• You can change Current Time with any other valid field changes as long
as Current Time falls within the new interval.
• You can change Zoom Factor with any other valid field changes.
6-14
Viewing Trace Event Logs with ntrace
• You can change Increment with any other valid field changes.
• Simultaneously modifying one time field and clearing another time field
makes ntrace use the static and modified fields to determine the values
of the cleared time field and the other fields.
• Simultaneously modifying one trace event field and clearing another trace
event field makes ntrace use the static and modified fields to determine
the values of the cleared trace event field and the other fields.
The following table shows all the valid multiple field changes except those that involve
Current Time, Zoom Factor, or Increment. For information on editing specific
fields of the interval control area, see “The Interval Control Area” on page 6-11. For
general information on field editing, see “Field Editing” on page 6-16.
Table 6-3. Valid Multiple Field Changes
Fields
Result
Time Start
Time End
The new interval starts at Time Start and ends at Time End.
Time Start
Time Length
The new interval starts at Time Start and has a length of the specified Time Length.
Time Length
Time End
The new interval ends at Time End and has a length of the specified
Time Length.
Event Start
Event End
The new interval starts at ordinal trace event number (offset) Event
Start and ends at ordinal trace event number (offset) Event End.
Event Start
Event Count
The new interval starts at ordinal trace event number (offset) Event
Start and includes the specified quantity of trace events.
Event Count
Event End
The new interval ends at ordinal trace event number (offset) Event
End and includes the specified quantity of trace events.
Time Start
Event Count
The new interval starts at Time Start and includes the specified
quantity of trace events unless the Time Length forces Time Start
to change.
Time End
Event Count
The new interval ends at Time End and includes the specified
quantity of trace events unless the Time Length forces Time End
to change.
Event Start
Time Length
The new interval starts at ordinal trace event number (offset) Event
Start and has a length of the specified Time Length unless the
Time Length forces Event Start to change.
Event End
Time Length
The new interval ends at ordinal trace event number (offset) Event
End and has a length of the specified Time Length unless the
Time Length forces Event End to change.
6-15
NightTrace Manual
Field Editing
6
You make changes to fields by following these steps:
1. Do one of the following:
• Click with a mouse button on the field you want to edit. Clicking
with mouse button 1 leaves a blinking vertical bar called the text
cursor where you clicked in the field. Clicking with the other mouse
buttons leaves the text cursor at the end of the field.
• Drag with mouse button 1 on the field you want to edit.
• If there already is a text cursor in a field, you can press <Tab> to
move to the next field or <Shift> <Tab> to move to the previous
field.
2. Use the built-in field editor to change values. Editing procedures follow.
3. Either press <Enter> or click on the Apply push button. This is called
applying your changes.
Editing Text Fields
6
You can make the following types of editing changes in a text field:
• Insert text
• Delete text
• Replace text
• Undo a text change
Table 6-4. Making Editing Changes
Goal
Steps to Attain Goal
Insert
character(s)
1. Position the text cursor where you want to insert character(s).
2. Type in the additional character(s).
Delete one character
to the right
1. Position the text cursor to the left of the character to be deleted.
2. Simultaneously press <Ctrl> <d>.
Delete one character
to the left
1. Position the text cursor to the right of the character to be deleted.
2. Either press <Backspace>, <Delete>, or simultaneously press
<Ctrl> <h>.
6-16
Viewing Trace Event Logs with ntrace
Table 6-4. Making Editing Changes
Goal
Steps to Attain Goal
Delete adjacent
character(s)
1. Point to the first character to be deleted.
2. Drag the pointer across any other characters to be deleted, release the mouse button,
and keep the pointer in the field. This highlights the characters you dragged the
pointer across.
3. Either press <Backspace>, <Delete>, or simultaneously press
<Ctrl> <h>.
Replace adjacent
character(s)
1. Point to the first character to be replaced.
2. Drag the pointer across any other characters to be replaced, release the mouse button,
and keep the pointer in the field. This highlights the characters you dragged the
pointer across.
3. Type in the new character(s).
Replace all
character(s)
1. Position the text cursor anywhere in the field you want to modify.
2. Simultaneously press <Ctrl> <u>. This highlights all characters in the field.
3. Type in the new character(s).
Restore the
default value
1. Replace all character(s) in the field with either a single space character or the word
default. Note: Some fields do not have default values.
2. Press <Enter> or click on Apply.
Undo editing change(s)
since the last <Enter>
or Apply
1. Position in the window you want to modify.
2. Press <Esc> (or click on Reset if this is available).
Sometimes it is desirable to change multiple fields before applying the changes. In these
cases, apply your changes only once, after you have edited each field of interest.
When you press <Enter> or click on Apply at the end of your editing, ntrace validates
the data in each field you modified. ntrace rarely issues error messages about editing
errors it detects. Usually it takes a default action. Some of the default actions include:
• If you enter an invalid value, for example alphabetic characters in a
numeric field, ntrace ignores the changes and restores the previous values.
• Usually, if you enter a number that exceeds the maximum value, ntrace
replaces it with the maximum value.
• If a range’s starting value exceeds its ending value, ntrace swaps them.
6-17
NightTrace Manual
Positioning Within Text Fields
6
You can either position the text cursor to a particular place within a field by either clicking
or typing in key sequences. The following key sequences move the text cursor only if you
are already positioned in a text field.
Table 6-5. Positioning Within a Text Field
Goal
6-18
Steps to Attain Goal
Move text cursor left
one character
Press <LeftArrow> or simultaneously press <Ctrl> <b>.
This action may cause scrolling.
Move text cursor right
one character
Press <RightArrow> or simultaneously press <Ctrl> <f>.
This action may cause scrolling.
Move text cursor to next
field
Press <Tab>.
Move text cursor to previous field
Press <Shift> <Tab>.
7
Creating Display Objects
Overview . . . . . . . . . . . . . . . . . . . . . . . . . . . . . . . . . . . . . . . . . . . . . . . . . . . . . . . . . .
The Display Page. . . . . . . . . . . . . . . . . . . . . . . . . . . . . . . . . . . . . . . . . . . . . . . . . . . .
Display Page Modes . . . . . . . . . . . . . . . . . . . . . . . . . . . . . . . . . . . . . . . . . . . . . . . . .
Edit Mode . . . . . . . . . . . . . . . . . . . . . . . . . . . . . . . . . . . . . . . . . . . . . . . . . . . . . .
View Mode . . . . . . . . . . . . . . . . . . . . . . . . . . . . . . . . . . . . . . . . . . . . . . . . . . . . .
Operations on Display Objects . . . . . . . . . . . . . . . . . . . . . . . . . . . . . . . . . . . . . . . . .
Creating Display Objects . . . . . . . . . . . . . . . . . . . . . . . . . . . . . . . . . . . . . . . . . .
Selecting Display Objects. . . . . . . . . . . . . . . . . . . . . . . . . . . . . . . . . . . . . . . . . .
Moving Display Objects. . . . . . . . . . . . . . . . . . . . . . . . . . . . . . . . . . . . . . . . . . .
Resizing Display Objects . . . . . . . . . . . . . . . . . . . . . . . . . . . . . . . . . . . . . . . . . .
Display Objects . . . . . . . . . . . . . . . . . . . . . . . . . . . . . . . . . . . . . . . . . . . . . . . . . . . . .
GridLabel . . . . . . . . . . . . . . . . . . . . . . . . . . . . . . . . . . . . . . . . . . . . . . . . . . . . . .
DataBox . . . . . . . . . . . . . . . . . . . . . . . . . . . . . . . . . . . . . . . . . . . . . . . . . . . . . . .
Column . . . . . . . . . . . . . . . . . . . . . . . . . . . . . . . . . . . . . . . . . . . . . . . . . . . . . . . .
StateGraph . . . . . . . . . . . . . . . . . . . . . . . . . . . . . . . . . . . . . . . . . . . . . . . . . . . . .
EventGraph. . . . . . . . . . . . . . . . . . . . . . . . . . . . . . . . . . . . . . . . . . . . . . . . . . . . .
DataGraph. . . . . . . . . . . . . . . . . . . . . . . . . . . . . . . . . . . . . . . . . . . . . . . . . . . . . .
Ruler . . . . . . . . . . . . . . . . . . . . . . . . . . . . . . . . . . . . . . . . . . . . . . . . . . . . . . . . . .
Editing Operations . . . . . . . . . . . . . . . . . . . . . . . . . . . . . . . . . . . . . . . . . . . . . . . . . . .
Select All . . . . . . . . . . . . . . . . . . . . . . . . . . . . . . . . . . . . . . . . . . . . . . . . . . . . . .
Deselect All . . . . . . . . . . . . . . . . . . . . . . . . . . . . . . . . . . . . . . . . . . . . . . . . . . . .
Delete . . . . . . . . . . . . . . . . . . . . . . . . . . . . . . . . . . . . . . . . . . . . . . . . . . . . . . . . .
File Operations . . . . . . . . . . . . . . . . . . . . . . . . . . . . . . . . . . . . . . . . . . . . . . . . . . . . .
Save . . . . . . . . . . . . . . . . . . . . . . . . . . . . . . . . . . . . . . . . . . . . . . . . . . . . . . . . . .
Save As .... . . . . . . . . . . . . . . . . . . . . . . . . . . . . . . . . . . . . . . . . . . . . . . . . . . . . .
Close . . . . . . . . . . . . . . . . . . . . . . . . . . . . . . . . . . . . . . . . . . . . . . . . . . . . . . . . . .
7-1
7-2
7-3
7-4
7-4
7-4
7-5
7-6
7-7
7-7
7-8
7-12
7-12
7-13
7-14
7-15
7-16
7-17
7-17
7-18
7-18
7-18
7-18
7-18
7-19
7-19
NightTrace Manual
7
Chapter 7 Creating Display Objects
7 sC
7
7
Overview
7
Figure 7-1. Display Page with Display Objects
Figure 7-1 shows what a display page may look like when you invoke ntrace and
specify the default display page. The default display page contains display objects. (See
“Default Page” on page 5-28.) Display objects filter, process, and display the information
in the trace event file. These display objects are created with the display page and then
viewed on the display page. You may want to create your own set of display objects to
view your trace event file. To do this, follow the steps below.
1. Read “The Display Page” on page 7-2 to learn about the various parts of a
display page.
2. Read “The Display Page” on page 7-2, which describes the different modes
a display page can be in: Edit and View.
7-1
NightTrace Manual
3. Put the display in Edit mode.
4. Read “Display Objects” on page 7-8, which explains what a display object
is and what the different types of display objects you can put on your
display page are.
5. Read “Operations on Display Objects” on page 7-4, which explains how to
perform various operations (creating, selecting, moving and resizing) on
display objects.
6. Create the various display objects you want and place them on the display
page. Move or resize any display objects necessary to improve the layout
of the page.
The Display Page
Figure 7-2. Elements of a Display Page
7-2
7
Creating Display Objects
A display page lets you view the trace event data in the trace event file. Figure 7-2 shows
an example of a display page and points out the portions of the display page. Following is
a brief description of the portions of a display page:
Menu bar
Contains menu items. When you click on a menu item in the
menu bar, a pull-down menu appears with a list of related
menu entries. You can then initiate an operation on the menu.
Mode buttons
Are radio buttons that control whether the display page is in
Edit or View mode and allow you to switch between modes by
clicking on them.
Message display area Displays error and status messages. It has a scroll bar so you
can view previous or current messages.
Grid
Contains display objects. Figure 7-2 shows a grid before any
display objects have been created.
Interval control area Contains information on the current interval being displayed
and the controls to manipulate the display.
Display Page Modes
7
Figure 7-3. Edit and View Mode Buttons
Display pages can be operated in one of two modes: Edit mode or View mode. Edit mode
lets you make changes to the display objects. View mode lets you view the execution of
your application via the trace event file. The buttons for Edit and View mode are in the
upper left-hand corner of the display page. If the display is in Edit mode, the button beside
the word “Edit” is depressed. Otherwise, the View button is depressed and the display
will be in View mode. To change modes, click with any mouse button on the button beside
the desired mode.
7-3
NightTrace Manual
Edit Mode
7
When the display page is in Edit mode, you can perform any of the operations on the menu
bar except Tools, which is disabled (dimmed). The interval scroll bar, push buttons, and
fields in the interval control area are disabled too.
View Mode
7
Once you have created a set of display objects and configured them, you can view the
trace event information in the trace event file.
To view the data in the trace event file, the display page must be in View mode. However,
if the display page is in View mode, you will not be able to create, edit, or configure
display objects. See Chapter 6 for information on running (viewing) a display page.
Operations on Display Objects
7
This section describes some operations you can perform on display objects. The four
operations discussed are:
• Creating new display objects and placing them on the grid
• Selecting display objects
• Moving display objects around the grid
• Resizing display objects
Each of these operations involves using the mouse buttons and the grid. Figure 7-4,
Table 7-1, and the NightTrace Pocket Reference card show which mouse buttons
correspond to which operations. These operations are referred to as grid operations. You
can perform other operations on display objects using the Edit and Configure menus.
Edit operations are discussed later in this chapter. See Chapter 8 for more information on
configure operations.
7-4
Creating Display Objects
Create or Select
Resize
Move
Figure 7-4. Button Functions on a Mouse
Table 7-1. Edit-Mode Mouse Button Operations
Button
Use Within the Grid
Mouse button 1
Create new objects, single select by clicking, or
multiple select by dragging
<Ctrl> mouse button 1
Select the Column display object
<Shift> mouse button
1
Multiple select or toggle selection
Mouse button 2
Move display objects
<Ctrl> mouse button 2
Move the Column display object
Mouse button 3
Resize display objects
<Ctrl> mouse button 3
Resize the Column display object
Creating Display Objects
7
Before you can do any of the other operations, you must first create a display object.
When you create a display object, you choose its place on the grid and its size.
7-5
NightTrace Manual
Creating display objects involves three steps: selecting (loading) the type of display
object to be drawn, selecting the place on the grid where the display object will go, and
selecting the size of the display object.
Some display objects go only inside of other display objects. StateGraphs, EventGraphs,
DataGraphs and Rulers go only inside a Column.
To create a display object and place it on the grid, do the following:
1. Place the pointer on the Create entry on the menu bar and click mouse
button 1.
2. Select the type of display object you want to create. Note that the pointer is
now a crosshair. The display object is now “loaded.”
3. Move the pointer until it is on the grid where you want to place a corner of
the display object. As mentioned previously, some display objects go only
inside of Columns. If the cursor is on the border of a Column or outside of
one, you will not be able to draw these display objects. Note that the left
and right sides of these display objects are determined by the Column, and
you only have to place the pointer somewhere on the intended top or
bottom edge of the display object.
4. Click and drag mouse button 1 until the display object is the size you want
it to be. While you are sizing a display object, its boundaries are shown as
dashed lines. Note that if you press the <Esc> key before releasing mouse
button 1, the operation aborts. The display object is still loaded, as signified
by the crosshair at the pointer location, so you can immediately try to
recreate the display object. Also note that display objects must not overlap
(except for graphical display objects, which must overlap a Column).
5. Release mouse button 1. The display object should appear on your grid
with solid line boundaries, unless there was an error (e.g., you placed a
DataBox on top of an existing GridLabel). Notice that the display object is
also selected (corners have handles). This is in case you want to move,
configure, or resize it at this time.
Selecting Display Objects
7
Often, you must select a display object before performing grid and edit operations. For
example, before you can resize a display object you must first select the display object.
To select a single display object, simply click on the display object with mouse button 1.
The display object now has handles at the corners, indicating that the display object is
selected.
When display objects are inside a Column, it is sometimes difficult to select the Column.
To select an unselected Column, hold down the <Control> key and click mouse button 1.
If you perform the same action in a selected Column, the Column is deselected.
You can select multiple display objects three different ways. The first way to select
multiple display objects is as follows:
1. Position the cursor outside the display objects you want to select.
7-6
Creating Display Objects
2. Click mouse button 1 and drag the mouse until the rectangle that is formed
completely surrounds only the display objects you want to select. If a
display object is not completely surrounded by the rectangle, it will not be
selected.
3. Release mouse button 1. The display objects that were within the rectangle
will now have handles at each corner.
The second way to select multiple display objects is by using the <Shift> key. Holding
down the <Shift> key and clicking mouse button 1 while the cursor is in an unselected
display object selects that display object without deselecting any other display objects.
This allows you to select any set of display objects that you want. If you perform the same
action in a display object that is already selected, the display object is deselected.
The third way to select multiple display objects is described in “Select All” on page 7-18.
Moving Display Objects
7
To move a display object to somewhere else on the grid, do the following:
1. Select the display object(s). Refer to “Selecting Display Objects” on page
7-6.
2. Using the mouse button 2, click anywhere on or within the selected display
object(s) and drag to the desired location.
3. Release the middle button.
When display objects are inside a Column, it is sometimes difficult to move the Column.
To move a selected Column, hold down the <Control> key and click mouse button 2.
Display objects must not overlap, except certain display objects must be placed inside a
Column. If you try to move a display object on top of another display object, ntrace
displays an error message in the message display area and aborts the move.
Resizing Display Objects
7
To resize a display object on the grid, do the following:
1. Select the display object. See “Selecting Display Objects” on page 7-6 for
more information.
2. Using mouse button 3, click on a handle and drag until the desired size is
reached.
3. Release the right button.
When display objects are inside a Column, it is sometimes difficult to resize the Column.
To resize a selected Column, hold down the <Control> key and click mouse button 3.
Note that a Column cannot be vertically resized smaller than the minimum space required
to hold all the StateGraphs, EventGraphs, DataGraphs and Rulers that it contains.
7-7
NightTrace Manual
Display objects must not overlap, with the exception that certain display objects need to be
placed inside a Column. If you try to resize a display object on top of another display
object, ntrace displays an error message in the message display area and aborts the
resize.
Display Objects
7
Figure 7-5. Create Display Objects Menu
Display objects, which are created via the Create menu shown in Figure 7-5, can be
thought of as combination filters and formatters for the data stored in the trace event file.
Every time a display object is updated, it filters through the data in the trace event file. The
display object accepts input in the form of a trace event record, processes and reformats
the information, and displays it. The following information is in a trace event record:
numeric trace event ID, global process identifier (PID), NightTrace thread identifier
(TID), time, and optional arguments. NightTrace also keeps track of the ordinal number
(offset) of a trace event. You can use ntrace functions to express any of these values.
For more information about functions, see “Functions” on page 9-9.
Although the trace event file contains trace events, it also implicitly contains states. The
concepts of trace events and states are key to understanding display objects.
trace event
Corresponds to the point in the execution of your application when a
trace_event() call was executed. All the data logged at that
time (trace event ID, arguments, etc.) is considered a trace event.
state
A state is bounded by two trace events, a start event and an end event.
An instance of a state is the period of time between the start event
and end event, including the start and end events themselves. Additional conditions may be specified in a state definition to further constrain the state. Instances of states do not nest; that is, once a state
becomes active, events that might normally satisfy the conditions for
the start event are ignored until the end event is encountered.
Different types of display objects display information in different ways. Depending on the
type of information you want to display, you choose the display object or objects you wish
7-8
Creating Display Objects
to create. You can then configure those display objects to filter out unwanted data and
process the information that you want displayed. This allows you to watch only the data of
interest. Of course, all of this is dependent on the application having the necessary
trace_event() calls enabled and inserted in the appropriate places.
All display objects are rectangular, but you specify the dimensions of the rectangle. Other
properties of display objects you should be aware of are:
• Display objects can be dynamic or static. Dynamic means the contents vary
depending on values in the trace event file and may change depending on
what point in the execution of the application you are looking at. Static
means the contents do not change. All display objects except the GridLabel
and the Ruler are dynamic.
• Display objects can be configurable or non-configurable. Configurable
means you define the parameters that determine the content of the display
object. Non-configurable means the display object has no parameters. All
display objects except the Column are configurable.
• Display objects can be textual or graphical. Textual means the contents
consist of words or numbers. Graphical means the contents are lines or
shapes, like a bar chart.
• Display objects can be scrollable or non-scrollable. Scrollable means the
display object acts as a movable window into the trace event file.
The basic types of display objects you can create are listed below and discussed in the following sections.
GridLabel
Static textual display object that contains a user-specified string of
text and is used to label other display objects for clarity.
DataBox
Dynamic display object that displays textual information, such as the
trace event tag or the time the trace event occurred. Its main use is to
display data that does not lend itself to graphical representation.
Column
Dynamic display object that does not display data itself but holds the
scrollable graphical display objects: StateGraphs, EventGraphs, DataGraphs, and Rulers. Its purpose is to group together related graphical display objects. It is the only non-configurable display object.
StateGraph
Dynamic, scrollable, graphical display object that displays a state as
a bar and other trace events as a vertical line. It indicates the states’
and trace events’ relative positions in time since the trace started.
This display object is usually used if you want to know when the
application enters and exits a particular user-defined state.
EventGraph
Dynamic, scrollable, graphical display object that displays a trace
event as a vertical line and indicates its relative position in time since
the trace started. Use this display object if you want to know when
particular trace events occur.
DataGraph
Dynamic, scrollable, graphical display object that displays a data as a
vertical line or bar and indicates its relative position in time since the
trace started. The height of the line or bar can be made proportional
to the value of a trace event argument or other data. Use this display
7-9
NightTrace Manual
object to display relative values of arguments in the trace event
record.
Ruler
Static, scrollable, graphical display object resembling a Ruler that
displays the time. Rulers are used with StateGraphs, EventGraphs,
and DataGraphs to show what time a trace event occurred.
Each display page can hold multiple instances of these display objects, usually with each
display object uniquely configured. All display objects on all display pages reflect the
same interval; display object type, size, configuration, and position have no bearing.
Display objects just created in Edit mode contain little useful information. The
illustrations of display objects in this chapter show the display objects in View mode.
Figure 7-6 contains a flowchart to help you decide what display objects suit your needs.
To use the flowchart, decide what type of information you want to display. Then start at
the upper left-hand corner of the chart in the box labeled “Start.”
7-10
Creating Display Objects
Start
Do you
want to
display text
or graphics?
Text
Is the text
constant?
Yes
No
Use a
DataBox
Graphics
Do you
want a time
Ruler?
Create a
Column
Use a
GridLabel
Yes
Use a
Ruler
No
Do you
want to
graph states
or events?
Yes
Use a StateGraph
or Event Graph
No
No
Stop
Do you
want to graph
argument or
expression
values?
Yes
Use a
DataGraph
7-11
NightTrace Manual
Figure 7-6. Display Object Use Flowchart
GridLabel
7
Figure 7-7. GridLabel Examples
Clicking on Create Ì GridLabel lets you draw or create a GridLabel display object on
the grid. A GridLabel is a rectangle that contains a string of text. This text usually is a title
or description of an adjacent display object on the grid and makes the display page easier
to interpret. GridLabels can appear anywhere on the grid, but they cannot go inside a
Column. You can put several GridLabels on a grid.
If the text is too long to fit into the GridLabel, the lower right corner of the box is filled in.
If this occurs, you should resize the GridLabel. This is described in “Resizing Display
Objects” on page 7-7. A newly created label contains the word label. See “GridLabel”
on page 8-12 for more information.
GridLabels are static display objects. That is, a GridLabel does not change its appearance
or contents depending on the trace event data.
In addition to specifying the text inside of the GridLabel, you also specify the color of the
text (and background), the font of the text, and where in the box the text will appear (for
example, top vs. bottom). See Chapter 8 for more information.
DataBox
7
Figure 7-8. DataBox Examples
Clicking on Create Ì DataBox lets you draw or create a DataBox display object on the
grid. A DataBox is a rectangle that textually displays data from the trace event file.
7-12
Creating Display Objects
Although the data is usually related to the last trace event received, it can also be a cumulative total or other manipulations of data in the trace event file.
DataBoxes are useful when you want to display data that does not lend itself to graphical
representation, as shown in Figure 7-8. This figure shows three databoxes: the top
DataBox contains the interrupt name, the middle contains the exception name and the bottom contains the syscall name. If the value is too large to fit into the DataBox (e.g., a long
trace event tag), the lower right corner of the box is filled in. If this occurs, you should
resize the DataBox. This is described in “Resizing Display Objects” on page 7-7. By
default, numeric data is displayed in decimal integer. (For information about overriding
this default, see “Understanding Event-Map Files” on page 5-9, “format()” on page 9-80,
and “get_format()” on page 9-79.) A newly created DataBox contains a 0. See “DataBox”
on page 8-13 for more information.
DataBoxes can appear anywhere on the grid except within a Column. You can put several
DataBoxes on a grid.
Some examples of data that you can configure a DataBox to show are:
• Τhe tag of the last trace event before the current time (See Table 8-3.)
• Τhe NightTrace thread name of the last trace event before the current time
(See Table 8-3.)
• A particular argument logged with the last trace event before the current
time (See “arg()” on page 9-20.)
• Τhe total amount of time the application was in a particular state before the
current time (See “state_dur()” on page 9-57 and “sum()” on page 9-72.)
• Τhe number of times a particular trace event has occurred before the
current time (See “event_matches()” on page 9-33.)
• A string of characters generated by a format expression (See “format()” on
page 9-80.)
Column
7
Figure 7-9. Column Example
Clicking on Create Ì Column lets you draw or create a Column display object on the
grid. When a Column is first created, it is an empty rectangle that does not display data of
its own. A Column holds StateGraphs, EventGraphs, DataGraphs and Rulers. It provides a
convenient way of associating these graphical display objects. Figure 7-9 shows a Column
after a Ruler has been added.
7-13
NightTrace Manual
Columns ensure that all graphical display objects within them have the same physical
starting point and ending point and the same time scale. Columns are not configured, so
the only variations between Columns are in their height and width.
Without a Column, you cannot put any StateGraphs, EventGraphs, DataGraphs or Rulers
on your grid, so you must create a Column before you can create any of these display
objects.
You can place a Column anywhere on the grid. You can put more than one Column on a
grid. This allows you to group related graphical objects together. All of the Columns,
however, show the same interval and current time in View mode.
To hold a Ruler and any other graphical display object, Columns must be at least five grid
dots high. Wider Columns are recommended because they determine the resolution to
which trace events can be displayed.
TIP:
On a monochrome display, make sure that you can differentiate among display objects
within a Column. The easiest way to do this is to leave at least one grid dot between
display objects in a Column and to make the background color of the Column black. For
more information on setting a Column’s background color, see “Default X-Resource Settings for ntrace” on page B-2.
StateGraph
7
Figure 7-10. StateGraph Example
A state is bounded by two user-specified trace events, a start event and an end event. An
instance of a state is the period of time between the start event and end event, including the
start and end events themselves. A StateGraph represents an instance of a state as a solid
horizontal bar that starts when the state is active and ends when the state is inactive.
Instances of the same state do not nest; thus, once a state becomes active, events that
might normally satisfy the conditions for the start event are ignored until the end event is
encountered. You can create a StateGraph by clicking on Cre ate Ì StateGraph and
drawing on the grid.
StateGraphs must be placed in a Column. A StateGraph and a Ruler are shown in
Figure 7-10.
A StateGraph can display trace events in a manner identical to an EventGraph. This can
be useful for saving screen space or detecting when state start and state end trace events
occur out of order. For example, the trace event lines can show multiple state start trace
events occurring before a state end trace event.
Some examples of information that StateGraphs can be used to display are:
7-14
Creating Display Objects
• The times your application is executing a particular subroutine
• The differences in the execution speed of parallel threads
• The time spent in contention for resources
See “StateGraph” on page 8-14 for more information.
In View mode, to find out more information about a particular trace event, position the
cursor on a trace event line and click once with mouse button 2. Information about that
trace event is displayed in the message display area. You can also click with mouse button
2 on the start and end of a displayed state to obtain information about the state start and
state end trace events.
EventGraph
7
Figure 7-11. EventGraph Example
Clicking on Create Ì EventGraph lets you draw or create an EventGraph display
object on the grid. An EventGraph represents trace events as a thin vertical line. EventGraphs must be placed in a Column. Figure 7-11 shows an EventGraph with a Ruler
below it.
Some examples of information that an EventGraph can be used to display are:
• The times your application starts executing a particular subroutine
• The sequence of execution of various modules in your application
• The timing of the birth and death of child processes
See “EventGraph” on page 8-16 for more information.
In View mode, to find out more information about a particular trace event, position the
cursor on the line and click once with mouse button 2. Information about that trace event
is displayed in the message display area.
7-15
NightTrace Manual
DataGraph
7
Figure 7-12. DataGraph Examples
Clicking on Create Ì DataGraph lets you draw or create a DataGraph display object on
the grid. DataGraphs must be placed in a Column. They represent data as either vertical
lines or bars of varying height. In Figure 7-12 the same set of data is used to draw the two
basic types of DataGraph. The top DataGraph is a line DataGraph, which shows the data
as vertical lines of varying height. The bottom DataGraph is a bar DataGraph, which
consists of bars of varying height. The height of the line or bar is proportional to data from
the trace event file. This display object is usually used to display values of arguments in
the trace event record.
Some examples of ways that a DataGraph can be used are:
• Track the value of an expression over time
• Identify when an application variable takes on an abnormally high or low
value
When choosing a size for your DataGraphs, make sure that they are high enough for you
to distinguish differences in data values. See “DataGraph” on page 8-17 for more
information.
TIP:
The higher you make the DataGraph, the easier it is to differentiate similar data points.
In View mode, to find out about the trace event that caused the data value expression to be
evaluated at a particular point, position the cursor on the line (or bar) and click once with
mouse button 2. Information about the trace event is displayed in the message display
area.
In View mode, to find out the value of a particular data item, position the cursor on the line
(or bar) and click once with mouse button 3. The value of that data item is displayed in the
message display area.
7-16
Creating Display Objects
Ruler
7
Figure 7-13. Ruler Example
The interval control area, which is described in “The Interval Control Area” on page 6-11,
has three numeric fields that list the beginning, end, and current time for the time interval
displayed in the Column. A Ruler display object, however, displays this information in a
graphical format on the grid. Like their physical counterparts, Ruler display objects have
major and minor hash marks to mark divisions, but the units are of time, not distance.
They represent the amount of time since the first trace event was logged. Usually the first
trace event is logged by the trace_open_thread() call. You can create a Ruler by
clicking on Create Ì Ruler and drawing on the grid.
In addition to hash marks and numbers, Rulers can also have lost-data indicators and a
mark. The lost-data indicator is a reverse-video “L” and indicates the location in time
where NightTrace lost some data. For more information on trace event loss, see “Preventing Trace Events Loss” on page A-1. Marks are explained in “The Interval Push Buttons”
on page 6-8.
Rulers are static display objects. That is, they do not change their appearance or contents
depending on the trace event data. They do change their appearance, however, to reflect
the current interval being displayed.
A Ruler should be at least three grid dots high. In addition to determining the size of the
Ruler, you also specify other aspects of the Ruler. See “Ruler” on page 8-19 for more
information.
Editing Operations
7
Figure 7-14. Edit Menu
7-17
NightTrace Manual
Editing operations are enabled only when the display page is in Edit mode, which is
selected by clicking on the radio button labeled “Edit” in the upper left-hand corner of the
display page.
Select All
7
Select All selects every display object on the grid. This is useful when you want to
perform some operation on every display object on the grid (for example, moving or
deleting every display object).
Deselect All
7
Deselect All deselects every selected display object on the grid.
Delete
7
Delete deletes the selected display object(s).
File Operations
7
Figure 7-15. File Menu
The file operations are accessed through the File operations menu shown in Figure 7-15.
Save
7
Save saves the current display page (including all local macros, qualified events, and
qualified states) to the configuration file you opened. Thus, any changes you have made
since the last Save operation will be saved. You can continue editing or viewing the
display after this operation. The Save operation is disabled (dimmed) if this is a new
7-18
Creating Display Objects
display page, or you have not made any changes since the last time the display page was
saved. Instead, use Save As ....
Save As ...
7
Save As ... saves the current display page to a file other than the one you opened. You
can continue editing or viewing the display after this operation.
Save As ... uses a File Selection Dialog Box to prompt you for a file name. See
“The File Selection Dialog Box” on page 5-33 for more information.
Close
7
Close ends the current editing/viewing session, resets all field and radio button settings,
and clears the message display area. If you have unsaved changes and you do a Close, a
Warning Dialog Box appears, reminding you that you may want to save you changes.
7-19
NightTrace Manual
7-20
8
Configuring Display Objects
Overview . . . . . . . . . . . . . . . . . . . . . . . . . . . . . . . . . . . . . . . . . . . . . . . . . . . . . . . . . .
Common Configuration Parameters . . . . . . . . . . . . . . . . . . . . . . . . . . . . . . . . . . . . .
Display Object Name . . . . . . . . . . . . . . . . . . . . . . . . . . . . . . . . . . . . . . . . . . . . .
Event List . . . . . . . . . . . . . . . . . . . . . . . . . . . . . . . . . . . . . . . . . . . . . . . . . . . . . .
If-Expression . . . . . . . . . . . . . . . . . . . . . . . . . . . . . . . . . . . . . . . . . . . . . . . . . . .
Then-Expression. . . . . . . . . . . . . . . . . . . . . . . . . . . . . . . . . . . . . . . . . . . . . . . . .
CPU List . . . . . . . . . . . . . . . . . . . . . . . . . . . . . . . . . . . . . . . . . . . . . . . . . . . . . . .
PID List . . . . . . . . . . . . . . . . . . . . . . . . . . . . . . . . . . . . . . . . . . . . . . . . . . . . . . .
TID List . . . . . . . . . . . . . . . . . . . . . . . . . . . . . . . . . . . . . . . . . . . . . . . . . . . . . . .
Node List . . . . . . . . . . . . . . . . . . . . . . . . . . . . . . . . . . . . . . . . . . . . . . . . . . . . . .
Foreground Color . . . . . . . . . . . . . . . . . . . . . . . . . . . . . . . . . . . . . . . . . . . . . . . .
Background Color . . . . . . . . . . . . . . . . . . . . . . . . . . . . . . . . . . . . . . . . . . . . . . .
Font. . . . . . . . . . . . . . . . . . . . . . . . . . . . . . . . . . . . . . . . . . . . . . . . . . . . . . . . . . .
Text Justify . . . . . . . . . . . . . . . . . . . . . . . . . . . . . . . . . . . . . . . . . . . . . . . . . . . . .
Text Gravity . . . . . . . . . . . . . . . . . . . . . . . . . . . . . . . . . . . . . . . . . . . . . . . . . . . .
Configuration Form Push Buttons . . . . . . . . . . . . . . . . . . . . . . . . . . . . . . . . . . . . . . .
Specific Configuration Parameters . . . . . . . . . . . . . . . . . . . . . . . . . . . . . . . . . . . . . .
GridLabel . . . . . . . . . . . . . . . . . . . . . . . . . . . . . . . . . . . . . . . . . . . . . . . . . . . . . .
DataBox . . . . . . . . . . . . . . . . . . . . . . . . . . . . . . . . . . . . . . . . . . . . . . . . . . . . . . .
StateGraph . . . . . . . . . . . . . . . . . . . . . . . . . . . . . . . . . . . . . . . . . . . . . . . . . . . . .
EventGraph. . . . . . . . . . . . . . . . . . . . . . . . . . . . . . . . . . . . . . . . . . . . . . . . . . . . .
DataGraph. . . . . . . . . . . . . . . . . . . . . . . . . . . . . . . . . . . . . . . . . . . . . . . . . . . . . .
Ruler . . . . . . . . . . . . . . . . . . . . . . . . . . . . . . . . . . . . . . . . . . . . . . . . . . . . . . . . . .
8-1
8-1
8-4
8-4
8-4
8-5
8-6
8-7
8-8
8-9
8-9
8-9
8-9
8-9
8-10
8-10
8-11
8-12
8-13
8-14
8-16
8-17
8-19
NightTrace Manual
8
Chapter 8Configuring Display Objects
8
8
8
Overview
8
Customizing a display object so that it displays only the information you want it to – in the
way that you want it to – is called configuring. Configuring is done with the Configure Ì
Content menu item shown in Figure 8-1.
Figure 8-1. Configure Command Menu
Sections on configuring display objects discuss the following topics:
• Configuration parameters that are common to many display objects
• Operations you can perform on the configuration data
• Configuration parameters that are specific to each type of display object
NOTE
Columns are the only display objects that are not configurable.
Common Configuration Parameters
8
Different types of configuration parameters exist. Some parameters are concerned with
how the information appears in the display object. These parameters are Foreground
Color, Background Color, Font, Text Justify, Text Gravity, Fill Style, Event
Color, Lost Event Color, Mark Color, Maximum, and Minimum. For each configuration parameter that pertains to color, there is an equivalent X resource. See Appendix B
for more information.
Other parameters are concerned with determining the content of the information in the
display objects. The parameter that does this is Then-Expression.
8-1
NightTrace Manual
The last type of parameter is concerned with constraining the information that appears in
the display object. These parameters act as filters, allowing only data that meets certain
criteria to be displayed. These parameters are Event List, If-Expression, CPU List,
P I D L i s t , T I D L i s t , St a r t - E v e n t s , E n d - E v e n ts , St a r t - E x p r e s s io n , and
End-Expression.
The configuration parameters are changed with the same editing methods used in the
interval control area. See “Field Editing” on page 6-16 for more information. Note that
you can type default or just a space in a field to get the default value.
Many of the display objects share common configuration parameters. These common
configuration parameters are summarized in Table 8-1 and discussed in the following
sections. For more information about configuration parameters, refer to the sections on
configuring the object you are interested in.
Table 8-1. Common Configuration Parameters
Parameter Name
Display Object
Name
Possible Values
Any alphanumeric string beginning with a
letter. Underscores are also
allowed. Spaces are not allowed.
Meaning
The name of the display object.
Any meaningful combination of the following:
Event List
ALL
ALLUSER
ALLKERNEL
NONE
0, 1, 2, ..., 4095
4100, 4101, 4102, ..., 4300
A comma-separated list of alphanumeric strings beginning with letters.
Underscores are also allowed. Spaces
are not allowed.
•
•
•
•
•
•
•
All trace events are caught.
All user trace events are caught.
All kernel trace events are caught.
No trace events are caught.
Listed user trace events are caught.
Listed kernel trace events are caught.
The tags of trace events as specified in
an event-map file are caught. See “Understanding Event-Map Files” on page
5-9 for more information.
If-Expression
Boolean expression
Expression is any valid boolean C-like
expression, possibly containing functions
or macros. See Chapter 9 for more
information.
ThenExpression
Numeric expression or string
Expression is any valid C-like expression,
possibly containing functions or macros.
See Chapter 9 for more information.
ALL
All CPUs are listened to.
NONE
No CPUs are listened to.
1, 2, 3, ...
Listed CPUs are listened to.
CPU List
8-2
•
•
•
•
•
•
•
Configuring Display Objects
Table 8-1. Common Configuration Parameters (Cont.)
Parameter Name
Possible Values
Meaning
Any meaningful combination of the following:
PID List
•
•
•
•
ALL
NONE
123’1, 456’1, 789’1, ...
A comma-separated list of alphanumeric strings beginning with letters.
Underscores are also allowed. Spaces
are not allowed.
•
•
•
•
All PIDs are listened to.
No PIDs are listened to.
Listed PIDs are listened to.
The name of a process.
•
•
•
•
All TIDs are listened to.
No TIDs are listened to.
Listed TIDs are listened to.
The name of a thread as specified in
the trace_open_thread() call.
See “trace_open_thread()” on page
2-9 for more information.
•
•
•
•
All nodes are listened to.
No nodes are listened to.
Listed node IDs are listened to.
The name of a node/host.
Any meaningful combination of the following:
TID List
•
•
•
•
ALL
NONE
123’1, 456’1, 789’1, ...
A comma-separated list of alphanumeric strings beginning with letters.
Underscores are also allowed. Spaces
are not allowed.
Any meaningful combination of the following:
Node List
•
•
•
•
ALL
NONE
0, 1, 4
A comma-separated list of host names.
Spaces are not allowed.
Foreground
Color
The colors your X server supports, as specified in the rgb.txt file.
The color used by the display object to
draw text and graphics in the foreground.
Background
Color
The colors your X server supports as, specified in the rgb.txt file.
The color in the background that any text
and graphics are drawn over.
Font
The fonts your X server supports or are
installed are in the directory
/usr/lib/X11/fonts.
The style of text characters that the display
object uses to display text.
Left
Text is justified on the left side of the
display object.
Center
Text is horizontally centered in the display
object.
Right
Text is justified on the right side of the
display object.
Default
Same as Left, unless a different default is
specified in an X resource.
Text Justify
8-3
NightTrace Manual
Table 8-1. Common Configuration Parameters (Cont.)
Parameter Name
Text Gravity
Possible Values
Meaning
Bottom
Text sinks to the bottom of the display
object.
Center
Text is vertically centered in the display
object.
Top
Text floats to the top of the display object.
Default
Same as Bottom, unless a different default
is specified in an X resource.
Display Object Name
8
The “Display Object Name” is the field at the top of the configuration form. This field is
not titled in the configuration form; instead, it is labeled with the name of a display object
type, for example, DataBox. This parameter allows:
• You to name a particular display object configuration. (By default, newly
created display objects bear the name unnamed_object.)
• You to later define X resources to apply to the named display object. See
Appendix B for more information.
• ntrace to reference the display object by name in error messages.
Event List
8
The Event List parameter restricts the trace events on which the display object can
display information. The display object ignores any trace event IDs or trace event tags that
are not on the trace event list. If an explicit list of trace event tags and trace event IDs is
specified, the tags and IDs on the list must be separated by commas. Only listed trace
events are examined. Qualified events and qualified states must not appear in the list.
If-Expression
8
The If-Expression parameter determines whether the Then-Expression parameter is
evaluated. If-Expressions are boolean, i.e., they should evaluate to false (0) or true
(non-zero). If the If- Exp re ssion is true, the Th en -Ex pr ess io n is evaluated and
displayed in the display object (assuming all other criteria are met). If an If-Expression
evaluates to false, the Then-Expression retains its last value. See Chapter 9 for more
8-4
Configuring Display Objects
information on expressions. Some examples of valid If-Expressions and their effect on
the Then-Expression are shown in Table 8-2.
Table 8-2. Examples of If-Expressions
If-Expression
Effect on Then-Expression
true
Always evaluated
false
Never evaluated
id() == 200
Evaluated if current trace event ID is equal to 200
id() < 200
Evaluated if current trace event ID is less than 200
pid() == 237’1
Evaluated if current global process ID is equal to 237’1
tid() == 895’3
Evaluated if current NightTrace thread ID is equal to 895’3
cpu() == 2 || cpu() == 4
Evaluated if current trace event occurred on CPU 2 or 4
Then-Expression
8
The Then-Expression parameter determines what the output of the display object is
when the If-Expression is true. If the If-Expression is false, the Then-Expression
retains its last value. The possible values are a numeric expression or string. See Chapter 9
for more information on expressions. Some examples of valid Then-Expressions and
their resulting values are shown in Table 8-3.
Table 8-3. Examples of Then-Expressions
Then-Expression
Resulting Value or Meaning
id()
The current trace event ID
arg2()
The second argument of the current trace event
format (“abc=%d”, arg1())
The string “abc=10” if arg1() is 10 (See “format()” on
page 9-80.)
get_string (curr_state, id())
The string from the curr_state string table pointed to by
id() (if any)
get_string (event, id())
Depending on whether trace event ID returned by id() is in
the pre-defined event table, either the trace event ID number or its corresponding trace event tag is displayed. (See
“get_string()” on page 9-75, “Pre-Defined String Tables” on
page 5-14, and “id()” on page 9-19.)
get_string (pid, pid())
Depending on whether the global process identifier returned
by pid() is in the pre-defined pid table, either the global
process identifier (PID) or its corresponding process name is
displayed. (See “get_string()” on page 9-75, “Pre-Defined
String Tables” on page 5-14, and “pid()” on page 9-22.)
8-5
NightTrace Manual
Table 8-3. Examples of Then-Expressions (Cont.)
Then-Expression
Resulting Value or Meaning
get_string (tid, tid())
Depending on whether the NightTrace thread identifier
returned by tid() is in the pre-defined tid table, either
the NightTrace thread identifier (TID) or its corresponding
thread name is displayed. (See “get_string()” on page 9-75,
“Pre-Defined String Tables” on page 5-14, and “tid()” on
page 9-25.)
get_string (boolean, arg)
If arg has the value 0, false is displayed. Otherwise, true
is displayed. (See “get_string()” on page 9-75 and
“Pre-Defined String Tables” on page 5-14)
get_string (syscall, arg)
arg’s value is looked up in the pre-defined syscall table,
and its corresponding system call name is displayed. (This is
meaningful only for NightTrace kernel trace event files.)
(See “get_string()” on page 9-75 and “Kernel String Tables”
on page 11-16.)
get_string (vector, arg)
arg’s value is looked up in the pre-defined vector table,
and its corresponding interrupt or exception name is
displayed. (This is meaningful only for NightTrace kernel
trace event files.) (See “get_string()” on page 9-75 and “Kernel String Tables” on page 11-16.)
get_format (next_state, id())
The formatted string from the next_state format table
indexed by the integer returned by id() (if any)
get_format (state_summary)
Display statistics about state matches, the state gaps, and the
state durations. (See “get_format()” on page 9-79 and
“Pre-Defined Format Tables” on page 5-20.)
get_format(event_summary)
Display statistics about trace event matches and trace event
gaps. (See “get_format()” on page 9-79 and “Pre-Defined
Format Tables” on page 5-20.)
get_format(event_arg_summary,3)
Display statistics about trace event matches and their type
long third argument. (See “get_format()” on page 9-79 and
“Pre-Defined Format Tables” on page 5-20.)
get_format(event_arg_dbl_summary,1)
Display statistics about trace event matches and their type
double first argument. (See “get_format()” on page 9-79 and
“Pre-Defined Format Tables” on page 5-20.)
CPU List
8
The CPU List parameter determines from which logical central processing units (CPUs)
the display object will process trace events. Only processes that run on one of the CPUs on
this list will be considered by this display object. If the trace event sent to the display
object is not on the list of CPUs, then the trace event is ignored. A CPU number can be
specified only if a NightTrace kernel trace event file is specified. Multiple CPU numbers
must be separated by commas.
8-6
Configuring Display Objects
PID List
8
A global process identifier (PID) is a 32-bit integer. It includes a 16-bit integer raw PID
and a 16-bit integer lightweight process identifier (LWPID). The syntax for specifying a
PID is:
raw_PID’LWPID
The PID List parameter is the list of global process identifiers (PIDs) or process names
that the display object will accept trace events from. If the trace event did not occur in a
process listed in this parameter, the trace event is ignored. If a number or name is specified
that is not a valid PID, a warning message is displayed. Multiple numbers and names must
be separated by commas.
NOTE
Prior to Version 4.1, ntrace converted process identifiers into
process names during PID List input verification for a display
object. For each process identifier in the PID List, ntrace
would try to find its associated process name and display that
name in the PID List. However, because multiple processes having the same name may exist on a system, changing a process
identifier into a process name introduces the possibility that the
display object will accept trace events from undesirable processes.
Therefore, ntrace no longer performs this conversion.
For example, suppose that two processes named a.out exist on a
particular system and that one has a PID of 1234 and the other
has a PID of 5678. Further suppose that you wish to create a
StateGraph to display events only for PID 1234. Prior to Version
4.1, if you entered 1234 in the PID List parameter, ntrace
would have converted that to a.out. As the events were being
analyzed, any event that had a PID of 5678 would also have been
displayed by the StateGraph since a process named a.out also
existed with a PID of 5678.
If the trace event file has multiple processes with the same name (for example, a.out),
specifying any one of the PIDs for that process selects all the PIDs of that process. To
avoid this, it is recommended that all processes be given unique names. If that is not possible, you can isolate individual processes by including a PID restriction in the
If-Exp res sion parameter. For example, if a.out includes PIDs 100’1, 200’1, and
300’1 and you want information only on PID 100’1, set the PID List parameter to a.out
and the If-Expression to pid() == 100’1. For more information about the pid
function, see “pid()” on page 9-22.
8-7
NightTrace Manual
TID List
8
A NightTrace thread identifier (TID) is a 32-bit integer. It includes a 16-bit integer raw
PID and a 16-bit integer C thread or Ada task identifier. If neither C threads nor Ada tasks
are in use, then the 16-bit integer will always be zero. The syntax for specifying a TID is:
raw_PID’task_id
or:
raw_PID’thread_id
The TID List parameter is the list of NightTrace thread identifiers (TIDs) or thread names
that the display object will accept trace events from. If the trace event did not occur in a
thread listed in this parameter, the trace event is ignored. If a number or name is specified
that is not a valid TID, a warning message is displayed. Multiple numbers and names must
be separated by commas.
NOTE
Prior to Version 4.1, ntrace converted thread identifiers into
thread names during TID List input verification for a display
object. For each thread identifier in the TID List, ntrace would
try to find its associated thread name and display that name in the
TID List. However, because multiple threads having the same
name may exist on a system, changing a thread identifier into a
thread name introduces the possibility that the display object will
accept trace events from undesirable threads. Therefore, ntrace
no longer performs this conversion.
For example, suppose that two threads named daemon exist on a
particular system and that one has a TID of 1234’1 and the other
has a TID of 5678’3. Further suppose that you wish to create a
StateGraph to display events only for TID 1234’1. Prior to Version 4.1, if you entered 1234’1 in the TID L ist parameter,
ntrace would have converted that to daemon. As the events
were being analyzed, any event that had a TID of 5678’3 would
also have been displayed by the StateGraph since the thread daemon also existed with a TID of 5678’3.
If the trace event file has multiple threads with the same nam e (for example,
CHILD_THREAD), specifying any one of the TIDs with that thread name selects all of the
TIDs with that thread name. To avoid this, it is recommended that all threads be given
unique names. If that is not possible, you can isolate individual threads by including a TID
restriction in the If-Expression parameter. For example, if CHILD_THREAD includes
TIDs 100’1, 200’1, and 300’1 and you want information only on TID 100’1, set the TID
List parameter to CHILD_THREAD and the If-Expression to tid() == 100’1. For
more information on thread names, see “trace_open_thread()” on page 2-9. For more
information about the tid function, see“tid()” on page 9-25.
8-8
Configuring Display Objects
Node List
8
When NightTrace processes a trace file which was timestamped by an RCIM synchronized tick clock, it internally assigns a node identifier to each node/host name represented
by a trace file. If no trace file was generated using the tick clock, this parameter is not displayed.
The Node List parameter is the list of node identifiers or node names from which the display object will accept trace events. If the trace event did not occur on a node listed in this
parameter, the trace event is ignored. If a number or name is specified that is not a valid
node, a warning message is displayed. Multiple numbers and names must be separated by
commas.
Foreground Color
8
The Foreground Color parameter determines the color of items in the foreground of the
display object, which usually corresponds to the data being displayed by the display
object.
Background Color
8
The Ba ckg ro un d Co lo r parameter determines the color of the background of the
display object. Although this is not the color used to display the data of interest in the
display object, it should be a color that contrasts well with the Foreground Color. This
will make the data easier to read.
Font
8
The Font parameter determines the font that characters in the display object are displayed
in. Use of a small font size is recommended due to the fact that there is generally a lot of
data being displayed and a small font size will help conserve screen space. All examples in
this manual use the default “fixed” font that is supplied with all X servers.
Text Justify
8
The Text Justify parameter determines the justification of the text in the display object.
Figure 8-2 shows what each type of text-justification looks like.
8-9
NightTrace Manual
Figure 8-2. Left-, Center-, and Right-Justified Text
Text Gravity
8
The Text Gravity parameter determines whether text in the object will float to the top or
sink to the bottom of the display object. Figure 8-3 shows what each type of text gravity
looks like.
Figure 8-3. Top vs. Bottom Gravity
Configuration Form Push Buttons
8
Figure 8-4. Configuration Form Push Buttons
Figure 8-4 shows the push buttons that all display object configuration forms have.
After you have changed the configuration parameters of a display object, these buttons
allow you to perform the following operations:
Apply
8-10
(default) Validate the changes you made to the configuration
parameters, and apply the changes to the display object. This is
equivalent to pressing <Enter>.
Configuring Display Objects
Reset
Discard all changes made since the last Apply or <Enter>.
This is equivalent to pressing <Esc>.
Restore
Discard all changes made since the window was opened.
Close
Discard any changes made since the last change was applied
and close the window.
Specific Configuration Parameters
8
The following sections discuss the configuration parameters specific to the following
display objects:
• GridLabel
• DataBox
• StateGraph
• EventGraph
• DataGraph
• Ruler
8-11
NightTrace Manual
GridLabel
8
Figure 8-5. GridLabel Configuration Form
The configuration form for the GridLabel is shown in Figure 8-5.
The Text parameter is the only parameter that is unique to GridLabels. This parameter is
set to the characters that are to appear in the GridLabel. For example, if you want a box on
the grid containing the phrase, “Flight Simulation Trace Screen,” you would enter the
following text in the Text field:
Flight Simulation Trace Screen
See “GridLabel” on page 7-12 for more information. See “Common Configuration Parameters” on page 8-1 for descriptions of the common configuration parameters that
GridLabels use.
8-12
Configuring Display Objects
DataBox
8
Figure 8-6. DataBox Configuration Form
The configuration form for the DataBox is shown in Figure 8-6.
NOTE
The Node List field appears in this dialog only when NightTrace
is configured to use an RCIM to timestamp events.
A DataBox can be used as a counter. A counter is simply a DataBox that counts the
occurrences of a particular trace event or other condition up to the current time.
For example, if you wanted to display the number of trace events occurring before the
current time, set the Event List parameter to ALL and put the following expression in the
Then-Expression field:
event_matches()
8-13
NightTrace Manual
This expression counts the number of times the criteria were met. See Chapter 9 for more
information on expressions. See “DataBox” on page 7-12 for more information. See
“Common Configuration Parameters” on page 8-1 for descriptions of the common configuration parameters that DataBoxes use.
To d e t e r m i n e t h e f o r m a t o f t h e d a t a d i s p l a y e d i n t h e D a t a B o x , g i v e t h e
Then-Expres sion parameter an expression value. See “Then-Expression” on page 8-5
for examples.
StateGraph
8
Figure 8-7. StateGraph Configuration Form
The configuration form for the StateGraph is shown in Figure 8-7.
NOTE
The Node List field appears in this dialog only when NightTrace
is configured to use an RCIM to timestamp events.
8-14
Configuring Display Objects
A state is bounded by two user-specified trace events, a start event and an end event. An
instance of a state is the period of time between the start event and end event, including the
start and end events themselves. Instances of the same state do not nest; thus, once a state
becomes active, events that might normally satisfy the conditions for the start event are
ignored until the end event is encountered.
The Start-Events parameter determines the trace events that can begin a state. This
parameter, along with the End-Events parameter, defines part of what will be considered a state for this display object. These parameters work exactly like the Event List
parameters discussed earlier in “Common Configuration Parameters” on page 8-1. Like
the Event List, they each have corresponding If-Expressions, called Start-Expression and End-Expression, respectively.
The Start-Expression parameter determines the criteria, in addition to the start trace
event(s) and other criteria, which must be true before a state is considered to be started
(active). The End-Expression parameter determines the criteria, in addition to the end
trace event(s) and other criteria, which must be true before a state is considered to be
ended (inactive).
The following semantic rules apply to these expressions. In these rules, defining state
means a state with trace events in the Start-Events and End-Events lists.
• Start-Expression must not refer to its defining states. For example, it
must not call state_dur(), state_gap(), start or end functions for
these states. (See “Multi-State Functions” on page 9-56, “Start Functions”
on page 9-34, and “End Functions” on page 9-45 for details.) Calling these
functions for these states would be an attempt to define a state based on its
own definition. Note that St a r t- E x p r e s s io n may call all of these
functions for qualified states.
• End-Expression must not refer to its defining states. For example, it
must not call state_dur(), state_gap(), or end functions for these
states. Calling these functions for these states would be an attempt to
define a state based on its own definition. Note that End-Expression
may call start functions for these states because at this point in the state
definition, the state has started. Note also that End-Expression may call
all of these functions for qualified states.
The Event Color parameter specifies the color of the vertical lines that represent the
events in the Event List. The possible values are the colors your X server supports, as
specified in the rgb.txt file. See Appendix B for more information.
StateGraphs indicate when a state is active by drawing a rectangle in the Foreground
Color that spans the time when the start state and end state criteria are met. In addition to
drawing this state rectangle, StateGraphs can behave exactly like EventGraphs by using
the Event List and If-Expression fields. Trace event lines are superimposed on the
state rectangle, which is useful for diagnosing problems where the criteria for starting the
state are met multiple times before the criteria for ending the state are met.
See “StateGraph” on page 7-14 for more information. See “Common Configuration
Parameters” on page 8-1 for descriptions of the common configuration parameters that
StateGraphs use.
8-15
NightTrace Manual
EventGraph
8
Figure 8-8. EventGraph Configuration Form
The configuration form for the EventGraph is shown in Figure 8-8. All of the parameters
for the EventGraph are discussed in “Common Configuration Parameters” on page 8-1.
See “EventGraph” on page 7-15 for more information.
NOTE
The Node List field appears in this dialog only when NightTrace
is configured to use an RCIM to timestamp events.
The If-Ex pr es sion of an EventGraph determines whether a trace event should be
graphed. If the If-Expression is true, then a vertical line is drawn at the point in time
that the trace event occurred.
8-16
Configuring Display Objects
DataGraph
8
Figure 8-9. DataGraph Configuration Form
The configuration form for the DataGraph is shown in Figure 8-9.
NOTE
The Node List field appears in this dialog only when NightTrace
is configured to use an RCIM to timestamp events.
The Fill Style parameter determines the style of DataGraph created. The possible choices
are None or Solid. If None is chosen, then a vertical line is drawn only at the time of a
trace event. If Solid is chosen, then all space to the right of a trace event will be filled
until the next trace event is encountered. Figure 8-10 shows the difference between Solid
and None.
8-17
NightTrace Manual
Figure 8-10. Solid vs. No Fill
The Maximum parameter determines what data value corresponds to the top of the DataGraph. The possible values are integers or CALC. If an integer is specified as the
maximum, any data that is equal to or greater than that value results in a line or bar that
goes to the top of the DataGraph. If CALC is specified, the maximum value will be the
greatest value found in the trace event run up to that point in time. Note that the maximum
can change as time increases and new maximums are encountered.
The Minimum parameter determines what data value corresponds to the bottom of the
DataGraph. The possible values are integers or CALC. If an integer is specified as the
minimum, any data that is equal to or less than that value will result in no line or bar on the
DataGraph. If CALC is specified, the minimum value will be the smallest value found in
the trace event run up to that point in time. Note that the minimum can change as time
increases and new minimums are encountered.
Figure 8-11 shows the same set of data drawn in three DataGraphs, each configured
differently. The data range in value from 1 to 6 and are shown at the bottom of the figure.
• The top DataGraph is configured with a minimum of 2 and a maximum of
4. Notice that several bars reach the top of the DataGraph even though
they represent different data values; also note that there is no bar where
data has a value less than the minimum.
• The middle DataGraph is configured with a minimum of 0 and a maximum
of 10. Notice that the bars do not reach the top of the DataGraph and that
the differences between values are harder to discern.
• The bottom DataGraph is configured with a minimum of 0 and a maximum
set to CALC. Notice that the two occurrences of the maximum value of six
cause bars to reach the top of the DataGraph.
Figure 8-11. Maximum vs. Minimum Values
8-18
Configuring Display Objects
See “DataGraph” on page 7-16 for more information. See “Common Configuration
Parameters” on page 8-1 for descriptions of the common configuration parameters that
DataGraphs use.
Ruler
8
Figure 8-12. Ruler Configuration Form
The configuration form for the Ruler is shown in Figure 8-12.
The Lost Event Color parameter specifies the color of the reverse-video “L” (shown in
Figure 8-13) that is placed on a Ruler where NightTrace lost data. The possible values are
the colors your X server supports, as specified in the rgb.txt file. See “Preventing
Trace Events Loss” on page A-1 for more information on lost data.
The Mark Color parameter specifies the color of the mark indicator, a triangle that
appears on the Ruler (shown in Figure 8-13). The possible values are the colors your X
server supports. See “The Interval Push Buttons” on page 6-8 for more information about
the mark.
Figure 8-13. Mark and Lost Event Markers
See “Ruler” on page 7-17 for more information. See “Common Configuration Parameters” on page 8-1 for descriptions of the common configuration parameters that Rulers
use.
8-19
NightTrace Manual
8-20
9
Using Expressions
Overview . . . . . . . . . . . . . . . . . . . . . . . . . . . . . . . . . . . . . . . . . . . . . . . . . . . . . . . . . .
Expressions Menu . . . . . . . . . . . . . . . . . . . . . . . . . . . . . . . . . . . . . . . . . . . . . . . . . . .
Expression Dialog Boxes . . . . . . . . . . . . . . . . . . . . . . . . . . . . . . . . . . . . . . . . . .
Expression Configuration Forms . . . . . . . . . . . . . . . . . . . . . . . . . . . . . . . . . . . .
Expressions . . . . . . . . . . . . . . . . . . . . . . . . . . . . . . . . . . . . . . . . . . . . . . . . . . . . . . . .
Operators . . . . . . . . . . . . . . . . . . . . . . . . . . . . . . . . . . . . . . . . . . . . . . . . . . . . . .
Operands. . . . . . . . . . . . . . . . . . . . . . . . . . . . . . . . . . . . . . . . . . . . . . . . . . . . . . .
Constants . . . . . . . . . . . . . . . . . . . . . . . . . . . . . . . . . . . . . . . . . . . . . . . . . . . . . .
Macros . . . . . . . . . . . . . . . . . . . . . . . . . . . . . . . . . . . . . . . . . . . . . . . . . . . . . . . .
Functions . . . . . . . . . . . . . . . . . . . . . . . . . . . . . . . . . . . . . . . . . . . . . . . . . . . . . .
Function Parameters . . . . . . . . . . . . . . . . . . . . . . . . . . . . . . . . . . . . . . . . . .
Function Terminology . . . . . . . . . . . . . . . . . . . . . . . . . . . . . . . . . . . . . . . . .
Trace Event Functions. . . . . . . . . . . . . . . . . . . . . . . . . . . . . . . . . . . . . . . . .
id() . . . . . . . . . . . . . . . . . . . . . . . . . . . . . . . . . . . . . . . . . . . . . . . . . . . .
arg() . . . . . . . . . . . . . . . . . . . . . . . . . . . . . . . . . . . . . . . . . . . . . . . . . . .
arg_dbl() . . . . . . . . . . . . . . . . . . . . . . . . . . . . . . . . . . . . . . . . . . . . . . . .
num_args() . . . . . . . . . . . . . . . . . . . . . . . . . . . . . . . . . . . . . . . . . . . . . .
pid() . . . . . . . . . . . . . . . . . . . . . . . . . . . . . . . . . . . . . . . . . . . . . . . . . . .
raw_pid() . . . . . . . . . . . . . . . . . . . . . . . . . . . . . . . . . . . . . . . . . . . . . . .
lwpid() . . . . . . . . . . . . . . . . . . . . . . . . . . . . . . . . . . . . . . . . . . . . . . . . .
thread_id() . . . . . . . . . . . . . . . . . . . . . . . . . . . . . . . . . . . . . . . . . . . . . .
task_id() . . . . . . . . . . . . . . . . . . . . . . . . . . . . . . . . . . . . . . . . . . . . . . . .
tid(). . . . . . . . . . . . . . . . . . . . . . . . . . . . . . . . . . . . . . . . . . . . . . . . . . . .
cpu() . . . . . . . . . . . . . . . . . . . . . . . . . . . . . . . . . . . . . . . . . . . . . . . . . . .
offset() . . . . . . . . . . . . . . . . . . . . . . . . . . . . . . . . . . . . . . . . . . . . . . . . .
time() . . . . . . . . . . . . . . . . . . . . . . . . . . . . . . . . . . . . . . . . . . . . . . . . . .
node_id() . . . . . . . . . . . . . . . . . . . . . . . . . . . . . . . . . . . . . . . . . . . . . . .
pid_table_name() . . . . . . . . . . . . . . . . . . . . . . . . . . . . . . . . . . . . . . . . .
tid_table_name() . . . . . . . . . . . . . . . . . . . . . . . . . . . . . . . . . . . . . . . . .
node_name(). . . . . . . . . . . . . . . . . . . . . . . . . . . . . . . . . . . . . . . . . . . . .
process_name() . . . . . . . . . . . . . . . . . . . . . . . . . . . . . . . . . . . . . . . . . .
task_name() . . . . . . . . . . . . . . . . . . . . . . . . . . . . . . . . . . . . . . . . . . . . .
thread_name() . . . . . . . . . . . . . . . . . . . . . . . . . . . . . . . . . . . . . . . . . . .
Multi-Event Functions . . . . . . . . . . . . . . . . . . . . . . . . . . . . . . . . . . . . .
event_gap() . . . . . . . . . . . . . . . . . . . . . . . . . . . . . . . . . . . . . . . . . .
event_matches() . . . . . . . . . . . . . . . . . . . . . . . . . . . . . . . . . . . . . .
State Functions . . . . . . . . . . . . . . . . . . . . . . . . . . . . . . . . . . . . . . . . . . . . . .
Start Functions . . . . . . . . . . . . . . . . . . . . . . . . . . . . . . . . . . . . . . . . . . .
start_id() . . . . . . . . . . . . . . . . . . . . . . . . . . . . . . . . . . . . . . . . . . . .
start_arg() . . . . . . . . . . . . . . . . . . . . . . . . . . . . . . . . . . . . . . . . . . .
start_arg_dbl(). . . . . . . . . . . . . . . . . . . . . . . . . . . . . . . . . . . . . . . .
start_num_args() . . . . . . . . . . . . . . . . . . . . . . . . . . . . . . . . . . . . . .
start_pid() . . . . . . . . . . . . . . . . . . . . . . . . . . . . . . . . . . . . . . . . . . .
start_raw_pid() . . . . . . . . . . . . . . . . . . . . . . . . . . . . . . . . . . . . . . .
start_lwpid() . . . . . . . . . . . . . . . . . . . . . . . . . . . . . . . . . . . . . . . . .
start_thread_id() . . . . . . . . . . . . . . . . . . . . . . . . . . . . . . . . . . . . . .
start_task_id() . . . . . . . . . . . . . . . . . . . . . . . . . . . . . . . . . . . . . . . .
9-1
9-1
9-2
9-2
9-4
9-4
9-5
9-5
9-6
9-9
9-12
9-13
9-19
9-19
9-20
9-21
9-21
9-22
9-23
9-23
9-24
9-25
9-25
9-26
9-27
9-27
9-28
9-29
9-29
9-30
9-30
9-31
9-32
9-32
9-32
9-33
9-34
9-34
9-35
9-35
9-36
9-37
9-37
9-38
9-39
9-39
9-40
NightTrace Manual
start_tid() . . . . . . . . . . . . . . . . . . . . . . . . . . . . . . . . . . . . . . . . . . . .
start_cpu() . . . . . . . . . . . . . . . . . . . . . . . . . . . . . . . . . . . . . . . . . . .
start_offset() . . . . . . . . . . . . . . . . . . . . . . . . . . . . . . . . . . . . . . . . .
start_time() . . . . . . . . . . . . . . . . . . . . . . . . . . . . . . . . . . . . . . . . . .
start_node_id() . . . . . . . . . . . . . . . . . . . . . . . . . . . . . . . . . . . . . . .
start_pid_table_name() . . . . . . . . . . . . . . . . . . . . . . . . . . . . . . . . .
start_tid_table_name(). . . . . . . . . . . . . . . . . . . . . . . . . . . . . . . . . .
start_node_name() . . . . . . . . . . . . . . . . . . . . . . . . . . . . . . . . . . . . .
End Functions. . . . . . . . . . . . . . . . . . . . . . . . . . . . . . . . . . . . . . . . . . . .
end_id() . . . . . . . . . . . . . . . . . . . . . . . . . . . . . . . . . . . . . . . . . . . . .
end_arg() . . . . . . . . . . . . . . . . . . . . . . . . . . . . . . . . . . . . . . . . . . . .
end_arg_dbl() . . . . . . . . . . . . . . . . . . . . . . . . . . . . . . . . . . . . . . . .
end_num_args(). . . . . . . . . . . . . . . . . . . . . . . . . . . . . . . . . . . . . . .
end_pid() . . . . . . . . . . . . . . . . . . . . . . . . . . . . . . . . . . . . . . . . . . . .
end_raw_pid() . . . . . . . . . . . . . . . . . . . . . . . . . . . . . . . . . . . . . . . .
end_lwpid() . . . . . . . . . . . . . . . . . . . . . . . . . . . . . . . . . . . . . . . . . .
end_thread_id() . . . . . . . . . . . . . . . . . . . . . . . . . . . . . . . . . . . . . . .
end_task_id() . . . . . . . . . . . . . . . . . . . . . . . . . . . . . . . . . . . . . . . . .
end_tid() . . . . . . . . . . . . . . . . . . . . . . . . . . . . . . . . . . . . . . . . . . . .
end_cpu(). . . . . . . . . . . . . . . . . . . . . . . . . . . . . . . . . . . . . . . . . . . .
end_offset() . . . . . . . . . . . . . . . . . . . . . . . . . . . . . . . . . . . . . . . . . .
end_time() . . . . . . . . . . . . . . . . . . . . . . . . . . . . . . . . . . . . . . . . . . .
end_node_id() . . . . . . . . . . . . . . . . . . . . . . . . . . . . . . . . . . . . . . . .
end_pid_table_name(). . . . . . . . . . . . . . . . . . . . . . . . . . . . . . . . . .
end_tid_table_name() . . . . . . . . . . . . . . . . . . . . . . . . . . . . . . . . . .
end_node_name() . . . . . . . . . . . . . . . . . . . . . . . . . . . . . . . . . . . . .
Multi-State Functions . . . . . . . . . . . . . . . . . . . . . . . . . . . . . . . . . . . . . .
state_gap() . . . . . . . . . . . . . . . . . . . . . . . . . . . . . . . . . . . . . . . . . . .
state_dur() . . . . . . . . . . . . . . . . . . . . . . . . . . . . . . . . . . . . . . . . . . .
state_matches() . . . . . . . . . . . . . . . . . . . . . . . . . . . . . . . . . . . . . . .
state_status() . . . . . . . . . . . . . . . . . . . . . . . . . . . . . . . . . . . . . . . . .
Offset Functions. . . . . . . . . . . . . . . . . . . . . . . . . . . . . . . . . . . . . . . . . . . . . .
offset_id() . . . . . . . . . . . . . . . . . . . . . . . . . . . . . . . . . . . . . . . . . . . . . . .
offset_arg() . . . . . . . . . . . . . . . . . . . . . . . . . . . . . . . . . . . . . . . . . . . . . .
offset_arg_dbl() . . . . . . . . . . . . . . . . . . . . . . . . . . . . . . . . . . . . . . . . . .
offset_num_args(). . . . . . . . . . . . . . . . . . . . . . . . . . . . . . . . . . . . . . . . .
offset_pid() . . . . . . . . . . . . . . . . . . . . . . . . . . . . . . . . . . . . . . . . . . . . . .
offset_raw_pid() . . . . . . . . . . . . . . . . . . . . . . . . . . . . . . . . . . . . . . . . . .
offset_lwpid() . . . . . . . . . . . . . . . . . . . . . . . . . . . . . . . . . . . . . . . . . . . .
offset_thread_id() . . . . . . . . . . . . . . . . . . . . . . . . . . . . . . . . . . . . . . . . .
offset_task_id(). . . . . . . . . . . . . . . . . . . . . . . . . . . . . . . . . . . . . . . . . . .
offset_tid() . . . . . . . . . . . . . . . . . . . . . . . . . . . . . . . . . . . . . . . . . . . . . .
offset_cpu(). . . . . . . . . . . . . . . . . . . . . . . . . . . . . . . . . . . . . . . . . . . . . .
offset_time() . . . . . . . . . . . . . . . . . . . . . . . . . . . . . . . . . . . . . . . . . . . . .
offset_node_id() . . . . . . . . . . . . . . . . . . . . . . . . . . . . . . . . . . . . . . . . . .
offset_pid_table_name(). . . . . . . . . . . . . . . . . . . . . . . . . . . . . . . . . . . .
offset_tid_table_name() . . . . . . . . . . . . . . . . . . . . . . . . . . . . . . . . . . . .
offset_node_name() . . . . . . . . . . . . . . . . . . . . . . . . . . . . . . . . . . . . . . .
offset_process_name() . . . . . . . . . . . . . . . . . . . . . . . . . . . . . . . . . . . . .
offset_task_name() . . . . . . . . . . . . . . . . . . . . . . . . . . . . . . . . . . . . . . . .
offset_thread_name() . . . . . . . . . . . . . . . . . . . . . . . . . . . . . . . . . . . . . .
Summary Functions . . . . . . . . . . . . . . . . . . . . . . . . . . . . . . . . . . . . . . . . . . .
min() . . . . . . . . . . . . . . . . . . . . . . . . . . . . . . . . . . . . . . . . . . . . . . . . . . .
max(). . . . . . . . . . . . . . . . . . . . . . . . . . . . . . . . . . . . . . . . . . . . . . . . . . .
9-41
9-41
9-42
9-42
9-43
9-44
9-44
9-45
9-45
9-46
9-47
9-47
9-48
9-48
9-49
9-50
9-51
9-51
9-52
9-52
9-53
9-54
9-54
9-55
9-55
9-56
9-56
9-57
9-57
9-58
9-58
9-59
9-60
9-60
9-61
9-61
9-62
9-63
9-63
9-64
9-64
9-65
9-66
9-66
9-67
9-67
9-68
9-68
9-69
9-69
9-70
9-70
9-71
9-71
avg() . . . . . . . . . . . . . . . . . . . . . . . . . . . . . . . . . . . . . . . . . . . . . . . . . . .
sum() . . . . . . . . . . . . . . . . . . . . . . . . . . . . . . . . . . . . . . . . . . . . . . . . . .
min_offset() . . . . . . . . . . . . . . . . . . . . . . . . . . . . . . . . . . . . . . . . . . . . .
max_offset() . . . . . . . . . . . . . . . . . . . . . . . . . . . . . . . . . . . . . . . . . . . . .
summary_matches() . . . . . . . . . . . . . . . . . . . . . . . . . . . . . . . . . . . . . . .
Format and Table Functions . . . . . . . . . . . . . . . . . . . . . . . . . . . . . . . . . . . .
get_string() . . . . . . . . . . . . . . . . . . . . . . . . . . . . . . . . . . . . . . . . . . . . . .
get_item() . . . . . . . . . . . . . . . . . . . . . . . . . . . . . . . . . . . . . . . . . . . . . . .
get_format() . . . . . . . . . . . . . . . . . . . . . . . . . . . . . . . . . . . . . . . . . . . . .
format() . . . . . . . . . . . . . . . . . . . . . . . . . . . . . . . . . . . . . . . . . . . . . . . .
Qualified Events . . . . . . . . . . . . . . . . . . . . . . . . . . . . . . . . . . . . . . . . . . . . . . . . .
Qualified States . . . . . . . . . . . . . . . . . . . . . . . . . . . . . . . . . . . . . . . . . . . . . . . . .
9-72
9-72
9-73
9-73
9-74
9-75
9-75
9-77
9-79
9-80
9-81
9-83
NightTrace Manual
9
Chapter 9Using Expressions
9
9
9
Overview
9
NightTrace allows you to define macros, qualified events, and qualified states to aid in the
analysis of trace data. Macros are named expressions provided for flexibility and
convenience. Qualified events provide a mechanism for referencing trace event configurations within certain functions. Qualified states provide a mechanism for referencing
state configurations within certain functions as well.
The Expressions menu contains menu items for creating these entities. See “Expressions Menu” on page 9-1, “Macros” on page 9-6, “Qualified Events” on page 9-81, and
“Qualified States” on page 9-83 for further information.
Macros, qualified events, and qualified states are configured using expressions in much
the same way as display objects. See “Expressions” on page 9-4 for a complete explanation of expressions. In addition, Chapter 8 - Configuring Display Objects may provide
some helpful information as well.
Expressions Menu
9
Figure 9-1 shows the display page menu that lets you define macros, qualified events, and
qualified states. For more information about display pages, see “Understanding Page Configuration Files” on page 5-11.
Figure 9-1. Expressions Menu
Selecting any of these menu entries makes an Expression Dialog Box appear.
9-1
NightTrace Manual
Expression Dialog Boxes
9
In the following text, expr stands for macro, qualified event, and qualified state.
Selecting any of the entries from the Expressions menu of the display page, makes a
dialog box like the one in Figure 9-2 appear. Because all exprs are user-defined, the list of
exprs is empty at first.
Figure 9-2. Macro Dialog Box
The caption and the list presented are suitably different for each of the expr dialog boxes.
The push buttons in the dialog boxes perform the following functions:
Add
Create a new expr on the current display page. The initial name
of an expr is type_###, where type is macro, event, or
state and ### is a three-digit number beginning with 001.
Delete
Remove the selected expr
Configure
(default) Reconfigure or rename the selected expr
Close
Close the dialog box
Add, Delete, and Close need no further explanation. Selecting Configure makes an
expr Configuration Form appear.
Expression Configuration Forms
9
In the following text, expr stands for macro, qualified event, and qualified state.
The Configuration Forms for exprs are similar. Common features are described here and
specific features appear in later sections.
9-2
Using Expressions
The push buttons on a Configuration Form appear in Figure 9-3.
Figure 9-3. Configuration Form Push Buttons
A description of these push buttons follows:
Apply
(default) Validate the changes you made to the configuration
parameters, and apply the changes to the selected expr. This is
equivalent to pressing <Enter>.
Reset
Discard all changes made since the last Apply or <Enter>.
This is equivalent to pressing <Esc>.
Restore
Discard all changes made since the window was opened.
Close
Discard any changes made since the last change was applied
and close the window.
When you have finished editing the fields on the Configuration Form, press <Enter>
or click on Apply. This causes NightTrace to validate the data in each field you modified.
For general information on field editing and how NightTrace handles editing errors, see
“Field Editing” on page 6-16.
exprs are saved in a configuration file but are global to all display pages. That is, if an expr
is created in one display page, it may be used by any other display page. This means, however, that if an expr is saved in one configuration file but altered in another, you will have
to reopen the file with the original copy of the expr and save the new value.
NightTrace prevents you from creating more than one definition for a specific expr. If you
wish to change the definintion of an expr, you must select it from the list of exprs and
press Configure. See “Expression Dialog Boxes” on page 9-2 for details.
TIP:
If you want to share exprs among multiple display pages, create an empty display page
and put only exprs in it. Any new exprs or changes to old exprs should be added to this
display page. It is also a good idea to place a DataBox on this page for every expr that you
add to this page. This way, you can see the current value of all your exprs at a glance.
9-3
NightTrace Manual
Expressions
9
NightTrace expressions can evaluate to numbers, strings, or boolean values. Expressions
appear in the following places in NightTrace:
• Start-Expression and End-Expression on:
-
Configuration Forms
Summarize Forms
• If-Expression on:
-
Configuration Forms
Summarize Forms
Search Forms
• Then-Expression on Configuration Forms
• Filter-Expression and Summary-Expression on the Summarize
Form
• Expression on Macro Dialog Boxes
• Values in format tables
• Calls to format(), get_string(), get_item(), get_format(),
and summary functions.
Start-Expressions, End-Expressions, If-Expressions, and Filter-Expression
must evaluate to boolean values.
See Chapter 8 for more information on the Configuration Form. See Chapter 10 for
more information on the Search and Summarize Forms. See “Format Tables” on
page 5-17 for more information on format tables. Information on format(),
get_string(), get_item(), get_format(), and summary functions appears later
in this chapter.
NightTrace expressions are comprised of a combination of operators and operands. A
description of these operators and operands appears in the following sections.
Operators
9
Operators in NightTrace expressions include:
• Arithmetic operators: (), *, /, % (modulo), +, -, unary • Shift operators: <<, >>
• Bitwise operators: ~ (not), & (and), ^ (exclusive or), | (or)
• Logical operators: ! (not), && (and), || (or)
• Relational operators: <, <=, >, >=, == (equivalence), != (non-equivalence)
9-4
Using Expressions
• Conditional operator: expr ? true_value : false_value
• Unary casts to data types (where the parentheses are required): e.g., (int)
NightTrace operators follow the operator precedence rules of the C programming language.
Operands
9
Operand types are largely based on the C programming language and include:
• integer
• double-precision floating point
• character
• string
• boolean
Operands include:
• constants (see “Constants” on page 9-5)
• macro calls (see “Macros” on page 9-6)
• function calls (see “Functions” on page 9-9)
• qualified events (in functions only) (see “Qualified Events” on page 9-81)
• qualified states (in functions only) (see “Qualified States” on page 9-83)
Constants
9
Constants are one type of operand that may be used in NightTrace expressions.
Integer literals may be expressed using typical C language notation:
• decimal literals have no special prefix
• octal literals begin with a zero
• hexadecimal literals begin with a 0x
Floating point literals are always considered to be double-precision floating point literals.
String literals must be enclosed within double quotes; to include a double quote in a constant string literal, precede the double quote with a backslash character. For example:
“possible \”meltdown\” alert”
The case-insensitive boolean constants TRUE and FALSE have the values 1 and 0,
respectively.
9-5
NightTrace Manual
Table 9-1 shows units and suffixes for time constants.
Table 9-1. Time Units and Constant Suffixes
Time Unit
Suffix
Seconds (This is the default)
s
Milliseconds (10e-3 seconds)
ms
Microseconds (10e-6 seconds)
us
Nanoseconds (10e-9 seconds)
ns
Macros
9
Macros are named expressions provided for flexibility and convenience. Table 9-2 contrasts functions and macros.
Table 9-2. A Comparison of Functions and Macros
Functions
Macros
Predefined
User-defined
May have parameters
Cannot have parameters
Invoked with parentheses around the
parameter list
Invoked with a dollar sign ($) before the
macro name
To create a macro definition, select the Macros menu item from the Expressions menu
(see “Expressions Menu” on page 9-1) to open the Macro Dialog Box (see “Expression
Dialog Boxes” on page 9-2 for details on this type of dialog).
Click the Add button on the Macro Dialog Box, select the macro from the list, and
click on the Configure button to pop up a Macro Configuration Form, like the one
shown in Figure 9-4.
9-6
Using Expressions
Figure 9-4. Macro Configuration Form
The following parameters can be configured for a macro.
MacroDefinition The name by which you refer to this macro in expressions.
Only references to this macro have a dollar sign ($) prefix.
Expression
Any valid expression. You must not call macros recursively; if
you try it, NightTrace issues an error, and you get undefined
results. Ma cros m ust not c all the format() and
get_format() functions. (For more information about these
functions, see “format()” on page 9-80 and “get_format()” on
page 9-79.)
EXAMPLES
A StateGraph configuration is a good candidate for a macro because it has two
expressions that are often related. For example, the following configuration
Start Events:
FOO
Start Expression: arg1() == 0x1234 &&
(arg2() == 0 || arg3() > 700)
End Events:
BAR
End Expression:
arg1() == 0x1234 &&
(arg2() == 0 || arg3() > 700)
graphs states of trace event FOO through trace event BAR, where the arguments of
the trace events must meet an identical criteria to be considered interesting. Making
arg1() == 0x1234 && (arg2() == 0 || arg3() > 700)
a macro would help ensure that you did not type the expression wrong in one of the
fields, and it would allow you to change the expressions easily, even while viewing
the trace run in View mode. (You can leave Macro Configuration Forms up
while in View mode.)
Another good use for a macro is for focusing many display objects on a specific
process group. For example, if a Column contained several EventGraphs, each of
which had the following If-Expression:
If Expression: process_name() == $task
9-7
NightTrace Manual
then a task macro definition of
“foobar”
would cause all of the EventGraphs to show only trace events logged by process
foobar. Changing the macro to
“bazonk”
would shift the focus of the EventGraphs from process foobar to process
bazonk. This technique can also be used in DataBoxes, DataGraphs, and StateGraphs.
9-8
Using Expressions
Functions
9
Functions are pre-defined NightTrace entities that may be used in an expression. NightTrace defines five classes of functions:
• Trace event functions (see “Trace Event Functions” on page 9-19)
• State functions (see “State Functions” on page 9-34)
• Offset functions (see “Offset Functions” on page 9-59)
• Summary functions (see “Summary Functions” on page 9-70)
• Format and table functions (see “Format and Table Functions” on page
9-75)
The general syntax of all function calls except summary, format, and table functions is as
follows. (Optional parts of function calls are in brackets ([]).)
function_name[([parameter])]
The prefix of the function_name determines its class as follows:
offset_
Functions with this prefix provide information about the trace event
at the specified offset (or ordinal trace event number). See “Offset
Functions” on page 9-59.
start_
Functions with this prefix provide information about the start event
of the most recent instance of a state. See “Start Functions” on page
9-34.
end_
Functions with this prefix provide information about the end event of
the last completed instance of a state See “End Functions” on page
9-45.
state_
Functions with this prefix provide information about instances of
states. See “Multi-State Functions” on page 9-56.
event_
Functions with this prefix provide information about instances of
events. See “Multi-Event Functions” on page 9-32.
Some functions can be optionally suffixed by a number, N, which specifies the Nth argument logged with the trace event. N defaults to 1 and can have the values 1 through the
maximum argument logged. For example,
arg()
Returns the first argument
arg1()
Returns the first argument
arg3()
Returns the third argument
start_id()
Returns a trace event ID
state_gap()
Returns the time between instances of a state
9-9
NightTrace Manual
Table 9-3 contains a complete list of functions.
Table 9-3. NightTrace Functions
Syntax
Return Type
id [([QE])]
start_id [([QS])]
end_id [([QS])]
offset_id (offset_expr)
arg[N] [([QE])]
start_arg[N] [([QS])]
end_arg[N] [([QS])]
offset_arg[N] (offset_expr)
arg[N]_dbl [([QE])]
start_arg[N]_dbl [([QS])]
end_arg[N]_dbl [([QS])]
offset_arg[N]_dbl (offset_expr)
num_args [([QE])]
start_num_args [([QS])]
end_num_args [([QS])]
offset_num_args (offset_expr)
pid [([QE])]
start_pid [([QS])]
end_pid [([QS])]
offset_pid (offset_expr)
raw_pid [([QE])]
start_raw_pid [([QS])]
end_raw_pid [([QS])]
offset_raw_pid (offset_expr)
lwpid [([QE])]
start_lwpid [([QS])]
end_lwpid [([QS])]
offset_lwpid (offset_expr)
thread_id [([QE])]
start_thread_id [([QS])]
end_thread_id [([QS])]
offset_thread_id (offset_expr)
task_id [([QE])]
start_task_id [([QS])]
end_task_id [([QS])]
offset_task_id (offset_expr)
tid [([QE])]
start_tid [([QS])]
end_tid [([QS])]
offset_tid (offset_expr)
9-10
The integer trace event ID.
The integer trace event argument.
The double-precision floating point trace
event argument.
The number of arguments associated with a
trace event.
The integer global process identifier (PID)
associated with a trace event.
The integer process identifier (raw PID)
associated with a trace event.
The integer lightweight process identifier
(LWPID) associated with a trace event.
The integer thread identifier (thread ID)
associated with a trace event.
The integer Ada task identifier associated
with a trace event.
The integer NightTrace thread identifier
(TID) associated with a trace event.
Using Expressions
Table 9-3. NightTrace Functions
Syntax
Return Type
cpu [([QE])]
start_cpu [([QS])]
end_cpu [([QS])]
offset_cpu (offset_expr)
The integer logical CPU number associated
with a trace event. This function is only
valid when applied to events from NightTrace kernel trace event files.
time [([QE])]
start_time [([QS])]
end_time [([QS])]
offset_time (offset_expr)
The double-precision floating point time,
expressed in units of seconds, between a
trace event and the earliest trace event from
all trace event files currently in use.
node_id [([QE])]
start_node_id [([QS])]
end_node_id [([QS])]
offset_node_id (offset_expr)
The internally-assigned integer node identifier associated with a trace event.
pid_table_name [([QE])]
start_pid_table_name [([QS])]
end_pid_table_name [([QS])]
offset_pid_table_name (offset_expr)
The string describing the name of the process identifier table (PID table) associated
with a trace event.
tid_table_name [([QE])]
start_tid_table_name [([QS])]
end_tid_table_name [([QS])]
offset_tid_table_name (offset_expr)
The string describing the name of the internally-assigned thread identifier table (TID
table) associated with a trace event.
node_name [([QE])]
start_node_name [([QS])]
end_node_name [([QS])]
offset_node_name (offset_expr)
The string describing the name of the system from which a trace event was logged.
process_name [([QE])]
offset_process_name (offset_expr)
The string describing the name of the process (PID) associated with a trace event.
task_name [([QE])]
offset_task_name (offset_expr)
The string describing the name of the Ada
task associated with a trace event.
thread_name [([QE])]
offset_thread_name (offset_expr)
The string describing the name of the C
thread associated with a trace event.
event_gap [([QE])]
state_gap [([QS])]
The double-precision floating point time,
expresed in units of seconds, between the
instances of either a trace event or a state.
state_dur [([QS])]
The double-precision floating point time,
expressed in units of seconds, of an instance
of a state.
event_matches [([QE])]
state_matches [([QS])]
summary_matches [()]
state_status [([QS])]
The integer number of instances of either a
trace event or a state.
The boolean status of a state; true if the current time line is within an instance of the
state, false otherwise. See “state_status()”
on page 9-58 for important details.
9-11
NightTrace Manual
Table 9-3. NightTrace Functions
Syntax
Return Type
offset [([QE])]
start_offset [([QS])]
end_offset [([QS])]
min_offset (expr)
max_offset (expr)
min (expr)
max (expr)
avg (expr)
sum (expr)
The integer ordinal number (offset) of a
trace event.
The integer ordinal number (offset) of a
trace event associated with a minimum or
maximum occurrence of expr.
The minimum, maximum, average, or sum
of expr values before the current time. The
return type is that of expr.
get_string (table_name[, int_expr])
The character string associated with item
int_expr in string table table_name.
get_item (table_name, “str_const”)
The first integer item number associated
with string str_const in string table
table_name.
get_format (table_name[, int_expr])
The character string associated with item
int_expr in format table table_name.
format (“format_string” [, arg] ...)
A character string to format and display.
Function Parameters
9
If the function has a parameter, the parentheses are required. Otherwise, they are optional.
For example,
arg2
No parentheses are required
arg2()
No parentheses are required
arg2(GAK)
Parentheses are required
In many functions, the parameter is optional because it can be inferred from context. For
trace event functions, the current trace event is used if the parameter is omitted. For state
functions, the state being defined is used if the parameter is omitted. (Thus, state functions without parameters can only be used inside state definitions). For example,
9-12
arg1()
Operates on the current trace event
arg1(my_event)
Operates on the qualified event my_event
end_arg1()
Operates on the last completed instance of
the state being defined and can only appear
within a state definition
end_arg1(my_state)
Operates on the last completed instance of
the qualified state my_state
Using Expressions
This manual uses the following conventions for function parameters:
QE
A user-defined qualified event. If supplied, the function applies
to the specified qualified event. For more information, see
“Qualified Events” on page 9-81.
QS
A user-defined qualified state. If supplied, the function applies
to the specified qualified state. For more information, see
“Qualified States” on page 9-83.
offset_expr
An expression that evaluates to the offset (or ordinal trace
event number) of a trace event.
expr
Any valid NightTrace expression (see “Expressions” on page
9-4).
table_name
An unquoted character string that represents the name of a
string table or format table.
int_expr
An integer expression that acts as an index into the specified
string table or format table. int_expr must either match an
identifying integer value in the table_name table, or the
table_name table must have a default item line.
str_const
A string constant literal that acts as an index into the specified
string table.
format_string
A character string that contains literal characters and
conversion specifications. Conversion specifications modify
zero or more args.
arg
An optional expression to be formatted and displayed.
NOTE
NightTrace does not perform semantic error checking of functions. For example, if you ask for information about the second
argument, but no second argument was logged, NightTrace does
not tell you. Similarly, NightTrace does not flag the use of undefined macros, qualified events, and qualified states; it temporarily
puts their names in the appropriate Dialog Box in case you want
to configure these constructs. For more information about these
Dialog Boxes, see “Expression Dialog Boxes” on page 9-2.
Function Terminology
9
In order to use the NightTrace functions effectively, it may be useful to understand some
of the concepts associated with them.
Remember that an event (or trace event) is either a user-defined point of interest in an
application’s source code or a predefined point of interest in the kernel. In addition, a
state is defined to be a region of source code bounded by two events.
9-13
NightTrace Manual
The descriptions of the functions further speak in terms of “instances” of states. These are
best defined as:
current instance
The instance of a state which has begun but
has not yet completed. Thus, the current
time line would be positioned within the
region from the start event up to, but not
including, the end event.
last completed instance
The most recent instance of a state that has
already completed. Thus, the current time
line would be positioned either on, or after,
the end event for a state.
most recent instance
If the current time line is positioned within a
current instance of a state, then it is that
instance of the state. Otherwise, it is the last
completed instance of a state.
Figure 9-5 illustrates some of these concepts with a StateGraph.
Figure 9-5. Function Terminology Illustrated
9-14
Using Expressions
A more detailed example is illustrated in the following figure.
Figure 9-6. States and Events
The following discusses the terminology with respect to time line x, time line y, and time
line z.
Assuming the current time line was positioned at time line x in Figure 9-6, the various
“instances” would be defined as:
current instance
No current instance is defined since the current time line is not positioned within any
instance of a state.
last completed instance
Instance B
most recent instance
Instance B. Since the current time line is not
positioned within any instance of a state, the
most recent instance is the last completed
instance.
9-15
NightTrace Manual
The table below indicates the information returned by various NightTrace functions
assuming the current time line was positioned at time line x in Figure 9-6.
state_status()
false
The current time line was not positioned within a current instance of a
state.
state_gap()
~0.000020
Th e d ur a tio n o f t ime i n sec on d s
between event b and event c. The
function operated the most recent
instance of the state (instance B) and
the immediately preceding instance
(instance A).
state_dur()
~0.000090
Th e d ur a tio n o f t ime i n sec on d s
between event c and event d. The
function operated on the last completed instance of the state (instance
B).
state_matches()
2
Assuming no other instances of the
state preceded those shown in the figure. The function operated on all completed instances of the state (which
included instances A and B).
start_time()
~1.631750
The time associated with event c. The
function operated on the most recent
instance of the state (instance B).
end_time()
~1.631840
The time associated with event d. The
function operated on the last completed instance of the state (instance
B).
Assuming the current time line was positioned at time line y in Figure 9-6, the various
“instances” would be defined as:
9-16
current instance
Instance C
last completed instance
Instance B
most recent instance
Instance C
Using Expressions
The table below indicates the information returned by various NightTrace functions
assuming the current time line was positioned at time line y in Figure 9-6.
state_status()
true
The current time line was positioned
inside a current instance of the state
(instance C).
state_gap()
~0.000030
Th e d ur a ti on o f t ime i n sec on d s
between event d and event e. The
function operated on the most recent
instance of the state (instance C) and
the immediately preceding instance
(instance B).
state_dur()
~0.000090
Th e d ur a ti on o f t ime i n sec on d s
between event c and event d. The
function operated on the last completed instance of the state (instance
B).
state_matches()
2
Assuming no other instances of the
state preceded those shown in the figure. The function operated on all completed instances of the state (which
included instances A and B).
start_time()
~1.631870
The time associated with event e. The
function operated on the most recent
instance of the state (instance C).
end_time()
~1.631840
The time associated with event d. The
function operated on the last completed instance of the state (instance
B).
Assuming the current time line was positioned at time line z in Figure 9-6, the various
“instances” would be defined as:
current instance
No current instance is defined since the current time line is positioned on the end event
of an instance of a state.
last completed instance
Instance C
most recent instance
Instance C
9-17
NightTrace Manual
The table below indicates the information returned by various NightTrace functions
assuming the current time line was positioned at time line z in Figure 9-6.
9-18
state_status()
false
The current time line was not positioned inside a current instance of the
state. Even though the current time
line is positioned on an end event of
the state (event f), the corresponding
instance is said to have already completed.
state_gap()
~0.000030
Th e d ur a tio n o f t ime i n sec on d s
between event d and event e. The
function operated on the most recent
instance of the state (instance C) and
the immediately preceding instance
(instance B).
state_dur()
~0.000040
Th e d ur a tio n o f t ime i n sec on d s
between event e and event f. The function operated on the last completed
instance of the state (instance C).
state_matches()
3
Assuming no other instances of the
state preceded those shown in the figure. The function operated on all completed instances of the state (which
included instances A, B, and C).
start_time()
~1.631870
The time associated with event e. The
function operated on the most recent
instance of the state (instance C).
end_time()
~1.631910
The time associated with event f. The
function operated on the last completed instance of the state (instance
C).
Using Expressions
Trace Event Functions
9
The trace event functions operate on either the qualified event specified to that function or
the current trace event. They include the following:
• id()
• arg()
• arg_dbl()
• num_args()
• pid()
• raw_pid()
• lwpid()
• cpu()
• thread_id()
• task_id()
• tid()
• offset()
• time()
• node_id()
• pid_table_name()
• tid_table_name()
• node_name()
• process_name()
• task_name()
• thread_name()
• Multi-event functions
id()
9
DESCRIPTION
The id() function returns the trace event ID of the last instance of a trace event.
SYNTAX
id [([QE])]
9-19
NightTrace Manual
PARAMETERS
QE
A user-defined qualified event. If supplied, the function returns
the trace event ID of the last instance of the trace event which
satisfies the conditions of the specified qualified event. If
omitted, the function returns the trace event ID of the current
trace event. For more information, see “Qualified Events” on
page 9-81.
RETURN TYPE
integer
SEE ALSO
“start_id()” on page 9-35, “end_id()” on page 9-46, and “offset_id()” on page 9-60.
arg()
9
DESCRIPTION
The arg() function returns the value of a particular trace event argument.
SYNTAX
arg[N] [([QE])]
PARAMETERS
N
Specifies the Nth argument logged with the trace event.
Defaults to 1.
QE
A user-defined qualified event. If supplied, the function returns
the specified argument for the last instance of the trace event
which satisfies the conditions for the specified qualified event.
If omitted, the function returns the specified argument for the
current trace event. For more information, see “Qualified
Events” on page 9-81.
RETURN TYPE
integer
SEE ALSO
“arg_dbl()” on page 9-21, “num_args()” on page 9-21, “start_arg()” on page 9-35,
“end_arg()” on page 9-47, and “offset_arg()” on page 9-60.
9-20
Using Expressions
arg_dbl()
9
DESCRIPTION
The arg_dbl() function returns the value of a particular trace event argument.
SYNTAX
arg[N]_dbl [([QE])]
PARAMETERS
N
Specifies the Nth argument logged with the trace event.
Defaults to 1.
QE
A user-defined qualified event. If supplied, the function returns
the specified argument for the last instance of the trace event
which satisfies the conditions for the specified qualified event.
If omitted, the function returns the specified argument for the
current trace event. For more information, see “Qualified
Events” on page 9-81.
RETURN TYPE
double-precision floating point
SEE ALSO
“arg()” on page 9-20, “num_args()” on page 9-21, “start_arg_dbl()” on page 9-36,
“end_arg_dbl()” on page 9-47, and “offset_arg_dbl()” on page 9-61.
num_args()
9
DESCRIPTION
The num_args() function returns the number of arguments logged with a trace
event.
SYNTAX
num_args [([QE])]
PARAMETERS
QE
A user-defined qualified event. If supplied, the function returns
the number of arguments of the last instance of the trace event
which satisfies the conditions for the specified qualified event.
If omitted, the function returns the number of arguments of the
current trace event. For more information, see “Qualified
Events” on page 9-81.
9-21
NightTrace Manual
RETURN TYPE
integer
SEE ALSO
“arg()” on page 9-20, “start_num_args()” on page 9-37, “end_num_args()” on page
9-48, and “offset_num_args()” on page 9-61.
pid()
9
DESCRIPTION
The pid() function returns the global process identifier (PID) associated with a
trace event.
NOTE
A global process identifier does not have the same meaning as the
typical operating system definition of pid. A PID within NightTrace is a 32-bit integer value that contains the operating system
process identifier (raw PID) in the upper 16 bits and the lightweight process identifier (LWPID) in the lower 16 bits. Consult
the _lwp_global_self(2) man page for more information.
SYNTAX
pid [([QE])]
PARAMETERS
QE
A user-defined qualified event. If supplied, the function returns
the global process identifier of the last instance of the trace
event which satisfies the conditions for the specified qualified
event. If omitted, the function returns the global process identifier of the current trace event. For more information, see
“Qualified Events” on page 9-81.
RETURN TYPE
integer
SEE ALSO
“PID List” on page 8-7, “raw_pid()” on page 9-23, “lwpid()” on page 9-23,
“start_pid()” on page 9-37, “end_pid()” on page 9-48, and “offset_pid()” on page
9-62.
9-22
Using Expressions
raw_pid()
9
DESCRIPTION
The raw_pid() function returns the process identifier (raw PID) associated with a
trace event.
NOTE
A NightTrace raw PID has the same meaning as the typical operating system definition of pid. See the getpid(2) man page
for more information.
SYNTAX
raw_pid [([QE])]
PARAMETERS
QE
A user-defined qualified event. If supplied, the function returns
the process identifier of the last instance of the trace event
which satisfies the conditions for the specified qualified event.
If omitted, the function returns the process identifier of the current trace event. For more information, see “Qualified Events”
on page 9-81.
RETURN TYPE
integer
SEE ALSO
“PID List” on page 8-7, “pid()” on page 9-22, “lwpid()” on page 9-23,
“st ar t_ ra w _p i d( ) ” o n p ag e 9 -3 8, “e nd _ ra w _p id ( ) ” o n p ag e 9 -49 , an d
“offset_raw_pid()” on page 9-63.
lwpid()
9
DESCRIPTION
The lwpid() function returns the lightweight process identifier (LWPID) associated with a trace event.
NOTE
See the _lwp_self(2) man page for more information.
9-23
NightTrace Manual
SYNTAX
lwpid [([QE])]
PARAMETERS
QE
A user-defined qualified event. If supplied, the function returns
the lightweight process identifier of the last instance of the
trace event which satisfies the conditions for the specified
qualified event. If omitted, the function returns the lightweight
process identifier of the current trace event. For more information, see “Qualified Events” on page 9-81.
RETURN TYPE
integer
SEE ALSO
“PID List” on page 8-7, “pid()” on page 9-22, “raw_pid()” on page 9-23,
“start_lwpid()” on page 9-39, “end_lwpid()” on page 9-50, and “offset_lwpid()” on
page 9-63.
thread_id()
9
DESCRIPTION
The thread_id() function returns the thread identifier associated with a trace
event.
NOTE
See the thr_self(3thread) man page for more information.
SYNTAX
thread_id [([QE])]
PARAMETERS
QE
RETURN TYPE
integer
9-24
A user-defined qualified event. If supplied, the function returns
the thread identifier of the last instance of the trace event which
satisfies the conditions for the specified qualified event. If
omitted, the function returns the thread identifier of the current
trace event. For more information, see “Qualified Events” on
page 9-81.
Using Expressions
SEE ALSO
“start_thread_id()” on page 9-39, “end_thread_id()” on page 9-51, and
“offset_thread_id()” on page 9-64.
task_id()
9
DESCRIPTION
The task_id() function returns the Ada task identifier associated with a trace
event.
NOTE
This function is only meaningful for trace events logged by Ada
tasking programs.
SYNTAX
task_id [([QE])]
PARAMETERS
QE
A user-defined qualified event. If supplied, the function returns
the Ada task identifier of the last instance of the trace event
which satisfies the conditions for the specified qualified event.
If omitted, the function returns the Ada task identifier of the
current trace event. For more information, see “Qualified
Events” on page 9-81.
RETURN TYPE
integer
SEE ALSO
“ s t a r t _ t as k _ i d ( )” o n p ag e 9 -4 0 , “ e n d _ t a s k _ i d ( )” o n p ag e 9 -5 1 , a n d
“offset_task_id()” on page 9-64.
tid()
9
DESCRIPTION
The tid() function returns the internally-assigned NightTrace thread identifier
(TID) associated with a trace event.
SYNTAX
tid [([QE])]
9-25
NightTrace Manual
PARAMETERS
QE
A user-defined qualified event. If supplied, the function returns
the NightTrace thread identifier of the last instance of the trace
event which satisfies the conditions for the specified qualified
event. If omitted, the function returns the NightTrace thread
identifier of the current trace event. For more information, see
“Qualified Events” on page 9-81.
RETURN TYPE
integer
SEE ALSO
“TID List” on page 8-8, “start_tid()” on page 9-41, “end_tid()” on page 9-52, and
“offset_tid()” on page 9-65.
cpu()
9
DESCRIPTION
The cpu() function returns the logical CPU number associated with a trace event.
CPUs are logically numbered starting at 0 and monotonically increase thereafter.
NOTE
This function is only valid when applied to events from NightTrace kernel trace event files.
SYNTAX
cpu [([QE])]
PARAMETERS
QE
RETURN TYPE
integer
9-26
A user-defined qualified event. If supplied, the function returns
the logical CPU number of the last instance of the trace event
which satisfies the conditions for the specified qualified event.
If omitted, the function returns the logical CPU number of the
current trace event. For more information, see “Qualified
Events” on page 9-81.
Using Expressions
SEE ALSO
“start_cpu()” on page 9-41, “end_cpu()” on page 9-52, and “offset_cpu()” on page
9-66.
offset()
9
DESCRIPTION
The offset() function returns the ordinal number (offset) of a trace event.
SYNTAX
offset [([QE])]
PARAMETERS
QE
A user-defined qualified event. If supplied, the function returns
the ordinal number (offset) of the last instance of the trace
event which satisfies the conditions for the specified qualified
event. If omitted, the function returns the ordinal number (offset) of the current trace event. For more information, see
“Qualified Events” on page 9-81.
RETURN TYPE
integer
SEE ALSO
“start_offset()” on page 9-42, “end_offset()” on page 9-53, “min_offset()” on page
9-73, and “max_offset()” on page 9-73.
time()
9
DESCRIPTION
The time() function returns the time, in seconds, associated with a trace event.
Times are relative to the earliest trace event from all trace data files currently in use.
SYNTAX
time [([QE])]
PARAMETERS
QE
A user-defined qualified event. If supplied, the function returns
the time, in seconds, of the last instance of the trace event
which satisfies the conditions for the specified qualified event.
If omitted, the function returns the time, in seconds, of the cur-
9-27
NightTrace Manual
rent trace event. For more information, see “Qualified Events”
on page 9-81.
RETURN TYPE
double-precision floating point
SEE ALSO
“event_gap()” on page 9-32, “start_time()” on page 9-42, “end_time()” on page
9-54, “state_gap()” on page 9-57, “state_dur()” on page 9-57, and “offset_time()” on
page 9-66.
node_id()
9
DESCRIPTION
The node_id() function returns the internally-assigned node identifier associated
with a trace event.
NOTE
The node_id() function is of limited usefulness since the node
identifier is an internally-assigned integer number assigned by
NightTrace. The node_name() function is more useful, as it
returns the name of the system from which a trace event was
logged. (See “node_name()” on page 9-30 for more information
about this function.)
SYNTAX
node_id [([QE])]
PARAMETERS
QE
RETURN TYPE
integer
9-28
A user-defined qualified event. If supplied, the function returns
the node identifier of the last instance of the trace event which
satisfies the conditions for the specified qualified event. If
omitted, the function returns the node identifier of the current
trace event. For more information, see “Qualified Events” on
page 9-81.
Using Expressions
SEE ALSO
“start_node_id()” on page 9-43, “offset_node_id()” on page 9-6 7, and
“end_node_id()” on page 9-54.
pid_table_name()
9
DESCRIPTION
The pid_table_name() function returns the name of the internally-assigned
NightTrace process identifier table (PID table) associated with a trace event.
SYNTAX
pid_table_name [([QE])]
PARAMETERS
QE
A user-defined qualified event. If supplied, the function returns
the name of the process identifier table (PID table) of the last
instance of the trace event which satisfies the conditions for the
specified qualified event. If omitted, the function returns the
name of the process identifier table (PID table) of the current
trace event. For more information, see “Qualified Events” on
page 9-81.
RETURN TYPE
string
SEE ALSO
“start_pid_table_name()” on page 9-44, “offset_pid_table_name()” on page 9-67,
and “end_pid_table_name()” on page 9-55
tid_table_name()
9
DESCRIPTION
The tid_table_name() function returns the name of the internally-assigned
NightTrace thread identifier table (TID table) associated with a trace event.
SYNTAX
tid_table_name [([QE])]
PARAMETERS
QE
A user-defined qualified event. If supplied, the function returns
the name of the thread identifier table (TID table) of the last
9-29
NightTrace Manual
instance of the trace event which satisfies the conditions for the
specified qualified event. If omitted, the function returns the
name of the thread identifier table (TID table) of the current
trace event. For more information, see “Qualified Events” on
page 9-81.
RETURN TYPE
string
SEE ALSO
“start_tid_table_name()” on page 9-44, “offset_tid_table_name()” on page 9-68, and
“end_tid_table_name()” on page 9-55
node_name()
9
DESCRIPTION
The node_name() function returns the name of the system from which a trace
event was logged.
SYNTAX
node_name [([QE])]
PARAMETERS
QE
A user-defined qualified event. If supplied, the function returns
the name of system from which the last instance of the trace
event which satisfies the conditions for the specified qualified
event was logged. If omitted, the function returns the name of
the system from which the current trace event was logged. For
more information, see “Qualified Events” on page 9-81.
RETURN TYPE
string
SEE ALSO
“start_node_name()” on page 9-45, “offset_node_name()” on page 9-68, and
“end_node_name()” on page 9-56
process_name()
9
DESCRIPTION
The process_name() function returns the name of the process (PID) associated
with a trace event.
9-30
Using Expressions
SYNTAX
process_name [([QE])]
PARAMETERS
QE
A user-defined qualified event. If supplied, the function returns
the name associated with the PID of the last instance of the
trace event which satisfies the conditions for the specified
qualified event. If omitted, the function returns the name associated with the PID of the current trace event. For more information, see “Qualified Events” on page 9-81.
RETURN TYPE
string
SEE ALSO
“offset_process_name()” on page 9-69
task_name()
9
DESCRIPTION
The task_name() function returns the name of the task associated with a trace
event.
NOTE
This function is only meaningful for trace events which were
logged from Ada tasking programs.
SYNTAX
task_name [([QE])]
PARAMETERS
QE
A user-defined qualified event. If supplied, the function returns
the name of the task associated with the last instance of the
trace event which satisfies the conditions for the specified
qualified event. If omitted, the function returns the name of the
task associated with the current trace event. For more information, see “Qualified Events” on page 9-81.
RETURN TYPE
string
9-31
NightTrace Manual
SEE ALSO
“offset_task_name()” on page 9-69
thread_name()
9
DESCRIPTION
The thread_name() function returns the thread name associated with a trace
event.
SYNTAX
thread_name [([QE])]
PARAMETERS
QE
A user-defined qualified event. If supplied, the function returns
the thread name associated with the last instance of the trace
event which satisfies the conditions for the specified qualified
event. If omitted, the function returns the thread name associated with the current trace event. For more information, see
“Qualified Events” on page 9-81.
RETURN TYPE
string
SEE ALSO
“offset_thread_name()” on page 9-70
Multi-Event Functions
9
Multi-event functions return information about one or more instances of an event:
• event_gap()
• event_matches()
event_gap()
9
DESCRIPTION
The event_gap() function returns the time, in seconds, between the most recent
occurrence of a specific event and its immediately preceeding occurrence.
SYNTAX
event_gap [([QE])]
9-32
Using Expressions
PARAMETERS
QE
A user-defined qualified event. If supplied, the function calcluates the gap between the two most recent occurrences of events
which satisfy the conditions of the specified qualilfied event.
If omitted, the function calculates the gap between the current
trace event and the event immediately preceeding it. For more
information, see “Qualified Events” on page 9-81.
RETURN TYPE
double-precision floating point
SEE ALSO
“time()” on page 9-27, “state_gap()” on page 9-57, and “state_dur()” on page 9-57.
event_matches()
9
DESCRIPTION
The event_matches() function returns the number of occurrences of a trace
event on or before the current time line.
SYNTAX
event_matches [([QE])]
PARAMETERS
QE
A user-defined qualified event. If supplied, the function calculates the number of occurrences of events which satisfy the
conditions of the specified qualified event on or before the current time line. If omitted, the function calculates the number of
occurrences of all events on or before the current time line.
For more information, see “Qualified Events” on page 9-81.
RETURN TYPE
integer
SEE ALSO
“summary_matches()” on page 9-74.
9-33
NightTrace Manual
State Functions
9
In its simplest form, a state is a region of source code bounded by two trace events. A
state definition requires the specification of two trace events, a start event and an end
event, respectively. Additional conditions may be specified in a state definition to further
constrain the state. The state functions include the following:
• Start functions
• End functions
• Multi-state functions
Start Functions
9
The start functions provide information about the start event of the most recent instance of
a state. The state to which the start function applies is either the qualified state specified to
the function, or the state being currently defined. Thus, if a qualfied state is not specified,
start functions are only meaningful when used in expressions associated within a state definition. In addition, start functions should not be used in a recursive manner in a Start
Exp res sion ; a start function should not be specified in a Star t Exp re ssion that
applies to the state definition containing that Start Expression. Conversely, an End
Expression may include start functions that apply to the state definition containing that
End Expression.
NOTE
Start functions provide information about the most recent instance
of a state, whereas end functions (see “End Functions” on page
9-45) provide information about the last completed instance of a
state.
Start functions include the following:
• start_id()
• start_arg()
• start_arg_dbl()
• start_num_args()
• start_pid()
• start_raw_pid()
• start_thread_id()
• start_task_id()
• start_tid()
• start_lwpid()
• start_cpu()
9-34
Using Expressions
• start_offset()
• start_time()
• start_node_id()
• start_pid_table_name()
• start_tid_table_name()
• start_node_name()
start_id()
9
DESCRIPTION
The start_id() function returns the trace event ID of the start event of the most
recent instance of a state.
SYNTAX
start_id [([QS])]
PARAMETERS
QS
A user-defined qualified state. If supplied, it specifies the state
to which the function applies. If omitted, the function may
only be used within a state definition and then applies to that
state. For more information, see “Qualified States” on page
9-83.
RETURN TYPE
integer
SEE ALSO
“id()” on page 9-19, “end_id()” on page 9-46, and “offset_id()” on page 9-60.
start_arg()
9
DESCRIPTION
The start_arg() function returns the value of a particular trace event argument
associated with the start event of the most recent instance of a state.
SYNTAX
start_arg[N] [([QS])]
9-35
NightTrace Manual
PARAMETERS
N
Specifies the Nth argument logged with the start event.
Defaults to 1.
QS
A user-defined qualified state. If supplied, it specifies the state
to which the function applies. If omitted, the function may
only be used within a state definition and then applies to that
state. For more information, see “Qualified States” on page
9-83.
RETURN TYPE
integer
SEE ALSO
“arg()” on page 9-20, “start_arg_dbl()” on page 9-36, “start_num_args()” on page
9-37, “end_arg()” on page 9-47, and “offset_arg()” on page 9-60.
start_arg_dbl()
9
DESCRIPTION
The start_arg_dbl() function returns the value of a particular trace event
argument associated with the start event of the most recent instance of a state.
SYNTAX
start_arg[N]_dbl [([QS])]
PARAMETERS
N
Specifies the Nth argument logged with the start event.
Defaults to 1.
QS
A user-defined qualified state. If supplied, it specifies the state
to which the function applies. If omitted, the function may
only be used within a state definition and then applies to that
state. For more information, see “Qualified States” on page
9-83.
RETURN TYPE
double-precision floating point
SEE ALSO
“arg_dbl()” on page 9-21, “start_arg()” on page 9-35, “start_num_args()” on page
9-37, “end_arg_dbl()” on page 9-47, and “offset_arg_dbl()” on page 9-61.
9-36
Using Expressions
start_num_args()
9
DESCRIPTION
The start_num_args() function returns the number of arguments associated
with the start event of the most recent instance of a state.
SYNTAX
start_num_args [([QS])]
PARAMETERS
QS
A user-defined qualified state. If supplied, it specifies the state
to which the function applies. If omitted, the function may
only be used within a state definition and then applies to that
state. For more information, see “Qualified States” on page
9-83.
RETURN TYPE
integer
SEE ALSO
“start_arg()” on page 9-35, “num_args()” on page 9-21, “end_num_args()” on page
9-48, and “offset_num_args()” on page 9-61.
start_pid()
9
DESCRIPTION
The start_pid() function returns the global process identifier (PID) associated
with the start event of the most recent instance of a state.
NOTE
A global process identifier does not have the same meaning as the
typical operating system definition of pid. A PID within NightTrace is a 32-bit integer value that contains the operating system
process identifier (raw PID) in the upper 16 bits and the lightweight process identifier (LWPID) in the lower 16 bits. Consult
the _lwp_global_self(2) man page for more information.
SYNTAX
start_pid [([QS])]
9-37
NightTrace Manual
PARAMETERS
QS
A user-defined qualified state. If supplied, it specifies the state
to which the function applies. If omitted, the function may
only be used within a state definition and then applies to that
state. For more information, see “Qualified States” on page
9-83.
RETURN TYPE
integer
SEE ALSO
“pid()” on page 9-22, “raw_pid()” on page 9-23, “lwpid()” on page 9-23,
“end_pid()” on page 9-48, and “offset_pid()” on page 9-62.
start_raw_pid()
9
DESCRIPTION
The start_raw_pid() function returns the process identifier (raw PID) associated with the start event of the most recent instance of a state.
NOTE
A NightTrace raw PID has the same meaning as the typical operating system definition of pid. See the getpid(2) man page
for more information.
SYNTAX
start_raw_pid [([QS])]
PARAMETERS
QS
A user-defined qualified state. If supplied, it specifies the state
to which the function applies. If omitted, the function may
only be used within a state definition and then applies to that
state. For more information, see “Qualified States” on page
9-83.
RETURN TYPE
integer
SEE ALSO
“pid()” on page 9-22, “raw_pid()” on page 9-23, “lwpid()” on page 9-23,
“end_pid()” on page 9-48, and “offset_pid()” on page 9-62.
9-38
Using Expressions
start_lwpid()
9
DESCRIPTION
The start_lwpid() function returns the lightweight process identifier (LWPID)
associated with the start event of the most recent instance of a state.
NOTE
See the _lwp_self(2) man page for more information.
SYNTAX
start_lwpid [([QS])]
PARAMETERS
QS
A user-defined qualified state. If supplied, it specifies the state
to which the function applies. If omitted, the function may
only be used within a state definition and then applies to that
state. For more information, see “Qualified States” on page
9-83.
RETURN TYPE
integer
SEE ALSO
“pid()” on page 9-22, “raw_pid()” on page 9-23, “lwpid()” on page 9-23,
“end_pid()” on page 9-48, and “offset_pid()” on page 9-62.
start_thread_id()
9
DESCRIPTION
The start_thread_id() function returns the thread identifier associated with
the start event of the most recent instance of a state.
NOTE
See the thr_self(3thread) man page for more information.
SYNTAX
start_thread_id [([QS])]
9-39
NightTrace Manual
PARAMETERS
QS
A user-defined qualified state. If supplied, it specifies the state
to which the function applies. If omitted, the function may
only be used within a state definition and then applies to that
state. For more information, see “Qualified States” on page
9-83.
RETURN TYPE
integer
SEE ALSO
“ t h r e a d _ i d ( ) ” o n p a g e 9 -2 4 , “ e n d _ t h r e a d _ i d ( ) ” o n p a g e 9 -5 1 , a n d
“offset_thread_id()” on page 9-64.
start_task_id()
9
DESCRIPTION
The start_task_id() function returns the Ada task identifier associated with
the start event of the most recent instance of a state.
NOTE
This function is only meaningful for trace events logged by Ada
tasking programs.
SYNTAX
start_task_id [([QS])]
PARAMETERS
QS
A user-defined qualified state. If supplied, it specifies the state
to which the function applies. If omitted, the function may
only be used within a state definition and then applies to that
state. For more information, see “Qualified States” on page
9-83.
RETURN TYPE
integer
SEE ALSO
“task_id()” on page 9-25, “end_task_id()” on page 9-51, and “offset_task_id()” on
page 9-64.
9-40
Using Expressions
start_tid()
9
DESCRIPTION
The start_tid() function returns the internally-assigned NightTrace thread
identifier (TID) associated with the start event of the most recent instance of a state.
SYNTAX
start_tid [([QS])]
PARAMETERS
QS
A user-defined qualified state. If supplied, it specifies the state
to which the function applies. If omitted, the function may
only be used within a state definition and then applies to that
state. For more information, see “Qualified States” on page
9-83.
RETURN TYPE
integer
SEE ALSO
“tid()” on page 9-25, “end_tid()” on page 9-52, and “offset_tid()” on page 9-65.
start_cpu()
9
DESCRIPTION
The start_cpu() function returns the logical CPU number associated with the
start event of the most recent instance of a state. CPUs are logically numbered starting at 0 and monotonically increase thereafter.
NOTE
This function is only valid when applied to events from NightTrace kernel trace event files.
SYNTAX
start_cpu [([QS])]
PARAMETERS
QS
A user-defined qualified state. If supplied, it specifies the state
to which the function applies. If omitted, the function may
only be used within a state definition and then applies to that
9-41
NightTrace Manual
state. For more information, see “Qualified States” on page
9-83.
RETURN TYPE
integer
SEE ALSO
“cpu()” on page 9-26, “end_cpu()” on page 9-52, and “offset_cpu()” on page 9-66.
start_offset()
9
DESCRIPTION
The start_offset() function returns the ordinal number (offset) of the start
event of the most recent instance of a state.
SYNTAX
start_offset [([QS])]
PARAMETERS
QS
A user-defined qualified state. If supplied, it specifies the state
to which the function applies. If omitted, the function may
only be used within a state definition and then applies to that
state. For more information, see “Qualified States” on page
9-83.
RETURN TYPE
integer
SEE ALSO
“offset()” on page 9-27 and “end_offset()” on page 9-53.
start_time()
9
DESCRIPTION
The start_time() function returns the time, in seconds, associated with the start
event of the most recent instance of a state. Times are relative to the earliest trace
event from all trace data files currently in use.
SYNTAX
start_time [([QS])]
9-42
Using Expressions
PARAMETERS
QS
A user-defined qualified state. If supplied, it specifies the state
to which the function applies. If omitted, the function may
only be used within a state definition and then applies to that
state. For more information, see “Qualified States” on page
9-83.
RETURN TYPE
double-precision floating point
SEE ALSO
“time()” on page 9-27, “end_time()” on page 9-54, “state_gap()” on page 9-57,
“state_dur()” on page 9-57, and “offset_time()” on page 9-66.
start_node_id()
9
DESCRIPTION
The start_node_id() function returns the internally-assigned node identifier
associated with the start event of the most recent instance of a state.
SYNTAX
start_node_id [([QS])]
PARAMETERS
QS
A user-defined qualified state. If supplied, it specifies the state
to which the function applies. If omitted, the function may
only be used within a state definition and then applies to that
state. For more information, see “Qualified States” on page
9-83.
RETURN TYPE
integer
SEE ALSO
“node_id()” on page 9-28, “offset_node_id()” on page 9-67, and “end_node_id()”
on page 9-54
9-43
NightTrace Manual
start_pid_table_name()
9
DESCRIPTION
The start_pid_table_name() function returns the name of the internally-assigned NightTrace process identifier table (PID table) associated with the
start event of the most recent instance of a state.
SYNTAX
start_pid_table_name [([QS])]
PARAMETERS
QS
A user-defined qualified state. If supplied, it specifies the state
to which the function applies. If omitted, the function may
only be used within a state definition and then applies to that
state. For more information, see “Qualified States” on page
9-83.
RETURN TYPE
string
SEE ALSO
“pid_table_name()” on page 9-29, “offset_pid_table_name()” on page 9-67, and
“end_pid_table_name()” on page 9-55
start_tid_table_name()
9
DESCRIPTION
The start_tid_table_name() function returns the name of the internally-assigned NightTrace thread identifier table (TID table) associated with the
start event of the most recent instance of a state.
SYNTAX
start_tid_table_name [([QS])]
PARAMETERS
QS
9-44
A user-defined qualified state. If supplied, it specifies the state
to which the function applies. If omitted, the function may
only be used within a state definition and then applies to that
state. For more information, see “Qualified States” on page
9-83.
Using Expressions
RETURN TYPE
string
SEE ALSO
“tid_table_name()” on page 9-29, “offset_tid_table_name()” on page 9-68, and
“end_tid_table_name()” on page 9-55
start_node_name()
9
DESCRIPTION
The start_node_name() function returns the name of the system from which
the start event of the most recent instance of a state was logged.
SYNTAX
start_node_name [([QS])]
PARAMETERS
QS
A user-defined qualified state. If supplied, it specifies the state
to which the function applies. If omitted, the function may
only be used within a state definition and then applies to that
state. For more information, see “Qualified States” on page
9-83.
RETURN TYPE
string
SEE ALSO
“node_name()” on page 9-30, “offset_node_nam e()” on page 9-68, and
“end_node_name()” on page 9-56
End Functions
9
The end functions provide information about the end event of the last completed instance
of a state. The state to which the end function applies is either the qualified state specified
to the function, or the state being currently defined. Thus, if a qualfied state is not specified, end functions are only meaningful when used in expressions associated within a state
definition.
NOTE
End functions provide information about the last completed
instance of a state, whereas start functions (see “Start Functions”
on page 9-34) provide information about the most recent instance
of a state.
9-45
NightTrace Manual
End functions include:
• end_id()
• end_arg()
• end_arg_dbl()
• end_num_args()
• end_pid()
• end_raw_pid()
• end_lwpid()
• end_thread_id()
• end_task_id()
• end_tid()
• end_cpu()
• end_offset()
• end_time()
• end_node_id()
• end_pid_table_name()
• end_tid_table_name()
• end_node_name()
end_id()
9
DESCRIPTION
The end_id() function returns the trace event ID associated with the end event of
the last completed instance of a state.
SYNTAX
end_id [([QS])]
PARAMETERS
QS
RETURN TYPE
integer
9-46
A user-defined qualified state. If supplied, it specifies the state
to which the function applies. If omitted, the function may
only be used within a state definition and then applies to that
state. For more information, see “Qualified States” on page
9-83.
Using Expressions
SEE ALSO
“id()” on page 9-19, “start_id()” on page 9-35, and “offset_id()” on page 9-60.
end_arg()
9
DESCRIPTION
The end_arg() function returns the value of a particular trace event argument
associated with the end event of the last completed instance of a state.
SYNTAX
end_arg[N] [([QS])]
PARAMETERS
N
Specifies the Nth argument logged with the trace event.
Defaults to 1.
QS
A user-defined qualified state. If supplied, it specifies the state
to which the function applies. If omitted, the function may
only be used within a state definition and then applies to that
state. For more information, see “Qualified States” on page
9-83.
RETURN TYPE
integer
SEE ALSO
“arg()” on page 9-20, “start_arg()” on page 9-35, “end_arg_dbl()” on page 9-47,
“end_num_args()” on page 9-48, and “offset_arg()” on page 9-60.
end_arg_dbl()
9
DESCRIPTION
The end_arg_dbl() function returns the value of a particular trace event argument associated with the end event of the last completed instance of a state.
SYNTAX
end_arg[N]_dbl [([QS])]
PARAMETERS
N
Specifies the Nth argument logged with the trace event.
Defaults to 1.
9-47
NightTrace Manual
QS
A user-defined qualified state. If supplied, it specifies the state
to which the function applies. If omitted, the function may
only be used within a state definition and then applies to that
state. For more information, see “Qualified States” on page
9-83.
RETURN TYPE
double-precision floating point
SEE ALSO
“arg_dbl()” on page 9-21, “start_arg_dbl()” on page 9-36, “end_arg()” on page 9-47,
“end_num_args()” on page 9-48, and “offset_arg_dbl()” on page 9-61.
end_num_args()
9
DESCRIPTION
The end_num_args() function returns the number of arguments associated with
the end event of the last completed instance of a state.
SYNTAX
end_num_args [([QS])]
PARAMETERS
QS
A user-defined qualified state. If supplied, it specifies the state
to which the function applies. If omitted, the function may
only be used within a state definition and then applies to that
state. For more information, see “Qualified States” on page
9-83.
RETURN TYPE
integer
SEE ALSO
“num_args()” on page 9-21, “start_num_args()” on page 9-37, “end_arg()” on page
9-47, and “offset_num_args()” on page 9-61.
end_pid()
9
DESCRIPTION
The end_pid() function returns the global process identifier (PID) associated
with the end event of the last completed instance of a state.
9-48
Using Expressions
NOTE
A global process identifier does not have the same meaning as the
typical operating system definition of pid. A PID within NightTrace is a 32-bit integer value that contains the operating system
process identifier (raw PID) in the upper 16 bits and the lightweight process identifier (LWPID) in the lower 16 bits. Consult
the _lwp_global_self(2) man page for more information.
SYNTAX
end_pid [([QS])]
PARAMETERS
QS
A user-defined qualified state. If supplied, it specifies the state
to which the function applies. If omitted, the function may
only be used within a state definition and then applies to that
state. For more information, see “Qualified States” on page
9-83.
RETURN TYPE
integer
SEE ALSO
“pid()” on page 9-22, “raw_pid()” on page 9-23, “lwpid()” on page 9-23,
“start_pid()” on page 9-37, and “offset_pid()” on page 9-62.
end_raw_pid()
9
DESCRIPTION
The end_raw_pid() function returns the process identifier (raw PID) associated
with the end event of the last completed instance of a state.
NOTE
A NightTrace raw PID has the same meaning as the typical operating system definition of pid. See the getpid(2) man page
for more information.
SYNTAX
end_raw_pid [([QS])]
9-49
NightTrace Manual
PARAMETERS
QS
A user-defined qualified state. If supplied, it specifies the state
to which the function applies. If omitted, the function may
only be used within a state definition and then applies to that
state. For more information, see “Qualified States” on page
9-83.
RETURN TYPE
integer
SEE ALSO
“pid()” on page 9-22, “raw_pid()” on page 9-23, “lwpid()” on page 9-23,
“start_pid()” on page 9-37, and “offset_pid()” on page 9-62.
end_lwpid()
9
DESCRIPTION
The end_lwpid() function returns the lightweight process identifier (LWPID)
associated with the end event of the last completed instance of a state.
NOTE
See the _lwp_self(2) man page for more information.
SYNTAX
end_lwpid [([QS])]
PARAMETERS
QS
A user-defined qualified state. If supplied, it specifies the state
to which the function applies. If omitted, the function may
only be used within a state definition and then applies to that
state. For more information, see “Qualified States” on page
9-83.
RETURN TYPE
integer
SEE ALSO
“pid()” on page 9-22, “raw_pid()” on page 9-23, “lwpid()” on page 9-23,
“start_pid()” on page 9-37, and “offset_pid()” on page 9-62.
9-50
Using Expressions
end_thread_id()
9
DESCRIPTION
The end_thread_id() function returns the thread identifier associated with the
end event of the last completed instance of a state.
NOTE
See the thr_self(3thread) man page for more information.
SYNTAX
end_thread_id [([QS])]
PARAMETERS
QS
A user-defined qualified state. If supplied, it specifies the state
to which the function applies. If omitted, the function may
only be used within a state definition and then applies to that
state. For more information, see “Qualified States” on page
9-83.
RETURN TYPE
integer
SEE ALSO
“ t h r e a d _ i d ( ) ” o n p a g e 9 -2 4 , “ st a r t _ t h r e a d _ i d ( ) ” o n p a g e 9 -3 9 , a n d
“offset_thread_id()” on page 9-64.
end_task_id()
9
DESCRIPTION
The end_task_id() function returns the Ada task identifier associated with the
end event of the last completed instance of a state.
NOTE
This function is only meaningful for trace events logged by Ada
tasking programs.
SYNTAX
end_task_id [([QS])]
9-51
NightTrace Manual
PARAMETERS
QS
A user-defined qualified state. If supplied, it specifies the state
to which the function applies. If omitted, the function may
only be used within a state definition and then applies to that
state. For more information, see “Qualified States” on page
9-83.
RETURN TYPE
integer
SEE ALSO
“task_id()” on page 9-25, “start_task_id()” on page 9-40, and “offset_task_id()” on
page 9-64.
end_tid()
9
DESCRIPTION
The end_tid() function returns the internally-assigned NightTrace thread identifier (TID) associated with the end event of the last completed instance of a state.
SYNTAX
end_tid [([QS])]
PARAMETERS
QS
A user-defined qualified state. If supplied, it specifies the state
to which the function applies. If omitted, the function may
only be used within a state definition and then applies to that
state. For more information, see “Qualified States” on page
9-83.
RETURN TYPE
integer
SEE ALSO
“tid()” on page 9-25, “start_tid()” on page 9-41, and “offset_tid()” on page 9-65.
end_cpu()
9
DESCRIPTION
The end_cpu() function returns the logical CPU number associated with the end
event of the last completed instance of a state. CPUs are logically numbered starting at 0 and monotonically increase thereafter.
9-52
Using Expressions
NOTE
This function is only valid when applied to events from NightTrace kernel trace event files.
SYNTAX
end_cpu [([QS])]
PARAMETERS
QS
A user-defined qualified state. If supplied, it specifies the state
to which the function applies. If omitted, the function may
only be used within a state definition and then applies to that
state. For more information, see “Qualified States” on page
9-83.
RETURN TYPE
integer
SEE ALSO
“cpu()” on page 9-26, “start_cpu()” on page 9-41, and “offset_cpu()” on page 9-66.
end_offset()
9
DESCRIPTION
The end_offset() function returns the ordinal number (offset) of the end event
of the last completed instance of a state.
SYNTAX
end_offset [([QS])]
PARAMETERS
QS
A user-defined qualified state. If supplied, it specifies the state
to which the function applies. If omitted, the function may
only be used within a state definition and then applies to that
state. For more information, see “Qualified States” on page
9-83.
RETURN TYPE
integer
9-53
NightTrace Manual
SEE ALSO
“offset()” on page 9-27 and “start_offset()” on page 9-42.
end_time()
9
DESCRIPTION
The end_time() function returns the time, in seconds, associated with the end
event of the last completed instance of a state. Times are relative to the earliest
trace event from all trace data files currently in use.
SYNTAX
end_time [([QS])]
PARAMETERS
QS
A user-defined qualified state. If supplied, it specifies the state
to which the function applies. If omitted, the function may
only be used within a state definition and then applies to that
state. For more information, see “Qualified States” on page
9-83.
RETURN TYPE
double-precision floating point
SEE ALSO
“time()” on page 9-27, “start_time()” on page 9-42, “state_gap()” on page 9-57,
“state_dur()” on page 9-57, and “offset_time()” on page 9-66.
end_node_id()
9
DESCRIPTION
The end_node_id() function returns the internally-assigned node identifier associated with the end event of the last completed instance of a state.
SYNTAX
end_node_id [([QS])]
PARAMETERS
QS
9-54
A user-defined qualified state. If supplied, it specifies the state
to which the function applies. If omitted, the function may
only be used within a state definition and then applies to that
state. For more information, see “Qualified States” on page
9-83.
Using Expressions
RETURN TYPE
integer
SEE ALSO
“node_id()” on page 9-28, “start_node_id()” on page 9-43, and “offset_node_id()”
on page 9-67
end_pid_table_name()
9
DESCRIPTION
The end_pid_table_name() function returns the name of the internally-assigned NightTrace process identifier table (PID table) associated with the
end event of the last completed instance of a state.
SYNTAX
end_pid_table_name [([QS])]
PARAMETERS
QS
A user-defined qualified state. If supplied, it specifies the state
to which the function applies. If omitted, the function may
only be used within a state definition and then applies to that
state. For more information, see “Qualified States” on page
9-83.
RETURN TYPE
string
SEE ALSO
“pid_table_name()” on page 9-29, “start_pid_table_name()” on page 9-44, and
“offset_pid_table_name()” on page 9-67.
end_tid_table_name()
9
DESCRIPTION
The end_tid_table_name() function returns the name of the internally-assigned NightTrace thread identifier table (TID table) associated with the end
event of the last completed instance of a state.
SYNTAX
end_tid_table_name [([QS])]
9-55
NightTrace Manual
PARAMETERS
QS
A user-defined qualified state. If supplied, it specifies the state
to which the function applies. If omitted, the function may
only be used within a state definition and then applies to that
state. For more information, see “Qualified States” on page
9-83.
RETURN TYPE
string
SEE ALSO
“tid_table_name()” on page 9-29, “start_tid_table_name()” on page 9-44, and
“offset_tid_table_name()” on page 9-68.
end_node_name()
9
DESCRIPTION
The end_node_name() function returns the name of the system from which the
end event of the last completed instance of a state was logged.
SYNTAX
end_node_name [([QS])]
PARAMETERS
QS
A user-defined qualified state. If supplied, it specifies the state
to which the function applies. If omitted, the function may
only be used within a state definition and then applies to that
state. For more information, see “Qualified States” on page
9-83.
RETURN TYPE
string
SEE ALSO
“node_nam e()” on page 9-30 , “start_n ode_name()” on page 9-45, and
“offset_node_name()” on page 9-68.
Multi-State Functions
9
Multi-state functions return information about one or more instances of a state:
• state_gap()
• state_dur()
9-56
Using Expressions
• state_matches()
• state_status()
For restrictions on usage, see “StateGraph” on page 8-14.
state_gap()
9
DESCRIPTION
The state_gap() function returns the time in seconds between the start event of
the most recent instance of the state and the end event of the instance immediately
preceeding it or zero if there was no previous instance.
SYNTAX
state_gap [([QS])]
PARAMETERS
QS
A user-defined qualified state. If supplied, it specifies the state
to which the function applies. If omitted, the function may
only be used within a state definition and then applies to that
state. For more information, see “Qualified States” on page
9-83.
RETURN TYPE
double-precision floating point
SEE ALSO
“start_time()” on page 9-42, “end_time()” on page 9-54, “event_gap()” on page
9-32, and “state_dur()” on page 9-57.
state_dur()
9
DESCRIPTION
The state_dur() function returns the time in seconds between the start event and the
end event of the last completed instance of a state. Thus, if the current time line occurs
within an instance of the state but before it has ended, state_dur() returns the duration
of the previous instance or zero if there was no previous instance.
SYNTAX
state_dur [([QS])]
PARAMETERS
QS
A user-defined qualified state. If supplied, it specifies the state
to which the function applies. If omitted, the function may
9-57
NightTrace Manual
only be used within a state definition and then applies to that
state. For more information, see “Qualified States” on page
9-83.
RETURN TYPE
double-precision floating point
SEE ALSO
“state_gap()” on page 9-57.
state_matches()
9
DESCRIPTION
The state_matches() function returns the number of completed instances of a
state on or before the current time line.
SYNTAX
state_matches [([QS])]
PARAMETERS
QS
A user-defined qualified state. If supplied, it specifies the state
to which the function applies. If omitted, the function may
only be used within a state definition and then applies to that
state. For more information, see “Qualified States” on page
9-83.
RETURN TYPE
integer
SEE ALSO
“Start Functions” on page 9-34 and “summary_matches()” on page 9-74.
state_status()
9
DESCRIPTION
The state_status() function indicates whether the current time line resides
within a current instance of a state. Thus, if the current time line is positioned in the
region from the start event up to, but not including, the end event of an instance of
the state, the return value is TRUE. Otherwise, it is FALSE.
SYNTAX
state_status [([QS])]
9-58
Using Expressions
PARAMETERS
QS
A user-defined qualified state. If supplied, it specifies the state
to which the function applies. If omitted, the function may
only be used within a state definition and then applies to that
state. For more information, see “Qualified States” on page
9-83.
RETURN TYPE
boolean
Offset Functions
9
All offset functions take an expression that evaluates to an ordinal trace event (offset) as a
parameter. (Offsets begin at zero.) These functions include the following:
• offset_id()
• offset_arg()
• offset_arg_dbl()
• offset_num_args()
• offset_pid()
• offset_raw_pid()
• offset_lwpid()
• offset_thread_id()
• offset_task_id()
• offset_tid()
• offset_cpu ()
• offset_time()
• offset_node_id()
• offset_pid_table_name()
• offset_tid_table_name()
• offset_node_name()
• offset_process_name()
• offset_task_name()
• offset_thread_name()
Usually, these functions take one of the following functions as a parameter:
• offset()
9-59
NightTrace Manual
• start_offset()
• end_offset()
• min_offset()
• max_offset()
For information about these functions, see “offset()” on page 9-27, “start_offset()” on
page 9-42, “end_offset()” on page 9-53, “min_offset()” on page 9-73, and “max_offset()”
on page 9-73.
offset_id()
9
DESCRIPTION
The offset_id() function returns the trace event ID of the ordinal trace event
(offset).
SYNTAX
offset_id( offset_expr )
PARAMETERS
offset_expr
An expression that evaluates to the offset (or ordinal trace
event number) of a trace event.
RETURN TYPE
integer
SEE ALSO
“id()” on page 9-19, “start_id()” on page 9-35, and “end_id()” on page 9-46.
offset_arg()
9
DESCRIPTION
The offset_arg() function returns the value of a particular trace event argument for the ordinal trace event (offset).
SYNTAX
offset_arg[N] (offset_expr)
PARAMETERS
N
9-60
Specifies the Nth argument logged with the trace event.
Defaults to 1.
Using Expressions
offset_expr
An expression that evaluates to the offset (or ordinal trace
event number) of a trace event.
RETURN TYPE
integer
SEE ALSO
“arg()” on page 9-20, “start_arg()” on page 9-35, “end_arg()” on page 9-47,
“offset_arg_dbl()” on page 9-61, and “offset_num_args()” on page 9-61.
offset_arg_dbl()
9
DESCRIPTION
The offset_arg_dbl() function returns the value of a particular trace event
argument for the ordinal trace event (offset).
SYNTAX
offset_arg[N]_dbl (offset_expr)
PARAMETERS
N
Specifies the Nth argument logged with the trace event.
Defaults to 1.
offset_expr
An expression that evaluates to the offset (or ordinal trace
event number) of a trace event.
RETURN TYPE
double-precision floating point
SEE ALSO
“arg_dbl()” on page 9-21, “start_arg_dbl()” on page 9-36, “end_arg_dbl()” on page
9-47, “offset_arg()” on page 9-60, and “offset_num_args()” on page 9-61.
offset_num_args()
9
DESCRIPTION
The offset_num_args() function returns the number of arguments logged with
the ordinal trace event (offset).
SYNTAX
offset_num_args (offset_expr)
9-61
NightTrace Manual
PARAMETERS
offset_expr
An expression that evaluates to the offset (or ordinal trace
event number) of a trace event.
RETURN TYPE
integer
SEE ALSO
“num_args()” on page 9-21, “start_num_args()” on page 9-37, “end_num_args()” on
page 9-48, “offset_arg()” on page 9-60, and “offset_arg_dbl()” on page 9-61.
offset_pid()
9
DESCRIPTION
The offset_pid() function returns the global process identifier (PID) from
which the ordinal trace event (offset) was logged.
NOTE
A global process identifier does not have the same meaning as the
typical operating system definition of pid. A PID within NightTrace is a 32-bit integer value that contains the operating system
process identifier (raw PID) in the upper 16 bits and the lightweight process identifier (LWPID) in the lower 16 bits. Consult
the _lwp_global_self(2) man page for more information.
SYNTAX
offset_pid (offset_expr)
PARAMETERS
offset_expr
An expression that evaluates to the offset (or ordinal trace
event number) of a trace event.
RETURN TYPE
integer
SEE ALSO
“pid()” on page 9-22, “raw_pid()” on page 9-23, “lwpid()” on page 9-23,
“start_pid()” on page 9-37, and “end_pid()” on page 9-48.
9-62
Using Expressions
offset_raw_pid()
9
DESCRIPTION
The offset_raw_pid() function returns the process identifier (raw PID) from
which the ordinal trace event (offset) was logged.
NOTE
A NightTrace raw PID has the same meaning as the typical operating system definition of pid. See the getpid(2) man page
for more information.
SYNTAX
offset_raw_pid (offset_expr)
PARAMETERS
offset_expr
An expression that evaluates to the offset (or ordinal trace
event number) of a trace event.
RETURN TYPE
integer
SEE ALSO
“pid()” on page 9-22, “raw_pid()” on page 9-23, “lwpid()” on page 9-23,
“start_pid()” on page 9-37, and “end_pid()” on page 9-48.
offset_lwpid()
9
DESCRIPTION
The offset_lwpid() function returns the lightweight process identifier
(LWPID) from which the ordinal trace event (offset) was logged.
NOTE
See the _lwp_self(2) man page for more information.
SYNTAX
offset_lwpid (offset_expr)
9-63
NightTrace Manual
PARAMETERS
offset_expr
An expression that evaluates to the offset (or ordinal trace
event number) of a trace event.
RETURN TYPE
integer
SEE ALSO
“pid()” on page 9-22, “raw_pid()” on page 9-23, “lwpid()” on page 9-23,
“start_lwpid()” on page 9-39, and “end_lwpid()” on page 9-50.
offset_thread_id()
9
DESCRIPTION
The offset_thread_id() function returns the thread identifier from which the
ordinal trace event (offset) was logged.
NOTE
See the thr_self(3thread) man page for more information.
SYNTAX
offset_thread_id (offset_expr)
PARAMETERS
offset_expr
An expression that evaluates to the offset (or ordinal trace
event number) of a trace event.
RETURN TYPE
integer
SEE ALSO
“thread_id()” on page 9-24, “start_thread_id()” on page 9-39, and “end_thread_id()”
on page 9-51.
offset_task_id()
9
DESCRIPTION
The offset_task_id() function returns the Ada task identifier from which the
ordinal trace event (offset) was logged.
9-64
Using Expressions
NOTE
This function is only meaningful for trace events logged by Ada
tasking programs.
SYNTAX
offset_task_id (offset_expr)
PARAMETERS
offset_expr
An expression that evaluates to the offset (or ordinal trace
event number) of a trace event.
RETURN TYPE
integer
SEE ALSO
“task_id()” on page 9-25, “start_task_id()” on page 9-40, and “end_task_id()” on
page 9-51.
offset_tid()
9
DESCRIPTION
The offset_tid() function returns the internally-assigned NightTrace thread
identifier (TID) from which the ordinal trace event (offset) was logged.
SYNTAX
offset_tid (offset_expr)
PARAMETERS
offset_expr
An expression that evaluates to the offset (or ordinal trace
event number) of a trace event.
RETURN TYPE
integer
SEE ALSO
“tid()” on page 9-25, “start_tid()” on page 9-41, and “end_tid()” on page 9-52.
9-65
NightTrace Manual
offset_cpu()
9
DESCRIPTION
The offset_cpu() function returns the logical CPU number on which the ordinal
trace event (offset) occurred. CPUs are logically numbered starting at 0 and monotonically increase thereafter.
NOTE
This function is only valid when applied to events from NightTrace kernel trace event files.
SYNTAX
offset_cpu (offset_expr)
PARAMETERS
offset_expr
An expression that evaluates to the offset (or ordinal trace
event number) of a trace event.
RETURN TYPE
integer
SEE ALSO
“cpu()” on page 9-26, “start_cpu()” on page 9-41, and “end_cpu()” on page 9-52.
offset_time()
9
DESCRIPTION
The offset_time() function returns the time in seconds between the beginning
of the trace run and the ordinal trace event (offset).
SYNTAX
offset_time (offset_expr)
PARAMETERS
offset_expr
An expression that evaluates to the offset (or ordinal trace
event number) of a trace event.
RETURN TYPE
double-precision floating point
9-66
Using Expressions
SEE ALSO
“time()” on page 9-27, “start_time()” on page 9-42, and “end_time()” on page 9-54.
offset_node_id()
9
DESCRIPTION
The offset_node_id() function returns the internally-assigned node identifier
from which the ordinal trace event (offset) was logged.
SYNTAX
offset_node_id (offset_expr)
PARAMETERS
offset_expr
An expression that evaluates to the offset (or ordinal trace
event number) of a trace event.
RETURN TYPE
integer
SEE ALSO
“node_id()” on page 9-28, “start_node_id()” on page 9-43, and “end_node_id()” on
page 9-54
offset_pid_table_name()
9
DESCRIPTION
The offset_pid_table_name() function returns the name of the internally-assigned NightTrace process identifier table (PID table) for the ordinal trace
event (offset).
SYNTAX
offset_pid_table_name (offset_expr)
PARAMETERS
offset_expr
An expression that evaluates to the offset (or ordinal trace
event number) of a trace event.
RETURN TYPE
string
9-67
NightTrace Manual
SEE ALSO
“pid_table_name()” on page 9-29, “start_pid_table_name()” on page 9-44, and
“end_pid_table_name()” on page 9-55
offset_tid_table_name()
9
DESCRIPTION
The offset_tid_table_name() function returns the name of the internally-assigned NightTrace thread identifier table (TID table) for the ordinal trace
event (offset).
SYNTAX
offset_tid_table_name (offset_expr)
PARAMETERS
offset_expr
An expression that evaluates to the offset (or ordinal trace
event number) of a trace event.
RETURN TYPE
string
SEE ALSO
“tid_table_name()” on page 9-29, “start_tid_table_name()” on page 9-44, and
“end_tid_table_name()” on page 9-55
offset_node_name()
9
DESCRIPTION
The offset_node_name() function returns the name of the system from which
the ordinal trace event (offset) was logged.
SYNTAX
offset_node_name (offset_expr)
PARAMETERS
offset_expr
RETURN TYPE
string
9-68
An expression that evaluates to the offset (or ordinal trace
event number) of a trace event.
Using Expressions
SEE ALSO
“node_name()” on page 9-30 , “start_n ode_name()” on page 9-45, and
“end_node_name()” on page 9-56
offset_process_name()
9
DESCRIPTION
The offset_process_name() function returns the name of the process (PID)
from which the ordinal trace event (offset) was logged.
SYNTAX
offset_process_name (offset_expr)
PARAMETERS
offset_expr
An expression that evaluates to the offset (or ordinal trace
event number) of a trace event.
RETURN TYPE
string
SEE ALSO
“process_name()” on page 9-30
offset_task_name()
9
DESCRIPTION
The offset_task_name() function returns the name of the task from which the
ordinal trace event (offset) was logged.
NOTE
This function is only meaningful for trace events which were
logged from Ada tasking programs.
SYNTAX
offset_task_name (offset_expr)
PARAMETERS
offset_expr
An expression that evaluates to the offset (or ordinal trace
event number) of a trace event.
9-69
NightTrace Manual
RETURN TYPE
string
SEE ALSO
“task_name()” on page 9-31
offset_thread_name()
9
DESCRIPTION
The offset_thread_name() function returns the thread name from which the
ordinal trace event (offset) was logged.
SYNTAX
offset_thread_name (offset_expr)
PARAMETERS
offset_expr
An expression that evaluates to the offset (or ordinal trace
event number) of a trace event.
RETURN TYPE
string
SEE ALSO
“thread_name()” on page 9-32
Summary Functions
9
You u sually use summary fu nctions o n the S u m m a r i z e F o r m . Except fo r
summary_matches(), all of these functions take another expression as a parameter.
They include the following:
• min()
• max()
• avg()
• sum()
• min_offset()
• max_offset()
• summary_matches()
9-70
Using Expressions
min()
9
DESCRIPTION
The min() function returns the minimum value of all occurrences of expr within a
time range. When used in a Summarize Form, the time range is defined by that
form. When used elsewhere, the time range is defined as the region starting with the
first trace event and ending with the current trace event.
SYNTAX
min (expr)
PARAMETERS
expr
A numeric expression.
RETURN TYPE
data type of expr
SEE ALSO
“Summary Functions” on page 9-70 and “Summarizing Statistical Information” on
page 10-5.
max()
9
DESCRIPTION
The max() function returns the maximum value of all occurrences of expr within a
time range. When used in a Summarize Form, the time range is defined by that
form. When used elsewhere, the time range is defined as the region starting with the
first trace event and ending with the current trace event.
SYNTAX
max (expr)
PARAMETERS
expr
A numeric expression.
RETURN TYPE
data type of expr
9-71
NightTrace Manual
SEE ALSO
“Summary Functions” on page 9-70 and “Summarizing Statistical Information” on
page 10-5.
avg()
9
DESCRIPTION
The avg() function returns the average value of all occurrences of expr within a
time range. When used in a Summarize Form, the time range is defined by that
form. When used elsewhere, the time range is defined as the region starting with the
first trace event and ending with the current trace event.
SYNTAX
avg (expr)
PARAMETERS
expr
A numeric expression.
RETURN TYPE
data type of expr
SEE ALSO
“Summary Functions” on page 9-70 and “Summarizing Statistical Information” on
page 10-5.
sum()
9
DESCRIPTION
The sum() function returns the sum value of all occurrences of expr within a time
range. When used in a Summarize Form, the time range is defined by that form.
When used elsewhere, the time range is defined as the region starting with the first
trace event and ending with the current trace event.
SYNTAX
sum (expr)
PARAMETERS
expr
9-72
A numeric expression.
Using Expressions
RETURN TYPE
data type of expr
SEE ALSO
“Summary Functions” on page 9-70 and “Summarizing Statistical Information” on
page 10-5.
min_offset()
9
DESCRIPTION
The min_offset() function returns the ordinal trace event (offset) where the
minimum value of the parameter occurred for matches in the time range. Thus, if
the same minimum was seen more than once, the offset corresponds to the first one
seen.
SYNTAX
min_offset (expr)
PARAMETERS
expr
A numeric expression.
RETURN TYPE
integer
NOTE
There is no function that returns the trace event ID where the minimum value of the
first argument occurred for all matches in the time range. You could obtain this
value by nesting the functions as follows:
offset_id( min_offset( arg1() ) )
SEE ALSO
“Summary Functions” on page 9-70 and “Summarizing Statistical Information” on
page 10-5.
max_offset()
9
DESCRIPTION
The max_offset() function returns the ordinal trace event (offset) where the
maximum value of the parameter occurred for matches in the time range. Thus, if
9-73
NightTrace Manual
the same maximum was seen more than once, the offset corresponds to the first one
seen.
SYNTAX
max_offset (expr)
PARAMETERS
expr
A numeric expression.
RETURN TYPE
integer
NOTE
There is no function that returns the trace event ID where the maximum value of the
first argument occurred for all matches in the time range. You could obtain this
value by nesting the functions as follows:
offset_id( max_offset( arg1() ) )
SEE ALSO
“Summary Functions” on page 9-70 and “Summarizing Statistical Information” on
page 10-5.
summary_matches()
9
DESCRIPTION
The summary_matches() function returns the number of times the summary criteria and Filter-Expression were matched in the time range.
NOTE
This function should only used in the Summarize Form. Its
behavior elsewhere is undefined. (See “Summarizing Statistical
Information” on page 10-5 for more information.)
SYNTAX
summary_matches ()
RETURN TYPE
integer
9-74
Using Expressions
SEE ALSO
“event_matches()” on page 9-33 and “state_matches()” on page 9-58. For information about Filter-Expression, see “Summarize Form Fields” on page 10-6.
Format and Table Functions
9
The format function allows you to display a string. The table functions allow you to
extract information from user-defined and pre-defined string and format tables. These
functions include the following:
• get_string()
• get_item()
• get_format()
• format()
For more information about tables, see “ntrace Tables” on page 5-12 and “Kernel String
Tables” on page 11-16.
get_string()
9
The get_string() routine dynamically looks up a string in a string table.
SYNTAX
get_string (table_name[, int_expr])
PARAMETERS
table_name
table_name is an unquoted character string that represents the
name of a string table. To avoid possible forward reference
problems, try to make your get_string() calls refer to previously-defined string tables. The following string table names
are pre-defined in NightTrace: event, pid, tid, boolean, name_pid, name_tid, node_name,
pid_nodename, tid_nodename, vector, syscall,
device, event_summary, event_arg_summary,
event_arg_dbl_summary, state_summary. For more
information on these tables, see “Pre-Defined String Tables”
on page 5-14 and “Kernel String Tables” on page 11-16.
int_expr
int_expr is an integer expression that acts as an index into the
specified string table. int_expr must either match an identifying
integer value in the table_name string table, or the table_name
str ing table must have a defau lt item lin e; o therw ise
get_string() returns a string of int_expr in decimal. Often
int_expr is based on a NightTrace function.
If your table consists of only a default item line, omit this
parameter.
9-75
NightTrace Manual
DESCRIPTION
The following NightTrace constructs can call get_string() to dynamically
locate a static string in a string table:
• A Then-Expression of a display object configuration
• A value field of a format table
For each get_string() call, NightTrace follows these steps:
1. Evaluates int_expr
2. Uses this value as an index into table_name
3. Retrieves the associated string from table_name
4. Returns a string
The following lines provide a brief example of a call to get_string().
9-76
Using Expressions
string_table (conditions) = {
item = 1, “normal”;
item = 50, “YELLOW ALERT”;
item = 99, “RED ALERT”;
default_item = “N/A”;
};
In this example the numeric argument associated with a trace event represents the
current conditions (conditions). If the argument has the value 99, NightTrace:
1. Uses the value 99 as in index into conditions
2. Retrieves the associated string (“RED ALERT”) from conditions
3. Returns “RED ALERT”
RETURN TYPES
On successful completion, get_string() returns a string from a string table.
NightTrace returns a string of the item number, int_expr, in decimal if table_name is
not found, or if int_expr is not found and there is no default item line. The first time
table_name is not found, NightTrace issues an error message. Because
get_string() returns a string, you can use it anywhere a string expression is
appropriate.
For more information on string tables, see “String Tables” on page 5-13, Table 8-3, and
the /usr/lib/NightTrace/tables file.
get_item()
9
The get_item() routine looks up an item number in a string table.
SYNTAX
int get_item (table_name, “str_const”)
PARAMETERS
table_name
table_name is an unquoted character string that represents the
name of a string table. To avoid possible forward reference
problems, try to make your get_item() calls refer to previously-defined string tables. The following string table names
are pre-defined in NightTrace: event, pid, tid, boolean, name_pid, name_tid, node_name,
pid_nodename, tid_nodename, vector, syscall,
device, event_summary, event_arg_summary,
event_arg_dbl_summary, state_summary. For more
information on these tables, see “Pre-Defined String Tables”
on page 5-14 and “Kernel String Tables” on page 11-16.
str_const
str_const is a string constant literal that acts as an index into the
specified string table. str_const must either exactly match a
string value in the table_name string table, or the table_name
string table must have a default item line; otherwise the results
9-77
NightTrace Manual
are undefined. A table_name may contain several item lines
with the same str_const value.
DESCRIPTION
Usually you would put a get_item() call in a Then-Expression of a display
object configuration to locate an index number in a string table. For each
get_item() call, NightTrace follows these steps:
1. Uses str_const value as an index into table_name
2. Retrieves the first associated index number from table_name
3. Returns the index number
Assume that the following string table definition is in your configuration file.
string_table (fruit) = {
item = 3, “apple”;
item = 4, “orange”;
item = 5, “cherry”;
item = 6, “banana”;
default_item = “Unknown”;
};
Assume that you make the following call in the Then-Expression of a DataBox.
get_item (fruit, “orange”)
In this example, the fruit string table associates specific numeric codes with a
corresponding fruit name string; it associates all other numeric codes with the string
“Unknown.” When NightTrace evaluates the T h e n - E x p r e s s io n of this
DataBox, it:
1. Calls get_item()
2. Uses the string “orange” as an index into the fruit string table
3. Retrieves the (first) associated index (4)
4. Returns the index number (4)
RETURN TYPES
On successful completion, get_item() returns an item number from a string
table. If several item lines within the string table have the same string value as
str_const, get_item() returns the first item number from one of these item lines.
If table_name is not found, NightTrace issues an error message, and the results are
undefined. If str_const is not found and there is no default item line, the results are
undefined. Because get_item() returns an integer, you can use it anywhere an
integer expression can be used.
For more information on string tables, see “String Tables” on page 5-13 and the
/usr/lib/NightTrace/tables file. For more examples of function calls with
pre-defined string tables, see Table 8-3.
9-78
Using Expressions
get_format()
9
The get_format() routine dynamically looks up a string in a format table.
SYNTAX
get_format (table_name[, int_expr])
PARAMETERS
table_name
table_name is an unquoted character string that represents the
name of a format table. To avoid possible forward reference
problems, try to make your get_format() calls refer to previously-defined format tables.
int_expr
int_expr is an integer expression that acts as an index into the
specified format table. int_expr must either match an identifying integer value in the table_name format table, or the
table_name format table must have a default item line; otherwise, the results are undefined. Often int_expr is based on a
NightTrace function.
If your table consists of only a default item line, omit this
parameter.
DESCRIPTION
A call to get_format() must be the first function call in an expression. You
must not nest calls to get_format().
The T h e n - E x p r e s s i o n parameter of a DataBox configuration and the
Summa rize-Expression on a Summary Form can call get_format() to
dynamically locate a string in a format table. For each get_format() call, NightTrace follows these steps:
1. Evaluates int_expr
2. Uses this value as an index into table_name
3. Retrieves the associated string from table_name
4. Replaces any conversion specifications in the associated string
5. Returns a string
Assume that the following format table definition is in your configuration file.
format_table (what_pid) = {
item = 1, “Trace event 1 logged by pid %d’%d”, “raw_pid()”,
“lwpid()”;
default_item = “Unaccounted for event ID (%d)”, “id()”;
};
Assume that you make the following call in the Then-Expression of a DataBox.
get_format (what_pid, id())
9-79
NightTrace Manual
In this example, the what_pid format table associates one dynamically-generated
string with trace event ID 1 (id() == 1) and another string with all other trace
events (default_item). When NightTrace processes a trace event for the display
object with the above get_format(), it:
1. Evaluates the NightTrace id() function. (Assume it evaluates to 1)
2. Calls get_format()
3. Uses this value (1) as an index into the what_pid format table
4. Retrieves the associated string (“Trace event 1 logged by
pid %d’%d”) from the what_pid format table
5. Evaluates the NightTrace raw_pid() and lwpid() functions.
(Assume they evaluate to 213 and 1 respectively)
6. Replaces the %d conversion specifiers with the raw_pid() and
lwpid() values
7. Displays “Trace event 1 logged by pid 213’1”
RETURN TYPES
On successful completion, get_format() returns a format table string. Otherwise, it returns an empty string.
For more information on format tables, see “Format Tables” on page 5-17 and the
/usr/lib/NightTrace/tables file. For more examples of function calls with
pre-defined format tables, see Table 8-3.
format()
9
The format() routine displays a string.
SYNTAX
format (“format_string” [, arg] ...)
PARAMETERS
format_string
format_string controls how the optional args are displayed.
format_string is based on the format parameter used in the
printf(3S) routine in C. It is a character string enclosed in
double quotes that contains literal characters and conversion
specifications. The literals are copied as is to the display
object. Conversion specifications modify zero or more args.
arg
arg is an optional expression to be formatted and displayed.
DESCRIPTION
Call the format() function to display a string. You can do this only from the
T h e n - E x p r e s s i o n parameter of a display o bject configuration or the
9-80
Using Expressions
Sum mary-Expression of the Summarize Form. A call to format() must
be the first function call in an expression. You must not nest calls to format().
The following lines provide examples of format() statements and what they display. Assume all variables have a value of 10 (decimal).
format( "Error”)
Error
format( "Event=%d”, id() )
Event=10
format( "Argument is %X”, arg1())
Argument is A
RETURN TYPES
On successful completion, format() returns a string. Otherwise, it returns an
empty string.
Qualified Events
9
A qualified event is a user-defined named event configuration that consists of a set of one
or more trace events, possibly restricted by an If-Expression, CPU List, TID List,
PID List, and Node List. Qualified events provide a mechanism for referencing trace
event configurations within some functions; for example, they cannot appear alone in a
DataBox configuration.
You may use a qualified event in trace event functions. For more information, see “Trace
Event Functions” on page 9-19.
To create a qualified event definition, select the Qualified Events menu item from the
Expr ession s menu (see “Expressions Menu” on page 9-1) to open the Qualifie d
Events Dialog Box (see “Expression Dialog Boxes” on page 9-2 for details on this type
of dialog).
Click the Add button on the Qualified Events Dialog Box, select the qualified event
from the list, and click on the Configure button to pop up a Qualified Event Configuration Form, like the one shown in Figure 9-7.
9-81
NightTrace Manual
Figure 9-7. Qualified Event Configuration Form
The following parameter is specific to the Qualified Event Configuration Form.
QualifiedEvent
The name by which you refer to this qualified event in expressions.
TIP:
Consider giving your trace events upper case names in event-map files and giving any
corresponding qualified event the same name in lower case.
NOTE
The Node List field appears in this dialog only when NightTrace
is configured to use an RCIM to timestamp events. (See “Node
List” on page 8-9 for more information about this field.)
For information about other configuration parameters, see Chapter 8, especially “Common Configuration Parameters” on page 8-1.
Configuring qualified events is similar to configuring DataBox display objects. The
configuration parameters for a qualified event are identical to those that are used to
configure a DataBox display object. See “DataBox” on page 8-13 for information on how
to configure a DataBox.
EXAMPLE
Qualified events can be useful when you are interested in seeing a trace event (or
state) that occurs within a certain amount of time after another trace event. Given
the following qualified event configuration:
9-82
Using Expressions
QualifiedEvent: fire
Event List:
FIRE
CPU List:
2
an EventGraph can be configured to show only BAR trace events that happen within
100 microseconds of a FIRE trace event on CPU 2:
Event List:
BAR
If Expression: time() - time(fire) < 100us
Note: The BAR trace events themselves can happen on any CPU, and as long as they
occur with 100 microseconds of a FIRE trace event on CPU 2, they will be graphed.
Qualified States
9
A qualified state is a user-defined named state configuration that consists of a set of one
or more states, possibly restricted by a Start-Expression, End-Expression, CPU
List, TID List, PID List, and Node List. Qualified states provide a mechanism for referencing state configurations within some functions.
You may use a qualified state in the following predefined functions: start functions, end
functions, and multi-state functions. For more information, see “Start Functions” on page
9-34, “End Functions” on page 9-45, and “Multi-State Functions” on page 9-56.
To create a qualified state definition, select the Qualified States menu item from the
Expr ession s menu (see “Expressions Menu” on page 9-1) to open the Qualifie d
States Dialog Box (see “Expression Dialog Boxes” on page 9-2 for details on this type
of dialog).
Click the Add button on the Qualified States Dialog Box, select the qualified state
from the list, and click on the Configure button to pop up a Qualified State Configuration Form, like the one shown in Figure 9-8.
9-83
NightTrace Manual
Figure 9-8. Qualified State Configuration Form
The following parameter is specific to the Qualified State Configuration Form.
QualifiedState
The name by which you refer to this qualified state in expressions.
NOTE
The Node List field appears in this dialog only when NightTrace
is configured to use an RCIM to timestamp events. (See “Node
List” on page 8-9 for more information about this field.)
For information about other configuration parameters, see Chapter 8, especially “Common Configuration Parameters” on page 8-1 and “StateGraph” on page 8-14.
Configuring qualified states is similar to configuring StateGraph display objects. The
configuration parameters for a qualified state are identical to those that are used to
configure a StateGraph display object. See “StateGraph” on page 8-14 for information on
how to configure a StateGraph.
EXAMPLE
Qualified states can be useful when you are interested in a trace event that occurs
while a certain state is active. The following qualified state:
9-84
Using Expressions
QualifiedState: foo_state
Start Events:
PROG_A_BEGIN
End Events:
PROG_A_EXIT
defines a state that is active whenever program A is running. Assume that another
process is logging FOO trace events asynchronously. If you are interested only in
the FOO trace events that are logged while program A is running, you can define an
EventGraph as follows:
Event List:
FOO
If Expression: state_status(foo_state) == true
This graphs only FOO trace events that occur while the qualified state foo_state
is active. (The “== true” is not necessary.) Thus, you see only FOO trace events
logged while program A is running.
9-85
NightTrace Manual
9-86
10
Using the Built-In Tools
Overview . . . . . . . . . . . . . . . . . . . . . . . . . . . . . . . . . . . . . . . . . . . . . . . . . . . . . . . . . .
Searching for Points of Interest . . . . . . . . . . . . . . . . . . . . . . . . . . . . . . . . . . . . . . . . .
Search Form Radio Buttons . . . . . . . . . . . . . . . . . . . . . . . . . . . . . . . . . . . . . . . .
Search Form Push Buttons . . . . . . . . . . . . . . . . . . . . . . . . . . . . . . . . . . . . . . . . .
Search Form Fields. . . . . . . . . . . . . . . . . . . . . . . . . . . . . . . . . . . . . . . . . . . . . . .
Summarizing Statistical Information . . . . . . . . . . . . . . . . . . . . . . . . . . . . . . . . . . . . .
Summarize Form Radio Buttons . . . . . . . . . . . . . . . . . . . . . . . . . . . . . . . . . . . .
Summarize Form Fields . . . . . . . . . . . . . . . . . . . . . . . . . . . . . . . . . . . . . . . . . . .
Summarize Form Push Buttons . . . . . . . . . . . . . . . . . . . . . . . . . . . . . . . . . . . . .
Menu Bar . . . . . . . . . . . . . . . . . . . . . . . . . . . . . . . . . . . . . . . . . . . . . . . . . . . . . .
File Operations . . . . . . . . . . . . . . . . . . . . . . . . . . . . . . . . . . . . . . . . . . . . . .
Save Text . . . . . . . . . . . . . . . . . . . . . . . . . . . . . . . . . . . . . . . . . . . . . . .
Save Text As ... . . . . . . . . . . . . . . . . . . . . . . . . . . . . . . . . . . . . . . . . . .
Close. . . . . . . . . . . . . . . . . . . . . . . . . . . . . . . . . . . . . . . . . . . . . . . . . . .
Summary Display Area . . . . . . . . . . . . . . . . . . . . . . . . . . . . . . . . . . . . . . . . . . .
Event Summaries . . . . . . . . . . . . . . . . . . . . . . . . . . . . . . . . . . . . . . . . . . . . . . . .
State Summaries . . . . . . . . . . . . . . . . . . . . . . . . . . . . . . . . . . . . . . . . . . . . . . . . .
Exercise: Using the Search Tool . . . . . . . . . . . . . . . . . . . . . . . . . . . . . . . . . . . . . . . .
Exercise: Using the Summarize Tool . . . . . . . . . . . . . . . . . . . . . . . . . . . . . . . . . . . .
10-1
10-1
10-2
10-3
10-4
10-5
10-6
10-6
10-8
10-9
10-9
10-10
10-10
10-10
10-10
10-11
10-12
10-14
10-15
NightTrace Manual
10
Chapter 10Using the Built-In Tools
10
10
10
Overview
10
ntrace comes with a set of built-in tools available in View mode. These tools make it
easier for you to pinpoint important trace events and numerically analyze aspects of your
trace session.
This chapter covers the following built-in tools:
Search
Locates interesting parts of your trace session
Summarize
Summarizes statistics about trace events or states
Figure 10-1 shows the display page menu that gives you access to these tools.
Figure 10-1. Tools Menu
Searching for Points of Interest
10
Clicking on Tools Ì Search ... on the display page allows you to locate areas of interest
in your trace event file(s). When you click on Tools Ì Search ..., the Search Form
appears. This form lets you provide search specifications and define conditions you wish
to find in your trace event file(s).
The Search Form consists of:
• Radio buttons
• Push buttons
• Text fields
Figure 10-2 illustrates the Search Form.
10-1
NightTrace Manual
Figure 10-2. The Search Form
NOTE
The Node List field appears in this dialog only when NightTrace
is configured to use an RCIM to timestamp events.
Search Form Radio Buttons
10
Through the Search Form’s radio buttons, you can choose:
• The direction of a search
• The interval to search
• The effect of a search on the grid and interval control area of a display page
The Search Direction radio buttons let you search forward or backward in your trace
session, relative to the current time.
• Click on the Forward radio button to search through newer trace events.
This is the default setting.
• Click on the Backward radio button to search through older trace events.
Note: This is a much less efficient search than a forward search.
The Search Constra ints radio buttons let you limit your search to the entire trace
session or to the current interval.
10-2
Using the Built-In Tools
• Click on the Global Search radio button to search from the current time
through the end (or beginning) of the trace session. This is the default
setting.
• Click on Interval Search to search only between this interval’s Time
Start and Time End.
The Interval Manipulation radio buttons let you choose the action ntrace takes if a
trace event meets all your criteria. This decision can affect both the grid and the interval
control area.
• Click on Scroll Current Time to Event if you want ntrace to set the
current time to the time when the trace event occurred and move the
interval. This is the default setting.
• Click on Zoom to Include Event to zoom out the interval end time (for
forward searches) or the interval start time (for backward searches) to
include the found trace event. Clicking this radio button also updates the
current time.
• Click on Do Not Move Current Time if you want ntrace to just write
a message to the message display area of the display page without
repositioning you on the grid or in the interval control area; a side-effect of
this setting is that repeatedly clicking on the Search push button does not
find trace events after the first one found. This is because the current time
has not changed.
Search Form Push Buttons
10
Following is a summary of the effects of clicking on the push buttons in the Search
Form:
Apply
(default) Validates any field change(s) on the Search Form.
Clicking on Apply is equivalent to pressing <Enter>.
Reset
Restores changed field(s) on the Search Form to the value(s) they
had after the last Apply or <Enter>. This works only if you have
not already pressed <Enter> or clicked on the Apply push button.
Clicking on Reset is equivalent to pressing <Esc>.
Prev
Goes backward one group of field settings in the search history and
displays those settings in the fields. You may click on this push button multiple times to go backward several groups of settings. Clicking on this push button from the earliest group of settings has no
effect. This push button is useful only after you have clicked on the
Search push button.
Next
Goes forward one group of field settings in the search history and
displays those settings in the fields. You may click on this push button multiple times to go forward several groups of settings. Clicking
on this push button from the most recent group of settings has no
effect. This push button is useful only after you have clicked on the
Search and Prev push buttons.
10-3
NightTrace Manual
Close
Closes the Search Form window and erases all but the last group
of field settings from the search history. That is, if you click on
Close and reopen this window during the same ntrace session,
ntrace displays your most recent field settings; until you save more
field settings, clicking on Prev and Next have no effect.
Search
Performs a search starting at the current time and saves your field
changes, but not your radio button settings.
• Clicking on this push button causes ntrace to
search through your trace event file(s) based on the
criteria from the S ea r ch Fo rm fields and the
radio button settings.
• If you have made a field change, clicking on this
push button makes ntrace temporarily save your
field settings in the search history in memory. By
saving your field settings in the search history,
ntrace gives you an easy way to retrieve groups
of field settings for use in future searches.
Because all fields and radio buttons on the Search Form have default settings, you can
click on the Search push button without modifying anything in this window. The default
search behavior is:
• Search forward through the entire trace session for any trace event from
any process on any CPU.
• If a trace event meets all these criteria, ntrace:
-
Writes an informative message in the message display area of the
display page that tells which ordinal trace event (offset) it found.
-
Sets the current time to the time when the trace event occurred.
Updates the grid and fields in the interval control area of the display
page.
• If no trace event meets all these criteria, ntrace writes an error message
in the message display area of the display page that tells from which
ordinal trace event (offset) it began the search.
Search Form Fields
10
All fields of the Search Form have default values. Because of these defaults, clicking
on Search without making any field changes makes ntrace search for the next (or
previous) trace event in your trace event file(s). If you want to restrict this operation by
trace event ID, trace event tag, CPU number, node, process name or global process identifier (PID), thread name or NightTrace thread identifier, or expression, you can do that by
editing one or more of the fields on the Search Form. You can restore a field to its
default value by entering a single space character or the word default into the field and
clicking Apply or pressing <Enter>.
10-4
Using the Built-In Tools
When you have finished editing the Search Form fields, press <Enter> or click on
Apply. This causes ntrace to validate the data in each field you modified. For general
information on field editing and how ntrace handles editing errors, see “Field Editing”
on page 6-16.
When you are ready for ntrace to do a search, click on the S ea rch push button.
ntrace logical-ORs comma-separated lists of values within a field and logical-ANDs
fields’ values. This means that a trace event must match at least one entry in each list and
all criteria from the fields. If ntrace locates a trace event that meets every field criterion,
it writes an informative message in the message display area on the display page. Depending on your preferences, it may also reposition the interval and current time line. If
ntrace does not locate a trace event that meets every field criterion, it writes an error
message in the message display area on the display page. For more information on the
Search push button, see “Search Form Push Buttons” on page 10-3.
When you make field changes and click on Search, ntrace temporarily saves your
field settings in the search history in memory. You can step through these groups of settings by clicking on the Prev and Next push buttons. Clicking on the Close push button
erases all but the last group of field settings from the search history. For more information
on these push buttons, see “Search Form Push Buttons” on page 10-3.
See Chapter 8 for a definition of each field, all its possible values, and its default value.
There is only one difference between the ntrace behavior described there and the
behavior of the Search Form: on the Search Form ntrace searches for, but does not
display, data that meets the criteria. The search stops when ntrace finds a suitable value
or runs out of trace events.
The No Event List field is the only field that is unique to the Search Form. This field
lets you decide which trace event(s) to ignore in a search. The possible values are the
same as those in the Event List field. It is not meaningful to put the same value in the
Event List and in the No Event List.
NOTE
The Node List field appears in this dialog only when NightTrace
is configured to use an RCIM to timestamp events.
Summarizing Statistical Information
10
Clicking on Tools Ì Summarize ... on the display page lets you get statistical information about trace events and states. When you click on Tools Ì Summarize ..., the
S u m m a r iz e Fo r m appears. This form lets you constrain the information to be
summarized.
The Summarize Form consists of:
• Radio buttons
• Text fields
• Summary display area
10-5
NightTrace Manual
• Push buttons
• Menu items
Fig ure 10-4 an d Fig ure 10-5 sho w tw o S u m m a r i z e F o r m s with different
configurations.
Summarize Form Radio Buttons
10
Through the Summarize Form’s radio buttons, you can choose:
• Whether to summarize trace events or states
• The interval to summarize
The Summary Type radio buttons let you specify the type of information you want
summarized.
• Click on the Event radio button to summarize trace event information.
This is the default setting.
• Click on the State radio button to summarize state information.
The Summary Range radio buttons let you limit the summary to the current interval, to
the time between a mark and the current time, or to the entire trace session.
• Click on the Trace Event File radio button to summarize data throughout the trace session. This is the default setting.
• Click on Region to summarize data only between the mark and the
current time.
• Click on Interval to summarize data only between the current interval’s
Time Start and Time End.
Summarize Form Fields
10
All fields of the Summarize Form have default values. Because of these defaults,
clicking on Su mma riz e without making any field or radio button changes makes
ntrace summarize all trace events in your trace event file(s). If you want to restrict the
summary by trace event ID, trace event tag, CPU number, node, process name or global
process identifier, thread name or NightTrace thread identifier, or expression, you can do
that by editing one or more of the fields on the Summarize Form.
When you have finished editing the Summarize Form fields, press <Enter> or click
on A pply. This causes ntrace to validate the data in each field you modified. For
general information on field editing and how ntrace handles editing errors, see “Field
Editing” on page 6-16.
When you are ready for ntrace to summarize data, click on the Su mmarize push
button. ntrace logical-ORs comma-separated lists of values within a field and
logical-ANDs fields’ values. This means that a summary object must match at least one
10-6
Using the Built-In Tools
entry in each list and all criteria from the fields. Every time you click on Summarize,
ntrace writes lines of statistics in the summary display area. For more information on
the Summarize push button, see “Summarize Form Push Buttons” on page 10-8.
The text fields on the Su mmarize Form differ depending on the selected summary
type. See Chapter 8 for a definition of each field (except those described below) and all its
possible values. There is only one difference between the ntrace behavior described
there and the behavior of the Summarize Form: on the Summarize Form, ntrace
textually summarizes all data, rather than displaying individual values that meet the
criteria.
The following text describes fields specific to the Summarize Form, their possible and
default values, and how the Summarize push button behaves when you modify that
field.
Filter-Expression
This text field has all the characteristics of If-Expres sion,
except it is evaluated only if the If-Expression (for trace
event summaries) or End-Expression (for state summaries) are true. Values may be: a boolean ntrace expression, the word TRUE, or the word FALSE. The default is
TRUE. When you click on Summarize, ntrace evaluates
the expression for every trace event it summarizes. A
FALSE in this field essentially disables the summary.
Summary-Expression
This text field is evaluated every time the If-Expression
or E n d - E x p r e s s i o n and F i l t e r - E x p r e s s i o n
configuration criteria for your summary are met. It lets you
specify the format of the summary text. Values may be: a
call to the format() or get_format() function.
The default is a get_format(event_summary) call
for trace event summaries. For state summaries, the default
is a get_format(state_summary) call. For more
information about these format tables, see “Pre-Defined
Format Tables” on page 5-20.
For example, if you wanted to limit your summary to trace events with a first argument
value between 5 and 100, your If-Expression would look something like:
arg1() > 5 && arg1() < 100
If you wa nted to dete rmine the la rge st of these a rgume nt values, your
Sum mary-Expression would look something like:
max( arg1() )
In another example, the following configuration:
Event List:100
If Expression:TRUE
Summary Expression:min( arg1() )
prints out the minimum value of the first argument of every trace event logged with a trace
event ID of 100. To find the offset where this minimum occurred, set:
Summary Expression:min_offset( arg1() )
10-7
NightTrace Manual
If you want both statistics, use the following:
Summary Expression:format( "min %d at %d",
min(arg1()), min_offset(arg1()) )
TIP:
If you are interested in many statistics or if you are going to reuse this summary format at
a later date, consider defining and using a format table. For example,
Summary Expression: get_format( my_table )
The lack of a second parameter indicates that the only entry in format table my_table is
the default item line. The pre-defined event_arg_summary format table has four
formats defined in it. Format 1 produces summary data on arg1, format 2 does the same
for arg2, etc.
For more information about format tables, see “Format Tables” on page 5-17 and the end
of /usr/lib/NightTrace/tables.
TIP:
The min_offset() and max_offset() functions return the offset of the first trace
event where the expression minimum or maximum was seen. Thus, if the same minimum
or maximum was seen more than once, the offset corresponds to the first one seen.
TIP:
Including min_offset(), max_offset(), min(), or max() in your summary text
tells you the inc lusive range of matches that you summa rized, a nd the
summary_matches() function tells the number of matches that you summarized.
TIP:
Sometimes there are anomalies in the trace information logged by an application, such as
an unusually long state duration during program start up; this can throw off the duration
statisti cs wh en an aly zing “ty pica l” pr og ram per fo rman ce. You c an u se the
Start-Expression for state summaries and the If-Expression for event summaries to
limit the range of trace events summarized and remove extraneous trace events from the
statistics produced.
See Chapter 8 for information about configuration parameters. See Chapter 9 for
information on ntrace expressions. For more information on the Summarize push button, see “Summarize Form Push Buttons” on page 10-8.
Summarize Form Push Buttons
10
Following is a summary of the effects of clicking on the push buttons in the Summarize
Form:
10-8
Apply
(default) Validates any field change(s) on the Summarize Form.
Clicking on Apply is equivalent to pressing <Enter>.
Reset
Restores changed field(s) on the Summarize Form to the value(s)
they had after the last Apply or <Enter>. This works only if you
Using the Built-In Tools
have not already pressed <Enter> or clicked on the Apply push
button. Clicking on Reset is equivalent to pressing <Esc>.
Restore
Restores changed field(s) on the Summarize Form to the original
value(s) they had when you brought up the form.
Clear
Erases all text in the summary display area.
Summarize
Saves your field changes and summarizes the requested data.
• If you have made a field change, clicking on this push
button makes ntrace temporarily save your field
settings.
• Clicking on this push button causes ntrace to summarize summary data from your trace event file(s)
based on the criteria from the Summarize Form
fields and the radio button settings.
Because all fields and radio buttons on the Summarize Form have default settings, you
can click on the Summarize push button without modifying anything in this window.
The default summarize behavior is:
• ntrace writes statistical messages in the summary display area that tell
about trace event data through the entire trace session for any trace event
from any process on any CPU.
If you have configured the Su mmarize Form by specifying additional criteria, the
summarize behavior is:
• If a trace event or state meets all these criteria, ntrace writes statistical
messages in the summary display area that tell: the trace events or states
involved, and minimum, maximum, average, and total for intervals and/or
trace event arguments.
• If no trace event or state meets all these criteria, ntrace writes a message
in the summary display area that says that there are no trace event or state
matches to summarize.
Menu Bar
10
The menu bar of the Summarize Form consists of the following menu item:
• File
File Operations
10
When you click on the File menu item on the Summarize Form, the pull-down menu
shown in Figure 10-3 appears.
10-9
NightTrace Manual
Figure 10-3. Summarize Form File Menu
Save Text
10
When you click on File Ì Save Text on the Summarize Form, ntrace saves your
summary text to the file you saved to last time. Any changes you have made since the last
Save Text or Save Text As ... operation will be saved. You can continue running
summaries after this operation. The Save Text operation is disabled (dimmed) if you
have not both done a Save Text As ... and changed the summary display. Instead, use
Save Text As ...
Save Text As ...
10
When you click on File Ì Save Text As ... on the Summarize Form, ntrace saves
your summary text to the specified file. You can continue running summaries after this
operation.
Save Text As ... uses a File Selection Dialog Box to prompt you for a file name.
See “The File Selection Dialog Box” on page 5-33 for more information.
Close
10
When you click on File Ì Close on the Summarize Form, ntrace ends the current
summary session, resets all field and radio button settings, and clears the summary display
area. It does not prompt you to save your summary text since the last time you did a Save
Text or Save Text As .... Therefore, if you have made any changes to the summary
display area that you want to keep, you must perform a Save Text or Save Text As ...
before you do a Close.
Summary Display Area
10
After you click on Summarize, ntrace appends statistics to the end of the scrolling
summary display area. It automatically scrolls this area so the newest statistics are visible.
Every line in this area has a unique number. A blank line separates sets of statistics. If you
want new statistics to appear alone in the summary display area, click on Clear before
you click on Summarize. See “Summarize Form Push Buttons” on page 10-8 for more
information.
By default, ntrace displays 14 lines in the summary display area. You can alter this
number by changing the size of the Summarize Form. To change the Summarize
10-10
Using the Built-In Tools
Form size, vertically resize your window by using features of your window manager. It is
not necessary to resize a window to see lines 15 and higher; you can scroll through all
lines by using the scroll bar. Sometimes the statistical information exceeds the width of
the summary display area. In this case, you must horizontally resize your window.
The summary display area of the Summa rize Form presents different information
depending on your Summary-Expression and whether your summary type is Event
or State.
Event Summaries
10
Configuring event summaries is similar to configuring DataBox display objects. The
configuration parameters for an event summary are identical to those that are used to
configure a DataBox display object. See “DataBox” on page 8-13 for information on how
to configure a DataBox.
By default, the Summary-Expression for an event summary type, displays one line for
each of the following in the summary display area:
• The range of ordinal trace event numbers (offsets) summarized
• The number of matches summarized
• The minimum time gap between matches and the ordinal trace event
number (offset) where it began
• The maximum time gap between matches and the ordinal trace event
number (offset) where it began
• The average time gap between matches
Figure 10-4 shows an event summary.
10-11
NightTrace Manual
Figure 10-4. The Event Summarize Form
NOTE
The Node List field appears in this dialog only when NightTrace
is configured to use an RCIM to timestamp events.
State Summaries
10
Configuring state summaries is similar to configuring StateGraph display objects. The
configuration parameters for a state summary are identical to those that are used to
configure a StateGraph display object. See “StateGraph” on page 8-14 for information on
how to configure a StateGraph.
The main difference between a state summary and a StateGraph is that a state summary
shows information textually and a StateGraph shows it graphically.
By default, the Summary-Expression for a state summary type, displays one line for
each of the following in the summary display area:
10-12
Using the Built-In Tools
• The range of ordinal trace event numbers (offsets) summarized
• The number of matches summarized
• The minimum time gap between matches and the ordinal trace event
number (offset) where it began
• The maximum time gap between matches and the ordinal trace event
number (offset) where it began
• The average time gap between matches
• The sum of the time gaps between matches
• The minimum time duration of a match and the ordinal trace event number
(offset) where it began
• The maximum time duration of a match and the ordinal trace event number
(offset) where it began
• The average time duration of a match
• The sum of the time durations of matches
Figure 10-5 shows a state summary.
10-13
NightTrace Manual
Figure 10-5. The State Summarize Form
NOTE
The Node List field appears in this dialog only when NightTrace
is configured to use an RCIM to timestamp events.
Exercise: Using the Search Tool
10
The following exercise has you search for trace events you logged in “Exercise: Logging
Trace Events” on page 4-29, while using files you created in “Exercise: Displaying Trace
Events” on page 5-35.
Invoke the NightTrace display utility with the log trace event file, the map event-map
file, and the page configuration file.
$ ntrace log map page
10-14
Using the Built-In Tools
After the display page appears, press the Refresh push button at the bottom right of the
page. The current time line should now be positioned inside the first visible state. What is
the tag of the current trace event?
NAP START
Now, bring up the Search tool by clicking on Tools Ì Search ...
Use the default settings to search globally forward for all trace events and make the
interval scroll the current time to the trace event. After one search, what is the tag of the
current trace event?
NAP_END
Keep searching forward until you reach the end of the trace. You should continue to see
alternating NAP_START and NAP_END trace event tags.
Close the Search Form by clicking on the Close push button.
Exercise: Using the Summarize Tool
10
The following exercise has you summarize trace events you logged in “Exercise: Logging
Trace Events” on page 4-29.
While still in ntrace, bring up the Summarize tool by clicking on Tools Ì Summa rize
...
Press the Summarize button for the default event summary.
How many matches were summarized?
22
At which offset does the largest gap occur?
2
How large is this gap?
about 1.8 seconds
Close the Summarize Form by clicking on File Ì Close.
10-15
NightTrace Manual
10-16
11
Tracing the Kernel
Overview . . . . . . . . . . . . . . . . . . . . . . . . . . . . . . . . . . . . . . . . . . . . . . . . . . . . . . . . . .
Default Kernel Trace Points . . . . . . . . . . . . . . . . . . . . . . . . . . . . . . . . . . . . . . . . . . .
Context Switch Trace Event . . . . . . . . . . . . . . . . . . . . . . . . . . . . . . . . . . . . . . . .
Interrupt Trace Events . . . . . . . . . . . . . . . . . . . . . . . . . . . . . . . . . . . . . . . . . . . .
Exception Trace Events . . . . . . . . . . . . . . . . . . . . . . . . . . . . . . . . . . . . . . . . . . .
Syscall Trace Events. . . . . . . . . . . . . . . . . . . . . . . . . . . . . . . . . . . . . . . . . . . . . .
Kernel Trace Points Not Enabled By Default . . . . . . . . . . . . . . . . . . . . . . . . . . . . . .
Page Fault Event. . . . . . . . . . . . . . . . . . . . . . . . . . . . . . . . . . . . . . . . . . . . . . . . .
Protection Fault Event . . . . . . . . . . . . . . . . . . . . . . . . . . . . . . . . . . . . . . . . . . . .
Viewing Kernel Trace Event Files. . . . . . . . . . . . . . . . . . . . . . . . . . . . . . . . . . . . . . .
Kernel Display Pages . . . . . . . . . . . . . . . . . . . . . . . . . . . . . . . . . . . . . . . . . . . . .
RCIM Default Kernel Display Page . . . . . . . . . . . . . . . . . . . . . . . . . . . . . .
CPU Information . . . . . . . . . . . . . . . . . . . . . . . . . . . . . . . . . . . . . . . . . . . . .
Running Process Information . . . . . . . . . . . . . . . . . . . . . . . . . . . . . . . . . . .
Node Information . . . . . . . . . . . . . . . . . . . . . . . . . . . . . . . . . . . . . . . . . . . .
Context Switch Information . . . . . . . . . . . . . . . . . . . . . . . . . . . . . . . . . . . .
Interrupt Information. . . . . . . . . . . . . . . . . . . . . . . . . . . . . . . . . . . . . . . . . .
Exception Information. . . . . . . . . . . . . . . . . . . . . . . . . . . . . . . . . . . . . . . . .
Syscall Information . . . . . . . . . . . . . . . . . . . . . . . . . . . . . . . . . . . . . . . . . . .
Color Information . . . . . . . . . . . . . . . . . . . . . . . . . . . . . . . . . . . . . . . . . . . .
Kernel String Tables . . . . . . . . . . . . . . . . . . . . . . . . . . . . . . . . . . . . . . . . . . . . . .
Kernel Reference . . . . . . . . . . . . . . . . . . . . . . . . . . . . . . . . . . . . . . . . . . . . . . . . . . . .
Interrupts. . . . . . . . . . . . . . . . . . . . . . . . . . . . . . . . . . . . . . . . . . . . . . . . . . . . . . .
Non-Device-Related Interrupts . . . . . . . . . . . . . . . . . . . . . . . . . . . . . . . . . .
Device-Related Interrupts . . . . . . . . . . . . . . . . . . . . . . . . . . . . . . . . . . . . . .
Exceptions . . . . . . . . . . . . . . . . . . . . . . . . . . . . . . . . . . . . . . . . . . . . . . . . . . . . .
Syscalls . . . . . . . . . . . . . . . . . . . . . . . . . . . . . . . . . . . . . . . . . . . . . . . . . . . . . . . .
11-1
11-1
11-2
11-2
11-3
11-4
11-5
11-5
11-5
11-6
11-6
11-7
11-9
11-10
11-11
11-11
11-12
11-13
11-15
11-16
11-16
11-18
11-19
11-19
11-20
11-20
11-21
NightTrace Manual
11
Chapter 11Tracing the Kernel
11
11
11
Overview
11
This chapter provides a description of the trace points logged by the kernel. It also
discusses the steps required to produce a highly detailed picture of kernel activity with
NightTrace. This lets you customize the default ntrace kernel display pages or combine
kernel information with user-application trace information.
Kernel trace event files are logged in raw format by the kernel trace daemon. ntrace
accepts files of this type as arguments. When it detects such a file on the command line,
or when the session manager indicates such a file should be displayed, it automatically filters the raw data file and creates two new files. The first file created is the filtered data,
which contains trace events in a manner suitable for display within NightTrace. This file
is saved with a pathname constructed from the original raw kernel trace event filename
with a “.ntf” suffix appended to it. The second file saved is commonly referred to as
the “vectors” file. It contains tables that are specific to the actual raw data. The “vectors”
file is saved with a pathname constructed from the orignal raw kernel trace event filename
with a “.vec” suffix appended to it. A more detailed description of the vectors file is
given subsequently in this chapter.
On subsequent invocations of ntrace, either the raw kernel file may be specified, or,
alternatively, the “.ntf” and “.vec” files may be specified together.
Default Kernel Trace Points
11
The following kernel trace points are enabled by default:
• TR_SWITCHIN
• TR_INTERRUPT_ENTRY and TR_INTERRUPT_EXIT
• TR_EXCEPTION_ENTRY and TR_EXCEPTION_EXIT
• TR_SYSCALL_ENTRY
• TR_IO_VNODE
• TR_ALT_INT_DISPATCH
• TR_PROCESS_NAME
These default kernel trace points are required to get meaningful kernel performance data
in a KernelTrace trace event file. However, these trace points are not the only trace points
11-1
NightTrace Manual
that you will see with ntrace when viewing kernel data. Specifically, the following trace
points are introduced during raw kernel trace data processing by ntrace:
• TR_SYSCALL_EXIT
• TR_SYSCALL_SUSPEND and TR_SYSCALL_RESUME
• TR_EXCEPTION_SUSPEND and TR_EXCEPTION_RESUME
The following sections discuss the trace events that you will see in ntrace as a result of
logging the default kernel trace points.
Context Switch Trace Event
11
There is only one context switch trace event:
TR_SWITCHIN arg1
This trace event is logged whenever a process has been switched in and is ready to
be run on a specific CPU. Because only one process can run on a given CPU at a
time, this trace event also signifies that the process that was running on the CPU
immediately prior to the context switch trace event has been switched out and can
no longer run. This trace event has one argument:
arg1
The numeric 32-bit global process identifier (PID) of the process
being switched in. This information is redundant, since it is identical
to the PID that is already associated with the trace event. A PID of 0
indicates that the CPU is idle.
The 32-bit global process identifier uniquely identifies the running
process on the system. This identifier is identical to the return value
of the _lwp_global_self() system call for PowerMAX OS and
the getpid() system call under RedHawk Linux. See “pid()” on page
9-22.
Interrupt Trace Events
11
There are two trace events associated with interrupts:
TR_INTERRUPT_ENTRY arg1 arg2 arg3
This trace event is logged whenever an interrupt is entered. It has three arguments:
11-2
arg1
The interrupt vector number that indicates the type of interrupt. This
is an index into the vector string table that is contained within the
vectors file generated by NightTrace when consuming kernel data.
For more information about the vector string table, see “Kernel
String Tables” on page 11-16.
arg2
The interrupt nesting level used by the pre-defined kernel pages to
graph the different heights associated with the nesting level. This
Tracing the Kernel
argument will be 1 for the first interrupt, 2 for a second interrupt that
interrupted the first interrupt, 3 for a third interrupt that interrupted
the second interrupt, etc.
arg3
The interrupt vector number of the previous interrupt that this interrupt entry is interrupting, if any.
TR_INTERRUPT_EXIT arg1 arg2 arg3
This trace event is logged whenever an interrupt is exited. Its arguments are identical to those of the TR_INTERRUPT_ENTRY trace event.
Exception Trace Events
11
There are four trace events associated with exceptions:
TR_EXCEPTION_ENTRY arg1
This trace event is logged whenever an exception is entered. It has one argument:
arg1
The exception vector number that indicates the type of exception.
This is an index into the vector string table that is contained within
the vectors file. For more information about the vector string table,
see “Kernel String Tables” on page 11-16.
TR_EXCEPTION_SUSPEND arg1
This trace event is logged whenever an exception is suspended by a context switch.
It ha s on e arg ume nt tha t is ide nti cal to th e arg umen t l og ge d w it h t he
TR_EXCEPTION_ENTRY trace event.
TR_EXCEPTION_RESUME arg1
This trace event is logged whenever an exception is resumed (i.e., the process that
caused the exception to occur, which was switched out before the exception could
be completed, is switched back in). A TR_EXCEPTION_RESUME trace event will
always follow a TR_EXCEPTION_SUSPEND event, unless the process is being
switched in for the first time since kernel tracing began.
It is possible for several TR_EXCEPTION_SUSPEND—TR_EXCEPTION_RESUME
trace event pairs to occur if the process is switched in and out several times before
the exception completes.
The TR_EXCEPTION_RESUME trace event has one argument that is identical to the
argument logged with the TR_EXCEPTION_ENTRY trace event.
TR_EXCEPTION_EXIT arg1
This trace event is logged whenever an exception is completed. It has one argument
that is identical to the argument that is logged with the TR_EXCEPTION_ENTRY
trace event.
11-3
NightTrace Manual
Syscall Trace Events
11
There are four trace events associated with syscalls:
TR_SYSCALL_ENTRY arg1 arg2 arg3
This trace event is logged whenever a syscall is entered. It has three arguments:
arg1
This argument is always zero for historical reasons.
arg2
The syscall number that identifies the syscall. This is an index into
the pre-defined syscall string table.
arg3
The device number that indicates the type of device that is associated
with the syscall, if any. This is an index into the pre-defined device
string table.
For more information about the pre-defined syscall and device string tables,
see “Kernel String Tables” on page 11-16.
TR_SYSCALL_SUSPEND arg1 arg2 arg3
This trace event is logged whenever a syscall is suspended by a context switch. It
has three arguments that are identical to the arguments logged with the
TR_SYSCALL_ENTRY trace event.
TR_SYSCALL_RESUME arg1 arg2 arg3
This trace event is logged whenever a syscall is resumed (i.e., the process that
caused the syscall to occur, which was switched out before the syscall could be
completed, is switched back in). A TR_SYSCALL_RESUME trace event will always
follow a TR_SYSCALL_SUSPEND trace event, unless the process is being switched
in for the first time since kernel tracing began.
It is possible for several TR_SYSCALL_SUSPEND—TR_SYSCALL_RESUME trace
event pairs to occur if the process is switched in and out several times before the
syscall completes.
The TR_SYSCALL_RESUME trace event has three arguments that are identical to
the arguments logged with the TR_SYSCALL_ENTRY trace event. However, if a
TR_SYSCALL_RESUME trace event does not follow a TR_SYSCALL_SUSPEND
trace event (i.e., it is the first syscall trace event logged by the process since kernel
tracing began) arg2 identifies the syscall as “can’t determine.”
TR_SYSCALL_EXIT arg1 arg2 arg3
This trace event is logged whenever a syscall is completed. It has three arguments
that are identical to the arguments logged with the TR_SYSCALL_ENTRY trace
event.
11-4
Tracing the Kernel
Kernel Trace Points Not Enabled By Default
11
There are several kernel trace points which are not enabled by default but two of them
deserve special mention. These two events allow you to determine areas in your application code where address faults are occurring, to minimize such faults, and thus improve
the application's performance. The following sections discuss the page fault and protection fault kernel trace points.
Page Fault Event
11
There is one page fault trace event:
TR_PAGEFLT_ADDR arg1 arg2 arg3
This trace event is logged whenever a kernel or user page fault occurs. The page fault can
be either on a data address or on an instruction address. This trace event is not enabled by
default because, depending upon system activity, page faults may occur reasonably frequently. This trace event has three arguments:
arg1
The data address which caused the page fault. If the page fault
occurred on an instruction, this will be set to zero.
arg2
The program counter value at the time of the page fault.
arg3
The flag indicating whether the fault occurred on a kernel address or
on a user address. A value of zero indicates that the fault occurred on
a user address. A value of one indicates that the fault occurred on a
kernel address.
Protection Fault Event
11
There is one protection fault trace event:
TR_PROTFLT_ADDR arg1 arg2 arg3
This trace event is logged whenever a kernel or user protection fault occurs. The protection fault can be either on a data address or on an instruction address. This trace event is
not enabled by default because, depending upon system activity, protection faults may
occur reasonably frequently. This trace event has three arguments:
arg1
The data address which caused the protection fault. If the protection
fault occurred on an instruction, then this will be set to zero.
arg2
The program counter value at the time of the protection fault.
arg3
The flag indicating whether the fault occurred on a kernel address or
on a user address. A value of zero indicates that the fault occurred on
11-5
NightTrace Manual
a user address. A value of one indicates that the fault occurred on a
kernel address.
Viewing Kernel Trace Event Files
11
All of the kernel trace event tags are defined in the
/usr/lib/NightTrace/eventmap file. This file is automatically read by ntrace
at start-up time.
You may design your own display pages to view kernel trace event files; see Chapter 7 and
Chapter 8 for more information. Alternatively, you may use pre-defined kernel display
pages. These pages are discussed in the following sections.
Kernel Display Pages
11
Figure 11-1 shows the File menu of the ntrace Global Window. This menu contains a
Default Kernel Page menu item which is used to open a dynamically-built kernel display page. The Default Kernel Page menu item is enabled only if a converted KernelTrace trace event file has been supplied to ntrace on the command line.
Figure 11-1. Global Window File Menu
Figure 11-2 shows a sample kernel display page in View mode constructed from trace files
on two different nodes.
NOTE
The node information is displayed only when NightTrace is configured to use an RCIM to timestamp events.
11-6
Tracing the Kernel
Figure 11-2. Sample Kernel Display Page
ntrace determines the number of CPUs on the system from information in the converted
KernelTrace trace event file.
RCIM Default Kernel Display Page
11
When viewing KernelTrace trace event files that have been timestamped by the RCIM tick
clock, ntrace determines the number of distinct nodes/hosts which have trace files and
constructs a default display page accordingly. When you create a default kernel display
page from trace event files that have been timestamped by the RCIM tick clock, ntrace
pops up a dialog box that allows you to select the nodes you wish to display on that kernel
page.
11-7
NightTrace Manual
Figure 11-3. Node Selection Dialog
The Available Nodes list shows all nodes that NightTrace has found in the trace files.
The Selected Nodes list contains all nodes you want shown on the kernel display page
you are building.
NOTE
An asterisk (*) next to a node in the Available Nodes list indicates that the particular node has already been selected through
the Node Selection Dialog.
You may select the nodes you wish to be included on the kernel display page you are
building by either double-clicking each node name in the Available Nodes list or by
selecting a node from that list and using the right arrow button to add it to the list of
Selected Nodes. When the list of Selected Nodes contains all the nodes you wish
to display on your kernel display page, you may press the Build button.
As each node is added to the list of Selected Nodes, ntrace figures out how much
vertical real estate the grid needs (based upon the number of nodes you wish to display
and how many CPUs each node has). If the required vertical space does not exceed the
maximum grid height, ntrace will allow the page to be created. Otherwise, ntrace
will pop up a warning dialog window and will not allow the page to be created.
11-8
Tracing the Kernel
Figure 11-4. Node Selection Warning Dialog
Figure 11-5 shows the display of information for a CPU on a particular node on a dynamically-built kernel page.
NOTE
The node information is displayed only when NightTrace is configured to use an RCIM to timestamp events.
Figure 11-5. Per-CPU Information
There are several pieces of information being displayed for each CPU. The position of the
current time line determines the values that appear on the kernel display pages. Moving
the current time line within the current interval does not change the graphical displays.
However, the textual displays always reflect the last values prior to the current time line.
The following sections discuss all of the different pieces of information in detail.
CPU Information
11
Figure 11-6. CPU Box
11-9
NightTrace Manual
Figure 11-6 shows a CPU box. The CPU box simply identifies which logical CPU the
displayed data corresponds to. Logical CPU numbers are related to, but not necessarily
identical to, physical CPU numbers.
Each CPU in a system has a four-bit physical CPU number. The physical CPU number is
dependent on which card slot the CPU card containing the CPU is in and which location
on the card the CPU is in. The low two bits of the number specify the location on the card
that the CPU is in. These bits are either 00 for the first CPU location or 01 for the second.
The high two bits of the physical CPU number contain the CPU card slot number. These
bits can be 00, 01, 10, or 11 (or, in decimal, 0, 1, 2, or 3).
For simplicity, most kernel utilities translate the physical CPU numbers into logical CPU
numbers. The mapping is accomplished by listing the physical CPU numbers of all
configured CPUs in ascending order and then numbering them sequentially, starting with
zero. For example, a four-CPU system having two CPUs on a card in slot 1 and two CPUs
on a card in slot 3 will have physical CPU numbers 4 (0100), 5 (0101), 12 (1100) and 13
(1101). Table 11-1 shows the logical CPU mapping of this example system.
Table 11-1. Example Logical CPU Mapping
Physical CPU Number
Logical CPU Number
4 (0100)
0
5 (0101)
1
12 (1100)
2
13 (1101)
3
The CPU box is a GridLabel display object. See Chapter 7 and Chapter 8 for more information on creating and configuring GridLabels.
Running Process Information
11
Figure 11-7. Running Process Boxes
Figure 11-7 shows two examples of running process boxes. The running process box
shows the process that is executing at the current time on the associated CPU. The process
is listed by name, or by its raw PID and LWPID if no name is available. See “PID List” on
page 8-7 for more information about PIDs, raw PIDs and LWPIDs.
You can supply NightTrace trace event files to ntrace along with converted KernelTrace
trace event files. ntrace uses the process names of all processes that logged trace events
when displaying the running process.
The running process box is a DataBox display object. See Chapter 7 and Chapter 8 for
more information on creating and configuring DataBoxes.
11-10
Tracing the Kernel
Node Information
11
Figure 11-8. Node Box
Figure 11-7 shows a node box. The node box simply identifies which node the displayed
data corresponds to.
NOTE
The node information is displayed only when NightTrace is configured to use an RCIM to timestamp events.
The node box is a GridLabel display object. See Chapter 7 and Chapter 8 for more information on creating and configuring GridLabels.
Context Switch Information
11
Figure 11-9. Context Switch Lines
Figure 11-9 shows an example of several context switch lines. Context switch lines are
superimposed on the exception and syscall graphs. They indicate that the kernel has
switched out the process that was previously running on the CPU and switched in a new
process. There is a direct correlation between context switch lines and the running process
box: the running process box shows the process associated with the context switch line
that immediately precedes the current time line.
11-11
NightTrace Manual
Interrupt Information
11
Figure 11-10. Last Interrupt Box and Interrupt Graph
Figure 11-10 shows a last interrupt box and an interrupt graph. The interrupt graph displays a state that is drawn whenever an interrupt is executing on the associated CPU. Interrupts can be interrupted while executing, and the interrupt graph shows this interrupt nesting by increasing the height of the state bar. Although interrupts can nest, all interrupts
must complete before the process they interrupt can be switched out. Therefore, you will
never see a context switch occur in the middle of an interrupt.
The last interrupt box displays the name of the last interrupt prior to the current time line
that executed (and may still be executing) on the associated CPU. It can be used with the
interrupt graph to identify any interrupts that are currently visible on the graph. Simply
move the current time line onto a graphed interrupt, and the last interrupt box will update
to display the name of the interrupt.
Because the last interrupt box displays the name of the last interrupt that executed, it is
possible for there to be no interrupts visible on the interrupt graph even though the last
interrupt box contains a valid interrupt name. This just signifies that the last interrupt on
the CPU ended prior to the beginning of the current interval.
An interrupt that is seen very often is the hardclock interrupt, which usually accounts for
15% of the total number of trace events logged by the kernel. If you are not interested in
hardclock interrupts, they can be ignored by ntrace, improving performance and
readability. See “ntrace Options” on page 5-3 for more information.
The last interrupt box is a DataBox display object, and the last interrupt graph is a DataGraph display object. See Chapter 7 and Chapter 8 for more information on creating and
configuring DataBoxes and DataGraphs.
11-12
Tracing the Kernel
Exception Information
11
Figure 11-11. Last Exception Box and Exception Graph
Figure 11-11 shows a last exception box and an exception graph. The exception graph
displays a state that is drawn whenever an exception is executing on the associated CPU.
Unlike interrupts, exceptions cannot nest, so they are always graphed with the same
height.
Context switch lines are superimposed on exception graphs. It is common to see a context
switch line at what looks like the very end (or beginning) of an exception. Usually, this
does not indicate that the exception has ended, only that it has been suspended because the
process that originated the exception has switched out. The exception resumes when the
process is switched back in again. An example of an exception being suspended and
resumed can be seen at the left end of the exception graph in Figure 11-11.
The last exception box displays the last exception prior to the current time line that
executed (and may still be executing) on the associated CPU. It can be used with the
exception graph to identify any exceptions that are currently visible on the graph. Simply
move the current time line onto a graphed exception, and the last exception box will
update to display the name of the exception.
Because the last exception box displays the name of the last exception that executed, it is
possible for there to be no exceptions visible on the exception graph even though the last
exception box contains a valid exception name. This just signifies that the last exception
on the CPU ended prior to the beginning of the current interval.
The last exception box is a DataBox display object, and the last exception graph is a StateGraph display object. See Chapter 7 and Chapter 8 for more information on creating and
configuring DataBoxes and StateGraphs.
Lines indicating TR_PAGEFLT_ADDR and TR_PROTFLT_ADDR events are also superimposed on exception graphs. Exception graphs display these trace points to allow you to
obtain a formatted dump of them in the message display area by clicking on the events
with mouse button 2. An example of a TR_PAGEFLT_ADDR and a TR_PROTFLT_ADDR
event as well as their associated data in the message display area can be seen in
Figure 11-12.
11-13
NightTrace Manual
Figure 11-12. TR_PAGEFLT_ADDR and TR_PROTFLT_ADDR Events
Note the TR_PROTFLT_ADDR event to the left of the current time line at time=9.459738
and the TR_PAGEFLT_ADDR event to the right of the current time line at time=9.460050
and the corresponding data in the message display area. (See “The Display Page” on page
7-2 for more information on the message display area and other elements of the display
page.)
Note also that the TR_PROTFLT_ADDR and TR_PAGEFLT_ADDR events are represented
by a vertical line that only intersects the exception state graph whereas a TR_SWITCHIN
event (see “Context Switch Trace Event” on page 11-2) intersects both the exception and
syscall state graphs. In addition, TR_PROTFLT_ADDR and TR_PAGEFLT_ADDR events
will only appear within a currently executing exception. This can be seen in Figure 11-13.
11-14
Tracing the Kernel
Figure 11-13. TR_SWITCHIN vs. TR_PAGEFLT_ADDR and TR_PROTFLT_ADDR Events
Syscall Information
11
Figure 11-14. Last Syscall Box and Syscall Graph
Figure 11-14 shows a last syscall box and a syscall graph. The syscall graph displays a
state that is drawn whenever a system call (syscall) is executing on the associated CPU.
Unlike interrupts, syscalls cannot nest, so they are always graphed with the same height.
Context switch lines are superimposed on syscall graphs. It is common to see a context
switch line at what looks like the very end (or beginning) of a syscall. Usually, this does
not indicate that the syscall has ended, only that it has been suspended because the process
that originated the syscall has switched out. The syscall resumes when the process is
switched back in again. An example of a syscall being suspended and resumed can be seen
at the right end of the syscall graph in Figure 11-14.
The last syscall box displays the last syscall prior to the current time line that executed
(and may still be executing) on the associated CPU. If the syscall is associated with a
device, the name of the device is shown after the name of the syscall.
11-15
NightTrace Manual
The last syscall box can be used with the syscall graph to identify any syscalls that are
currently visible on the graph. Simply move the current time line onto a graphed syscall,
and the last syscall box will update to display the name of the syscall.
Because the last syscall box displays the name of the last syscall that executed, it is
possible for there to be no syscalls visible on the syscall graph even though the last syscall
box contains a valid syscall name. This just signifies that the last syscall on the CPU ended
prior to the beginning of the current interval.
It is possible for the first syscall logged by a process since kernel tracing began to be
unknown. This can occur if the process is switched in and immediately resumes a syscall
that was previously suspended. If this occurs, the last syscall box will display “can’t
determine” for the name of the syscall.
The last syscall box is a DataBox display object, and the last syscall graph is a StateGraph
display object. See Chapter 7 and Chapter 8 for more information on creating and
configuring DataBoxes and StateGraphs.
Color Information
11
Figure 11-15. Color Key
Figure 11-15 shows the color key that is located on the bottom left of the grid on the
pre-defined kernel display pages. The color key is useful only on X terminals that support
more colors than just black and white.
The text in the color key is color-coded. By default, the word “Interrupt” is red, and all
display objects on the kernel display page that display information about interrupts are
also red. By default, the word “Exception” is green, and all display objects that display
information about exceptions are also green. By default, the word “Syscall” is blue, and
all display objects that display information about syscalls are also blue.
The default colors of the different groups of kernel objects can be controlled with X
resources. The colors are specified on a per-CPU basis. The default resources for logical
CPU 0 are:
Ntrace*Color*GridObject*interrupt0*foreground: red
Ntrace*Color*GridObject*exception0*foreground: green
Ntrace*Color*GridObject*syscall0*foreground:
blue
See Appendix B for more information on X resources.
Kernel String Tables
There are seven kernel related pre-defined string tables. They are:
11-16
11
Tracing the Kernel
vector
This string table contains the interrupt and exception vector names
associated with the system that the kernel tracing was performed on.
It is contained in the vectors file.
This table is indexed by an exception/interrupt vector number or an
exception/interrupt vector name. Examples of using this table are:
get_string(vector, arg3())
get_string(vector, 15)
get_item(vector, “ncr_intr”)
syscall
This string table contains the names of all the possible syscalls that
can occur on the system. It is contained in the vectors file. For brief
descriptions of the entries in the syscall table, see “Syscalls” on
page 11-21.
This table is indexed by a system call number or a system call name.
Examples of using this table are:
get_string(syscall, 44)
get_string(syscall, arg2())
get_item(syscall, “fork”)
device
This string table contains the names the devices that are currently
configured in the kernel. It is contained in the vectors file.
This table is indexed by a device number or a device name. Examples of using this table are:
get_string(device, arg3())
get_string(device, 720900)
get_item(device, “gd”)
name_pid
This string table contains the name of each node's process ID table.
It is dynamically built as the trace event files are processed upon initialization.
node_name
This string table contains the names of all nodes that have a trace
event file associated with them. It is dynamically built as the trace
event files are processed upon initialization.
pid_nodename
This string table contains the names associated with all process identifiers found in trace event files for node name nodename. It is
dynamically built as the trace event files are processed upon initialization. It is contained in the vectors file. Because process identifiers
are not guaranteed to be unique across nodes, using the predefined
string table pid to get the process name for a process ID may result
in an incorrect name being returned from the table. Using the node
process ID tables ensures that the correct process name is returned
for a process ID unless the process name is not unique on that particular node.
These tables are indexed by a process identifier or a process name.
Examples of using these tables are:
11-17
NightTrace Manual
get_string(pid_hal, pid())
get_item(pid_simulator, “odyssey”)
syscall_nodenameThis string table contains the names of all possible system calls that
can occur in trace event files for node name nodename. It is contained in the vectors file.
This table is indexed by a system call number or a system call name.
Examples of using this table are:
get_string(syscall_systemx, 31)
get_string(syscall_systemy, arg2())
get_item(syscall_systemz, “read”)
vector_nodename This string table contains the interrupt and exception vector names
associated with trace event files for node name nodename. It is contained in the vectors file.
This table is indexed by an exception/interrupt vector number or an
exception/interrupt vector name. Examples of using this table are:
get_string(vector_machine1, arg3())
get_string(vector_machine2, 585)
get_item(vector_system3, “data access”)
device_nodename This string table contains the names of devices configured in the kernel for trace event files from node name nodename. It is contained in
the vectors file.
This table is indexed by a device number or a device name. Examples of using this table are:
get_string(device_simulator1, arg3())
get_string(device_simulator4, 3604484)
get_item(device_controller, “rtc”)
The pid string table is also used by the kernel display pages. For more information on the
pid string table, see “Pre-Defined String Tables” on page 5-14. For examples of function
calls with these tables, see Table 8-3.
Kernel Reference
11
The following sections provide a brief reference to the most common interrupts,
exceptions, and syscalls.
11-18
Tracing the Kernel
Interrupts
11
There are many different types of interrupts that can be logged by the kernel. The possible
types are listed in the system-dependent vector string table in the vectors file. There are
two main categories of interrupts:
• Non-device-related interrupts
• Device-related interrupts
The members of these two categories are described in the following two sections.
Non-Device-Related Interrupts
11
Table 11-2 provides an alphabetical list of the most common non-device-related interrupts.
Table 11-2. Non-Device-Related Interrupt Reference
Interrupt
Description
callout int
A real time clock interrupt that is used internally by the kernel.
console wake
An interrupt caused by the console wakeup button.
int on no int
An interrupt that occurs during the processing of another
interrupt.
power fail
A power fail interrupt.
rescheduling
A rescheduling interrupt used to trigger a context switch to run
the highest priority process that is ready to run.
softclock
An interrupt used to process system callout queue entries.
spurious int
An interrupt that usually indicates an unreported or
already-removed interrupt. This interrupt appears only in kernel
traces.
sysfault int
An interrupt indicating that a fatal hardware condition has been
detected.
user int
A user-level interrupt. See iconnect(3C) for a description of
enabling user-level interrupts.
xcall int
An inter-processor interrupt used for cache flushing, delivering
exceptions to another processor, performance monitoring, and
halting processors.
For more information about interrupts see intstat(1M) and uistat(1M).
11-19
NightTrace Manual
Device-Related Interrupts
11
The names printed for device interrupts correspond to the device names in the system
configuration files. See System Administration Volume 2 for information on adding
devices to a system.
Table 11-3 provides an alphabetical list of the most common device-specific interrupts.
For more information on a device-specific interrupt, refer to the documentation associated
with the particular device.
Table 11-3. Device-Related Interrupt Reference
Interrupt
Exceptions
Description
consintr
A console terminal interrupt.
eg
An Eagle ethernet controller interrupt.
eti_intr
An edge-triggered interrupt.
ex
An Excellan ethernet controller interrupt.
gpib
An IEEE-488 GPIB controller interrupt.
hardclock
A 60-Hertz clock interrupt.
hd
An HDC disk-controller interrupt.
hps
An HPS serial line-controller interrupt.
hrm
A reflective memory interrupt.
hsa
An HSA disk controller interrupt.
hsd
An HSD controller interrupt.
ie
An integral ethernet interrupt.
is
An integral SCSI controller interrupt.
mpcc
An MPCC controller interrupt.
pgintr
An FDDI controller interrupt.
rtcintr
A real-time clock interrupt.
xy
A Xylogics tape-controller interrupt.
11
There are many different types of exceptions that can be logged by the kernel. The
possible types are listed in the system-dependent vector string table in the vectors file.
11-20
Tracing the Kernel
Table 11-4 is an alphabetical list of the most common exceptions. See the PowerPC 604
RISC Microprocessor User’s Manual for more information.
Table 11-4. Exception Reference
Exception
Syscalls
Description
data access
An exception indicating that a page fault for a data page
occurred.
decrementer
An exception that occurs when the decrementer register counts
down to zero.
float unavail
An exception that occurs the first time a process attempts to use
the floating-point unit.
inst access
A page fault exception that occurs during an instruction fetch.
inst brkpt
An exception indicating that a breakpoint instruction was
executed.
kstack overflow
A fatal exception generated due to kernel errors.
machine check
A fatal exception generated for various reasons including parity
errors, hardware failures, and kernel errors.
misaligned
An exception indicating that a load, store, or exchange
instruction was attempted with a destination memory address not
consistent with the size of the access.
program
An exception indicating one of several possible conditions
including divide by zero, invalid instruction, and privilege
violation.
trace
An exception generated during single stepping of the CPU.
11
The list system calls can be found in the architecture-dependent syscall string table that
is dynamically generated into the vectors file.
11-21
NightTrace Manual
11-22
A
Appendix APerformance Tuning
1
1
1
Overview
1
Although NightTrace’s defaults are designed for maximum efficiency, your NightTrace
environment and application may have special requirements that warrant some
performance tuning. You may want to investigate the following issues:
• Preventing trace event loss
• Ensuring accurate timings
• Optimizing file system and CPU usage
• Conserving disk space
• Conserving memory and accelerating ntrace
Preventing Trace Events Loss
1
By default, NightTrace copies all user trace events from the shared memory buffer to the
trace event file. This means that normally NightTrace neither discards nor loses trace
events.
To conserve disk space, you may invoke ntraceud with the -filewrap or -bufferwrap option. However, by doing so, you are telling NightTrace to intentionally discard
older or less-vital trace events. If discarding trace events is undesirable, run ntraceud in
expansive mode. To do this, invoke ntraceud without the -filewrap and -bufferwrap options. See “Conserving Disk Space” on page A-4 for more information.
When NightTrace discards trace events, it is intentional. When NightTrace loses trace
events, it is not. NightTrace does not report discarded trace events; it does, however, report
lost trace events. Most trace event loss is preventable by flushing the shared memory
buffer often.
NightTrace shows trace event loss in the following ways:
• As a non-zero “events lost” statistic from ntraceud -stats trace_file,
from ntrace -filestats, or on the ntrace Global Window
• As a reverse video “L” on the ntrace display page Ruler at the location
where the trace event was lost
If trace event loss seems excessive, you can do the following:
A-1
NightTrace Manual
Action
Reason
Decrease -cutoff, the shared memory buffer-full
cutoff percentage for ntraceud
Increase the chance that the
ntraceud daemon will have
enough time to copy the trace
events in the shared memory
buffer to disk before the shared
memory buffer fills up.
Decrease -timeout, the ntraceud timeout
interval
(Same)
Call trace_flush() or trace_trigger()
often from within your application, especially when
your application is at a non-time critical point
(Same)
Increase -memsize, the shared memory buffer
size for ntraceud
(Same)
Use the following command to see the system settings for the current, default, minimum,
and maximum shared memory segment size:
$ /etc/conf/bin/idtune -g SHMMAX
See the idtune(1M) man page for more information.
A few other factors can affect trace event loss. Processes in your application may write
trace events into the shared memory buffer at the same time that ntraceud is flushing
trace events from the shared memory buffer to the trace event file; if the trace event
incoming rate exceeds the flush rate, trace events may not be recorded. Furthermore, when
NightTrace must choose between operating unobtrusively and logging all trace events, it
favors being unobtrusive.
See Chapter 4 for more information on ntraceud options and modes. For more
information on trace_flush() or trace_trigger(), see “trace_flush() and
trace_trigger()” on page 2-20.
If events are being lost during kernel tracing:
• Verify that the output KernelTrace trace event file is on a local file system
and not an NFS file system. If you run the following command and there is
a colon (:) in the “Filesystem” column, the file is on an NFS file
system.
$ df kernel_trace_file
• Ask your system administrator to increase the size of TR_BUFFER_COUNT
in /etc/conf/mtune.d/trace by running the idtune(1M) command, rebuild, and reboot the system. (Usually a TR_BUFFER_COUNT of
5 is sufficient.) The kernel allocates buffers of 3 pages each (12,288 bytes)
for kernel tracing. This is part of the kernel’s initialized global data, meaning these are reserved physical pages.
A-2
Performance Tuning
Ensuring Accurate Timings
1
If you lack the privilege to lock your pages in memory (P_PLOCK), you must invoke
ntraceud with the -lockdisable option. If your application lacks read and write
privilege to /dev/spl you must invoke ntraceud with the -ipldisable option.
Invoking ntraceud with either the -lockdisable or -ipldisable option, may
introduce delays and waiting within your application. Use the -lockdisable and
-ipldisable o ptio ns on ly w hen nece ssar y. F or mor e inf or matio n on the
-lockdisable option, see “Option to Prevent Page Locking (-lockdisable)” on page
4-11. For more information on the -ipldisable option, see “Option to Disable the IPL
Register (-ipldisable)” on page 4-9.
By default, ntraceud and NightTrace library routines use page locking to prevent page
faults during trace event logging. NightTrace also modifies the interrupt priority level
(IPL) register; this action prevents rescheduling and interrupts during trace event logging.
NightTrace prevents the operating system from pre-empting your trace event logging
application to make itself most unobtrusive to your application.
If the application must wake the ntraceud daemon unexpectedly, overhead can cause
trace event timings to be distorted. Do one or more of the following to increase the
likelihood that the daemon will be awake when needed and to make sure that disk write
rates are as fast as the application’s logging rate:
• Increase the shared memory buffer size (-memsize)
• Decrease the shared memory buffer-full cutoff percentage (-cutoff)
• Decrease the ntraceud timeout interval (-timeout)
• Call trace_flush() or trace_trigger() appropriately
For more information on the -memsize, -cutoff, and -timeout options, and
trace_flush(), see, respectively, “Option to Define Shared Memory Buffer Size
(-memsize)” on page 4-16, “Option to Set the Buffer-Full Cutoff Percentage (-cutoff)” on
page 4-18, “Option to Set Timeout Interval (-timeout)” on page 4-17, and “trace_flush()
and trace_trigger()” on page 2-20.
Optimizing File System and CPU Usage
1
Different systems may share files via the Network File System (NFS); however, accessing
an NFS-mounted file takes longer than accessing a local file. You get the best NightTrace
and KernelTrace performance if you avoid NFS accesses; put your trace event file on the
same system where both the daemons and your application run. To determine whether
your disk is local to your system, verify that it is mounted on /dev and not on another
host. You can do this by running the df(1) command and looking for a colon (:) in the
“Filesystem” column.
A single system may have more than one CPU. Consider assigning the daemon and your
application to different CPUs on the same system; this way, the daemos will not interfere
with your application.
A-3
NightTrace Manual
You can use the mpadvise(3C) library routine to help you determine which CPUs exist
on this system. You can the trace daemon and your application to particular CPUs with the
run(1) command.
$ run -bbias command
Conserving Disk Space
1
To determine how much disk space is available on your system, run the df(1) command
with the -k option and look at the “avail” column. You can conserve disk space if you
permit NightTrace to discard some trace events. To do this, invoke ntraceud with either
the -filewrap option or the -bufferwrap option.
The ntraceud -filewrap option makes NightTrace operate in file-wraparound mode,
rather than in expansive mode. In file-wraparound mode the trace event file can become
full of trace events. When this happens, ntraceud overwrites the oldest trace events at
the beginning of the file with the newest ones. The overwriting is called discarding trace
events. For more information on file-wraparound mode, see “Option to Establish
File-Wraparound Mode (-filewrap)” on page 4-12.
The ntraceud -bufferwrap option makes NightTrace operate in buffer-wraparound
mode, rather than in expansive mode. When the buffer is full in buffer-wraparound mode,
the application treats the shared memory buffer as a circular queue and overwrites the
oldest trace events with the newest ones. This overwriting continues until your application
explicitly calls trace_flush() or trace_trigger(). Only then, does ntraceud
copy the remaining trace events from the shared memory buffer to the trace event file. The
overwriting is called discarding trace events. For more information on buffer-wraparound
mode, see “Option to Establish Buffer-Wraparound Mode (-bufferwrap)” on page 4-13.
By default, ntraceud operates in expansive mode, not file-wraparound or buffer-wraparound mode. In expansive mode, NightTrace uses the most disk space because it does
not discard any trace events.
You can also conserve disk space by invoking ntraceud with the -disable option so
it logs fewer trace events. For details, see “trace_enable(), trace_disable(), and Their Variants” on page 2-16.
Conserving Memory and Accelerating ntrace
1
ntrace can be a memory-intensive tool. By default, when ntrace starts up, it loads all
trace event information into memory; therefore, the more trace events in your trace event
file(s), the more memory ntrace uses. When you move the scroll bar on the Display
Page to change the displayed interval, ntrace processes all trace events between the last
interval and this one; if there are many trace events, the display update (or search) may
seem slow. To conserve memory and accelerate ntrace:
• Log only trace events you are really interested in.
A-4
Performance Tuning
• Invoke ntrace only with the trace event files that are essential to your
analysis.
• Invoke ntrace with options (-nohardclock, -process -start,
and -end) that restrict which trace events get loaded. For more information about ntrace options, see “ntrace Options” on page 5-3.
A-5
NightTrace Manual
A-6
B
Appendix BGUI Customization
2
2
2
Overview
2
The graphical user interface (GUI) for ntrace is based on OSF/Motif. ntrace runs in
the environment of the X Window System. Your X terminal vendor supplies you with
vendor-specific directories and files that pertain to colors and fonts. The file that contains
available colors is called rgb.txt. The fonts that your X server supports are in the
/usr/lib/X11/fonts directory.
ntrace has default values for X resources. These resources include fonts, some push
button names, window titles, window-component dimensions, and colors. You can override the following default X resource settings by providing new values in the following
places:
• In your .Xdefaults file
• On the ntrace invocation line
• In a resource file that the xrdb(1) X resource database manager reads
If you specify the same X resource on the ntrace invocation line and in your
.Xdefaults file, the setting on the invocation line overrides the one in the file.
An X resource line has the following format:
object*subobject[*subobject...]*attribute: value
where:
object
Is the name of the X client program, Ntrace.
subobject
Is a level in the widget (window component) hierarchy with the most
general level first; this always begins on an upper-case letter. In
ntrace, the first subobject is often Color for color displays or
Mono for monochrome displays. The last subobject may be the name
of your display object. For more information about display object
names, see “Display Object Name” on page 8-4.
attribute
Is a characteristic of the last subobject; this always begins on a
lower–case letter.
value
Is a setting for the attribute.
It is possible to omit levels from the widget hierarchy. If you specify all levels of the
widget hierarchy and then a value, the value applies to that specific widget. If you leave
B-1
NightTrace Manual
out levels of the widget hierarchy, the attribute applies more generally, possibly to a class
of widgets.
For more information on X resources, see “Recommended Reading” on page 1-7 and the
X Window System User’s Guide.
Default X-Resource Settings for ntrace
2
ntrace’s default X-resource settings follow. They are primarily grouped by window and
display object. There are some subobjects and attributes that appear in many settings.
Table B-1 lists several common subobjects and attributes along with their meanings.
Table B-1. Meanings of Common Subobjects and Attributes
Subobject/Attribute
Meaning
TextScrollbox
The message (or summary) display area
Dialog
The dialog box
name
The window title. Any window that has a name attribute
also has a geometry attribute.
geometry
The location and dimensions of the window. See “Recommended Reading” on page 1-7 for more information.
open
A push button name in a File Selection Dialog Box
caption
The descriptive text within a window
In the following X-resource strings, default values are shown where they exist.
The resource strings for the global window message display area dimensions and window
title are:
Ntrace*GlobalWindow*TextScrollbox*defaultLines:
Ntrace*GlobalWindow*TextScrollbox*defaultChars:
Ntrace*GlobalWindow*name:
Ntrace*GlobalWindow*geometry:
20
80
NightTrace
The resource strings for the line count of the display page message area follow. Note:
minimumLines must be less than or equal to defaultLines, and defaultLines
must be less than or equal to maximumLines.
Ntrace*DisplayPage*TextScrollbox*defaultLines:
Ntrace*DisplayPage*TextScrollbox*maximumLines:
Ntrace*DisplayPage*TextScrollbox*minimumLines:
3
3
3
The resource strings for grid attributes follow. ntrace uses the defaultDotsHigh
a n d d e fa ul t Do t sW id e a t t r i b u t es o n l y f o r n ew d i s p l ay p a g e s. N o t e : i f
defaultDotsWide is too narrow to accommodate all the display page push buttons,
ntrace overrides this setting.
Ntrace*Grid*foreground:
B-2
GUI Customization
Ntrace*Grid*background:
Ntrace*Grid*font:
Ntrace*Grid*defaultDotsHigh:
Ntrace*Grid*defaultDotsWide:
30
60
The resource strings for the File Selection Dialog Box width, window titles, push
buttons, and prompt strings follow. A File Se le ctio n D ia log Bo x is the type of
window ntrace uses to prompt for file names, for example, configuration file names to
open and save.
Ntrace*FileChooser*width:
180
Ntrace*OpenPopup*name:
Ntrace*OpenPopup*open:
Ntrace*OpenPopup*caption:
Ntrace*OpenPopup*geometry:
Open Dialog
Open
Enter configuration file name:
Ntrace*ReadPopup*name:
Ntrace*ReadPopup*open:
Ntrace*ReadPopup*caption:
Ntrace*ReadPopup*geometry:
Read Dialog
Read
Enter event-map file name:
Ntrace*SaveAsPopup*name:
Ntrace*SaveAsPopup*open:
Ntrace*SaveAsPopup*caption:
Ntrace*SaveAsPopup*geometry:
Save As Dialog
Save
Enter configuration file name to save:
The resource strings for the other dialog box titles and descriptive text are:
Ntrace*WarningDialog*name:
Warning Dialog
Ntrace*QuestionDialog*name:
Question Dialog
Ntrace*WorkingDialog*name:
Working Dialog
Ntrace*MacroDialog*name:
Ntrace*MacroDialog*caption:
Macros
List of Macros:
Ntrace*QualifiedEventDialog*name:
Qualified Events
Ntrace*QualifiedEventDialog*caption: List of Qualified Events:
Ntrace*QualifiedStateDialog*name:
Qualified States
Ntrace*QualifiedStateDialog*caption: List of Qualified States:
The resource strings for the window title and descriptive text for all Forms are:
Ntrace*SearchForm*name:
Search
Ntrace*SummarizeForm*name:
Summarize
Ntrace*SummarizeForm*TextScrollbox:defaultChars: 84
Ntrace*SummarizeForm*TextScrollbox:defaultLines: 14
Ntrace*SummarizeForm*SaveTextAsPopup*name: Save Summary Text As Dialog
Ntrace*SummarizeForm*SaveTextAsPopup*open: Save
Ntrace*SummarizeForm*SaveTextAsPopup*caption:
Enter file name to save text
to:
Ntrace*SummarizeForm*SaveTextAsPopup*geometry:
B-3
NightTrace Manual
TIP:
If you sometimes work at a monochrome monitor, you may want to have two sets of the
following X resource settings: one for color and one for monochrome. The color settings
follow. The resource names for monochrome settings are identical except they say Mono
instead of Color.
TIP:
Experiment with colors and shadings until you find a set you like. To avoid visual fatigue,
use highly-contrasting colors and values sparingly.
The resource strings for the specific display objects are:
Ntrace*Color*GridLabel*background:
Ntrace*Color*GridLabel*foreground:
Ntrace*Color*GridLabel*font:
Ntrace*Color*GridLabel*textJustify:
Ntrace*Color*GridLabel*textGravity:
Ntrace*Color*DataBox*background:
Ntrace*Color*DataBox*foreground:
Ntrace*Color*DataBox*font:
Ntrace*Color*DataBox*textJustify:
Ntrace*Color*DataBox*textGravity:
Ntrace*Color*Column*background:
Ntrace*Color*Column*foreground:
Ntrace*Color*StateGraph*background:
Ntrace*Color*StateGraph*foreground:
Ntrace*Color*StateGraph*eventColor:
Ntrace*Color*EventGraph*background:
Ntrace*Color*EventGraph*foreground:
Ntrace*Color*DataGraph*background:
Ntrace*Color*DataGraph*foreground:
Ntrace*Color*Ruler*background:
Ntrace*Color*Ruler*foreground:
Ntrace*Color*Ruler*font:
Ntrace*Color*Ruler*markColor:
Ntrace*Color*Ruler*lostEventColor:
TIP:
On a monochrome display, make sure that you can differentiate among display objects
within a Column. The easiest way to do this is to leave at least one grid dot between display objects in a Column and to make the background color of the Column black.
Grid object settings apply if you have not set the corresponding setting for a specific
display object. The general grid object resource strings are:
Ntrace*Color*GridObject*background:
Ntrace*Color*GridObject*foreground:
Ntrace*Color*GridObject*borderColor:
For information about setting X resources for kernel displays, see “Color Information” on
page 11-16.
B-4
GUI Customization
Examples
2
Setting X resources to values is most consistent if the values of the X resources do not
contain spaces. For example, even if your rgb.txt color file contains a color called
“navy blue,” for simplicity type it as one word without any quotation marks.
In the following examples, you are making navy blue (navyblue) the foreground color
(foreground) of all grid objects (GridObject) on a color monitor (Color) for
ntrace (Ntrace). This example shows how this line may appear in your .Xdefaults
file.
Ntrace*color*GridObject*foreground: navyblue
The following example shows how you can use this setting on the ntrace invocation
line. Note: there must not be any spaces between the colon and the value.
$ ntrace -xrm Ntrace*color*GridObject*foreground:navyblue
Exercise: Customizing Display Colors
2
Edit your .Xdefaults file so it defines background colors for the following display
objects. Suggested colors are provided.
Table B-2. Suggested Colors for X Resources
Display Object
Suggested Color
Column
CornflowerBlue
DataGraph
PowderBlue
StateGraph
LightSteelBlue
Ruler
PaleGreen
DataBox
Aquamarine
GridObject
SkyBlue
B-5
NightTrace Manual
A possible solution follows:
Ntrace*Color*Column*background: CornflowerBlue
Ntrace*Color*DataGraph*background: PowderBlue
Ntrace*Color*StateGraph*background: LightSteelBlue
Ntrace*Color*Ruler*background: PaleGreen
Ntrace*Color*DataBox*background: Aquamarine
Ntrace*Color*GridObject*background: SkyBlue
To test your entries at an X terminal, invoke ntrace with the log trace event file, and
bring up the default display page.
B-6
C
Appendix CAnswers to Common Questions
3
3
Q:
A:
Q:
A:
Q:
A:
What can I do if trace events are not logging at all?
Verify that the trace event file name on the trace_begin() call matches the one on the user daemon
invocation. Furthermore, check that the file exists and that you have permission to read and write it.
Additionally, be sure your thread name contains no embedded spaces or punctuation, including periods. See
“trace_begin()” on page 2-5 and “trace_open_thread()” on page 2-9 for more information.
When should I log a different trace event ID number?
Each endpoint of a state should have a different trace event ID number. Usually each trace event logging
routine logs a different trace event ID number. This lets you easily identify which source line logged the trace
event, how often that source line executed, and what order source lines executed in. However, it is sometimes
useful to log the same trace event ID in multiple places. This makes it possible to group trace events from
related, but not identical, activities. For more information, see “trace_event() and Its Variants” on page 2-10.
How can I prevent user trace events from being discarded or lost?
Use expansive mode; avoid use of buffer or file wrapping options. Flush the shared memory buffer more
often by tuning:
• The shared memory buffer size
• The shared memory buffer’s flush percentage
• Increase the priority of the user trace daemon
• Bind the user trace daemon to a CPU with minimal activity
See “Preventing Trace Events Loss” on page A-1 and Chapter 4 for more information.
Q:
A:
Q:
A:
What can I do if trace events are not appearing in an ntrace display?
Press Refresh, fill out the Search Form, fill in values in the interval control area, use the interval scroll bar,
keep pressing the Zoom Out push button until you see trace events, examine a display object configuration
so you know what it is “listening” for, add or reconfigure display objects on the grid. See Chapter 6 for more
information.
My trace event timings occasionally have huge gaps of time between them. What is the cause?
You are probably running your application on a Series 6000 system and are calling clock_settime().
This system call can corrupt the system interval timer which NightTrace uses for trace event timings.
C-1
NightTrace Manual
Q:
A:
How can I prevent kernel trace events from being lost?
• Verify that the raw kernel trace output file is on a local file system and not an NFS file system.
• Ask your system administrator to increase the size of TR_BUFFER_COUNT kernel tunable
parameter (PowerMAX Only)
• Increase the priority of the kernel trace daemon
• Bind the kernel trace daemon to a CPU with minimal activity
C-2
Glossary
This glossary defines terms used in the documentation. Terms in italics are defined here.
Ada task
An Ada task is a construct of statements which logically execute in parallel with
other tasks within an Ada program (process). Tasks communicate asynchronously
via variables whose visibility is defined by normal Ada scoping rules. Tasks
communicate synchronously via rendezvous between a calling and accepting task.
Add
A push button that creates a new macro, qualified event, or qualified state on the
current display page.
Apply
A push button that validates and saves all changes. The same functionality is
available by pressing <Enter> in a modified field.
argument
See trace event argument.
boolean table
A pre-defined string table defined in the /usr/lib/NightTrace/tables file.
It associates 0 with false and all other values with true.
buffer-wraparound mode
The mode that causes the ntraceud daemon to treat the shared memory buffer as a
circular queue and to overwrite the oldest trace events with the newest ones; this
means that ntraceud intentionally discards the oldest trace events to make room
for the newest ones. Invoke ntraceud with the -bufferwrap option to obtain
this behavior. The two other ntraceud modes are expansive mode and file-wraparound mode.
button
See mouse button, push button, and radio button.
click
To press and release a mouse button without moving the pointer. Usually you do
this in NightTrace to select menu items, push buttons, or radio buttons.
Glossary-1
NightTrace Manual
Close
A push button that closes a dialog box. This can also be a menu item that makes a
window close.
color display
An X server display that contains greater color variety than black, gray, and white.
See also monochrome display.
Column
A display object that constrains the width of StateGraphs, EventGraphs, DataGraphs, and Rulers.
configuration
The definition of a display object, macro, qualified event, or qualified state.
configuration file
An NightTrace-generated ASCII file that holds display pages, macro, qualified
event, and qualified state definitions. This can also be a hand-edited table file, containing definition of string tables and/or format tables.
Configuration Form
The NightTrace form that allows you to define a display object’s data content,
constraints, and graphic attributes, the value of a macro or the constraints of a
qualified event or qualified state.
Configure
A push button that reconfigures and renames the selected macro, qualified event, or
qualified state.
context switch
An action that occurs inside the kernel. Its functions are to save the state of the
process that is currently executing, to initialize the state of the process to be run, and
to begin execution of the new process.
context switch line
A vertical line superimposed on an exception graph or a syscall graph on a kernel
display page. It indicates that the kernel has switched out the process that was
previously running on the CPU and switched in a new process.
control
See mouse button, push button and radio button.
Glossary-2
Glossary
CPU box
A GridLabel on a kernel display page. It identifies which logical central processing
unit the displayed data corresponds to. Logical CPU numbers are related to, but not
necessarily identical to, physical CPU numbers.
current instance of a state
The instance of a state which has begun but has not yet completed. Thus, the current time line would be positioned within the region from the start event up to, but
not including, the end event.
current time
The time in the interval up to which all display objects on a display page have been
updated.
current time line
The dashed vertical bar that represents the current time in a Column.
current trace event
The last trace event on or before the current time line.
cursor
See text cursor.
daemon definition
The configuration of a particular trace daemon which includes daemon collection
modes and settings, daemon priorities and CPU bindings, and data output formats,
as well as which trace event types are handled by that daemon.
DataBox
A display object that displays possibly variable textual or numeric information.
DataGraph
A scrollable display object that graphically displays a bar chart of an expression’s
value as it changes over the interval.
Default Kernel Page
A menu item that automatically creates a display page to depict context switches,
interrupts, exceptions, and system calls with display objects for each CPU on the
system.
Glossary-3
NightTrace Manual
Default Page
A menu item that automatically creates a display page with a StateGraph for each
trace event logging process in your trace event file(s).
Delete
Remove the selected macro, qualified event, or qualified state.
device table
A pre-defined, dynamically generated string table in the vectors file created by
ntrace when consuming raw kernel trace data files. string table contains the
names of the devices that are currently configured in the kernel.
dialog box
A transient secondary window that accepts input or conveys a message, for example
information, errors, warnings, and questions. This construct is occasionally called a
pop-up window.
dimmed
See disabled.
disabled
To flag a component, such as a menu item or push button, as temporarily unavailable by graying out the label.
discarded trace event
A trace event that ntraceud intentionally did not log in buffer-wraparound or
file-wraparound mode.
display object
A user-configured graphical component of a display page that shows trace events,
states, trace event arguments, other numeric and text data. Display objects include
the following: GridLabels, DataBoxes, Columns, StateGraphs, EventGraphs, DataGraphs and Rulers.
display page
The NightTrace window that allows you to layout display objects and see trace
event and state information in them. You can store display pages in configuration
files.
dotted area
See grid.
Glossary-4
Glossary
drag
To press and hold down a mouse button while moving the mouse. Usually you do
this in NightTrace to position a display object.
duration
The period of time between the start and end trace events of some state.
Edit mode
The display-page mode that allows you to create, edit, and configure display
objects, macros, qualified events, and qualified states. The other display-page mode
is View mode.
ellipses (...)
An indicator at the end of a menu item that tells you this selection makes a dialog
box appear. Also, an indicator in command line option summaries and syntax
listings that tells you more than one occurrence of the previous syntactic component
is allowed.
end function
A state function that provides information about the ending trace event of the last
completed instance of a state. The state to which the end function applies is either
the qualified state specified to the function, or the state being currently defined.
Thus, if a qualfied state is not specified, end functions are only meaningful when
used in expressions associated within a state definition.
event
See trace event.
event_arg_dbl_summary table
A pre-defined format table defined in /usr/lib/NightTrace/tables. It
contains formats for statistical displays of trace event matches and type double
arguments.
event_arg_summary table
A pre-defined format table defined in /usr/lib/NightTrace/tables. It
contains formats for statistical displays of trace event matches and type long
arguments.
EventGraph
A scrollable display object that graphically displays trace events as vertical lines in
a Column.
Glossary-5
NightTrace Manual
event ID
See trace event ID.
event-map file
User-generated ASCII file that lets you associate or map short mnemonic tags or
la b e ls w it h n u me r i c t ra ce e v e n t I D s. Th e k er n e l ’s e v e nt - m ap f i l e is
/usr/lib/NightTrace/eventmap.
event_summary table
A pre-defined format table defined in /usr/lib/NightTrace/tables. It
contains formats for statistical displays of trace event matches and trace event time
gaps. It determines the default event-summary output format.
event table
A pre-defined, dynamically generated string table. It is internal to NightTrace and
maps all known numeric trace event IDs with symbolic trace event tags.
event tag
See trace event tag.
exception
An event internal to the currently executing process that stops the current execution
stream. Exceptions can be suspended and resumed.
exception graph
A StateGraph on a kernel display page. It displays states representing exceptions
executing on the associated CPU.
expansive mode
The (default) mode that causes the ntraceud daemon to copy all trace events that
ever reach the shared memory buffer to the indefinitely-sized trace event file.
Invoke ntraceud without the -filewrap and -bufferwrap options to obtain
this behavior. The two other ntraceud modes are buffer-wraparound mode and
file-wraparound mode.
expression
A combination of operators and operands that evaluate to a value. Operands include
constants, macro calls, function calls, qualified events, and qualified states.
Exit
A menu item that terminates an NightTrace session.
Glossary-6
Glossary
file-wraparound mode
The mode that causes the ntraceud daemon to overwrite the oldest trace events in
the beginning of the trace event file with the newest ones; this means that
ntraceud intentionally discards the oldest trace events to make room for the
newest ones. Invoke ntraceud with the -filewrap option to obtain this
behavior. The two other ntraceud modes are expansive mode and buffer-wraparound mode.
flushing the buffer
The process of the ntraceud daemon copying trace events from the shared
memory buffer to a trace event file.
font
A style of text characters.
format function
A function that allows you to display a string.
format table
The pre-defined or user-defined structure that allows you to group related integer
values together and associate each one with a corresponding dynamically-formatted
and generated character string. You hand-edit format tables into configuration files.
The related structure is a string table.
function
A pre-defined NightTrace entity that may be used in an expression. NightTrace provides several classes of functions: trace event, multi-event, start, end, multi-state,
offset, summary, format, and table functions.
gap
The period of time between two trace events, possibly the end of one state and the
beginning of another.
global process identifier
See PID.
Global Window
The NightTrace window that displays summary statistics pertaining to your trace
event files and allows you to open NightTrace-related files.
graphical user interface
The mechanism NightTrace uses to receive input and provide displays. It is based on
the X Window System and Motif.
Glossary-7
NightTrace Manual
grid
The region of the display page filled with parallel rows and columns of dots that
holds display objects.
GridLabel
A display object that displays constant textual information.
GUI
See graphical user interface.
Help
A menu item that presents the online manual using the HyperHelp viewer.
host system
The system on which the NightTrace GUI is running.
icon
The small graphical image and/or text label that represents a window or window
family when the window is minimized. The text label is either the window title or
an abbreviated form of the title. Iconified windows are still active.
ID
See trace event ID.
instrumented code
Source code after you have put calls to NightTrace library routines into it.
interrupt
An event external to the currently executing process; an interrupt stops the current
execution stream to begin execution of a higher-priority execution stream. There are
device-related and software-generated interrupts. Interrupts have an associated
priority known as the interrupt priority level (IPL), which allows an interrupt to
interrupt the execution stream of a lower-IPL interrupt.
interrupt graph
A DataGraph on a kernel display page. It displays states representing interrupts
executing on the associated CPU.
interrupt priority level (IPL) register
A system register than can be used by the NightTrace library to prevent rescheduling and interrupts during trace event logging.
Glossary-8
Glossary
interval
A time period in the trace session delimited by the Time Start and Time End fields
of the interval control area.
interval control area
The region of the display page that holds nine numeric fields that define and
manipulate the interval and the display objects on the grid.
interval timer
The system timer on the NightHawk 6000 Series and TurboHawk systems that
NightTrace uses to timestamp trace events.
Kernel Trace Event File
A trace event file is generated by a kernel trace daemon. This file contains raw kernel data and is automatically transformed into a filtered file (with a new filename
using the “.ntf” suffix) by ntrace. Either a raw kernel trace event file or a filtered file may be specified to ntrace. The filtering process also creates a vectors
file which is formed by appending a “.vec” suffix to the original trace event file
name.
keyboard
A traditional input device for entering text into fields. In this manual, this is a
standard 101-key North American keyboard.
last completed instance of a state
The most recent instance of a state that has already completed. Thus, the current
time line would be positioned either on, or after, the end event for a state.
last exception box
A DataBox on a kernel display page. It displays the last exception prior to the
current time line that executed (and may still be executing) on the associated CPU.
last interrupt box
A DataBox on a kernel display page. It displays the name of the last interrupt prior
to the current time line that executed (and may still be executing) on the associated
CPU.
last syscall box
A DataBox on a kernel display page. It displays the last syscall prior to the current
time line that executed (and may still be executing) on the associated CPU.
lightweight process identifier
See LWPID.
Glossary-9
NightTrace Manual
lost trace event
A trace event ntraceud was unable to log. Several ntraceud options exist to
prevent this trace event loss.
LWPID
An integer that represents an operating system lightweight process identifier. It
makes up the second half of a PID.
macro
A user-defined named expression stored in a configuration file. When you call a
macro, precede the macro name with a dollar sign.
mark
The solid triangle on a Ruler that points to a particular time.
match
A trace event or state that meets user-defined qualifying configuration criteria.
menu
A list of user-selectable choices.
menu bar
The horizontal band near the top of a window that contains a list of labeled
pull-down menus.
message display area
The scrolling region of the Global Window or the display page that holds textual
statistics, as well as error and warning messages.
monochrome display
A black, gray, and white X-server display. See also color display.
most recent instance of a state
If the current time line is positioned within a current instance of a state, then it is
that instance of the state. Otherwise, it is the last completed instance of a state.
mouse
In this manual, a three-button pointing device for point-and-click interfaces.
Glossary-10
Glossary
mouse button
A part of the mouse that you can press to alter aspects of the application. Each
mouse button has a different purpose. Button 1 is usually for selecting or dragging.
Button 2 is usually for moving display objects. Button 3 is usually for resizing
display objects. You can make multiple selections by simultaneously pressing
<Shift> and clicking mouse button 1. You may click, drag, press, and release
mouse buttons.
multi-event function
Multi-event functions return information about ocurrences of events, or relationships between occurrences of events, before the current time line.
multi-state function
Multi-state functions return information about instances of states, or relationships
between instances of states, before the current time line.
name_pid table
A pre-defined, dynamically generated string table. It is internal to NightTrace and
associates node ID numbers with the the name of each node's process ID table.
name_tid table
A pre-defined, dynamically generated string table. It is internal to NightTrace and
associates node ID numbers with the the name of each node's thread ID table.
New Page
A menu item that creates an empty display page.
NightTrace
The interactive debugging and performance analysis tool that is part of the NightStar tool kit. It consists of the ntraceud daemon, NightTrace library routines, and
the ntrace display utility. This product allows you to log trace events and data
from applications written in C, Fortran, or Ada; these applications may be composed
of one or more processes, running on one or more CPUs. You can then examine
these trace events and those from the kernel through the ntrace display utility.
NightTrace thread
A process, thread or Ada task (or a set of any combination of these) that is
associated with a uniquely named trace context. The thread name is derived from
the argument specified to the trace_open_thread() function.
NightTrace thread identifier
See TID.
Glossary-11
NightTrace Manual
NightView
A symbolic debugger that is part of the NightStar tool kit. It lets you debug C and
Fortran applications; these applications may be composed of one or more processes,
running on one or more CPUs. Among other things, NightView can automatically
patch trace event logging routines into your executable application.
node
A system from which a trace event file can come from.
node box
If the RCIM synchronized tick clock is used to timestamp events, this is a GridLabel
on a kernel display page. It identifies which node to which the displayed data corresponds.
node ID
A unique identifier internally assigned by NightTrace to every node that has an
trace event file in a trace file analysis.
node name
The name of a system from which a trace event file can come.
node_name table
A pre-defined, dynamically generated string table. It is internal to NightTrace and
associates node ID numbers with node names.
node PID table
A pre-defined, dynamically generated string table. It is internal to NightTrace and
associates process identifiers (PIDs) with process names for a particular node. The
name of each node's table is pid_nodename where nodename is the node's name. If
kernel tracing, this table is stored in the vectors file.
node TID table
A pre-defined, dynamically generated string table. It is internal to NightTrace. If
user tracing, it associates NightTrace thread ID numbers with thread names for a
particular node. If kernel tracing, this table is not used. The name of each node's
table is tid_nodename where nodename is the node's name.
NT_ASSOC_PID
An overhead trace event that ntraceud logs at the beginning and end of each
process.
Glossary-12
Glossary
NT_ASSOC_TID
An overhead trace event that ntraceud logs at the beginning and end of each
thread and Ada task.
NT_CONTINUE
An overhead trace event that ntraceud logs for multi-argument trace events.
ntrace display utility
The part of NightTrace that graphically displays trace events, trace event data, and
states for debugging and performance analysis.
ntraceud
The NightTrace daemon process that allows you to log user-defined trace events
and data from user applications written in C, Fortran, or Ada. These applications
may be composed of one or more processes, running on one or more CPUs.
object
See display object.
offset
The number that identifies the position of a trace event in the chronologically-ordered sequence of trace events, regardless of the trace event ID. Counting
starts from zero. For example, if a trace event with trace event ID 71 is the third
trace event in the trace session, then its offset is 2.
offset function
A function that takes an expression that evaluates to an offset as a parameter.
OK
A push button that acknowledges the warning in a dialog box.
Open
A menu item and push button that opens an existing file.
ordinal trace event number
See offset.
panel
A window component that groups related buttons, for example push buttons.
Glossary-13
NightTrace Manual
PID
A 32-bit integer that represents an operating system process. The following syntax
numerically specifies a PID: raw_PID’LWPID. The operating system process identifier (raw PID) is contained in the upper 16 bits and the lightweight process identifier (LWPID) is contained in the lower 16 bits.
PID table
A pre-defined, dynamically generated string table. It is internal to NightTrace and
associates process identifiers (PIDs) with process names. If kernel tracing, the pid
string table in the vectors file.
point
To move the mouse so the mouse pointer is positioned at the place of interest.
pointer
A graphical symbol that represents the mouse pointer’s current location in the
window. The shape of the pointer shows the current usage. Usually a pointer is
shaped like an arrow pointing to the upper left.
pop-up window
See dialog box.
press
To hold down a mouse button without releasing it or to depress a keyboard key.
pull-down menu
A list of related choices called menu items pulled down from the menu bar. Click
on a menu item to select it.
push button
A graphic image of a labeled button. Click on a push button to select it.
qualified event
A user-defined named event configuration that consists of a set of one or more trace
events, possibly restricted by an If-Expression, CPU List, TID List, PID List,
and Node List. Qualified events provide a mechanism for referencing trace events
configurations within certain functions. These definitions are stored in configuration
files.
qualified state
A user-defined named state configuration that consists of a set of one or more
states, possibly restricted by a Sta rt-Exp ressio n, End -Expression, CPU
List, TID List, PID List, and Node List. Qualified state provides a mechanism
Glossary-14
Glossary
for referencing state configurations within certain functions. These definitions are
stored in configuration files.
radio button
A graphic, labeled diamond-shape that represents a mutually exclusive selection
from related radio buttons. Click on a radio button to select it.
raw PID
A 16-bit integer that makes up the first half of a PID.
RCIM
Real-Time Clocks and Interrupts Module. It provides a synchronized clock,
edge-triggered interrupts, real-time clocks and programmable interrupts. Some set
of interrupts can be distributed and sent to all connected RCIMs. The RCIM hardware is available via a standard PCI mezzanine card (PMC).
RCIM synchronized tick clock
The primary clock on an RCIM. It is a 64-bit non-interrupting counter that counts
each tick of the clock (400 nanoseconds). When connected to other RCIMs, the
synchronized tick clock provides a time base that is consistent for all connected single board computers.
Read
A menu item and push button that read an existing file.
record
See trace event.
region
The period of time between the mark and the current time.
release
To let go of the currently-pressed mouse button.
Reset
A push button that cancels (undoes) all unapplied changes.
Restore
A push button that cancels all changes since the dialog box was displayed.
Glossary-15
NightTrace Manual
Ruler
A scrollable display object that appears as a hash-marked timeline within a Column.
The Ruler may also contain reverse video “L”s indicating lost trace events and
user-defined marks.
running process box
A DataBox that shows the process that is executing at the current time line on the
associated CPU. If the RCIM module is used to timestamp events, this DataBox will
show the process that is executing at the current time line on both the associated
CPU and node.
Save
A menu item and push button that overwrite an existing configuration file with the
current display page.
Save As
A menu item that saves the current display page in a new configuration file.
Save Text
A menu item that overwrites an existing summary text file with text from the
summary display area.
Save Text As
A menu item that saves the current summary text from the summary display area
into a new summary text file.
SBC
Single-board computer.
scroll bar
The narrow, rectangular graphic device used to change a display that would not
otherwise fit in the window. It consists of a trough, a slider, and arrowhead buttons.
If the slider does not fill the trough, there is a gap on one or both sides.
Search Form
The NightTrace form that allows you to define criteria to be used to locate a trace
event in a trace event file by its configured characteristics and its location in the file.
selection
The display object that you clicked on. Alternatively, a selection may be the region
of a text field you dragged the mouse over. For menu items, push buttons, and radio
buttons NightTrace indicates selection by highlighting your choice. For display
Glossary-16
Glossary
objects, NightTrace places handles on the display object. For dragged-over text
fields, NightTrace displays that text in reverse video.
separator
A line that groups related window components or menu components.
session
A collection of one or more daemon definitions.
shared memory buffer
The intermediate destination of trace events before ntraceud copies them to the
trace event file on disk.
slider
The graphic part of a scroll bar that you move in the trough to change the display.
This component is sometimes called a thumb.
spin lock
A device used to protect a resource, for example, the shared memory buffer.
start function
A state function that provides information about the start event of the most recent
instance of a state. The state to which the start function applies is either the qualified state specified to the function, or the state being currently defined. Thus, if a
qualfied state is not specified, start functions are only meaningful when used in
expressions associated within a state definition. In addition, start functions should
not be used in a recursive manner in a Start Expression; a start function should
not be specified in a Start Expression that applies to the state definition containing that Start Expression. Conversely, an End Expression may include start
functions that apply to the state definition containing that End Expression.
state
A state is bounded by two trace events, a start event and an end event. An instance
of a state is the period of time between the start event and end event, including the
start and end events themselves. Additional conditions may be specified in a state
definition to further constrain the state. Instances of states do not nest; that is, once
a state becomes active, events that might normally satisfy the conditions for the start
event are ignored until the end event is encountered. See also qualified state.
state function
The class of NightTrace functions which provide information about states, including: start functions, end functions, and multi-state functions.
Glossary-17
NightTrace Manual
StateGraph
A scrollable display object that graphically displays states as bars and trace events
as vertical lines in a Column.
state_summary table
A pre-defined format table defined in /usr/lib/NightTrace/tables. It
contains formats for statistical displays of state matches, state durations, and state
time gaps. It determines the default state-summary output format.
streaming
The method used by the NightTrace Session Manager of sending trace data from
daemons directly to the NightTrace display.
string table
The pre-defined or user-defined structure that allows you to group related integer
values together and associate each one with a corresponding static character string.
You hand-edit string tables into configuration files. The related structure is a format
table.
Summarize Form
The NightTrace form that allows you to obtain trace event and state statistics, such
as minimum, maximum, average, and total values of gaps, durations, and trace
event arguments.
summary display area
The scrolling region of the S u m ma r iz e Fo r m that holds textual summary
statistics.
summary function
A f u n ct i o n t h at t a ke s an o t h er ex p re ssi o n a s a p ar a me te r ( e x ce p t f o r
summary_matches()).
summary syscall
A system call that is a special type of exception. A syscall is made when a user
program forces a trap into the operating system via a special machine instruction. A
syscall is used to request a given service from the kernel. Many library routines
supplied as part of the operating system make syscalls to accomplish their functions.
Syscalls can be suspended and resumed.
syscall
System call.
Glossary-18
Glossary
syscall graph
A StateGraph on a kernel display page. It displays states representing system calls
(syscalls) executing on the associated CPU.
syscall table
A pre-defined, dynamically generated string table in the vectors file. This string
table contains the names of all the possible system calls (syscalls) that can occur on
the system.
table
See format table and string table.
table function
A function that allows you to extract information from user-defined and pre-defined
string tables and format tables.
tag
See trace event tag.
task
See Ada task.
task ID
A 16-bit integer chosen by the Ada run-time executive that uniquely identifies an
Ada task within an Ada program.
text cursor
The blinking vertical bar in an editable text field that shows your current edit
position within the field.
thread
A sequence of instructions and associated data that is scheduled and executed as an
independent entity. Every UNIX process linked with the Threads Library contains at
least one, and possibly many, threads. Threads within a process share the address
space of the process.
thread ID
A 16-bit integer chosen by the threads library that uniquely identifies a thread
within a given process.
Glossary-19
NightTrace Manual
TID
A 32-bit integer that represents a unique context to which trace events can be
associated. The following syntax numerically specifies a TID: raw_PID’task_id,
raw_PID’thread_id, or raw_PID’0 (if neither Ada tasks nor threads are in use).
The operating system process ID (raw PID) is contained in the upper 16 bits and
either a thread ID, task ID, or zero is contained in the lower 16 bits.
TID table
A pre-defined, dynamically generated string table. It is internal to NightTrace and
associates NightTrace thread identifiers (TIDs) with thread names. This table is not
used in kernel tracing.
timestamp
The time at which a specific trace event was logged. This provides the means by
which the chronology of the trace events logged by multiple processes can be
assembled. The timestamp is obtained from the system interval timer, the Time
Base Register, or the RCIM synchronized tick clock, depending on either the system
architecture or user-specified options to ntraceud.
Time Base Register
The system timer on the Power Hawk/PowerStack systems that NightTrace uses to
timestamp trace events.
time quantum
The fixed period of time for which the kernel allocates the CPU to a process.
trace context
All trace points are associated with a log file (established via trace_start) and a
thread name (established via trace_open_thread). If two processes (or tasks,
or threads) are associated with the same log file and thread name, then they are said
to have the same trace context. If they differ in log file, thread name, or both, then
they have different trace contexts.
trace event
A user-defined point of interest in an application’s source code that NightTrace
represents with an integer trace event ID. Alternatively this may be a predefined
point of interest in the kernel. Along with the trace event ID, NightTrace records the
timestamp when the trace event occurred, any arguments logged with the trace
event, and the logging process identifier (PID).
trace event argument
A user-defined numeric value logged by an application via a trace event.
Glossary-20
Glossary
trace event file
An ntraceud-created binary file that contains sequences of trace events and data
that your application and the ntraceud daemon logged.
trace event function
The class of NightTrace functions that provide information about trace events. They
operate on either the qualified event specified to that function or, if unspecified, the
current trace event. Trace event functions include multi-event functions.
trace event ID
An integer that identifies a trace event. User trace event IDs are in the range
0-4095, inclusive. Kernel trace event IDs are in the range 4100-4300, inclusive.
trace event tag
A symbolic name mapped to a numeric trace event ID in an event-map file.
trace point
A place of interest in the source code. In user tracing, at each trace point in your
application you call a trace event logging routine to log a trace event, possibly with
additional data describing part of your program’s state at that time. Kernel trace
points and trace events are already defined and embedded in the kernel source.
trough
The graphic part of a scroll bar that holds the slider.
vector table
A pre-defined, dynamically generated string table in the vectors file. This string
table contains the interrupt and exception vector names associated with the system
on which the kernel tracing was performed.
View mode
The display page mode that allows you to see, search for, and summarize trace
event information in the message display area, the summary display area, and
display objects on the grid; create, edit, and configure macros, qualified events, and
qualified states. The other display-page mode is Edit mode.
widget
A window component, for example a scroll bar or push button.
window
A rectangular screen area that permits the display and/or entry of data. The NightTrace display utility consists of several windows.
Glossary-21
NightTrace Manual
window manager
The program that controls window placement, size, and operations.
wraparound mode
The mode that causes the ntraceud daemon to intentionally discard old events.
There are two forms of wraparound mode: buffer-wraparound and file-wraparound. The other ntraceud mode is expansive mode.
Glossary-22
Index
Symbols
.Xdefaults file 5-2, 5-8, B-1, B-5
.Xresources file 5-2, 5-8
/dev A-3
/dev/spl A-3
/etc/conf/mtune.d/trace A-2
/usr/bin/ntrace 5-3
/usr/bin/ntraceud 4-2
/usr/include/ntrace.h 2-1, 2-24, 4-23
/usr/lib/libntrace.a 2-24
/usr/lib/NightTrace/eventmap 5-11, 5-14, 11-6
/usr/lib/NightTrace/examples 2-25, 5-35
/usr/lib/NightTrace/examples/entry_exit.c 2-25
/usr/lib/NightTrace/examples/entry_exit_map 5-35
/usr/lib/NightTrace/examples/entry_exit_page 5-35
/usr/lib/NightTrace/tables 5-14, 5-16, 5-20, 5-20, 9-77,
9-78, 9-80, 10-8
/usr/lib/X11/fonts 5-8, 8-3, B-1
A
Ada language 1-3
compiling and linking 2-25
Ada task identifier 8-8, 9-10, 9-25, 9-40, 9-51, 9-64
Add push button 9-2
Apply push button 6-9, 6-12, 6-17, 8-10, 9-3, 10-3, 10-8
arg function 9-9, 9-20
arg_dbl function 9-21
arg1 function 5-19, 8-5, 9-9, 9-81, 10-7, 10-8
arg2 function 8-5, 9-12
avg function 9-72
B
Background Color configuration parameter 8-3, 8-9
Background Color field 8-3
Backward radio button 10-2
boolean table 5-16, 8-6
Box
CPU 11-10
last exception 11-13
last interrupt 11-12
last syscall 11-15
Node 11-11
running process 11-10
Buffer-wraparound mode 2-21, 4-4, 4-13, 4-17, 4-18,
A-1, A-4
Button
dimmed. see Button
disabled
disabled 5-27, 7-4
grayed out. see Button
disabled
C
C language 1-3
compiling and linking 2-25
source considerations 2-1
C thread identifier 8-8
Cancel push button 5-30, 5-31
Center push button 6-9
Clear push button 10-9, 10-10
clock_settime(3C) routine 2-1, C-1
clock_synchronize(1M) command 2-8
Close menu item 7-19, 10-10
Close push button 8-11, 9-2, 9-3, 10-4, 10-5
Color display 11-16, B-1, B-4
Column 5-29, 6-2, 6-3, 6-4, 7-5, 7-9, 7-13, 8-1, 9-7, B-4
moving 7-5
resizing 7-5
selecting 7-5
Comments
configuration file 5-12
event-map file 5-10
Common configuration parameters 8-1
Configuration file 5-9, 5-11
Configuration form 8-4, 8-10, 8-12, 8-13, 8-14, 8-16,
8-17, 8-19, 9-4
DataBox 8-13
DataGraph 8-17
Index-1
NightTrace Manual
EventGraph 8-16
Expression 9-2
GridLabel 8-12
Macro 9-6, 9-7
Qualified Event 9-81
Qualified State 9-83, 9-84
Ruler 8-19
StateGraph 8-14
Configuration form radio button
Text Gravity 8-4
Text Justify 8-3
Configuration parameters
Background Color 8-3, 8-9
common 8-1
CPU List 8-2, 8-6
End-Events 8-15
End-Expression 8-15
Event Color 8-15
Event List 8-2, 8-4
Expression 9-4, 9-7
Fill Style 8-17
Font 8-3
Fonts 8-9
Foreground Color 8-3, 8-9
If-Expression 8-2, 8-4
Lost Event Color 8-19
MacroDefinition 9-7
Mark Color 8-19
Maximum 8-18
Minimum 8-18
Name 8-2
Node List 8-3, 8-9
PID List 8-3, 8-7
QualifiedEvent 9-82, 9-83
QualifiedState 9-84, 9-85
Start-Events 8-15
Start-Expression 8-15
Text 8-12
Text Gravity 8-4, 8-10
Text Justify 8-3, 8-9
Then-Expression 8-2, 8-5, 9-4, 9-76, 9-78, 9-79,
9-80
TID List 8-3, 8-8
Configure menu 8-1
Configure push button 9-2
Configuring
display object 8-1
Conserving disk space 4-28, A-1, A-4
Constant string literals 5-18, 9-13, 9-77
Constant times 9-6
Content ... menu item 8-1
Context switch 11-1, 11-4
lines 11-11, 11-13, 11-15
Counters 7-13, 8-13
Index-2
cpp(1) command 2-24
CPU box 11-10
cpu function 8-5, 9-26
CPU List configuration parameter 8-2, 8-6
CPU List field 8-2, 9-81, 9-83, Glossary-14
CPU number
logical 8-6, 11-10
physical 11-10
Create menu 7-6, 7-8
Create mouse operation 7-6
crossref trace_flush_and_trace_trigger 4-17
Current time 6-2
Current Time field 6-7, 6-11, 6-13
Current time line 6-2, 6-2, 11-9, 11-12, 11-13
centering 6-9
manipulating 6-9
Cursor. see Text field
cursor
Cutoff 4-4, 4-5, 4-18, A-3, C-1
D
DataBox 5-29, 7-12, 8-13, 9-79, 9-82, 10-11, 11-10,
11-12, 11-13, 11-16, B-4
configuration form 8-13
using as a counter 7-13, 8-13
DataGraph 5-30, 6-4, 7-16, 8-17, 11-12, B-4
configuration form 8-17
Fill Style configuration parameter 8-17
Maximum configuration parameter 8-18
Minimum configuration parameter 8-18
Debugger
NightView 1-4, 2-1
Default Kernel Page menu item 5-27, 11-6
Default Page menu item 5-27, 5-28
Default push button 5-23
Delete menu item 7-18
Delete push button 9-2
Deselect All menu item 7-18
device table 5-17, 11-4, 11-17
device_nodename table 5-17, 11-18
df(1M) command 4-12, 4-14, A-2, A-3
Dialog box
File Selection 5-33
Macro 9-4, 9-6, B-3
Open Config File ... 5-30
Qualified Event 9-81, B-3
Qualified State 9-83, B-3
Read Event-Map File ... 5-31
Warning 5-32, 5-34, 7-19, B-3
Dialog box. see Window
Dimmed
Index
button. see Disabled
button
push button. see Disabled
push button
Dimmed field label 5-27
Dimmed label 5-27
Dimmed menu item. see Disabled menu item
Directory
/dev A-3
/etc/conf/mtune.d A-2
/usr/lib/NightTrace 5-11, 5-14, 5-16, 5-20, 9-77,
9-78, 9-80, 10-8, 11-6
/usr/lib/NightTrace/examples 2-25, 5-35
/usr/lib/X11/fonts 5-8, 8-3, B-1
Disabled button 5-27, 7-4
Disabled menu item 5-27, 7-4, 7-18, 10-10
Disabled push button 5-27, 7-4
Disabling
IPL usage 4-4, 4-9, 4-28, A-3
library routines 2-1, 2-16, 2-24
page locking 4-4, 4-11, 4-28, A-3
trace events 2-17, 4-4, 4-24
tracing 2-16, 2-24
Discarding trace events 2-21, A-1, A-4, C-1
Display
color 5-2, 11-16, B-1, B-4
monochrome 5-2, 7-14, B-1, B-4
DISPLAY environment variable 5-2
Display object 1-3, 5-1, 7-1, 7-8
Column 5-29, 6-2, 6-3, 6-4, 7-5, 7-9, 7-13, 8-1, 9-7,
B-4
configuring 8-1
creating 7-1, 7-5
DataBox 5-29, 7-12, 8-13, 9-79, 9-82, 10-11, 11-10,
11-12, 11-13, 11-16, B-4
DataGraph 5-30, 6-4, 7-16, 8-17, 11-12, B-4
EventGraph 5-30, 6-4, 7-15, 8-16, 9-7, B-4
GridLabel 5-29, 7-12, 8-12, 11-10, 11-11, B-4
loading 7-6
moving 5-22, 7-5, 7-7
overlapping 7-8
placement 5-22, 7-6
properties 7-9
resizing 5-22, 7-5, 7-7
Ruler 5-30, 6-9, 7-17, 8-19, A-1, B-4
selecting 7-5, 7-6
StateGraph 5-28, 5-29, 6-4, 7-14, 8-14, 9-7, 9-84,
10-12, 11-13, 11-16, B-4
usage flowchart 7-12
Display object configuration parameters
Background Color 8-3, 8-9
common 8-1
CPU List 8-2, 8-6
End-Events 8-15
End-Expression 8-15
Event Color 8-15
Event List 8-2, 8-4
Fill Style 8-17
Font 8-3, 8-9
Foreground Color 8-3, 8-9
If-Expression 8-2, 8-4
Lost Event Color 8-19
Mark Color 8-19
Maximum 8-18
Minimum 8-18
Name 8-2
Node List 8-3, 8-9
PID List 8-3, 8-7
Start-Events 8-15
Start-Expression 8-15
Text 8-12
Text Gravity 8-4, 8-10
Text Justify 8-3, 8-9
Then-Expression 8-2, 8-5, 9-4, 9-76, 9-78, 9-79,
9-80
TID List 8-3, 8-8
Display page 5-27, 6-2, 7-2, 11-6, B-2
X resources B-2
Display page area
grid 6-4, B-2
interval control area 6-11
interval push buttons 6-8
interval scroll bar 6-7, C-1
message display area 6-1, 6-4, 6-9, 6-14, 7-3, 7-7,
7-15, 7-16
Do Not Move Current Time radio button 10-3
Dotted area. see Grid
Duration
state 9-57
E
Edit menu 7-17
Edit mode 5-27, 6-1, 7-4
Editing operation
delete character 6-16
insert character 6-16
positioning 6-18
replace character 6-17
restore the default 6-17
undo 6-17
Enabling
trace events 2-17, 4-4, 4-26
End functions 9-45
end_arg function 9-47
Index-3
NightTrace Manual
end_arg_dbl function 9-47
end_cpu function 9-52
end_id function 9-46
end_lwpid function 9-50
end_node_id function 9-54
end_node_name function 9-56
end_num_args function 9-48
end_offset function 9-53
end_pid function 9-48
end_pid_table_name function 9-55
end_raw_pid function 9-49
end_task_id function 9-51
end_thread_id function 9-51
end_tid function 9-52
end_tid_table_name function 9-55
end_time function 9-54
End-Events configuration parameter 8-15
End-Events field 8-15, 9-7, 9-85
End-Expression configuration parameter 8-15
End-Expression field 8-15, 9-4, 9-7, 9-83, 10-7,
Glossary-14
Environment variable
DISPLAY 5-2
Event
gap 9-32
matches 8-6, 8-13, 9-33
qualified 9-81
summary type 10-12
tag. see Trace event
tag
Event Color configuration parameter 8-15
Event Color field 8-15
Event Count field 6-12, 6-13
Event End field 6-7, 6-12, 6-13
Event ID. see Trace event
ID
Event List configuration parameter 8-2, 8-4
Event List field 8-2, 9-83, 9-85, 10-5, 10-7
Event radio button 10-6
Event Start field 6-7, 6-11, 6-13
Event summary 10-11
event table 5-14, 8-5
Event. see Trace event
event_arg_dbl_summary table 5-20, 8-6
event_arg_summary table 5-20, 8-6, 10-8
event_gap function 9-32
event_matches function 8-13, 9-33
event_summary table 5-20, 8-6, 10-7
EventGraph 5-30, 6-4, 7-15, 8-16, 9-7, B-4
configuration form 8-16
Event-map file 2-13, 5-4, 5-9, 5-9, 5-15, 5-31, 5-34, 8-2,
11-6
eventmap file 5-11, 5-14, 11-6
Exception 5-5, 5-7, 11-3, 11-13, 11-17, 11-18, 11-20
Index-4
graph 11-13
reference 11-21
resumption 11-3, 11-13
suspension 11-3, 11-13
exec(2) service 2-7, 2-10
Exit menu item 5-32
Expansive mode 4-2, 4-4, 4-5, 4-12, 4-13, 4-14, A-1,
A-4
Expression configuration parameter 9-4, 9-7
Expression field 9-7
Expressions 9-4
constant string literals 5-18, 9-13, 9-77
functions 9-9
macros 5-9, 5-11, 5-27, 5-30, 7-18, 8-2
operands 9-5
operators 9-4
qualified events 5-9, 5-10, 5-11, 5-27, 5-30, 7-18,
8-4, 9-81
qualified states 5-9, 5-11, 5-27, 5-30, 7-18, 8-4,
9-83
Expressions menu 9-1
F
Field
Background Color 8-3
CPU List 8-2, 9-81, 9-83, Glossary-14
Current Time 6-7, 6-11, 6-13
editing operations 6-16
End-Events 8-15, 9-7, 9-85
End-Expression 8-15, 9-4, 9-7, 9-83, 10-7,
Glossary-14
Event Color 8-15
Event Count 6-12, 6-13
Event End 6-7, 6-12, 6-13
Event List 8-2, 9-83, 9-85, 10-5, 10-7
Event Start 6-7, 6-11, 6-13
Expression 9-7
File Name 5-33, 5-34
Filter 5-35
Filter-Expression 9-4, 10-7
Font 8-3
Foreground Color 8-3
If-Expression 8-2, 9-4, 9-7, 9-81, 9-83, 9-85, 10-7,
10-8, Glossary-14
Increment 6-7, 6-12, 6-14
Lost Event Color 8-19
MacroDefinition 9-7
Mark Color 8-19
Maximum 8-18
Minimum 8-18
Name 8-2
Index
No Event List 10-5
Node List 8-3, 9-81, 9-83, Glossary-14
PID List 8-3, 9-81, 9-83, Glossary-14
QualifiedEvent 9-82
QualifiedState 9-84
Start-Events 8-15, 9-7, 9-85
Start-Expression 8-15, 9-4, 9-7, 9-83, 10-8
Summary-Expression 9-4, 9-81, 10-7, 10-8, 10-11,
10-12
Text 8-12
Then-Expression 8-2
TID List 9-81, 9-83, Glossary-14
Time End 6-7, 6-11, 6-12, 10-3, 10-6
Time Length 6-11, 6-13
Time Start 6-7, 6-11, 6-12, 10-3, 10-6
Zoom Factor 6-12, 6-13
Field editing 6-16
multiple fields 6-14
single fields 6-12
Field label
dimmed 5-27, 7-4
File
.Xdefaults 5-2, 5-8, B-1, B-5
.Xresources 5-2, 5-8
/dev/spl A-3
/etc/conf/mtune.d/trace A-2
/usr/bin/ntrace 5-3
/usr/bin/ntraceud 4-2
/usr/include/ntrace.h 2-1, 2-24, 4-23
/usr/lib/libntrace.a 2-24
/usr/lib/NightTrace/eventmap 5-11, 5-14, 11-6
/usr/lib/NightTrace/examples/entry_exit.c 2-25
/usr/lib/NightTrace/examples/entry_exit_map 5-35
/usr/lib/NightTrace/examples/entry_exit_page 5-35
/usr/lib/NightTrace/tables 5-14, 5-16, 5-20, 5-20,
9-77, 9-78, 9-80, 10-8
configuration 5-9, 5-11
event-map 2-13, 5-4, 5-9, 5-9, 5-15, 5-31, 5-34, 8-2,
11-6
filter 5-35
NightTrace kernel trace event 5-5, 5-7, 5-27
rgb.txt 5-8, 8-3, 8-15, 8-19, B-1, B-5
trace event 1-5, 2-5, 4-1, 4-12, 4-13, 5-9, A-4
trace. see trace event
vectors 5-5, 5-15, 11-2, 11-17, 11-18
File menu 5-26, 7-18, 10-9
File Name field 5-33, 5-34
File Selection Dialog Box 5-31, 5-32, 5-33, 7-19, 10-10,
B-3
File system
NFS A-2, A-3, C-2
File-wraparound mode 4-4, 4-5, 4-12, A-1, A-4
Fill Style configuration parameter 8-17
Filter 5-35
Filter field 5-35
Filter-Expression field 9-4, 10-7
Finding. see Searching
Flushing shared memory buffer 2-20, 4-5, 4-13, 4-18,
4-21, 4-28, A-1, A-2
Font configuration parameter 8-3, 8-9
Font field 8-3
Fonts 5-8, 8-3, B-1
Foreground Color configuration parameter 8-3, 8-9
Foreground Color field 8-3
fork(2) service 2-7
Form
Configuration 8-4, 8-10, 8-12, 8-13, 8-14, 8-16,
8-17, 8-19, 9-2, 9-4
DataBox configuration 8-13
DataGraph configuration 8-17
EventGraph configuration 8-16
GridLabel configuration 8-12
Macro configuration 9-6, 9-7
Qualified Event configuration 9-81
Qualified State configuration 9-83, 9-84
Ruler configuration 8-19
Search 9-4, 10-2, B-3, C-1
StateGraph configuration 8-14
Summarize 9-4, 10-12, 10-14, B-3
Format
functions 9-75
format function 8-5, 9-4, 9-7, 9-80, 10-7, 10-8
Format table 5-9, 5-17, 9-79
event_arg_dbl_summary 5-20, 8-6
event_arg_summary 5-20, 8-6, 10-8
event_summary 5-20, 8-6, 10-7
get_format function 5-20, 8-6, 9-4, 9-7, 9-79,
10-7, 10-8
state_summary 5-20, 8-6, 10-7
Fortran language 1-3
compiling and linking 2-25
source considerations 2-2
Forward radio button 10-2
Functions 9-9
arg 9-9, 9-20
arg_dbl 9-21
arg1 5-19, 8-5, 9-9, 9-81, 10-7, 10-8
arg2 8-5, 9-12
avg 9-72
cpu 8-5, 9-26
end 9-45
end_arg 9-47
end_arg_dbl 9-47
end_cpu 9-52
end_id 9-46
end_lwpid 9-50
end_node_id 9-54
end_node_name 9-56
Index-5
NightTrace Manual
end_num_args 9-48
end_offset 9-53
end_pid 9-48
end_pid_table_name 9-55
end_raw_pid 9-49
end_task_id 9-51
end_thread_id 9-51
end_tid 9-52
end_tid_table_name 9-55
end_time 9-54
event_gap 9-32
event_matches 8-13, 9-33
format 9-75
format 8-5, 9-4, 9-7, 9-80, 10-7, 10-8
get_format 5-20, 8-6, 9-4, 9-7, 9-79, 10-7, 10-8
get_item 9-4, 9-77
get_string 5-17, 5-18, 5-19, 8-5, 9-4, 9-75
id 8-5, 9-19, 9-79, 9-81
lwpid 9-23
max 9-71, 10-7, 10-8
max_offset 9-73, 10-8
min 9-71, 10-7, 10-8
min_offset 9-73, 10-7, 10-8
multi-event 9-32
multi-state 9-56
node_id 9-28
node_name 9-30
num_args 9-21
offset 9-59
offset 5-19, 9-27
offset_arg 9-60
offset_arg_dbl 9-61
offset_cpu 9-66
offset_id 9-60, 9-73, 9-74
offset_lwpid 9-63
offset_node_id 9-67
offset_node_name 9-68
offset_num_args 9-61
offset_pid 9-62
offset_pid_table_name 9-67
offset_process_name 9-69
offset_raw_pid 9-63
offset_task_id 9-64
offset_task_name 9-69
offset_thread_id 9-64
offset_thread_name 9-70
offset_tid 9-65
offset_tid_table_name 9-68
offset_time 9-66
pid 8-5, 8-7, 9-22, 9-79
pid_table_name 9-29
process_name 9-7, 9-30
raw_pid 9-23
start 9-34
Index-6
start_arg 9-35
start_arg_dbl 9-36
start_cpu 9-41
start_id 9-9, 9-35
start_lwpid 9-39
start_node_id 9-43
start_node_name 9-45
start_num_args 9-37
start_offset 9-42
start_pid 9-37
start_pid_table_name 9-44
start_raw_pid 9-38
start_task_id 9-40
start_thread_id 9-39
start_tid 9-41
start_tid_table_name 9-44
start_time 9-42
state_dur 9-57
state_gap 9-9, 9-57
state_matches 9-58
state_status 9-58, 9-85
sum 9-72
summary 9-4, 9-70
summary_matches 9-74, 10-8
table 9-75
task_id 9-25
task_name 9-31
thread_id 9-24
thread_name 9-32
tid 8-6, 8-8, 9-25
tid_table_name 9-29
time 9-27, 9-83
trace event 9-19
G
Gap
event 9-32
state 9-57
get_format function 5-20, 8-6, 9-4, 9-7, 9-79, 10-7,
10-8
get_item function 9-4, 9-77
get_string function 5-17, 5-18, 5-19, 8-5, 9-4, 9-75
Global process identifier 7-8, 8-5, 8-7, 9-10, 9-22, 9-37,
9-48, 9-62, 10-4, 10-6, 11-2
Global Search radio button 10-3
Global Window area
message display area 5-10, 5-25
Graph
data 5-30, 6-4, 7-16, 11-12
event 5-30, 6-4, 7-15, 9-7
exception 11-13
Index
interrupt 11-12
state 5-28, 5-29, 6-4, 7-14, 9-7, 9-84, 10-12, 11-13,
11-16
syscall 11-15
Graphical user interface 5-1, B-1
resources 11-16
Grayed out button. see Disabled button
Grid 6-4, B-2
GridLabel 5-29, 7-12, 8-12, 11-10, 11-11, B-4
configuration form 8-12
Text configuration parameter 8-12
GridObject B-4
GUI. see Graphical user interface
failure to attach 2-8
use 4-9
K
Kernel
buffer allotment A-2
display page 5-27, 11-6
NightTrace trace event file 5-5, 5-7, 5-27
Kernel tracing 1-1, 5-15, 8-2, 8-6, 11-1
L
H
Hardclock interrupts 5-7, 11-12, 11-20
Help
ntrace 5-4
ntraceud 4-7
Help menu 5-33
hf77(1) command 2-2
I
Iconified window 5-22
iconnect(3C) routine 11-19
id function 8-5, 9-19, 9-79, 9-81
idtune(1M) command 4-14, 4-16, A-2
If-Expression configuration parameter 8-2, 8-4
If-Expression field 8-2, 9-4, 9-7, 9-81, 9-83, 9-85, 10-7,
10-8, Glossary-14
Increment field 6-7, 6-12, 6-14
Inter-process communication 2-4
Interrupt 5-5, 11-1, 11-2, 11-12, 11-17, 11-18, 11-19,
11-20
device-related 11-20
graph 11-12
hardclock 5-7, 11-12, 11-20
non-device-related 11-19
user-level 4-9, 4-11
Interval 1-6, 6-1
control area 6-11
push buttons 6-8
scroll bar 6-7, C-1
Interval Manipulation radio buttons 10-3
Interval radio button 10-6
Interval Search radio button 10-3
IPL register
disabling 4-9
Label
dimmed 5-27, 7-4
Language
Ada 1-3, 2-25
C 1-3, 2-1, 2-25
Fortran 1-3, 2-2, 2-25
Last exception box 11-13
Last interrupt box 11-12
Last syscall box 11-15
libntrace.a 2-24
Library routines 2-1
disabling 2-1
overloading in Ada 2-2
return values 2-1
trace_close_thread 2-22
trace_disable 2-16, 4-24
trace_disable_all 2-16, 2-24
trace_disable_range 2-16, 4-24
trace_enable 2-16, 4-26
trace_enable_all 2-16
trace_enable_range 2-16, 4-26
trace_end 2-7, 2-20, 2-23, 4-4, 4-17, 4-21
trace_event 2-11, 7-8
trace_event_arg 2-11
trace_event_dbl 2-11
trace_event_flt 2-11
trace_event_four_arg 2-11
trace_event_two_dbl 2-11
trace_event_two_flt 2-11
trace_flush 2-20, 4-4, 4-5, 4-13, 4-14, 4-17,
4-28, A-2, A-3
trace_open_thread 2-9, 2-15, 2-18, 2-22, 6-4,
7-17, 8-3
trace_start 2-5, 2-10, 2-15, 2-18, 2-23, 4-1,
4-28, C-1
trace_trigger 2-20, 4-4, 4-17, A-2, A-3, A-4
Lightweight process identifier 8-7, 9-10, 9-23, 9-39,
Index-7
NightTrace Manual
9-50, 9-63
Loading
trace event 5-7, A-5
Locating. see Searching
Logging
trace event 1-3, 1-4, 4-12, 4-13, 4-24, 4-26, A-4,
C-1
Loss
trace event 2-15, 2-21, 4-16, 4-28, 7-17, 8-19, A-1,
C-1
Lost Event Color configuration parameter 8-19
Lost Event Color field 8-19
LWPID 8-7, 9-10, 9-23, 9-39, 9-50, 9-63
lwpid function 9-23
M
Macro
Configuration form 9-6, 9-7
dialog box 9-6
Expression configuration parameter 9-4, 9-7
MacroDefinition configuration parameter 9-7
MacroDefinition configuration parameter 9-7
MacroDefinition field 9-7
Macros 5-9, 5-11, 5-27, 5-30, 7-18, 8-2, 9-81
Map file. see Event-map file
Mark
inside Ruler 7-17, 8-19
manipulating 6-9
push button 6-9
representation 6-9
Mark Color configuration parameter 8-19
Mark Color field 8-19
Matches
event 8-6, 8-13, 9-33
state 8-6, 9-58
summary 9-74
max function 9-71, 10-7, 10-8
max_offset function 9-73, 10-8
Maximum configuration parameter 8-18
Maximum field 8-18
Maximum value 8-18, 9-71, 9-73
Memory size 4-4, 4-5, 4-16, A-3, C-1
Menu
Configure 8-1
Create 7-6, 7-8
Edit 7-17
Expressions 9-1
File 5-26, 7-18, 10-9
Help 5-33
Tools 10-1, 10-5
Menu item
Index-8
Close 7-19, 10-10
Content ... 8-1
Default Kernel Page 5-27, 11-6
Default Page 5-27, 5-28
Delete 7-18
Deselect All 7-18
desensitized 5-27, 7-19
dimmed. see Menu item
disabled
disabled 5-27, 7-4, 7-18, 10-10
Exit 5-32
New Page 5-27
Open Config File ... 5-12, 5-27, 5-30, 5-36
Read Event-Map File ... 5-10, 5-31, 5-36
Save 7-18
Save As ... 7-19
Save Text 10-10
Save Text As ... 10-10
Search ... 10-1
Select All 7-18
Summarize ... 10-5
Message display area 5-10, 5-25, 6-1, 6-4, 6-14, 7-3, 7-7,
7-15, 7-16
statistics 6-9
min function 9-71, 10-7, 10-8
min_offset function 9-73, 10-7, 10-8
Minimum configuration parameter 8-18
Minimum field 8-18
Minimum value 8-18, 9-71, 9-73
Mode
buffer-wraparound 2-21, 4-4, 4-13, 4-17, 4-18, A-1,
A-4
Edit 5-27, 6-1, 7-4
expansive 4-2, 4-4, 4-5, 4-12, 4-13, 4-14, A-1, A-4
file-wraparound 4-4, 4-5, 4-12, A-1, A-4
radio buttons 7-3
View 5-28, 6-1, 6-6, 7-4, 9-7, 10-1, 11-6
Monochrome display 5-2, 7-14, B-1, B-4
Motif 1-7, 5-2
Mouse
pointer shapes 5-22
Mouse button
1 5-21, 6-2, 6-3, 6-8, 6-9, 6-16, 7-5, 7-6
2 6-3, 6-4, 6-8, 6-9, 6-16, 7-5, 7-7, 7-15, 7-16
3 6-3, 6-4, 6-10, 6-16, 7-5, 7-7, 7-16
Mouse operation
create 7-6
move 7-7
resize 7-7
select 7-6
Move mouse operation 7-7
mpadvise(3C) routine A-4
Multi-event functions 9-32
Multi-state functions 9-56
Index
N
Name configuration parameter 8-2
Name field 8-2
name_pid table 5-16, 11-17
name_tid table 5-16
New Page menu item 5-27
Next push button 10-3, 10-5
NFS file system A-2, A-3, C-2
NightStar tool kit 1-1
NightTrace
environment defaults 4-2
product 1-1
NightTrace thread identifier 7-8, 8-5, 8-6, 8-8, 9-10,
9-25, 9-41, 9-52, 9-65, 10-4, 10-6
NightView debugger 1-4, 2-1
No Event List field 10-5
Node box 11-11
Node identifer 9-28
Node identifier
ending trace event 9-54
offset 9-67
starting trace event 9-43
Node List configuration parameter 8-3, 8-9
Node List field 8-3, 9-81, 9-83, Glossary-14
Node name 9-30
ending trace event 9-56
ordinal trace event 9-68
starting trace event 9-45
node_id function 9-28
node_name function 9-30
node_name table 5-16, 11-17
NT_ASSOC_PID 6-4
NT_ASSOC_TID 6-4
NT_CONTINUE 2-9, 2-13, 4-16, 5-6
NT_M_BUFFERWRAP. see Buffer-wraparound mode
NT_M_DEFAULT. see Expansive mode
NT_M_FILEWRAP. see File-wraparound mode
ntrace 1-3, 5-1
format tables 5-9, 5-17
functions 9-9
invoking 5-3
notation conventions 5-24
operands 9-5
operators 9-4
performance considerations 5-7, 10-2, A-5
string tables 5-9, 5-13
viewing strategy 6-5
ntrace field
Background Color 8-3
CPU List 8-2, 9-81, 9-83, Glossary-14
Current Time 6-7, 6-11, 6-13
End-Events 8-15, 9-7, 9-85
End-Expression 8-15, 9-4, 9-7, 9-83, 10-7,
Glossary-14
Event Color 8-15
Event Count 6-12, 6-13
Event End 6-7, 6-12, 6-13
Event List 8-2, 9-83, 9-85, 10-5, 10-7
Event Start 6-7, 6-11, 6-13
Expression 9-7
File Name 5-33, 5-34
Filter 5-35
Font 8-3
Foreground Color 8-3
If-Expression 8-2, 9-4, 9-7, 9-81, 9-83, 9-85, 10-7,
10-8, Glossary-14
Increment 6-7, 6-12, 6-14
Lost Event Color 8-19
MacroDefinition 9-7
Mark Color 8-19
Maximum 8-18
Minimum 8-18
Name 8-2
No Event List 10-5
Node List 8-3, 9-81, 9-83, Glossary-14
PID List 8-3, 9-81, 9-83, Glossary-14
QualifiedEvent 9-82
QualifiedState 9-84
Start-Events 8-15, 9-7, 9-85
Start-Expression 8-15, 9-4, 9-7, 9-83, 10-8
Text 8-12
Then-Expression 8-2
TID List 9-81, 9-83, Glossary-14
Time End 6-7, 6-11, 6-12, 10-3, 10-6
Time Length 6-11, 6-13
Time Start 6-7, 6-11, 6-12, 10-3, 10-6
Zoom Factor 6-12, 6-13
ntrace functions 9-9
ntrace macros 5-9, 5-11, 5-27, 5-30, 7-18, 8-2
ntrace mode 7-3
Edit 5-27, 6-1, 7-4
radio buttons 7-3
View 5-28, 6-1, 6-6, 7-4, 9-7, 10-1, 11-6
ntrace option
-end (load events before constraint) 5-7, A-5
-filestats (list statistics and trace events) 5-6, 5-26,
A-1
-flat (set flat color) 5-8
-help (help) 5-4
-listing (list trace events) 5-4, 5-10
-nohardclock (strip hardclock) 5-7, A-5
-process (load process’s events) 5-7, A-5
-start (load events after constraint) 5-7, A-5
-version (version) 5-4
-Xoption (use X(1) options) 5-8
ntrace qualified events 5-9, 5-10, 5-11, 5-27, 5-30, 7-18,
Index-9
NightTrace Manual
8-4, 9-81
ntrace qualified states 5-9, 5-11, 5-27, 5-30, 7-18, 8-4,
9-13, 9-35, 9-36, 9-37, 9-38, 9-39, 9-40, 9-41,
9-42, 9-43, 9-44, 9-45, 9-46, 9-47, 9-48, 9-49,
9-50, 9-51, 9-52, 9-53, 9-54, 9-55, 9-56, 9-57,
9-58, 9-59, 9-83
ntrace window
Configuration 8-4, 8-10, 8-12, 8-13, 8-14, 8-16,
8-17, 8-19, 9-2, 9-4
Display Page 5-27, 6-2, 11-6
File Selection Dialog Box 5-31, 5-32, 5-33, 7-19,
10-10, B-3
Global 5-3, 5-6, 5-10, 5-25, 11-6, A-1, B-2
iconified 5-22
Macro configuration 9-6, 9-7
Qualified Event configuration 9-81
Qualified State configuration 9-83, 9-84
resizing 5-24, 5-26
Search 9-4, 10-2, B-3, C-1
Summarize 9-4, 10-12, 10-14, B-3
ntrace window component
menu bar 5-23, 5-24
pull-down menu 5-23, 5-24
push button 5-23, 6-8
radio button 5-23
scroll bar 5-23
scroll region 5-23
text field 5-23
ntrace.h 2-1, 2-24, 4-23
ntraceud
buffer-full cutoff. see ntraceud
cutoff
cutoff 4-4, 4-5, 4-18, A-3, C-1
daemon 1-3, 4-1
flush mechanism 4-4
help 4-7
invoking 4-28
memory size 4-4, 4-5, 4-16, A-3, C-1
page-fault handling 4-4
performance considerations 4-1, 4-17, 4-18, A-1
quit running 4-21, 4-28, 4-29
reset 4-20
shared memory buffer size. see ntraceud
memory size
sleep interval 4-3, 4-4, 4-17
statistical information 4-22, A-1
timeout interval 4-4, 4-5, 4-17, A-3
trace event file size 4-4, 4-12
trace event logging 4-4
version information 4-8
ntraceud mode
buffer-wraparound 2-21, 4-4, 4-13, 4-17, 4-18, A-1,
A-4
Index-10
expansive 4-2, 4-4, 4-5, 4-12, 4-13, 4-14, A-1, A-4
file-wraparound 4-4, 4-5, 4-12, A-1, A-4
ntraceud option
-bufferwrap (buffer-wraparound mode) 4-4, 4-13,
4-17, 4-18, A-1, A-4
-cutoff (cutoff percentage) 4-4, 4-5, 4-18, A-3, C-1
-disable (disable logging) 4-4, 4-24
-enable (enable logging) 4-4, 4-26
-filewrap (file-wraparound mode) 4-4, 4-5, 4-12,
A-1, A-4
-help (help) 4-7
-ipldisable (do not set IPL) 4-4, 4-9, 4-28, A-3
-lockdisable (do not lock pages) 4-4, 4-11, 4-28,
A-3
-memsize (memory size) 4-4, 4-5, 4-16, A-3, C-1
-quit (quit running) 4-21, 4-29
-reset (reset ntraceud) 4-20
-stats (statistical information) 4-22, A-1
-timeout (timeout interval) 4-4, 4-5, 4-17, A-3
-version (version information) 4-8
num_args function 9-21
O
Object. see Display object
Offset 5-7, 6-4, 6-11, 6-13, 6-15, 7-8, 9-9, 9-12, 9-13,
9-59, 9-60, 9-61, 9-62, 9-63, 9-64, 9-65, 9-66,
9-67, 9-68, 9-69, 9-70, 10-4, 10-11, 10-13
offset function 5-19, 9-27
Offset functions 9-59
offset_arg function 9-60
offset_arg_dbl function 9-61
offset_cpu function 9-66
offset_id function 9-60, 9-73, 9-74
offset_lwpid function 9-63
offset_node_id function 9-67
offset_node_name function 9-68
offset_num_args function 9-61
offset_pid function 9-62
offset_pid_table_name function 9-67
offset_process_name function 9-69
offset_raw_pid function 9-63
offset_task_id function 9-64
offset_task_name function 9-69
offset_thread_id function 9-64
offset_thread_name function 9-70
offset_tid function 9-65
offset_tid_table_name function 9-68
offset_time function 9-66
Open Config File ... menu item 5-12, 5-27, 5-30, 5-36
Open push button 5-30
Operands
Index
constants 9-5
functions 9-9
macros 5-9, 5-11, 5-27, 5-30, 7-18, 8-2
qualified events 5-9, 5-10, 5-11, 5-27, 5-30, 7-18,
8-4, 9-81
qualified states 5-9, 5-11, 5-27, 5-30, 7-18, 8-4,
9-13, 9-35, 9-36, 9-37, 9-38, 9-39, 9-40,
9-41, 9-42, 9-43, 9-44, 9-45, 9-46, 9-47,
9-48, 9-49, 9-50, 9-51, 9-52, 9-53, 9-54,
9-55, 9-56, 9-57, 9-58, 9-59, 9-83
Operands in expressions 9-5
Operators in expressions 9-4
Options. see ntrace option
Options. see ntraceud option
Options. see System configuration option
P
P_PLOCK A-3
Page
configuration file 5-9, 5-11
default 5-27, 5-28
default kernel 5-27, 11-6
display 7-2, 11-6, B-2
lock disable 4-11
lock privilege 4-28, A-3
new 5-27
Parameters. see Configuration parameters
Performance considerations
ntrace 5-7, 10-2, A-5
ntraceud 4-1, 4-17, 4-18, A-1
PID 7-8, 8-5, 8-7, 9-10, 9-22, 9-37, 9-48, 9-62, 10-4,
10-6, 11-2
pid function 8-5, 8-7, 9-22, 9-79
PID List configuration parameter 8-3, 8-7
PID List field 8-3, 9-81, 9-83, Glossary-14
pid table 5-15, 8-5, 11-18
PID table name 9-29
pid_nodename table 5-16, 11-17
pid_table_name function 9-29
Pointer shapes 5-22
Pop-up window
Open B-3
Read B-3
SaveAs 7-19, B-3
SaveTextAs 10-10, B-3
Pop-up window. see Dialog box
Pre-defined tables 5-14, 5-20, 11-4, 11-16
Prev push button 10-3, 10-5
printf(3S) routine 5-11, 5-18, 9-80
Privilege
page lock 4-28, A-3
Process
ntrace 5-7
Process box 11-10
Process identifier
ending trace event 9-55
offset 9-67
starting trace event 9-44
Process identifier table name 9-29
Process name 9-30
ordinal trace event 9-69
process_name function 9-7, 9-30
Pull-down menu. see Window component
pull-down menu
Push button
Add 9-2
Apply 6-9, 6-12, 6-17, 8-10, 9-3, 10-3, 10-8
Cancel 5-30, 5-31
Center 6-9
Clear 10-9, 10-10
Close 8-11, 9-2, 9-3, 10-4, 10-5
Configure 9-2
default 5-23
Delete 9-2
dimmed. see Push button
disabled
disabled 5-27, 7-4
grayed out. see Push button
disabled
Mark 6-9
Next 10-3, 10-5
on configuration form 8-10
Open 5-30
Prev 10-3, 10-5
Read 5-31
Refresh 6-10
Reset 6-9, 8-11, 9-3, 10-3, 10-8
Restore 8-11, 9-3, 10-9
Search 10-4
Summarize 10-6, 10-9, 10-10
Zoom In 6-10, 6-12
Zoom Out 6-10, 6-12, C-1
Zoom Region 6-10
Q
Qualified events 5-9, 5-10, 5-11, 5-27, 5-30, 7-18, 8-4,
9-81, 9-81
Configuration form 9-81
dialog box 9-81
QualifiedEvent configuration parameter 9-82, 9-83
Qualified states 5-9, 5-11, 5-27, 5-30, 7-18, 8-4, 9-13,
Index-11
NightTrace Manual
9-35, 9-36, 9-37, 9-38, 9-39, 9-40, 9-41, 9-42,
9-43, 9-44, 9-45, 9-46, 9-47, 9-48, 9-49, 9-50,
9-51, 9-52, 9-53, 9-54, 9-55, 9-56, 9-57, 9-58,
9-59, 9-83, 9-83
Configuration form 9-83, 9-84
dialog box 9-83
QualifiedState configuration parameter 9-84, 9-85
QualifiedEvent configuration parameter 9-82, 9-83
QualifiedEvent field 9-82
QualifiedState configuration parameter 9-84, 9-85
QualifiedState field 9-84
R
Radio button
Backward 10-2
Do Not Move Current Time 10-3
Edit mode 7-3, 7-18
Event 10-6
Forward 10-2
Global Search 10-3
Interval 10-6
Interval Manipulation 10-3
Interval Search 10-3
Region 10-6
Scroll Current Time to Event 10-3
Search Constraints 10-2
Search Direction 10-2
State 10-6
Summary Range 10-6
Summary Type 10-6
Text Gravity 8-4
Text Justify 8-3
Trace-Event File 10-6
View mode 7-3
Zoom to Include Event 10-3
Raw PID 8-7, 8-8
raw PID 9-10, 9-23, 9-38, 9-49, 9-63
raw_pid function 9-23
Read Event-Map File ... menu item 5-10, 5-31, 5-36
Read push button 5-31
Record. see Trace event
Refresh push button 6-10
Region radio button 10-6
Reset push button 6-9, 8-11, 9-3, 10-3, 10-8
Resize mouse operation 7-7
Resizing
display objects 5-22, 7-5, 7-7
windows 5-24, 5-26
Restore push button 8-11, 9-3, 10-9
Return values 2-1
rgb.txt file 5-8, 8-3, 8-15, 8-19, B-1, B-5
Index-12
Ruler 5-30, 6-9, 7-17, 8-19, A-1, B-4
configuration form 8-19
Lost Event Color configuration parameter 8-19
Mark Color configuration parameter 8-19
run(1) command A-4
Running process box 11-10
S
Save As ... menu item 7-19
Save menu item 7-18
Save Text As ... menu item 10-10
Save Text menu item 10-10
Scroll bar 5-23, 6-7, C-1
Scroll Current Time to Event radio button 10-3
Scroll region 5-23
Search ... menu item 10-1
Search Constraints radio buttons 10-2
Search Direction radio buttons 10-2
Search form 9-4, 10-2, B-3, C-1
default search behavior 10-4
Search form push buttons
Apply 10-3
Close 10-4, 10-5
Next 10-3, 10-5
Prev 10-3, 10-5
Reset 10-3
Search 10-4
Search form radio buttons
Backward 10-2
Do Not Move Current Time 10-3
Forward 10-2
Global Search 10-3
Interval Manipulation 10-3
Interval Search 10-3
Scroll Current Time to Event 10-3
Search Constraints 10-2
Search Direction 10-2
Zoom to Include Event 10-3
Search push button 10-4
Searching
trace event 1-3, 1-6, 6-1, 6-5, 10-1, 10-1
Select All menu item 7-18
Select mouse operation 7-6
Shared memory
buffer 1-5, 4-13, 4-16
failure to attach 2-8
flushing 2-20, 4-5, 4-13, 4-18, A-1, A-2
SHMMAX 4-14, 4-16, A-2
Start functions 9-34
start_arg function 9-35
start_arg_dbl function 9-36
Index
start_cpu function 9-41
start_id function 9-9, 9-35
start_lwpid function 9-39
start_node_id function 9-43
start_node_name function 9-45
start_num_args function 9-37
start_offset function 9-42
start_pid function 9-37
start_pid_table_name function 9-44
start_raw_pid function 9-38
start_task_id function 9-40
start_thread_id function 9-39
start_tid function 9-41
start_tid_table_name function 9-44
start_time function 9-42
Start-Events configuration parameter 8-15
Start-Events field 8-15, 9-7, 9-85
Start-Expression configuration parameter 8-15
Start-Expression field 8-15, 9-4, 9-7, 9-83, 10-8
State 1-2, 2-14, 7-8, 7-14, 8-15, 11-12, 11-13
duration 9-57
gap 9-57
matches 8-6, 9-58
qualified 9-83
summary type 10-14
State radio button 10-6
State summary 10-12
state_dur function 9-57
state_gap function 9-9, 9-57
state_matches function 9-58
state_status function 9-58, 9-85
state_summary table 5-20, 8-6, 10-7
StateGraph 5-28, 5-29, 6-4, 7-14, 8-14, 9-7, 9-84, 10-12,
11-13, 11-16, B-4
configuration form 8-14
End-Events configuration parameter 8-15
End-Expression configuration parameter 8-15
Start-Events configuration parameter 8-15
Start-Expression configuration parameter 8-15
Statistics 10-1
multi-event 9-32
multi-state 9-56
ntrace 5-6, 6-9, A-1
ntraceud 4-22, A-1
summary 9-4, 9-70
String table 5-9, 5-13, 9-75, 9-77
boolean 5-16, 8-6
device 5-17, 11-4, 11-17
device_nodename 5-17, 11-18
event 5-14, 8-5
get_item function 9-4, 9-77
get_string function 5-17, 5-18, 5-19, 8-5, 9-4,
9-75
name_pid 5-16, 11-17
name_tid 5-16
node_name 5-16, 11-17
pid 5-15, 8-5, 11-18
pid_nodename 5-16, 11-17
syscall 5-17, 8-6, 11-4, 11-17, 11-21
syscall_nodename 5-17, 11-18
tid 5-15, 8-6
tid_nodename 5-16
vector 5-17, 8-6, 11-2, 11-3, 11-17, 11-19
vector_nodename 5-17, 11-18
sum function 9-72
Summarize ... menu item 10-5
Summarize form 9-4, 10-12, 10-14, B-3
Event summary type 10-12
State summary type 10-14
summary display area 10-7, 10-9, 10-10, 10-11,
10-12
Summarize form fields 10-6
Filter-Expression 9-4, 10-7
Summary-Expression 9-4, 9-81, 10-7, 10-8, 10-11,
10-12
Summarize form push buttons
Apply 10-8
Clear 10-9, 10-10
Reset 10-8
Restore 10-9
Summarize 10-6, 10-9, 10-10
Summarize form radio buttons
Event 10-6
Interval 10-6
Region 10-6
State 10-6
Summary Range 10-6
Summary Type 10-6
Trace-Event File 10-6
Summarize push button 10-6, 10-9, 10-10
Summarizing
trace event 1-3, 10-5
trace session 1-6
Summary
event 10-11
matches 9-74, 10-8
state 10-12
Summary display area 10-7, 10-9, 10-10, 10-11, 10-12
Summary functions 9-4, 9-70
Summary Range radio buttons 10-6
Summary Type radio buttons 10-6
summary_matches function 9-74, 10-8
Summary-Expression field 9-4, 9-81, 10-7, 10-8, 10-11,
10-12
Syscall 11-4, 11-15, 11-17
graph 11-15
resumption 11-4
suspension 11-4, 11-15
Index-13
NightTrace Manual
syscall table 5-17, 8-6, 11-4, 11-17, 11-21
syscall_nodename table 5-17, 11-18
System call 11-4, 11-15, 11-17
T
Table
boolean 5-16, 8-6
device 5-17, 11-4, 11-17
device_nodename 5-17, 11-18
event 5-14, 8-5
event_arg_dbl_summary 5-20, 8-6
event_arg_summary 5-20, 8-6, 10-8
event_summary 5-20, 8-6, 10-7
format 5-9, 5-17, 9-79
functions 9-75
name_pid 5-16, 11-17
name_tid 5-16
node_name 5-16, 11-17
pid 5-15, 8-5, 11-18
pid_nodename 5-16, 11-17
pre-defined 5-14, 5-20, 11-4, 11-16
state_summary 5-20, 8-6, 10-7
string 5-9, 5-13, 9-75, 9-77
syscall 5-17, 8-6, 11-4, 11-17, 11-21
syscall_nodename 5-17, 11-18
tid 5-15, 8-6
tid_nodename 5-16
vector 5-17, 8-6, 11-2, 11-3, 11-17, 11-19
vector_nodename 5-17, 11-18
tables file 5-14, 5-16, 5-20, 5-20, 9-77, 9-78, 9-80, 10-8
Task name 9-31
ordinal trace event 9-69
task_id function 9-25
task_name function 9-31
Text configuration parameter 8-12
Text field 8-12
Background Color 8-3
CPU List 8-2, 9-81, 9-83, Glossary-14
Current Time 6-7, 6-11, 6-13
cursor 6-16
editing operations 6-16
End-Events 8-15, 9-7, 9-85
End-Expression 8-15, 9-4, 9-7, 9-83, 10-7,
Glossary-14
Event Color 8-15
Event Count 6-12, 6-13
Event End 6-7, 6-12, 6-13
Event List 8-2, 9-83, 9-85, 10-5, 10-7
Event Start 6-7, 6-11, 6-13
Expression 9-7
File Name 5-33, 5-34
Index-14
Filter 5-35
Filter-Expression 9-4, 10-7
Font 8-3
Foreground Color 8-3
If-Expression 8-2, 9-4, 9-7, 9-81, 9-83, 9-85, 10-7,
10-8, Glossary-14
Increment 6-7, 6-12, 6-14
Lost Event Color 8-19
MacroDefinition 9-7
Mark Color 8-19
Maximum 8-18
Minimum 8-18
Name 8-2
No Event List 10-5
Node List 8-3, 9-81, 9-83, Glossary-14
PID List 8-3, 9-81, 9-83, Glossary-14
QualifiedEvent 9-82
QualifiedState 9-84
Start-Events 8-15, 9-7, 9-85
Start-Expression 8-15, 9-4, 9-7, 9-83, 10-8
Summary-Expression 9-4, 9-81, 10-7, 10-8, 10-11,
10-12
Text 8-12
Then-Expression 8-2
TID List 9-81, 9-83, Glossary-14
Time End 6-7, 6-11, 6-12, 10-3, 10-6
Time Length 6-11, 6-13
Time Start 6-7, 6-11, 6-12, 10-3, 10-6
Zoom Factor 6-12, 6-13
Text Gravity configuration parameter 8-4, 8-10
Text Gravity radio button 8-4
Text Justify configuration parameter 8-3, 8-9
Text Justify radio button 8-3
Then-Expression configuration parameter 8-2, 8-5, 9-4,
9-76, 9-78, 9-79, 9-80
Then-Expression field 8-2
Thread event
ordinal 9-68
Thread identifier
ending trace event 9-55
offset 9-68
starting trace event 9-44
Thread identifier table name 9-29
Thread name 9-32
ordinal trace event 9-70
Thread names 5-4, 5-15, 8-3, 8-8, 10-4, 10-6
thread_id function 9-24
thread_name function 9-32
TID 7-8, 8-5, 8-6, 8-8, 9-10, 9-25, 9-41, 9-52, 9-65,
10-4, 10-6
tid function 8-6, 8-8, 9-25
TID List configuration parameter 8-3, 8-8
TID List field 9-81, 9-83, Glossary-14
tid table 5-15, 8-6
Index
TID table name 9-29
tid_nodename table 5-16
tid_table_name function 9-29
Time End field 6-7, 6-11, 6-12, 10-3, 10-6
time function 9-27, 9-83
Time Length field 6-11, 6-13
Time Start field 6-7, 6-11, 6-12, 10-3, 10-6
Timeout interval 4-4, 4-5, 4-17, A-3
Times
constant 9-6
Timestamp 1-2, 5-4, 6-7, 9-27, 9-42, 9-54, 9-66
Tools menu 10-1, 10-5
TR_BUFFER_COUNT tunable parameter A-2, C-2
TR_EXCEPTION_ENTRY trace event 11-3
TR_EXCEPTION_EXIT trace event 11-3
TR_EXCEPTION_RESUME trace event 11-3
TR_EXCEPTION_SUSPEND trace event 11-3
TR_INTERRUPT_ENTRY trace event 11-2
TR_INTERRUPT_EXIT trace event 11-3
TR_PAGEFLT_ADDR trace event 11-5, 11-13
TR_PROTFLT_ADDR trace event 11-5, 11-13
TR_SWITCHIN trace event 11-2
TR_SYSCALL_ENTRY trace event 11-4
TR_SYSCALL_EXIT trace event 11-4
TR_SYSCALL_RESUME trace event 11-4
TR_SYSCALL_SUSPEND trace event 11-4
Trace event 1-2, 7-8
analysis 5-1
arguments 2-13, 5-4, 5-10, 5-12, 5-30, 7-8, 7-9,
7-16, 8-5, 9-20, 9-21, 9-35, 9-36, 9-37,
9-47, 9-48, 9-60, 9-61, 10-9
average size 4-16
context switch 11-2
disabling 2-17, 4-4, 4-24
discarding 2-21, A-1, A-4, C-1
display utility 5-1
enabling 2-17, 4-4, 4-26
exception 11-3
file 1-5, 2-5, 4-1, 5-9
file size 4-12, 4-13, A-4
functions 9-19
ID 1-2, 2-13, 2-17, 4-24, 4-26, 5-4, 5-9, 5-10, 5-14,
5-29, 5-31, 8-2, 8-4, 8-5, 10-4, 10-6, C-1
information 7-15, 9-19
interrupt 11-2
loading 5-7, A-5
logging 1-3, 1-4, 4-12, 4-13, 4-24, 4-26, A-4, C-1
loss 2-15, 2-21, 4-16, 4-28, 7-17, 8-19, A-1, C-1
NightTrace kernel file 5-5, 5-7, 5-27
node identifer (ending trace event) 9-54
node identifer (offset) 9-67
node identifer (starting trace event) 9-43
node identifier 9-28
node name 9-30
node name (ending trace event) 9-56
node name (ordinal trace event) 9-68
node name (starting trace event) 9-45
NT_ASSOC_PID 6-4
NT_ASSOC_TID 6-4
NT_CONTINUE 2-9, 2-13, 4-16, 5-6
offset 9-59
offset. see Offset
ordinal 9-67, 9-68, 9-69, 9-70
ordinal number. see Offset
PID table name 9-29
process identifer (ending trace event) 9-55
process identifer (offset) 9-67
process identifer (starting trace event) 9-44
process identifier table name 9-29
process name 9-30
process name (ordinal trace event) 9-69
searching 1-3, 1-6, 6-1, 6-5, 10-1, 10-1
summarizing 1-3, 10-5
syscall 11-4
tag 5-4, 5-9, 5-9, 5-10, 5-14, 5-29, 5-31, 10-4, 10-6,
11-6
task name 9-31
task name (ordinal trace event) 9-69
thread identifer (ending trace event) 9-55
thread identifer (offset) 9-68
thread identifer (starting trace event) 9-44
thread identifier table name 9-29
thread name 9-32
thread name (ordinal trace event) 9-70
TID table name 9-29
timestamp 1-2, 5-4, 9-27, 9-42, 9-54, 9-66
timing distortion 2-21, 4-17
TR_EXCEPTION_ENTRY 11-3
TR_EXCEPTION_EXIT 11-3
TR_EXCEPTION_RESUME 11-3
TR_EXCEPTION_SUSPEND 11-3
TR_INTERRUPT_ENTRY 11-2
TR_INTERRUPT_EXIT 11-3
TR_PAGEFLT_ADDR 11-5, 11-13
TR_PROTFLT_ADDR 11-5, 11-13
TR_SWITCHIN 11-2
TR_SYSCALL_ENTRY 11-4
TR_SYSCALL_EXIT 11-4
TR_SYSCALL_RESUME 11-4
TR_SYSCALL_SUSPEND 11-4
Trace event. see Event
Trace file. see Trace event file
Trace point 1-2, 1-4, 2-13, 5-9
trace_close_thread 2-22
trace_disable 2-16, 4-24
trace_disable_all 2-16, 2-24
trace_disable_range 2-16, 4-24
trace_enable 2-16, 4-26
Index-15
NightTrace Manual
trace_enable_all 2-16
trace_enable_range 2-16, 4-26
trace_end 2-7, 2-20, 2-23, 4-4, 4-17, 4-21
trace_event 2-11, 7-8
trace_event_arg 2-11
trace_event_dbl 2-11
trace_event_flt 2-11
trace_event_four_arg 2-11
trace_event_two_flt 2-11
trace_flush 2-20, 4-4, 4-5, 4-13, 4-14, 4-17, 4-28,
A-2, A-3
trace_open_thread 2-9, 2-15, 2-18, 2-22, 6-4,
7-17, 8-3
trace_start 2-5, 2-10, 2-15, 2-18, 2-23, 4-1, 4-28,
C-1
trace_trigger 2-20, 4-4, 4-17, A-2, A-3, A-4
Trace-Event File radio button 10-6
Tracing
disabling 2-16, 2-24
kernel 1-1, 5-15, 8-2, 8-6, 11-1
user 1-1
File Selection Dialog Box 5-31, 5-32, 5-33, 7-19,
10-10, B-3
Global 5-3, 5-6, 5-10, 5-25, 11-6, A-1, B-2
iconified 5-22
Macro configuration 9-6, 9-7
manager 5-22, 5-26, 6-11
Qualified Event configuration 9-81
Qualified State configuration 9-83, 9-84
resizing 5-24, 5-26
Search 9-4, 10-2, B-3, C-1
Summarize 9-4, 10-12, 10-14, B-3
Window component
menu bar 5-23, 5-24
pull-down menu 5-23, 5-24
push button 5-23, 6-8
radio button 5-23
scroll bar 5-23
scroll region 5-23
text field 5-23
Window. see Dialog box
X
U
umask(1) command 4-1
User tracing 1-1
User-level interrupts 4-9, 4-11
V
Variable
DISPLAY 5-2
vector table 5-17, 8-6, 11-2, 11-3, 11-17, 11-19
vector_nodename table 5-17, 11-18
vectors file 5-5, 5-15, 11-2, 11-17, 11-18
Version
ntrace 5-4
ntraceud 4-8
View mode 5-28, 6-1, 6-6, 7-4, 9-7, 10-1, 11-6
Viewing strategy
ntrace 6-5
W
Window
Configuration 8-4, 8-10, 8-12, 8-13, 8-14, 8-16,
8-17, 8-19, 9-2, 9-4
Display Page 5-27, 6-2, 11-6
Index-16
X resources
display page B-2
X Window System
desk accessories 1-7
options 5-8
resources 1-7, 11-16
X(1) utility 5-8
xmodmap(1) utility 5-21
xrdb(1) command B-1
xterm(1) utility 1-7, 5-8
Z
Zoom Factor field 6-12, 6-13
Zoom In push button 6-10, 6-12
Zoom Out push button 6-10, 6-12, C-1
Zoom Region push button 6-10
Zoom to Include Event radio button 10-3
Spine for 1.5” Binder
Volume Number (if any):
Helvetica, 24 pt, Bold
NightTrace
Product Name: 0.5" from
top of spine, Helvetica,
36 pt, Bold
Volume Name (if any):
Helvetica, 18 pt, Bold
Manual Title(s):
Helvetica, 10 pt, Bold,
centered vertically
within space above bar,
double space between
each title
Bar: 1" x 1/8" beginning
1/4" in from either side
Part Number: Helvetica,
6 pt, centered, 1/8" up
Manual
0890398