1
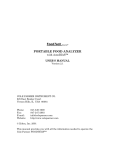
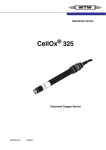
FoodTech
Calibration Software
for Windows™ 98 and up
Version 1.5
COLE-PARMER INSTRUMENT CO.
625 East Bunker Court
Vernon Hills, IL 60061
Phone:
Fax:
E-mail:
Website:
(800)323-4340
(847)247-2929
[email protected]
http://www.coleparmer.com
This manual provides you with all the information to operate the Cole-Parmer
FoodTech CP-50
FoodTech Calibration Software
2
Table of Contents
SECTION 1: GENERAL INFORMATION ........................................................................................ 3
SYSTEM REQUIREMENTS ......................................................................................................... 3
INSTALLING THE PROGRAM ...................................................................................................... 3
RUNNING THE PROGRAM ......................................................................................................... 3
SECTION 2: CALIBRATING A FOODTECH INSTRUMENT............................................................ 5
BEFORE BEGINNING ................................................................................................................. 6
STEP 1: CREATE AN OPTICAL DATA FILE AND COLLECT DATA FROM THE ANALYZER ......... 7
STEP 2: PLOT CURVES............................................................................................................. 9
STEP 3: OBTAIN LAB ANALYSIS FOR ALL CALIBRATION SAMPLES ....................................... 10
STEP 4: CREATE OR EDIT A CONSTITUENT DATA FILE ........................................................ 10
STEP 5: MERGE CONSTITUENT DATA FILE TO OPTICAL DATA FILE .................................... 11
STEP 6: FOODTECH REGRESSION ANALYSIS ....................................................................... 11
STEP 7: ENTER FINAL K’S ...................................................................................................... 13
STEP 8: CHECK ACCURACY ................................................................................................... 16
Please read this entire manual before beginning a calibration.
Examples are given in this manual for some of the FoodTech analyzers’ most
common applications. If you have questions about the recommended settings for a
product that is not mentioned, contact Cole-Parmer.
Phone:
Fax:
E-mail:
(800)323-4340
(847)247-2929
[email protected]
A note on the text: Throughout this manual, the Enter/Return key on the computer keyboard is
referred to as Return to distinguish it from the Enter button on the FoodTech
analyzer’s keypad.
FoodTech Calibration Software
3
Section 1: General Information
System Requirements
Windows™ 98 or above
VGA Color monitor
1 com port
3-1/2 inch disk drive
15 megabytes of hard drive space
printer
Installing the Program
Before installing the program, make sure you have closed all open Windows™
applications. From the Start menu, select Run. Insert Disk 1 of the Calibration Software
Program into your 3-1/2 inch disk drive. On the Command Line, type a: or b: (as
appropriate) setup.exe. Press Return or select OK. The computer will walk you through
the setup process, which requires little more than waiting patiently to insert Disk 2.
After installing the program, store the disks in a safe place in case of hard-drive failure
or accidental erasure.
Running the Program
Select FoodTech Calibration Software from the Programs menu. The following screen
will appear:
FoodTech Calibration Software
4
As with other Windows™ applications, you can access the menu bar with the mouse or
by pressing Alt and the underlined letter simultaneously. Shortcut keystrokes for some
of the options in each menu are listed to the right of the command when the menu
appears. The toolbar of shortcut buttons directly below the menu bar provides quick
access to some of the most commonly used commands. The right mouse button
accesses the Data menu when an optical data file is open.
File names should be no more than 8 characters long and consist only of letters and
numbers. The computer automatically assigns the following extensions to the files and
stores them in the DATA directory:
“.dt1” to optical data files
“.st1” to statistics files
“.con” to constituent data files
“.ks1” to K values files
“.zbk” to instrument settings files
Any optical data file can be viewed in two ways: Plot View or Grid View. The grid view
option is designed mainly for use by Cole-Parmer researchers. The plot view is the most
useful as it shows the curves of the sample readings. Whenever multiple samples are
graphed in plot view, you can click on any curve or point on the graph to determine the
sample’s ID number.
FoodTech Calibration Software
5
Section 2: Calibrating a FoodTech Instrument
After you become familiar with the process of calibrating a FoodTech instrument you will
be able to alter the order in which you perform the following tasks, but beginners should
follow this basic flowchart. The additional information you will need to perform each step
is given later in this section.
1. Create an optical data file and
collect data from the instrument.
3. Obtain laboratory analyses
for the calibration samples.
2. Plot the curves of the samples.
4. Create a constituent data file.
5. Merge constituent data file to optical data file.
6. Run a FoodTech Regression Analysis to
determine calibration constants (K values).
7. Enter the final K’s into the instrument.
8. Check the accuracy. If there is a problem,
adjust the bias or slope.
FoodTech Calibration Software
6
Before Beginning
Before beginning a calibration, you should have 100 to 300 samples of the product for
which you will be calibrating. Label these samples with FoodTech sample ID numbers
from the Calibration Numbering Setup Manual.
CUPS AVAILABLE for the FoodTech
The sliding window cup for the FoodTech includes the following:
Item/Stock #
Cup Frame/2672
Window/A0420-1
Window/A0420-2
Window/A0420-3
Window/A0420-4
Window/A0420-5
Quantity
1
2
2
2
2
1
The combination of these windows in cup frame #2672 produces a cup with a sample
thickness as indicated in the following table (rounded to nearest mm).
Shaded boxes indicate preferred window combinations.
Window #
A0420-1
A0420-2
A0420-3
A0420-4
A0420-5
A0420-1
15
14
13
12
8
A0420-2
14
13
12
11
7
A0420-3
13
12
10
9
6
A0420-4
12
11
9
8
5
A0420-5
8
7
6
5
The combination of these windows in cup frame #A0612 produces a cup for liquid and
slurries.
Window #
A0612-1
A0612-2
A0612-3
A0612-4
A0612-1
21
18
17
13
A0612-2
A0612-3
A0612-4
15
14
10
13
9
5
See next page for products that require the indicated cup size.
FoodTech Calibration Software
Wheat, Barley
Corn, Soybean
Milo/Sorghum
Flax, Mustard,
Soymeal
Canola, Rapeseed
Clamshell/
Multipurpose cup
7
Stock #
#2670
Standard Black molded cup (16mm)
#A0562
Black molded cup w/windows on
outside (24mm)
Use the chart on previous page to
make a 13mm cup with the sliding
windows.
Use the chart on previous page to
make a 10mm cup with the sliding
windows.
Use the chart on previous page to
make an 8mm cup with the sliding
windows.
#A0581
(Uses: slurry/liquid samples)
Step 1: Create an Optical Data File and Collect Data from the Analyzer
To collect data on calibration samples from the FoodTech analyzer, you will need
to
create a new optical data file (File, New, Optical Data) or
open an existing optical data file to which you wish to add additional samples.
Select Collect from the Data menu. Answer no to the questions, then the Collect
screen will appear:
Select the Options button. Connect the RS232 cable to one of the computer’s com
ports and to the instrument’s RS232 port (beside the AC adapter port).
Select the OK button on the Communication Options screen.
FoodTech Calibration Software
8
Ensure that the instrument is ready to communicate with the PC.
(Press SELECT, (down arrow) [Data Link], Enter)
Enter the FoodTech sample ID number from the Calibration Numbering Setup Manual
and select Collect or press Return. The computer screen will display “Attempting to
Connect” until it is successful in doing so. The screen will then prompt you to read a
sample. (For more information on each of these steps, see the User’s Manual that
came with your instrument.)
After the instrument has read the first sample in the new file, the Save As screen will
appear. Enter a file name and click OK.
The Collect screen will reappear. Enter the next sample number and repeat the above
steps. (The Save As screen will not reappear each time, as the computer automatically
saves additional data to the same file name.)
If you make a mistake while running a sample or if the curve of the sample appears
questionable (see examples of good and bad curves under Step 2: Plot Curves),
highlight the sample ID number under “Last __ samples collected” and select Cut.
Keep in mind: The samples do not all have to be run the same day; the file can be
saved and additional samples added later.
Temperature Variation during a Calibration
Because of temperature variations in the field, it is important to vary the instrument
temperature during the calibration.
To vary instrument temperature, place heating pads, set on high, around the instrument
for about 15 minutes or until the instrument temperature reaches approximately 38 C.
(See “To check instrument temperature” below.) Remove the heating pads and continue
running samples.
At another point in the calibration, wrap the instrument with plastic and surround it with
ice packs for 15 to 30 minutes or until the instrument temperature is lowered to 17 C.
(See “To check instrument temperature” below.) Remove the ice packs and continue
running samples.
To check instrument temperature, collect data from a sample and allow the graph of the
sample reading to appear. The bottom of the window lists the sample and instrument
temperatures respectively in ºC.
The sample temperatures must also be varied during calibration. Cole-Parmer
recommends using 3 to 5 different temperature ranges of samples during calibration
covering the warmest to the coldest sample temperatures that will happen during normal
use.
FoodTech Calibration Software
9
Step 2: Plot Curves
You can view the sample curves a number of ways. With the optical data file (*.dt1)
open,
use Plot, Next (Page Down) and Plot, Previous (Page Up) to view one
sample graph at a time;
use Plot, Overlay, Page Down or Page Up to view more than one sample at
a time (the current sample is outlined in red, while all others are blue); or
use Plot, Show All to view all the sample graphs at once.
Use the method that works best for you. The reason for viewing the curves is to search
for any whose basic shape is radically different from the other curves in the calibration.
Sample curves should curve gradually rather than peaking sharply (see the following
examples). Such curves are usually a result of operator error and should be deleted
from the calibration. To delete the sample highlighted in red, select Delete from the Edit
menu, press Delete on the keyboard, or use the Cut button on the toolbar.
GAS-CAL1.DT1
Example A: In this example, all the
curves shown are similar in shape
and are acceptable.
Example B: In this second example,
the highlighted curve on the bottom is
clearly due to operator error—probably
failure to close the light shield properly
or to insert the sample.
FoodTech Calibration Software
10
You may wish to print the optical data gathered from the instrument but be forewarned:
if you are printing the data in Grid View, this could take awhile. It’s best to do this only if
you have a good reason for doing so. From the File menu, select Print, or click on the
Print button on the shortcut toolbar.
Step 3: Obtain Lab Analysis for all Calibration Samples
Either immediately before or after collecting optical data on the calibration samples,
obtain laboratory analysis for the samples. This analysis should be from a lab you trust,
as the calibration can never be more accurate than the lab values. Enter the lab analysis
information into the FoodTech Calibration Numbering Setup Manual that came with your
instrument.
Step 4: Create or Edit a Constituent Data File
The computer stores the laboratory values of constituent content for the calibration
samples in a constituent data file. The same constituent data file can be used over and
over for calibrations of the same product and sample set.
To create a constituent data file, select New from the File menu or use the shortcut key
on the toolbar. Under Document Type, select Constituent Data. A spreadsheet screen
will appear. To enter values, select Insert from the Data menu, or press the Insert key
on the computer keyboard. An empty row of cells will appear. Type the FoodTech
sample ID number and press Return. Use the cursor keys or the mouse to move to the
next cell and enter the constituent data. To add the next sample, press Insert. When
you are finished entering the information, select Save As from the File menu. Assign a
file name of up to 8 characters that will remind you of the product values stored in the
file. The software will automatically assign a “.con” ending to the file and place it in the
C:\DATA directory.
To edit an existing constituent data file, select Open from the File menu or use the
shortcut key on the toolbar. Under List Files of Type, select Constituent Data (*.con).
Select or type the correct file name.
To navigate within the constituent data file, use the cursor keys or the mouse. Also, the
Search option under the Edit menu and on the toolbar allows you to move quickly to a
particular sample ID number.
After adding or changing the appropriate information, be sure to save your changes
before closing the file.
FoodTech Calibration Software
11
Step 5: Merge Constituent Data File to Optical Data File
With the optical data file open on the screen, from the Data menu select Merge
Constituents. Select the appropriate constituent data file (*.con) for the product you are
calibrating the instrument to analyze. Wait while the computer merges the two files.
When an optical data file is merged with a constituent data file, the computer adds the
constituent data to the optical file. For later regressions, the files should not have to be
re-merged (unless changes have been made to the constituent data file).
Step 6: FoodTech Regression Analysis
After merging the files, select Reduce from the Data menu. The Regression
Parameters screen will appear:
Tumbles: Refers to the number of samples to be “tumbled” from the regression.
Samples which are statistical “outliers” should be eliminated from the regression so that
they do not adversely affect the calibration. The recommended number of tumbles will
be set automatically.
Type: Refers to the tumbling method.
Fast tumbling predicts the analyzer’s constituent value for each sample and compares it
to the lab value. If the analyzer’s predicted value for a particular sample is off by more
than double the standard error for the entire calibration set, that sample is “tumbled.”
This continues until selected number of samples has been tumbled. The calibration
constants (K values) are determined from the remaining samples.
Slow tumbling eliminates one sample at a time and calculates the calibration constants,
comparing the standard error each time. It selects the set of K values with the lowest
standard error. If more than one tumble was selected, it repeats this process with the
remaining samples until the number of samples specified has been tumbled. Usually the
results are the same, but as it is more accurate, Cole-Parmer recommends using slow
tumbling.
Filters: This option was designed for use by Cole-Parmer researchers only. All the
filters listed should have a checkmark.
FoodTech Calibration Software
12
Constituents: If you would like to perform the regression on more than one constituent
at a time, make sure there is a mark next to all the constituents for which you are
calibrating. However, you may prefer to perform the regression on one constituent at a
time if, for example, you want to exclude certain sample numbers from the calibration for
a particular constituent.
Exclude: Click on this button to specify specific sample numbers that should be
eliminated from the regression. You might choose to do this for samples that
have no lab value or a questionable lab value for a particular constituent or
have a bad curve.
After typing each sample number, click ADD to confirm its exclusion. When all the
sample numbers to be excluded are listed, click OK.
After making all of the appropriate selections on the Regression Parameters screen,
click OK. Be patient while the computer performs the regression. If the file contains a
large number of samples, this would be a good time for a coffee break.
When the regression is complete, the following will appear.
Cole-Parmer recommends that you PRINT all these results so that they will be readily
accessible when you select K values in Step 7.
FoodTech Calibration Software
13
Step 7: Enter Final K’s
The Instrument Settings file stores all of the instrument settings and K values in one
place. (Later calibrations should be added to this same file.) The instrument will need a
set of K values, or constants, for each constituent within each product. A set of K’s
consists of a total of 17 K’s (K0 through K16). For example, if you are calibrating the
instrument to measure Wheat for Protein and Moisture, you will need to enter two sets
of K’s into the instrument settings file.
Create a new instrument settings file (File, New, Instrument Settings). In a cell under
Name, type the name of the product you are calibrating for.
Click on these gray buttons under each
constituent to reach the following screen.
Click on the button under Con 1 to enter the data for the first constituent in that product.
The following screen will appear:
FoodTech Calibration Software
14
Name: Type the constituent name.
Slope & Bias: The slope should be 1.0 and the bias 0.0 (for exceptions, see Bias and
Slope Adjustments in Step 8.)
Variance: The Variance should be set to 10.0
Too High Value:
Find the Lab Maximum for the constituent on the FoodTech Regression Analysis
printout. Round it up to the nearest whole number. Enter this value.
Too Low Value:
Find the Lab Minimum for the constituent on the FoodTech Regression Analysis
printout. Round it down to the nearest whole number. Enter this value.
Click on Load K’s. From the FoodTech Regression Analysis printout, select the
recommended set of K values for this constituent. Enter the file name for the selected
set of K’s (The file name is listed on the printout.). The computer will access the file and
automatically enter the K’s. Click OK. Repeat the above for each constituent in the
product.
When selecting K’s for the instrument, you may want to predict the instrument’s accuracy
with several sets of K’s to help you decide which set to use. To predict the accuracy of a
given set of K values, open the optical data file. From the Data menu, select Predict.
Enter the appropriate constituent number. Enter the file name for the K’s you are
considering. Exclude any specific samples which may be outliers affecting the calibration.
Click on OK. Select Print. You can select to print the plot, residuals, or both. The plot
provides most of the necessary information; the residuals list all the samples with their lab
values, predicted readings on the instrument, and the difference between the two. The
printed plot gives information on the standard error with a bias adjustment and with bias
and slope adjustments. Select the standard error with the preferred degree of accuracy
and use the associated K values.
Staple the printouts of the selected K values into your Calibration Numbering Setup
Manual.
Back in the Instrument Settings file . . .
Points 1, 2, & 3: After all the constituent-specific settings have been entered, enter the
product-specific information. From the drop-down list, select the following settings.
GRAIN products
Point 1
998
Point 2
1037
Point 3
950
For other products, examine the curves in the optical data file. Point 1 should be the
point that is always one of the two highest points on the curve. Point 3 should be the
point that is always one of the two lowest points on the curve. Point 2 should be a point
that always lies between Point 1 and Point 3.
Hi and Lo Temperatures:
FoodTech Calibration Software
15
The Hi and Lo Ambient Temperatures should be 38.0 and 7.0 respectively.
To print the Instrument Settings information, select Print from the File menu. After the
file prints, staple it into the Calibration Numbering Setup Manual.
To upload the Instrument Settings data to the instrument: Connect the instrument to the
computer with the RS232 cable. Select Comm Options from the Instrument Edit menu, and
make sure the correct port is selected. Put the instrument in DATA LINK mode. From the
Instrument Edit menu, select Upload to Instrument.
Select Save As, Enter file name. The backup file will be stored with a .ZBK extension
FoodTech Calibration Software
16
Step 8: Check Accuracy
To check the accuracy of the instrument after entering the final K values, take readings
on ten lab-analyzed samples. Read each sample twice, and enter the readings on a
photocopy of the following chart. (For instructions on taking readings, consult your
User’s Manual.)
Sample
ID #
Total:
Divided
by:
Con 1
Lab
Value
10
Con 1
Unit
Reading
Con 2
Lab
Value
Con 2
Unit
Reading
Con 3
Lab
Value
Con 3
Unit
Reading
1st
1st
1st
2nd
2nd
2nd
1st
1st
1st
2nd
2nd
2nd
1st
1st
1st
2nd
2nd
2nd
1st
1st
1st
2nd
2nd
2nd
1st
1st
1st
2nd
2nd
2nd
1st
1st
1st
2nd
2nd
2nd
1st
1st
1st
2nd
2nd
2nd
1st
1st
1st
2nd
2nd
2nd
1st
1st
1st
2nd
2nd
2nd
1st
1st
1st
2nd
2nd
2nd
20
10
20
10
20
Average:
Average each column at the bottom of the table. Compare the Lab Value Average and
the Unit Reading Average for each constituent. If there is a difference, a bias and/or
slope adjustment may help.
FoodTech Calibration Software
17
To determine whether a bias or slope adjustment would correct the problem, select New
from the File menu. Under “Document Type,” select Statistics. The following screen will
appear:
Press TAB
to move to
the next
cell.
This
information
is updated
as each
sample is
added.
Data is
graphed in
this area.
Using the completed accuracy chart from the previous page, enter the ten Lab Values
(enter each one twice) in the Lab column and twenty Unit Readings in the FoodTech for
one constituent. The computer will calculate the regression information as each sample
is entered. If a particular sample is an outlier, select Exclude from the Data menu to
exclude it. When all the sample readings have been entered, save the file and select
Print from the File menu. The printout will include the graph along with the following
information:
SEP After Bias : 0.139
Only Adjustment
SEP After Slope & : 0.130
Bias Adjustment
Recommendation: It is a good idea to
follow the FoodTech recommendation.
Correlation
: 0.989
* FoodTech recommends that only
* a bias adjustment be made.
Slope
: 0.937
Slope Bias
: 0.681
Bias (No slope) : -0.165
Slope Bias: This value is entered as the
bias only when the slope is also adjusted.
Bias (No slope): When the bias is
adjusted, the instrument’s readings for the
constituent are raised or lowered by this
amount.
FoodTech Calibration Software
18
The printed plot gives information on the standard error with a bias adjustment and with
bias and slope adjustments. Select the standard error with the preferred degree of
accuracy and make adjustments accordingly. Keep in mind:
1. A slope adjustment should be made only if
the range of the samples used to test the accuracy approximates the range
used in the calibration and
the suggested slope adjustment is less than 0.95 or greater than 1.05.
2. If the printout does not show a bias adjustment of ±0.15 or more, the adjustment
should not be made.
Bias Adjustments
On the completed accuracy chart on the previous page, subtract the Unit Reading
Average for the constituent from the Lab Value Average to determine the bias
adjustment. For instance, if the Lab Value Average is 23.5 and the Unit Reading
Average is 23.8, the bias adjustment would be -0.3. Or, you can use the Bias (No
slope) from the Statistical Analysis printout.
See user manual for instructions to enter the Bias adjustment.
Slope Adjustments
Slope adjustments are generally not recommended. However, if you feel that a slope
adjustment may be necessary, gather the following information and contact ColeParmer’s Calibration Department for advice.
a completed accuracy chart for the product in question (see previous page)
the FoodTech Regression Analysis printout for the calibration
a printout of the Instrument Settings file for the product in question
the FoodTech Prediction Analysis or Statistical Analysis printout
If it is determined that a slope adjustment is necessary, enter the Instrument Settings
file.* Make sure that you are in the appropriate product and constituent.
When making a slope adjustment, multiply the Slope from the prediction printout to the
Slope in the instrument settings file, and multiply the Bias in the instrument settings file
with the Slope from the prediction printout, and then add the Slope Bias from the
printout.
After making bias or slope adjustments, be sure to Upload the new instrument settings
to the instrument.
FoodTech Calibration Software
19
Appendix 1: Glossary
accuracy - how closely the readings of the calibration samples match the samples’
predetermined lab values in a given instrument
bias - the average shift of the regression curve from the ideal laboratory regression curve on all
samples
constants (also called K values or K’s) - figures determined during calibration of the instrument
which are used in the equation:
Percentage of Constituent = Bias + (Slope)(X)
where X is the summation of the optical data multiplied by the constants.
constituent - the component in the sample for whose content the instrument is measuring
diffuse transmittance - light energy is transmitted and distributed evenly through the sample
being tested
diodes - near-infrared light sources
K’s or K values - see constants
lab analysis - the chemical or physical analysis of constituent(s) in a product
linear regression - a graphical representation of a statistical analysis of the relationship between
two or more measured variables
light absorption - the amount of light energy absorbed by various constituents in the product
being measured
NIR - abbreviation for near-infrared
near-infrared - the range of light energy near the visible spectrum
OD - optical data expressed in terms of voltage values for each wavelength used in a FoodTech
analyzer
regression (also called reduction) - mathematical process to fit the optical data to the lab data
sensor - a device used in FoodTech analyzers that converts light energy to electrical signals for
processing optical data
sigma - one standard deviation
spectrum - the range of OD energy measured in wavelength increments
transmittance - the ease with which light or other forms of energy can pass through a sample
being tested
wavelengths - specific band widths of light energy, usually expressed in nanometers in nearinfrared instrumentation