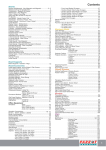
1
51
4
THE ANALYZER TM
The ANALYZER: An Overview
Basic Options
Putting ANALYZER to Use
Creating a List
Creating a Table or Graph
Creating a Mailing List
FISHER PULP&PAPER W ORLDWIDE USER’S MANUAL
52
FISHER PULP&PAPER W ORLDWIDE USER’S MANUAL
53
The ANALYZER : an Overview
The ANALYZER is a powerful and versatile tool that does much of the “brainwork”
and nearly all of the “legwork” that goes into finding answers to strategic and
tactical questions that relate to information in the database.
You use ANALYZER the way you would use the query tool in a typical database,
such as Microsoft Access. The difference, though, is that ANALYZER is not only
intuitive. It is also customized to the pulp and paper industry. In other words, you
don’t have to be a database expert to get answers to your questions. ANALYZER
gives you drop-down menus, enabling you to make selections by pointing and
clicking your mouse. In addition, ANALYZER gives you a variety of output options.
You can output information in a list, a pie chart, a stack bar graph, a table,
mailing labels or mail merge.
FISHER PULP&PAPER W ORLDWIDE USER’S MANUAL
54
Basic Options
To get the most out of ANALYZER effectively, it helps to understand the rationale
behind the different output options. Essentially, you have three options: (1) list;
(2) table and graph and (3) mailing list. Here’s a brief summary of these options,
and why you would choose one over the other.
LIST. List presents a table of data containing one entry for every item you
choose to list. You can make a list, for example, of locations, machines,
process control systems and individual pieces of equipment.
Typical lists you might want to make include:
•
Mills in the Northwestern U.S. that produce recycled linerboard
•
Paper machines that use Jagenberg coaters operating at 1500
feet per minute or more
•
Digesters made by Kamyr before 1985
TABLE AND GRAPH. Table and graph summarizes information in a way that
allows you to see patterns and trends. There are two graphing
possibilities: (1) a pie-chart; or (2) a bar-chart. A table accompanies both
types of graphs.
Typical questions that would lend themselves to TABLE AND GRAPH would
be:
•
Mills in the Northwestern U.S. that produce recycled linerboard
•
How much printing and writing paper is being made in each
country?
•
How many on-machine coaters are there by machine supplier and
year?
•
What are the market shares of newsprint producers?
MAILING LIST. A mailing list is a specialized type of LIST. The MAILING LIST
feature helps you create mailing labels and mail merges.
FISHER PULP&PAPER W ORLDWIDE USER’S MANUAL
55
Putting ANALYZER to Use
The Main Screen
SELECTION OPTIONS
Selection options guide you through the query process. Here are the key
commands:
•
CREATE. Lets you select the way you want to display the answer to your
question. Your choices are: (1) list; (2) table and graph; or (3) mailing list.
•
OF. Lets you select what you want your graph to summarize—for
example, TPY of paper, number of paper machines or number of pieces
of equipment. A drop-down menu will give you your choices.
FISHER PULP&PAPER W ORLDWIDE USER’S MANUAL
56
•
BY. (For graphs and tables only) Lets you segment the information in your
graph. For a pie chart, you choose the first “By.” For a stacked bar chart,
you choose both “By’s.” Your selection for the first “By” will open as the Xaxis. The second will appear as the segments of each stacked bar.
•
SELECT VALUES. Lets you select the specific portions of the database that
are to be included and excluded in your list, graph or table. For example,
using Select Values to specify the major grade “Newsprint” will cause
ANALYZER to include only newsprint mills and machines.
You can use Select Values to specify your query in as many ways as you
want. For example, specifying the major grade “Newsprint” and the
original supplier “Valmet” will return only mills and machines that are (1)
made by Valment and (2) produce newsprint.
MANAGING QUERIES
The four “Query” buttons (Clear Query, Save Query, Load Query, and Delete
Query) help to simplify the querying process. Once you’ve created a query that
you intend to reuse, you can give it a name and store it (using Save Query) and
then retrieve that same query with Load Query. Delete Query lets you erase
any queries you’ve saved. Clear Query removes the current query from the
screen but has no impact on a saved query.
OTHER ANALYZER OPTIONS
Other options available to you in ANALYZER include the following:
•
Export. Lets you export the results of list, table and graph queries to a
spread sheet or other software applications.
•
Print. Prints a report of the results of your query.
FISHER PULP&PAPER W ORLDWIDE USER’S MANUAL
57
Creating a List
Now that you know something about the general concepts that underlie the use
of ANALYZER, you’re ready to put the tool to use. We’ll start with the simplest and
most direct of all ANALYZER functions: the LIST. As you will see, the basic steps
that go into creating the list are also used when you want to create a table and
graph or mailing.
In the example below, we are seeking to compile a list of all the mills in
France, Germany, and Italy that make newsprint on machines that run over
3000 fpm. Here are the steps:
1. Click on “List” option on opening ANALYZER menu.
Clicking on List button to the right of Create will produce a drop down
menu that gives you several options.
2. Choose “Paper Machines
- Detail” from the list of
options that appear on the
drop-down menu.
“Paper Machine - Detail” will
now appear in the OF box.
3. Click on “Select Values.”
The first drop-down menu
will give you a choice of
categories of information to
choose from. When you
click on the option Location,
you’ll have several choices.
If you select “Country,” the
following screen will appear:
Creating a List, cont.
FISHER PULP&PAPER W ORLDWIDE USER’S MANUAL
58
4. Make your selections.
You select values one group at a time. In the example we are using, you
would scroll down the list of options in the left-hand column until you
come to “France.” After highlighting “France” and clicking on the double
arrow pointing to the right, repeat the process for “Germany” and “Italy.”
When you click on OK, you’ll be returned to the original screen, and the
limit you’ve set will be recorded in the white area of the screen, as in the
following illustration:
Creating a List, cont.
FISHER PULP&PAPER W ORLDWIDE USER’S MANUAL
59
5. Select additional values.
To set additional limits on your query, follow the same procedures as
above for each new criteria you want to use.
•
Click on Select Values.
•
Make appropriate selections from drop-down menu.
•
Transfer selected values from the left-hand column to right-hand
column.
•
Click on OK.
Repeat these steps to specify
Major Grade as Newsprint and
Machine Speed as <=3000 fpm.
6. Click on the red “Re-Run
List” button to create your
list.
The list produced by the criteria set in
this example is shown to the right.
Note: By clicking on the Account
Viewer button, you can quickly go to
the ACCOUNT VIEWER. The mills listed
will only be those mills that meet the
criteria of your list.
FISHER PULP&PAPER W ORLDWIDE USER’S MANUAL
60
Graph Options
There are two general categories of graphs: (1) pie chart; and (2) stacked bar
chart.
Pie chart
Stacked Bar chart
Pie Chart. A pie chart, as the illustration above shows (in this instance TPY
paper production), breaks down a sum with one variable ( in this instance,
regions).
A Stacked Bar Chart. A bar chart displays the answer to queries in which there
are two variables. In the example above on the right, the bar chart shows TPY of
paper by region, and then by grade. Stacked bars have three elements:
Y-Axis: (Vertical line) Answers the question “How much?” or “How
many?” (Example: TPY Paper)
X-Axis: (Horizontal line) Represents the initial variable – in ANALYZER, the
first “By” (Example: Region)
Stacks of each bar. Represent yet another variable—in ANALYZER, the
second “By” (Example: Grade)
FISHER PULP&PAPER W ORLDWIDE USER’S MANUAL
61
BAR CHARTS: A CLOSER LOOK
The two bar charts depicted on this page illustrate two ways of displaying the
same information. Both charts display answers to the query “How much paper is
being produced per year?”
In the first of the two examples below, the first “By” (Y-Axis) is the region, and the
second “By” (bar stacks) segments each region by major grade. In the lower
example, the X-axis and the bar stacks are reversed.
Y-Axis: Tons of paper (TPY)
X-Axis: Region
Bar Stacks: Major Grade
Y-Axis: Tons of paper (TPY)
X-Axis: Major Grade
Bar stacks: Region
FISHER PULP&PAPER W ORLDWIDE USER’S MANUAL
62
Creating Tables and Graphs
The steps needed to create tables and graphs are similar in most respects to the
steps you took when creating a list. The difference is that tables and graphs
require you to make an additional selection or two.
CREATING A PIE CHART
A pie chart is a graph consisting of two elements: a “pie” and its “slices.” The
“pie” represents the sum of an item in the database—for example, number of
paper machines. The “slices” represent how you want that information
segmented. Here are the steps:
1. Click on the “Table and
Graph” button in left-hand
corner of screen.
2. Click on the “OF” button to
choose the pie.
Example: # Paper Machines
3. Click on the top “BY” to
determine how to slice up the
pie.
Example: Major Grade
4. Set limits to your query by
using Select Values.
Example: Mills in North America
(U.S., Canada and Mexico)
5. Click on Re-Run Graph.
This step will produce the graph
shown to the left.
FISHER PULP&PAPER W ORLDWIDE USER’S MANUAL
63
CREATING A STACKED BAR CHART
The procedure for creating a stacked bar chart is similar to the procedure for
creating a pie chart, but with one added step: a second variable to specify the
content of the bar stacks.
1. Choose “Table and Graph.”
2. Make selection from the “OF”
menu.
This sets the information for the Y-axis
(the vertical line) of your chart.
Example: MTPY Paper
3. Make selection for the first “By”
box using drop down menu.
This box sets your X-axis.
Example: Company
4. Make selection for the second “By” box using drop down menu.
This box selects the bar stacks. Example: Major Grade.
5. Use Select Values to specify what mills, machines, etc. to include in
your query .
FISHER PULP&PAPER W ORLDWIDE USER’S MANUAL
64
Creating a Mailing
You can use any of the lists you create in ANALYZER as the basis of a mailing list.
PREPARATORY STEPS
You begin the process of creating a mailing list by clicking on the Mailing button
on the opening ANALYZER menu.
In the example below, we are seeking to compile a list of the General Managers
and Maintenance Managers of mills in North America that produce a Major
Grade of Newsprint. Here are the steps:
1. Click on “List” option on opening ANALYZER menu.
Clicking on List button to the right of Create will produce a drop down
menu that gives you several options.
2. Choose “People” from the list of options that appear on the dropdown menu.
“People” will now appear in the
OF box.
3. Click on “Select Values.”
The first drop-down menu will
give you a choice of categories of
information to choose from. When
you click on the option People,
you’ll have three choices.
By selecting “Job Function,” the
following screen will appear:
FISHER PULP&PAPER W ORLDWIDE USER’S MANUAL
65
Creating a Mailing, cont.
4. Make your selections.
You select values one group at a time. In the example we are using, you
would scroll down the list of options in the left-hand column until you
come to “General Manager.” After highlighting “General Manager” and
clicking on the double arrow pointing to the right. Repeat the process for
“Maintenance.”
When you click on OK, you’ll be returned to the original screen, and the
limit you’ve set will be recorded in the white area of the screen, as in the
following illustration:
FISHER PULP&PAPER W ORLDWIDE USER’S MANUAL
66
Creating a Mailing, cont.
5. Select additional values.
To set additional limits on your query follow the same procedures as
above for each new criteria you want to use.
•
Click on Select Values.
•
Make appropriate selections from drop-down menu.
•
Transfer selected values from the left-hand column to right-hand
column.
•
Click on OK.
Repeat these steps to include criteria for mills in the U.S., Canada and Mexico
that produce a major grade of newsprint. The screen will look as follows:
FISHER PULP&PAPER W ORLDWIDE USER’S MANUAL
67
Creating a Mailing, cont.
6. Click on the red “Re-Run List” button to create your list.
The list produced by the criteria set in this example would look as
follows:
7. Use Delete Options (optional).
The “Delete Options” box
that appears when the list
turns up on your screen
gives you the opportunity to
customize the list you’ve
created. The option appears
automatically when you
click on the red Re-Run
List button.
FISHER PULP&PAPER W ORLDWIDE USER’S MANUAL
68
SETTING UP MAILING LABELS
The process for setting the specifications for the mailing (label design, etc.)
begins after you have brought to the screen the list that is to be the basis of the
mailing. The screen depicted to the right meets the following specifications: All
general managers and maintenance managers of mills in the U.S., Mexico, and
Canada in which the major grade is newsprint. By clicking on the red Re-Run
Mailing button, you will bring that list to the screen, as depicted on the right.
You’re now ready to create the specs for the mailing labels. Here are the steps:
1. Click on Print Labels button.
Clicking on the Print Labels will bring a menu that will enable you to
decide on what field(s) you want the labels to be sorted—that is, in
what order they will come from the printer. In the example below,
we’ve selected “country” as the primary sort, followed by “zip code.”
FISHER PULP&PAPER W ORLDWIDE USER’S MANUAL
69
Setting up Mailing Labels, cont.
2. When you finished the sorting process, click on OK.
When you click, OK, the
menu to the right will
appear on the screen.
You now have two
choices: you can print out
these directions or simply
proceed by clicking on the
Continue to Print Labels
button at the bottom of the
screen. When you do,
you’ll see the menu that
shown below which give
you options for label sizes.
3.
Select label type and size and click on “Next.”
FPWW uses standard Avery labels.
If you are using another type of
label or if your label does not
appear on the list, select New
Label and enter the dimensions of
your label. After you have made
your selection, click on Next. This
command will automatically bring to
screen a menu for Mailing Expert,
a program for designing the label.
FISHER PULP&PAPER W ORLDWIDE USER’S MANUAL
70
Setting up Mailing Labels, cont.
4.
Open the list you’ve created.
The mailing list you created is stored temporarily in a private directory.
The steps to locate that list are as follows:
•
Click on Browse in the Mailing Label Expert
When you click on Browse, the following box will appear on
the screen. You need to specify where the mailing list has
been saved. FPWW automatically saves the list you’ve
created in a private directory.
There are two ways you can open your list:
•
Type in “:priv:mailing” in the
highlighted box. (File Name)
•
Press down the Shift key and
Insert key at the same time.
(Doing so will automatically insert
“:priv:mailing” in the File name
box.)
•
Click Open.
Either of these steps will move you to the next step in the Mailing Expert
process. You will see the following screen:
FISHER PULP&PAPER W ORLDWIDE USER’S MANUAL
71
Setting up Mailing Labels, cont.
5. Select label format.
After opening your table, the following screen will appear. Once you have
set the font and size, click Next.
You’ll then be given an opportunity to determine how you want the label
sheet to feed into the printer and the order in which you want the labels to
appear on the sheet.
FISHER PULP&PAPER W ORLDWIDE USER’S MANUAL
72
Setting up Mailing Labels, Cont.
6. Choose label entries.
The next step in the process is to indicate how, exactly, you want the
the label to read. Here’s a summary of the commands:
•
Placing fields in the label.
You place fields in the label
by clicking once on the field
you want to place, and then
by clicking once on “Place
Field.”
•
Adding field names to the
same line in the label.
When you want to add more than one field to a line (Example:
First Name and Last Name), leave the cursor on the gray bar
and add the next field. You will need to enter any spaces or
punctuation between fields. (Example: {City}, (space) {State}).
•
Creating a new line in the label. When you want to create a
new line in the label, move the cursor below the gray bar and
click once. This will create a new gray bar and allow you to
insert whatever field you want to insert.
•
Editing. You can edit any line with keystrokes, and remove
fields using the delete key. Please do not type the fields onto
the gray bar. Rather use the highlight-place field sequence.
When you’ve completed laying out your labels, click on Next.
FISHER PULP&PAPER W ORLDWIDE USER’S MANUAL
73
Setting up Mailing Labels, Cont.
7. Create a name for the label report.
Once you have set the label up and have clicked on “Next,” you need
to name the label report you have just created. Enter a name for your
report and click Next. You then have three choices. You can view the
labels on screen, print them, or modify the design. Each instruction
will prompt you to the next step.
FISHER PULP&PAPER W ORLDWIDE USER’S MANUAL
74
MERGING LISTS INTO OTHER PROGRAMS
Once a mailing list has been created in ANALYZER, it can be merged with a
document you have created in a word processing program such as Microsoft
Word or Word Perfect. The steps are as
follows:
1. Click on the “Mail Merge” button.
A menu will appear containing
instructions. If you choose to, you
can print the instructions, or move
on by clicking Continue to mail
merge.
2. Choose “Create new merge setting” from the Merge Expert screen
and click Next.
3. Select the word processing program you are
using for your form letter.
4. Indicate if your form letter already exists and
click “Next.”
If your have already created the letter for your mail
merge, select “yes” and type in the file name or use the Browse button to
locate your letter and click Next. If you have not already created your
letter, select “no.” The program will link your mail merge fields to a new,
blank document.
FISHER PULP&PAPER W ORLDWIDE USER’S MANUAL
75
Merging lists into other programs, cont.
5. Select the table.
The mailing list you created is stored temporarily in a private directory
as a table. The location and name of that table is “:priv:mailing” You
change name in the Table name box. You can
insert the table name and location two ways:
•
Hold down the Shift key and Insert key
at the same time.
•
Type “:priv:mailing” in the Table name
box.
6. Sort the labels.
This step enables you to decide on
what field(s) you want your form letter
to be sorted —that is, in what order
you want your labels to be created. In
the example to the right, we selected
“Country” as the primary sort,
followed by “Zip Code.”
7. Changing field format.
The next screen gives you the option of changing the format of each
field (Example: “Mr.” can appear three ways: “MR.,” “Mr.” and “mr.”)
We recommend using the default setting.
8. Save merge settings (optional)
You’re given the opportunity at this point to save the merge settings
you’ve set. On the same menu you’ll also be asked to type a name for
the new document that is going to be the basis of the merge if you are
not using a letter you’ve already created.
FISHER PULP&PAPER W ORLDWIDE USER’S MANUAL
76
Merging lists into other programs, cont.
9. Click Finish.
Once you click on Finish, ANALYZER will assemble the list and
automatically open the word processing program you’ve selected. If
you have indicated an existing file, the program will open to that file.
Otherwise, a new document will be opened.
From this point on, you need to follow the mail merge procedures of
your word processing program.
SAVING OPTIONS
Once you have created and customized a list, you can save your modified table.
The steps are as follows:
1. Click on the “Table Options” button.
2. Click on “Save Table” on the next menu.
3. Name your table.
When you want to load a table, simply create another list of people and go to
Table Options and select Load table.
FISHER PULP&PAPER W ORLDWIDE USER’S MANUAL