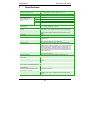
1
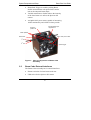
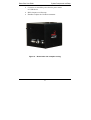
Beam Cube
C
M
Y
CM
MY
CY CMY
Beam Cube
INDUSTRIAL LASER BEAM ANALYZER
USER MANUAL
OPHIR OPTRONICS
w w w. o p h i ro p t . c o m
Composite
K
Rev B1.31-U2.30-1
March-12-2008
Initial Revision
Beam Cube User Guide
Introduction
Contents
1
2
3
4
5
Introduction ...................................................................... 5
1.1
Manual Overview.................................................................5
1.2
System Requirements .........................................................6
System Components and Setup ..................................... 7
2.1
Package Contents ...............................................................7
2.2
Beam Cube Assembly.........................................................7
2.3
Beam Cube External Interfaces ..........................................8
Software Installation and Registration ......................... 10
3.1
Spiricon SP Camera Registration and Installation ............10
3.2
StarLab Software Installation (optional) ............................10
3.3
Oscilloscope Software Installation (Optional) ....................11
Setting up for Measurements ........................................ 12
4.1
Positioning the Beam Cube and the Laser Under Test .....12
4.2
Electrical Connections.......................................................13
4.3
Setup for Beam Profiling and Operation............................14
4.4
Setup for Power/Energy Measurement using the USB
Interface ............................................................................18
4.5
Setup for Temporal Pulse Shape Measurement ...............19
Beam Profile Measurement ........................................... 21
5.1
Default Startup ..................................................................21
5.2
Add Panel..........................................................................22
5.3
2D Display .........................................................................23
iii
Contents
Beam Cube User Guide
5.4
Numerical Values ..............................................................24
5.5
Profile Graphs ...................................................................25
5.6
1D Gaussian Fit.................................................................26
5.7
1D Top Hat Fit ...................................................................27
5.8
Report Generation.............................................................28
5.9
Beam Wander ...................................................................29
5.10 3D Display .........................................................................29
5.11 Video Data Control ............................................................30
5.12 Region of Interest ..............................................................31
5.13 Major/Minor Axes ..............................................................32
5.14 Automation ........................................................................33
6
Power Measurement ...................................................... 34
6.1
Starting and Ending a StarLab Application Session..........34
6.2
Configuring the Display for Power Readings.....................35
7
Specifications ................................................................. 40
8
Ordering Information ..................................................... 42
iv
Beam Cube User Guide
1
Introduction
Introduction
The quality and repeatability of laser material processing
is critically dependent on control of the various laser
parameters from production run to production run. The
Beam Cube now allows the operator to measure and
monitor these parameters for industrial Nd:YAG, Diode
and Fiber laser systems of up to 150W average power in
real time and thus closely control the process. It does this
by combining the Beam Profiling capabilities of the
Spiricon series of cameras with the power and temporal
pulse shape measurement capabilities of Ophir’s BA
series.
The user should also check Ophir’s Web page for the latest
updates and FAQs not covered in this manual.
Note: This manual is a companion to the BeamStar
User Manual that is included in the Beam Cube
package. All features of the BeamStar software are
available with the Spiricon camera that is embedded in
the Beam Cube.
1.1
Manual Overview
This manual describes the following:
•
System Requirements and Components
•
Overview of Beam Profiling Capabilities
•
Power and Energy Measurement
•
Temporal Pulse Shape Analysis
5
Introduction
1.2
Beam Cube User Guide
System Requirements
•
Pentium 4, at least 1.7 GHz (>2 GHz for best
performance)
•
256 MB of memory
•
USB 2.0 port
•
Windows XP SP2, Windows Vista-32
•
Free USB port on the PC
Note: Windows stores all installation information in the
Windows Registry. Therefore, when installing any of the
software components or when attaching the Beam Cube
or USB Interface for the first time, the user must be
logged in with Administrator Privileges.
6
Beam Cube User Guide
System Components and Setup
2
System Components and Setup
2.1
Package Contents
The Beam Cube package comes with the following
components
2.2
•
Beam Cube Assembly
•
Beam Cube User Manual
•
BeamStar User Manual
•
USB cable
•
External cable for Thermal head
•
BNC to BNC cable
•
BeamStar installation CD-Rom
•
Ophir Displays CD-Rom
Beam Cube Assembly
The Beam Cube Assembly contains the following
components
•
Spiricon SP503U camera for Beam Profiling (or
SP620U camera in Beam Cube 620 version)
•
2 Beam Splitters to reduce the power intensity of
the laser beam as it hits the Spiricon camera by a
factor of 400:1
•
A negative imaging lens to expand the size of the
laser beam by a factor of 2-3 while moving the
focal point out, thereby enabling profiling of focal
spots as small as 50µm in size. The lens can also
be removed to measure parallel beams of up to
7mm in size. A -100mm lens is supplied with the
system. Other focal lengths can be purchased if
necessary.
7
System Components and Setup
Beam Cube User Guide
•
Photodiode Trigger to enable synching Beam
Profile measurements with pulsed lasers and to
look at the temporal beam shape.
•
Variable Attenuator to further reduce the intensity
of the laser beam as it strikes the Spiricon SP
camera
•
An Ophir 100C power meter capable of measuring
100W continuously and 150W for short periods.
Exchangeable input
negative lens
SP beam
profiler unit
Beam splitters
Ophir 100C power meter
Attenuators
st
1 rod
nd
2 rod
Optical trigger
Figure 1: View of components of Beam Cube
Assembly
2.3
Beam Cube External Interfaces
The Beam Cube Assembly has 5 external interfaces
•
Entrance window for laser beam under test
•
USB socket for the Spiricon SP camera
8
Beam Cube User Guide
System Components and Setup
•
Connector to attach the power head to power meter
or USBI device
•
BNC Output to oscilloscope
•
Handles to adjust the Variable Attenuator
Figure 2: Beam Cube with complete casing
9
Software Installation and Registration
Beam Cube User Guide
3
Software Installation and Registration
3.1
Spiricon SP Camera Registration and Installation
Spiricon SP camera registration and BeamStar FX
software installation is described fully in the BeamStar
User Manual. A short summary is described here. If any
trouble is encountered in the course of
installation/registration, turn to the BeamStar User Manual
1. Connect the Beam Cube via its USB connector to
the PC.
2. Windows will start its Found New Hardware
Wizard. Press Cancel.
3. Insert the BeamStar FX distribution CD-ROM in
the CD-ROM drive.
4. To start the installation, locate and double-click the
setup icon (setup.exe).
5. When the Choose Installation Type window
appears, select Standard.
Note: You must have administrative privileges to install
the software and register the Beam Cube’s Spiricon SP
camera.
3.2
StarLab Software Installation (optional)
If you have purchased the USB Interface to display the
laser power then proceed as follows:
1. Start your computer.
2. Insert the CD into the CD-ROM drive.
3. The CD software should start automatically. If it
does not, double-click index.htm from the CDROM drive to start the software.
4. Under the main heading, click USBI.
10
Beam Cube User Guide
Software Installation and Registration
5. Click Install StarLab. The InstallShield™ Wizard
dialog box appears. The InstallShield™ Wizard
guides you through the installation process. At the
end of the process, the StarLab icon
, appears
on the desktop.
The software installation is complete. You can now
connect the USBI or Pulsar device.
3.3
Oscilloscope Software Installation (Optional)
The Beam Cube can be connected directly to an
oscilloscope, thereby enabling temporal pulse width
analysis.
Users may wish to see the temporal pulse shape on their
PC instead. This can be done by using the optional PC
oscilloscope (P/N SPE10008).
Install the oscilloscope application from the CD that
came with the oscilloscope device
11
Setting up for Measurements
Beam Cube User Guide
4
Setting up for Measurements
4.1
Positioning the Beam Cube and the Laser Under
Test
The Beam Cube is designed to look at converging beams
either at the focal spot or at some point before the focal
spot so the CCD camera should always be at a point before
the focal spot or at the focal spot. The Beam Cube should
never be placed so far from the source that the focal
spot comes before the camera. This can result in
damage to components inside the Beam Cube when the
laser is run at full power.
In order to facilitate proper setup and positioning of the
Beam Cube, we have provided on the CD included an
Excel program "Setup Program for YAG FSA and
Beam Cube" to help you calculate where to place the
Beam Cube. There are two positions given, the position
that will show the focal spot and the position where the
image will be the largest it can be within the size of the
camera CCD.
Note 1: The same Excel program works for Beam Cube
except you should change the Height of CCD in smaller
dimension C from 5.4 to 4.7 before calculation
Note 2: A -100mm negative lens has been provided
with the Beam Cube. If the -100mm lens does not
have sufficient power for the beam focus to reach the
CCD, try -50mm. This alternative lens can be ordered if
necessary. Note that the magnification should optimally
be in the range 1.8 – 3 times
12
Beam Cube User Guide
Setting up for Measurements
In the example above, the source laser has a 100mm focal
length lens which is recessed 10mm into the laser housing
giving 90mm distance from the closest approach to the
laser to the focal point. The beam size at the exit from the
laser is 15mm and the largest beam size on the SP503
camera inside the Beam Cube is 4.7mm and on the SP620
camera inside the Beam Cube 620 is 5.4mm (see note 1
above). As can be seen, the top of the Beam Cube should
be placed between 23.6mm from the source to 36.7mm
from the source to see from the largest sized beam (before
the focal point) to the smallest (at the focal point).
Place the Beam Cube with the input lens directly beneath
the laser. Use the leveling feet if necessary to level the unit
to be exactly perpendicular to the beam. Using the Excel
program provided, place the Beam Cube at a distance
midway between the limits given.
The negative lens in the Beam Cube not only moves the
focal point further from its original position, it also
magnifies the image by the factor given in the Excel
program (by a factor of 2.1 in the example above)
4.2
Electrical Connections
The following diagram shows how to setup the connections of
the Beam Cube (when using the optional USB Interface and
13
Setting up for Measurements
Beam Cube User Guide
PC scope to see everything on the PC. You can also use a
regular Ophir smart display and regular oscilloscope).
1. Camera. Connect the USB to USB cable between the PC
outlet of the Beam Cube and the USB2.0 port on the PC
2. Power meter. Connect the D15 to D15 cable between the
power meter outlet of the Beam Cube and the power meter. If
using the USB Interface, also connect the USB to USB cable
between the USBI and the PC.
3. Oscilloscope. Connect the BNC to BNC cable between the
scope output of the Beam Cube and the oscilloscope. If you
are using the PC scope, connect to the PC scope to the PC
with the USB cable.
USB to USB cable
USB Interface
USB
PC or Laptop
D15 to D15 cable
USB to USB cable
USB2.0
USB
USB to USB cable
Beam Cube
POWER
METER
SCOPE CAMERA
PC Scope
BNC to BNC cable
Figure 3: Electrical Connections of Beam Cube
(when used with USB Interface and PC scope)
4.3
Setup for Beam Profiling and Operation
Note: Configuring the camera for the specific laser under
test is detailed fully in chapters 4 and 5 of the BeamStar
14
Beam Cube User Guide
Setting up for Measurements
User Manual included. If you are using the LBA software
instead, consult the LBA instructions. A short summary
using BeamStar is described here. If any trouble is
encountered in configuring the camera, please turn to the
BeamStar User Manual
Quick Start Instructions
1. Position Beam Cube directly under laser at the correct
distance from the output lens of the laser as calculated
in the Excel program "Setup Program for YAG FSA
and Beam Cube" we have provided on the CD
included.
2. Connect up as in Figure 3: Electrical Connections of
Beam Cube above.
15
Setting up for Measurements
Beam Cube User Guide
Figure 4: Camera Format Tab
3. Select the Camera Format Tab of the Control
Panel (lower left corner of the BeamStar display)
4. Set the Optical Scale Factor to “Beam Expanded”.
Set Times to the value given in the Excel program
(magnification factor). Later on we will measure
the expansion factor more accurately.
5. If working with a CW or high rep rate laser, set the
trigger mode to internal by deselecting all the
Trigger options.
6. If working with a pulsed laser, select the BeamStar
Photodiode Accessory and the External Trigger
options.
Note: The default setting when selecting trigger
mode is pulse widths of 3ms. If your pulses are
longer than that, adjust the "Speed" to be somewhat
longer than your pulse width. (see Figure 5 below).
7. If the laser’s pulses are shorter than 20
microseconds, select the Pre-Trigger option.
Otherwise do not select Pre-Trigger.
8. To save these settings, from the Menu Bar, select
Tools>>Options and set the Startup option to
“Start the application with last settings”.
16
Beam Cube User Guide
Setting up for Measurements
Optimum gain region
Figure 5: Camera Exposure Tab
9. Turn on laser at low power ~ 10W. Adjust the
attenuator rods so that the 1st rod is all the way out
and the 2nd rod all the way in. (See fig 1).
10. Adjust the Beam Cube position to get the beam
size and position you want. Raise the laser power
to the level you want while adjusting the attenuator
rods so that the camera gain is in the region noted
in Figure 5.
17
Setting up for Measurements
Beam Cube User Guide
For details on how to improve signal quality (if necessary),
please refer to the chapter 5 of the BeamStar User Manual
for detailed explanations of Noise Control, Reference
Subtraction, Background Subtraction, and Averaging.
Note: The Beam Cube is equipped with a variable
attenuator instead of removable filters. If the BeamStar
Manual suggests to remove a filter, then decrease the
attenuation. If the suggestion is to add a filter, then
increase the attenuation.
4.4
Setup for Power/Energy Measurement using the
USB Interface
(If using an Ophir power meter, connect between the
Beam Cube and your power meter using the included D15
– D15 cable and follow the instructions in your power
meter manual).
1. Connect between the power meter output of the
Beam Cube and head input point on the USBI
instrument with the “external cable for Beam Cube
power head”. This connects the head that is inside
the Beam Cube Assembly to the USBI device.
Figure 6: USBI Device, Head Connector Side
2. Connect the USB cable to the USBI instrument and
to the USB port of your PC.
18
Beam Cube User Guide
Setting up for Measurements
Figure 7: USBI Device: PC - Device Connector Side
3. The LINK LED should flicker momentarily,
indicating USB enumeration of the device.
4.5
Setup for Temporal Pulse Shape Measurement
The following explanation assumes use of the optional PC
oscilloscope accessory. These instructions should be
adapted to the oscilloscope actually used to perform
temporal pulse shape measurement.
1. Perform all steps of “Setup for Power/Energy
Measurement” described above. This is necessary
in order to provide an electrical power supply for
the temporal pulse module inside the Beam Cube
to operate.
2. Connect the PC oscilloscope module to the USB
input of the laptop or desktop using the USB cable
provided and connect the BNC cable from the
Beam Cube to the left side BNC input of the
oscilloscope.
19
Setting up for Measurements
Beam Cube User Guide
Figure 8: PC Scope screen
3. Start the PC oscilloscope program from its icon.
4. With the laser operating and the Beam Cube
measuring, set the time scale to a value several
times the laser pulse width, the voltage scale to
auto, the input to DC and channel B to off. Set the
trigger to Auto.
5. After you see the pulse shape, set the voltage scale
to the best value. Set the trigger to ChA and the
trigger level to a point that insures stable readings.
6. If the signal is too high, attenuate it using the
Variable Attenuator levers that are on the side of
the Beam Cube.
7. As a further check that everything is working
properly, lower the time scale so you can see
several pulses on the screen.
20
Beam Cube User Guide
5
Beam Profile Measurement
Beam Profile Measurement
Most of the features of the BeamStar application can be
used with the SP camera of the Beam Cube device.
This section contains a summary of the BeamStar features.
Please look in the BeamStar User Manual for a detailed
description.
5.1
Default Startup
With the camera active when you start the BeamStar program,
you will see a display similar to that of Figure 9, below. Unless
you’ve used the “Start application with last settings” option, this
is the default startup with a working camera.
Figure 9: Default start up display
BeamStar can display any combination or number of
displays and profiles. Each display is controlled by its own
control page. Beginning with the lower left corner display,
and moving clockwise, the displays are:
21
Beam Profile Measurement
Beam Cube User Guide
• Control Panel form containing a page for each of the
various displays
• 2D Display
• 3D Display
• Profile Graph 1
• Profile Graph 2
• Numerical Values 1
5.2
Add Panel
Activate a graphic, calculation, or control display.
Figure 10: Add dialog form
The Add form button is available from any of the pages of
the Control Panel. Clicking one of the buttons when it is
enabled adds that activity as another page to the Control
Panel form. If a display or numerical activity is already
present, BeamStar adds a different suffix number to the
22
Beam Cube User Guide
Beam Profile Measurement
name of the page; for instance, Profile Graphs 1 and 2.
Camera functions can have only one instance.
The buttons in the rightmost column represent Camera
Control activities where only one instance is allowed. If
one of these buttons is enabled then that activity can be
started.
5.3
2D Display
A 2D XY projection (“bird’s eye” view) of the laser beam
as detected by the BeamStar camera.
Figure 11: Example of 2D Display with Centroid and 4σ
beam width Markers selected
•
Includes markers for centroid and peak location.
•
Graphical display of 4σ beam width.
•
Can be zoomed up to 1600%
•
Linear distance between two points of interest can
be measured.
23
Beam Profile Measurement
5.4
Beam Cube User Guide
•
Calculations can be limited to a specific area of the
camera by setting a Region of Interest.
•
By default is aligned to XY axes. Can be set to
Major/Minor axes if the laser beam is rotated at an
angle.
•
Option to save data or picture to a file
Numerical Values
Textual Display of Beam Analysis Calculations
Figure 12: Numeric display, DefaultXY (left) and
Major/Minor axis alignments
•
Centroid and Peak Location
•
Track total power
•
Peak Power Density and Peak to Average Ratio
•
Beam Widths, Ellipticity, and Angle of Rotation
•
2D Gaussian and 2D Top Hat
•
Can be set to Default XY or Major/Minor Axes
•
Configurable Pass/Fail performance indicators
24
Beam Cube User Guide
5.5
Beam Profile Measurement
•
Option to log selected measurements to a file
•
If Region of Interest is in affect, calculations will
only be on pixels that are within the Region of
Interest
Profile Graphs
Display the power distribution (“height of the pixels”) of
the laser beam as a function of only one axis or
measurement.
Figure 13: Example of a Line Profile along the Major Axis
25
Beam Profile Measurement
5.6
Beam Cube User Guide
•
Axis can be X, Y, Major, or Minor
•
Line Profile is a slice through the laser beam along
the axis selected
•
Sum Profile is made by summing parallel lines of
pixels along the selected axis
•
Profile Display can be zoomed by click-dragrelease of mouse
•
If Region of Interest is in affect, display will be
limited to pixels that are within the Region of
Interest
1D Gaussian Fit
Calculates a best-fit Gaussian curve of the laser beam
under test
Figure 14: 1D Gaussian Fit with Pass/Fail option active
•
Axis can be X, Y, Major, or Minor.
•
Select Line or Sum Profile for fit
•
Numeric and Graphic data presented in one
display.
26
Beam Cube User Guide
5.7
Beam Profile Measurement
•
Profile Display can be zoomed by click-dragrelease of mouse
•
Configurable Pass/Fail performance indicators
•
If Region of Interest is in affect, display and
calculations will be limited to pixels that are within
the Region of Interest
1D Top Hat Fit
Calculates the Top Hat approximation of the laser beam
under test.
Figure 15: Top Hat fit example with Pass/Fail option active
•
Axis can be X, Y, Major, or Minor.
•
Select Line or Sum Profile for fit
•
Numeric and Graphic data presented in one
display.
•
Profile Display can be zoomed by click-dragrelease of mouse
•
Configurable Pass/Fail performance indicators
27
Beam Profile Measurement
•
5.8
Beam Cube User Guide
If Region of Interest is in affect, display and
calculations will be limited to pixels that are within
the Region of Interest
Report Generation
Generate a performance report of the laser under test.
Figure 16: Report Generator dialog box
•
Click the
icon or select the Menu item
File>>Generate Report.
•
Report can be a full performance report or
Pass/Fail only
•
Select between text, graphic, or mixed format
reports
28
Beam Cube User Guide
5.9
Beam Profile Measurement
Beam Wander
Graphic and statistical display of centroid instability over
time.
•
Time scale selection from seconds to hours
•
Option to save numeric results to log file
•
Display wander in microns or microradians
Figure 17: Beam Wander display set to AutoScale
5.10
3D Display
3D projection of the power distribution of the laser under
test.
29
Beam Profile Measurement
Beam Cube User Guide
Figure 18: 3D Display
5.11
•
Zoom, Pan, and Rotation of display by mouse
control
•
Graphic results only. No beam analysis
calculations
Video Data Control
Record camera output frames for future analysis. Video
files can be played back with the BeamStar application.
30
Beam Cube User Guide
5.12
Beam Profile Measurement
Region of Interest
Limit calculations to a specific area of the BeamStar
camera. Useful for multiple spot measurements or when
the optical setup of the test causes unwanted reflections on
the BeamStar camera
Figure 19: Region of Interest - control tab and example
of 2D Display
•
Activated by clicking the
•
Easily controlled from its own control tab or by
mouse control within the 2D display
•
Affects Numeric Results, Profiles, 1D fits, and
Beam Wander displays
31
icon
Beam Profile Measurement
5.13
Beam Cube User Guide
Major/Minor Axes
Enables correct measurement of non-XY aligned laser
beams.
•
Affects 2D Display, Profiles, Numeric Results, and
1D Fits.
•
Set the active axes from one location for the whole
application by pressing the
toolbar icon.
Figure 20: Major and Minor lines drawn through the
centroid of a rotated laser beam
32
Beam Cube User Guide
5.14
Beam Profile Measurement
Automation
Ophir provides a sophisticated interface to allow other
applications to access BeamStar measurements and to
integrate them into their client applications.
This interface makes use of .NET technology.
After the BeamStar application is installed, the
Automation Examples folder can be accessed. This folder
contains examples of client applications that are provided
in VB.NET, VB6, and LabVIEW 7.0. A full reference
manual describing the BeamStar interface is provided as
well.
33
Power Measurement
6
Beam Cube User Guide
Power Measurement
Note: The instructions below are for those users using
the USB Interface for power measurement. For full
instructions on power measurement, single shot energy,
data logging, software upgrades and other information,
please consult the included USB Interface CD manual. For
power measurement using an Ophir power meter, consult
the power meter manual.
6.1
Starting and Ending a StarLab Application
Session
To start a StarLab session:
From the desktop, double-click
opens.
. The StarLab application
On startup, StarLab searches for devices. If only one is
found as in the present case, StarLab automatically
opens in full screen mode and begins operation..
To end a StarLab session:
Open the File menu and select Exit. The StarLab application
closes.
34
Beam Cube User Guide
6.2
Power Measurement
Configuring the Display for Power Readings
Power readings can be taken with a photodiode head, or
with a thermopile or pyroelectric head in power mode.
Thermopile heads in power mode and photodiode heads
are configured in exactly the same way. The following
sections explain the display options and how to select
them.
Note: To take measurements in power mode when working
with a thermopile or pyroelectric head, select Power
from the Mode drop down list in the Measurement
Parameters Area.
35
Power Measurement
6.2.1
Beam Cube User Guide
Configuring Graph Limits and Time Period
To configure graph limits and time period:
In the Graph Configuration Area, use the Min Power and
Max Power scroll bars to configure minimum and
maximum power in the Graph Limits area.
Figure 21: Configuring Graph Limits and Time Period
– Graph Configuration Area
8. From the Min Power and Max Power drop down list,
select the power scale (nanowatts, microwatts, etc.). The
graph shown in the Display Area adjusts according to
your selection.
9. In the Time Period field, use the arrows to set the time
period of the Display Area in hours, minutes, and
seconds. The graph shown in the Display Area adjusts
according to your selection.
6.2.2
Configuring Measurement Settings in Power
Mode
This section explains how to select the laser wavelength
and configure the range and an average reading in power
mode.
6.2.3
Selecting the Laser Wavelength
Thermopile heads have different absorption at different
wavelengths. To compensate for these differences, each
head has been calibrated by a laser at several wavelengths.
By choosing the correct laser wavelength, the correction
factor for that wavelength is automatically introduced.
36
Beam Cube User Guide
Power Measurement
To select the laser wavelength:
Select the laser wavelength from the Laser drop down list in
the Measurement Parameters Area.
Figure 22: Laser Drop Down List
6.2.4
Selecting the Range
Thermopile heads cover a wide range of powers, from
microwatts to 1000s of watts, depending on the type of head in
use. In order to provide accuracy at each end of the range, the
electronics of the USB Interface Unit must be configured to
work in a range that is most suited to your needs.
To configure the range when you know the approximate
range of the expected readings:
Select the range from the Range drop down list in the
Measurement Parameters Area. The instrument will
configure itself according to the selected range.
Figure 23: Range Drop Down List
To configure the range when the range of the expected
readings is not known, or if highly varying readings are
expected:
Select AUTO from the Range drop down list in the
Measurement Parameters Area. The instrument will
configure itself according to the selected range.
Note: AUTO instructs the instrument to configure itself in
the lowest range possible that is higher than the latest
readings. If the readings exceed 100% of the present
range, the instrument reconfigures itself for the next
37
Power Measurement
Beam Cube User Guide
higher range. If the readings fall below 9% of the
present range, the instrument reconfigures itself for
the next lower range after a short delay. The delay
prevents an infinite range-changing loop when
readings are close to the end of the scale.
6.2.5
Averaging the Measurements
The thermopile head takes a measurement 15 times a
second. USBI automatically refines your readings and
applies a moving average.
When you set the instrument to average mode, the
instrument displays the average of the readings spanning
from the last time average mode was activated, to the
present. Once the time period of the average is reached,
the average becomes a running average, spanning the
average period backwards in time. For example, if the
average period is 30 seconds, at 15 seconds, the average is
over 15 seconds; at 30 seconds, the average is over 30
seconds; at 5 minutes, it is over the period from 4 minutes
and 30 seconds to 5 minutes (30 seconds back from the
present).
To select an average period:
Select the average in seconds from the Average drop down
list in the Graph Configuration Area.
Figure 24 Average Drop Down List
38
Beam Cube User Guide
6.2.6
Power Measurement
Disabling Averaging
You can disable averaging from the Average drop down
list.
To disable averaging:
Select None from the Average drop down list in the Graph
Configuration Area.
39
Specifications
7
Beam Cube User Guide
Specifications
Power measurement
Max and min average power
a, c
Maximum average power density
Max and min energy
Maximum energy density
pulse
and repetition rate at
width
entrance window vs. pulse
10ms
width
2ms
0.5ms
Cooling System
Dimensions
Spectral Range
Beam profiler unit
Camera
PC interface
Shutter speeds
Gain control
Frame rate at 640x480 pixel ROI
Software features
Minimum PC system requirements
Intensity adjustment
System optical performance
Field of view
Maximum beam size
Beam reduction or expansion
Resolution
Power / energy / temporal profile unit
Temporal pulse shape response time
into oscilloscope
Software functions with USB Interface
connected to PC or laptop
Data logging
1W to 100W continuous and to 150W for up to 1 min
4KW/cm² at entrance window
20mJ b to 100Joules
max energy density
20J/cm²
5J/cm²
1.5J/cm²
Conduction cooled
22cm L x 16cm W x 14cm H
400 – 1100nm (calibrated for 1064nm)
Standard Beam Cube: SP503U 640x480 pixel camera with 9.9µm
spacing
Beam Cube 620: SP620U 1600x1200 pixel camera with 4.4µm
spacing
USB2
Continuously variable 1/frame rate to 1/6,000, manual or automatic
0dB to 27dB in ~700 steps (each step is ~0.035dB). Manual or
automatic control.
Std Beam Cube: 50Hz. Auto synch with laser
Beam Cube 620: 20Hz. Auto synch with laser
Automatic gain and shutter control. Peak and Centroid position
tracking. 2D and 3D contour map. Sophisticated noise and
background control. Best fit to gaussian or top hat profile 3D display
viewable from any angle or elevation. Store and recall screens in
single or video fashion. 3 different measures of beam width, %of
peak, 4 sigma and 90/10 knife edge. Save numerical data files of
profiles. Log data with time. Full on line instructions and help. Fully
flexible screen format.
Pentium-4 2GHz, 256 MB Memory, Operating system, Windows XP
Service Pack 2 or Vista 32.
Continuously variable filters actuated from outside the unit.
±6°
φ22mm at entrance for converging beam, φ7mm for collimated
beams
Expanded 2-3X. With no lens 1X
~5µm
<5µs resp. time. Maximum peak power 1000W.
average power, statistics
Can send unlimited number of points in real time to PC via USB
Interface at >1000 point/s. Windows software provided for data
analysis.
40
Beam Cube User Guide
Specifications
Notes: (a) The power density limitation applies to any surface that the beam hits. For Beam Cube, since the
object plane is outside the instrument, focal spots of much higher power density can be imaged as
long as the power density limit on the optical surfaces is not exceeded.
(b) The Beam Cube will not resolve pulses of energy below 20mJ unless the pulse rate is high. If the
energy deposited in 1/50th of a second exceeds 20mJ, then the unit will be able to show the pulses
even though the individual energies are below 20mJ.
(c) If the beam power or energy density on the entrance window exceeds specifications, the window
can be removed and not used, assuming that the power and energy density on the first beam
splitter is below the damage threshold.
41
Ordering Information
8
Beam Cube User Guide
Ordering Information
Beam Analysis Systems for Industrial Lasers
Beam Cube
Standard Beam Cube system for beam profile,
temporal pulse shape and power and single shot
energy. To be used with the Ophir power meter
and oscilloscope of user’s choice. Includes
interchangeable -100mm lens assembly. With
SP503U 9.9um pixel size Spiricon camera.
SP786015
Beam Cube 620 version
High Resolution Beam Cube system for beam
profile, temporal pulse shape and power and single
shot energy. To be used with the Ophir power
meter and oscilloscope of user’s choice. Includes
interchangeable -100mm lens assembly. With
SP620U 4.4um pixel size Spiricon camera.
SP786016
USB Interface
USB Module that turns your PC or laptop into a
power/energy meter and enables you to present
the power and single shot energy measurements
of the Beam Cube on your PC
7Z01200
PC oscilloscope
200us risetime oscilloscope to turn your PC into an
oscilloscope displaying the temporal pulse shape.
Uses PC or laptop USB port.
SPE10008
Replacement -100mm
lens assembly
-100mm lens assembly for Beam Cube (1 included
with system)
SPZ08256
Replacement -50mm
lens assembly
-50mm lens assembly for Beam Cube
SPZ08255
revB1.31-U2.30-1/ 27.5.08 eg/new
Beam Cube User
Manual
revB1.31-U2.30-2/
26.8.08
eg/added Beam Cube 620 version
Ophir P/N31.8.08
1J06118
revB1.31-U2.30-3/
eg/corrected excel s/w to Beam
cube
Rev B1.52-S1.10-1
revB1.52-S1.10-1/09.2.09 eg/corrected temporal pulse from
200 to <5us and updated whole spec to match catalog 2009,
changed from USBI to StarLab s/w
42