1
Virginia Finca, Radu Zglimbea,
Emilian Greaban, Constantin Marin
WSEAS TRANSACTIONS on SYSTEMS and CONTROL
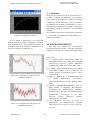
The installation responses in the terms of
dedicated soft were obtained and looks like the ones
in figure below.
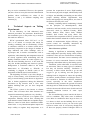
Figure 10. Time Evolution of Cooling Process with
Identified Parameters
In the next stage, after we have made the
identification we firs simulate the process. The
values of identified parameters were now
The response of HVAC installation after we have
had identified the parameters it is presented in what
will follow.
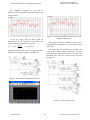
To ensure that our identification methods are
good we have made another experiment. The new
system makes o comparison between real values and
identified value. The new systems is the one from
the figure 11
⎡ deg C ⎤
K rp _ r = 2.45 ⎢
⎥, τ r = 29,18 [s ]
⎣ V ⎦
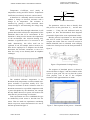
and the systems become same as in figure 8 and his
response is presented in figure 9 and figure 10
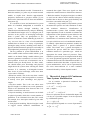
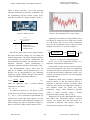
Figure 8. Experimental and Identified Process
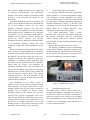
Figure 11. Error comparisons
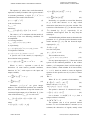
Figure 9. Time Evolution of Cooling Process
ISSN: 1991-8763
462
Issue 9, Volume 4, September 2009