1
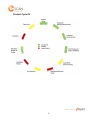
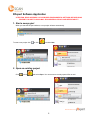
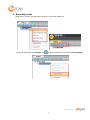
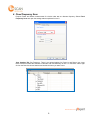
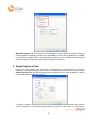
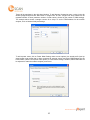
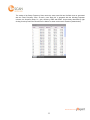
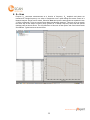
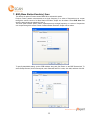
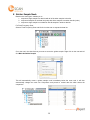
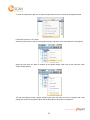
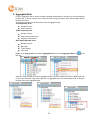
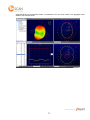
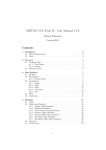
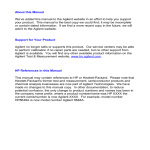
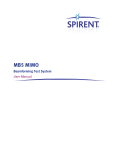
Training Manual
www.emscan.com
1
______________________________________________________________ 2
RFxpert System __________________________________________________________________ 4
Product Cycle Fit ______________________________________________________________ 5
RFxpert Software Application ______________________________________________________ 6
1. Start a new project __________________________________________________________ 6
2. Open an existing project _____________________________________________________ 6
3. Executing scans ____________________________________________________________ 7
4. Fixed Frequency Scan _______________________________________________________ 8
5. Swept Frequency Scan _______________________________________________________ 9
6. S11 Scan _________________________________________________________________ 12
7. BSE (Base Station Emulator) Scan ____________________________________________ 13
8. Golden Sample Node _______________________________________________________ 14
9. Aggregate Node ___________________________________________________________ 16
Appendix 1: Supported Network Analyzers & Signal Generators ________________________ 18
Appendix 2: Supported Base Station Emulators ______________________________________ 18
Appendix 3: Check Demo Set-up _________________________________________________ 18
Appendix 4: How to switch between NF and FF views ________________________________ 19
Appendix 5: How to create scans with similar settings ________________________________ 20
Appendix 6: How to export data to Excel ___________________________________________ 21
Appendix 7: Ideal Measurement Set-up (the importance of these practices vary with frequency) 21
Appendix 8: VNA & Power Meter Setup for Swept Frequency _________________________ 22
FAQ________________________________________________________________________ 23
1) How do you provide an accurate EIRP estimate despite the fact that only one side of DUT is
measured? _____________________________________________________________________ 24
2) How fast is the full measurement cycle? ___________________________________________ 24
3) When measuring GSM power how do we address duty cycle? __________________________ 24
4) How do we capture quickly changing modes for transmitters with rapidly changing sources? _ 24
5) What is the measurement sensitivity? (Accurate power measurements) ___________________ 24
6) Are the measurements reliable in noisy ambient environments without an anechoic enclosure? 25
7) Can you measure multiple antennas on different planes? ______________________________ 25
8) What is the measurement sensitivity BERT (or Frame error rate) test? ____________________ 25
9) What kind of power supply can be used? ___________________________________________ 25
10) What is the range of supported power levels? ______________________________________ 25
11) Where do I place the reference board? ____________________________________________ 25
12) Does RFxpert require annual calibration? _________________________________________ 25
13) What is the accuracy of the RFxpert measurements? _________________________________ 25
14) I have a network analyzer that is not on the list of supported analyzers, can it still be supported?
______________________________________________________________________________ 26
15) What are the minimum system requirements? ______________________________________ 26
16) What is the maximum power level that RFxpert can receive without being damaged? ______ 26
17) Impact of Separation: what is the ideal radiating source distance from surface of scanner? ___ 26
18) What limits the frequency range on either end of the specification? _____________________ 26
www.emscan.com
2
19) What are the effects on the measurement from driving the antenna with lower power (e.g. dBm
vs. 20 dBm)? ___________________________________________________________________ 26
20) The features/specifications indicate measuring dipoles and helical antennas. I assume that this is
done by laying the DUT flat on the scanner bed? How do you feed the antenna without having the
cable on the scanner bed, without some sort of de-embedding? Both of these conditions would seem
to compromise the integrity of the near-field and alter the measurement accordingly. __________ 27
21) When selecting “Pattern Settings Properties”, “Amplitude Scale”, “Comparison Type”,
switching from linear to Log10 seems to have no effect. What is this supposed to do? I thought it
changed the scale of the near-field and far-field patterns. ________________________________ 27
22) If I put my cell phone on the scanner does it scan? __________________________________ 27
23) How can I measure each side of the DUT in order to get a full spherical pattern? __________ 28
www.emscan.com
3
RFxpert System
Shipped Components List
1. Integrated Antenna Board and Processing Section:
CPC Number AMS-RFX-M1
2. USB Cable:
CPC Number 1100-405
3. Universal Power Supply:
CPC Number 1100-404
4. Electronic User Manual
5. Application CD:
CPC Number AMS-RFX-CD-M1
6. Sample reference antenna, along with Calibration reference data
Client PC Requirements
1. RFxpert client software runs on Window 2000, Windows NT, Windows XP, Vista and
Windows 7 OS platforms.
2. Minimum Recommended PC Features:
a. Clock Speed: > 1GHz
b. USB Ports: at least 1 USB, 2.1 protocol support preferred
c.
Monitor/Screen resolution: Operating in wide screen mode (aspect ratio greater than 4:3) is
recommended for best viewing.
Peripheral Equipment Requirements (optional)
1. Reference antenna signal source for reference is antenna provided.
2. Signal Generator
3. Network Analyzers for S11 measurements, and to act as CW RF signal sources.
4. BSE
System Capabilities
1. High speed, antenna pattern measurement system (minutes to characterize
designs)
antenna
2. 2D and 3D Near-Field Patterns (A, Phase), Polarization Diversity
3. S11, Gain, Efficiency: measured and calculated
4. Far-field Patterns + Bisections Parameters: EIRP, PRAD and TRP
5. Continuous coverage through UHF bands (700MHz to 6.0 GHz)
RFxpert can measure down to 300 MHz. Only near-field data is meaningful and can be used
for debugging purposes. RFxpert doesn’t recommend the use of far-field data below 700 MHz
due to the inaccuracy of far-field predictions below 700 MHz. Most of our customers use the
near-field data to get real insights on how “almost off the shelf” antennas are behaving when
embedded with the rest of the design – so that they can make the right choices to optimize
the designs.
6. Multiple Modulation Formats / Protocols (CW, CDMA, GSM / Edge, B/T, 802.11, UMTS
variants)
www.emscan.com
4
Product Cycle Fit
www.emscan.com
5
RFxpert Software Application
ATTENTION: READ APPENDIX 10 FOR PROPER ENVIRONMENTAL SETTINGS BEFORE USING
RFXPERT FAILURE TO DO SO MAY JEOPARDIZE ACCURACY AND REPEATABILITY
1. Start a new project
When you start the RFxpert software, a new project will start automatically.
To start a new project click
or click
and select New
2. Open an existing project
Click
or click
and select Open. You can access to recently opened files as well.
www.emscan.com
6
3. Executing scans
Right click on “Project” and select the scan type or click on the related icon
To open the settings tab click Settings icon
or right click the scan node and select Node Settings
www.emscan.com
7
4. Fixed Frequency Scan
Purpose: Power and Pattern measurement of a device under test at a discrete frequency. Select Fixed
Frequency Scan and open the settings tabs as explained in item 3.
Scan Settings Tab: Set Frequency. There is an optional setting for Power In and Return loss. Input
these values will enable the software to calculate Gain and Efficiency as well. To view these values right
click on the Data list column headers and enable the items you want to see.
www.emscan.com
8
Modulation Settings Tab: The hardware can be adjusted to measure different modulation settings by
selecting between a constantly on power source (CW/CDMA) or a bursty source (labelled here as TDMA)
in the Modulation Settings window. The bursty setting is adjusted to focus on GSM sources but using the
advanced settings can allow many different types of signal to be measured.
5. Swept Frequency Scan
Purpose: S11, power, pattern, gain, and efficiency measurements at a single frequency or a series of
frequencies over a span through the remote control of a Network Analyzer. Scripts can be written. Select
Swept Frequency Scan and open the settings tabs as explained in item 3. Refer to Appendix 5 “How to
connect Power Meter and Network Analyzer”.
To specify a sequence of equally spaced settings, set the start and stop frequencies along with the
number of samples (i.e. the spacing between points). And then click “Add” button in “Linear Sweep”.
www.emscan.com
9
These will be populated in the right hand window. To add discrete frequencies enter a value in the 4th
window (Single Point) and click “Add” button in “Single Point” to enter. “Single Point” entry method can be
repeated number of times (maximum number of total entries is limited by the number of VNA settings).
The example above shows a sample outcome for a script. To set the GPIB address for the network
analyzer, click on Network Analyzer Settings.
To add a power meter, click on Power Meter Setting, there are two options: Use stored profile (load up
saved power meter profile that is direct connected to antenna source) and Enter GPIB address for the
Power Meter (create a new power meter profile). If Power Meter setting is enabled, PRAD and EIRP will
be adjusted to match the network analyzer power level.
www.emscan.com
10
The results of the Swept Frequency Scan render the same near-field and far-field views as generated
with the Fixed Frequency Scan. As well a new “Data list” is prepared with the following important
columns: the frequency steps, S11, gain, efficiency, EIRP and PRAD. As previously described by right
clicking for a drop menu the columns can be hidden or shown at the user’s discretion (shown below).
www.emscan.com
11
6. S11 Scan
Purpose: S11 parameter measurements as a function of frequency. S11 amplitude and phase are
measured at a single frequency or a series of frequencies over a span through the remote control of a
Network Analyzer. Scripts can be written. Select S11 Scan and open the settings tabs as explained in item
3. Refer to Appendix 5 “How to connect Power Meter and Network Analyzer”. This scan is set up exactly
the same way as the Swept Frequency Scan (please ref. to Swept Frequency Scan) with the options
(settings) table as shown above. The only difference of this scan is that quicker and more limited results
are obtained. Typical results are shown below.
www.emscan.com
12
7. BSE (Base Station Emulator) Scan
This feature is optional. Please contact EMSCAN to activate this option.
Purpose: Power, pattern measurements at a single frequency or a series of frequencies over a span
through the remote control of a Base Station Emulator. Scripts can be written. Select BSE Scan and
open the settings tabs as explained in item 3.
This scan option enables power, pattern measurements at a single frequency or a series of frequencies
over a span through the remote control of a Base Station Emulator. Scripts can be written.
To specify bandwidth setting, set the GPIB address along with Cell Power on the BSE General tab. To
add a Sweep Channel, click on Sweep tab, enter Channels and PCL Levels, click Add, and then click OK.
www.emscan.com
13
8. Golden Sample Node
Based on the scan type it enables you to
1. compare a single sample in a data list with all of the other samples in that list
2. compare all samples in one data list (node) with all the samples in another data list (node)
3. compare a single sample in one data list with all samples in another data list
For Fixed Frequency Scan:
Select a Fixed Frequency Scan and left click on the scan to expose the data list.
Go to the row in the data list that you want to set as the golden sample. Right click on the row and left
click Mark As Golden Sample
This will automatically create a golden sample node immediately below the scan node. It will also
automatically change the mode into Comparison and present a revised data list which shows the
comparison
www.emscan.com
14
To undo the comparison, right click on that row again and left click to uncheck the Comparison Mode
For Swept Frequency or S11 Scans:
Select the scan node you want to be the golden sample, right click on this node and select “Copy Node”
Select the scan node you want to compare to the golden sample, right click on this node and select
“Paste Golden Sample”
This will automatically create a golden sample node below the node you want to compare with it and
change the mode into Comparison Mode and modifies data list to show the comparisons
www.emscan.com
15
9. Aggregate Node
Purpose: Aggregate node is used to combine scanning results based on frequency to have full spherical
far-field view. It can be used for Fixed Frequency Scan, Swept Frequency Scan data and Base Station
Emulator Scan data.
The following settings must be the same to form an Aggregate Node
Fixed Frequency Scan:
Number of scans
Scan Frequency
Swept Frequency Scan:
Number of scans
Start and stop frequencies
Single point frequencies
Base Station Emulator Scan:
Number of scans
Band type
Traffic channel
PCL levels
Right click on Project node, and choose Aggregate Node or just click Aggregate Node icon
task bar.
on the
Select the scan type that you want to aggregate (Fixed Frequency, Swept Frequency or BSE), right click
on the node and select Copy Node, right click on Aggregate Node and select Paste Node or drag and
drop the node under Aggregate Node.
www.emscan.com
16
Aggregate Node will automatically create a combination of the two scan results in the Aggregate node
window. See example below:
www.emscan.com
17
Appendix 1: Supported Network Analyzers & Signal Generators
Model
Firmware Version
HP-8722ES
7.74
HP-8714C
E.06.02
Agilent Signal Generator Series
HP-8714ES
E.06.02
HP-8753ES
E.06.02
E5071C
A.08.12
8648D
Appendix 2: Supported Base Station Emulators
Agilent
Rohde & Schwarz
Model
8960 with E6702T application
CMU 200
Appendix 3: Check Demo Set-up
Results with a typical antenna should
always look smooth with a peak near
where the antenna is place
Results that look like noise mean the
power is not on, the wrong frequency is
selected or the antenna is not working /
connected properly
www.emscan.com
18
Appendix 4: How to switch between NF and FF views
Default view is near-field. Near-field View displays renderings of Near-field amplitude and phase
patterns and values “across “the surface of the scanner for Hx or Hy or H (the vector sum). There are
10 windows for the Near-field View: Five for Amplitude Distributions (e.g. 3D Amplitude H, 2D
Amplitude Hx, 2D Amplitude Hy, 3D Amplitude Hx, and 3D Amplitude Hy), and five for Phase
information.
You can switch between these by clicking on the labels at the bottom of each window.
www.emscan.com
19
Appendix 5: How to create scans with similar settings
Copy a scan node or create a new node (of that type) and copy settings. To copy a scan node first
right click on the node and select “Copy Node”. Then right click on “Project node” and select “Paste
Node”.
To create a new node and copy settings first select the scan type (please ref to Scan Types on page
24) then right click on the node that you want to copy and select “Copy Node Settings”. Then right
click on the new “Project node” and select “Paste Node”.
www.emscan.com
20
Appendix 6: How to export data to Excel
To export data to MS Excel, right click on the node, and select “Export to Excel”. The window below
will appear. You can choose specific data or all data to export to MS Excel.
Appendix 7: Ideal Measurement Set-up (the importance of these
practices vary with frequency)
The following note describes the implications of observing diligent measurement practices when using
RFxpert. Each of these practices has a bearing on measurement accuracy. The associated implications vary
with frequency. The following summarizes the implications of following the recommended practices. You may
choose to ignore some of these after assessing ease of set up vs. impact.
1) Isolate measurement from immediate metallic surroundings (more critical for lower frequencies)
a. avoid placement directly on a metal desk
b. avoid placement under an overhanging metal sheet (ledge)
c. avoid placement directly near reflective metal surfaces
2) Use ferrites at both ends of the measurement cables to block surface currents.
3) Use attenuators adjacent to signal sources, power measurement equipment and DUT's (if feed point
is fed from an externally wired RF signal source) to optimize matching.
4) Repeatable positioning of the DUT has an impact on the repeatability of measurement results. Try to
place the radiating element at the centre of the grid (use NF results to assist). Stay within 2 cm on
the long axis and 1 cm on the shortest.
www.emscan.com
21
Appendix 8: VNA & Power Meter Setup for Swept Frequency
Do not overload the power sensor maximum rating. Otherwise power sensor will be damaged
Achieve input power to DUT between 0 – 30 dB for reliable data
The red line indicate usage of identical SMA – SMA cable
www.emscan.com
22
FAQ
1. How do you provide an accurate EIRP estimate despite the fact that only one side of DUT is measured?
2. How fast is the full measurement cycle?
3. When measuring GSM power, how do we address duty cycle?
4. How do we capture quickly changing modes for transmitters with rapidly changing sources?
5. What is the measurement sensitivity? (Accurate power measurements)
6. Are the measurements reliable in noisy ambient environments without an anechoic enclosure?
7. Can you measure multiple antennas on different planes?
8. What is the measurement sensitivity BERT (or Frame error rate) test?
9. What kind of power supply can be used?
10. What is the range of supported power levels?
11. Where do I place the reference board?
12. Does RFxpert require annual calibration?
13. What is the accuracy of the RFxpert measurements?
14. I have a network analyzer that is not on the list of supported analyzers, can it still be supported?
15. What are the minimum system requirements?
16. What is the maximum power level that RFxpert can receive without being damaged?
17. Impact of Separation: what is the ideal radiating source distance from surface of scanner?
18. What limits the frequency range on either end of the specification?
19. What are the effects on the measurement from driving the antenna with lower power (e.g. dBm vs. 20
dBm)?
20. The features/specifications indicate measuring dipoles and helical antennas. I assume that this is done by
laying the DUT flat on the scanner bed? How do you feed the antenna without having the cable on the
scanner bed, without some sort of de-embedding? Both of these conditions would seem to compromise
the integrity of the near-field and alter the measurement accordingly.
21. When selecting “Pattern Settings Properties”, “Amplitude Scale”, “Comparison Type”, switching from
linear to Log10 seems to have no effect. What is this supposed to do? I thought it changed the scale of
the near-field and far-field patterns.
22. If I put my cell phone on the scanner, does it scan?
23. How can I measure each side of the DUT in order to get a full spherical pattern?
www.emscan.com
23
1) How do you provide an accurate EIRP estimate despite the
fact that only one side of DUT is measured?
Effective Isotropic Radiated Power (EIRP) is the power that has to be supplied to an isotropic antenna
to achieve the same field strength. EIRP is determined traditionally by identifying and measuring the
peak radiated value on the surface of the “measurement sphere”. Cell phones are, by design,
deliberately highly directional into one hemisphere (driven by concerns about SAR readings and by
interference in the receive mode). By measuring in that hemisphere, there will be no difficulty in
identifying and precisely measuring the peak value. So even if you had other devices under test that
were not so specifically dominant in one direction, you could still accurately estimate the EIRP value.
What gets potentially compromised in scanner measurements for omni directional sources, is
accurate far-field pattern. Radiated power (PRAD) is obtained by integrating power density (obtained
from the NF to FF transform) over the hemisphere. The hemisphere is divided into 50x100 pieces.
Integration is carried out by summing the power densities over the hemisphere. In the current
implementation, the theta and phi increments are 1.8 and 3.6 deg. So in the worst case, the PRAD
error is 3 dB. Both “sides” can be measured and the power sum taken, which will increase the
precision. As a design tool, differential changes on the peak side (or the weak side in the case of SAR
optimization) are probably all that are necessary for optimizing between options.
2) How fast is the full measurement cycle?
Each measurement including processing and display takes 1 second. RFxpert collects the data in 40
milliseconds and then the PC may require an additional 1 second to process and display the data.
The overall measurement time can be reduced to 300 milliseconds for a simple go/no go scan result
(e.g. measuring EIRP against a spec limit). In TDMA mode the scan time will be longer, due to the
fact that the system must wait for a pulse to appear. Currently, the total scan time for a GSM phone is
approximately less than 3 seconds.
3) When measuring GSM power how do we address duty cycle?
We tested GSM sources at 1/8 duty cycle. At 1/8, it slows down the process. GSM has a 500 μs
pulse. The system waits for the rising edge to level out and then measures it.
4) How do we capture quickly changing modes for transmitters
with rapidly changing sources?
RFxpert requires the power level to remain constant for 40 ms.
5) What is the measurement sensitivity? (Accurate power
measurements)
RFxpert can measure down to at least 0 dBm for GSM and CDMA. To achieve the required accuracy,
place the DUT on the surface of the spacer. For mist frequencies this keeps it out of the extreme
near-field region, but keep it close enough for sensitive measurements.
www.emscan.com
24
6) Are the measurements reliable in noisy ambient
environments without an anechoic enclosure?
In cell phone tests, we put an intentionally radiating device 30 cm away from the scanner and it did
not compromise the cell phone results. If the interfering element is 20 dB higher than DUT, at 1
meter, the effect is minor. In more extreme cases where there is predictable interference, frequency
and level coordination can be used. For adjacent test systems operating at very different power
levels, frequency discrimination isolates the measurement systems. The scanner and DUT do not
need to be put into an “anechoic” enclosure.
7) Can you measure multiple antennas on different planes?
Yes. This can be done if you know the location of each antenna on the DUT, their locations in relation
to the sensors, and if each antenna is exercised independently. The measured data will then be
adjusted based on distance tables.
8) What is the measurement sensitivity BERT (or Frame error
rate) test?
Depending on the ambient environment, BERT or FER tests can be done down to levels within 0 dB
of galvanic tests.
9) What kind of power supply can be used?
Use the 6VDC power supply that is shipped with the system only. It is a “global” 50/60 Hz and
110v/220v converter.
10) What is the range of supported power levels?
The supported power level range is from +30dBm to 0dBm. There is no risk in running the RFxpert
with less than the minimum supported power. RFxpert software will indicate if the signal level is too
low to be detected or measured accurately. For power levels greater than 10dB over +40dBm,
RFxpert may be damaged.
11) Where do I place the reference board?
To test a device it should be placed on the white plastic spacer. The device should be placed with the
radiating surface down, and ideally positioned in the middle of the spacer. The maximum device size
can be larger than the scanner area, but the radiating surface should be small enough to leave 5cm
on each side to the edge.
12) Does RFxpert require annual calibration?
No. It does not require any annual calibration.
13) What is the accuracy of the RFxpert measurements?
For high accuracy radiated power measurements, TRP is typically +/- 1.5 dB
www.emscan.com
25
14) I have a network analyzer that is not on the list of supported
analyzers, can it still be supported?
If your network analyzer is not on the supported network analyzer list, please contact your local
representative or EMSCAN at [email protected] for details.
15) What are the minimum system requirements?
Intel Pentium 4 3.0 GHz 512MB recommended Windows XP SP3 OS CD ROM Drive
16) What is the maximum power level that RFxpert can receive
without being damaged?
The maximum power level for accurate measurement is approximately +35dBm into the antenna.
Damage may occur above +40dBm
17) Impact of Separation: what is the ideal radiating source
distance from surface of scanner?
The best set up is when the antenna element is placed on the surface of the scanner. Sometimes this
is not possible because of the position of the antenna in final packaging, etc. If the separation
between the scanner and the antenna is kept to less than 10mm it will have only a small effect on the
accuracy of the far-field. For separations much larger than this the far-field accuracy could be
significantly compromised.
18) What limits the frequency range on either end of the
specification?
The frequency is limited on the high end by the receiver architecture and on the low end by the
difficulty in setting up an isolated test environment, i.e. at low frequency the surrounding environment
influences the set up more significantly.
19) What are the effects on the measurement from driving the
antenna with lower power (e.g. dBm vs. 20 dBm)?
As long as the power received at the reference probes is high enough, there should be no change
other than a lower power level. As the source power goes out of range, you will start to see phase
errors first which will influence far-field results.
www.emscan.com
26
20) The features/specifications indicate measuring dipoles and
helical antennas. I assume that this is done by laying the DUT
flat on the scanner bed? How do you feed the antenna without
having the cable on the scanner bed, without some sort of deembedding? Both of these conditions would seem to
compromise the integrity of the near-field and alter the
measurement accordingly.
The system always provides measurement results as is, in the near-field. If a cable is present, then
very often currents can be seen on it. The onus is on the tester to set up the conditions so as best to
represent what they want to measure. If the cable cannot be moved away from the scanner surface
then absorbing foam may help to reduce the impact on the test.
21) When selecting “Pattern Settings Properties”, “Amplitude
Scale”, “Comparison Type”, switching from linear to Log10
seems to have no effect. What is this supposed to do? I
thought it changed the scale of the near-field and far-field
patterns.
The linear/log switch applies to the difference mode of the comparison scan. When comparing the
near-field of two scans that have different power output, it is often more instructive to compare the
fields in a log sense
22) If I put my cell phone on the scanner does it scan?
You cannot measure the cell phone from your pocket since it is being managed by a live network.
The output power and transmit times are too variable to get a good measurement. However, if you
were to connect to your phone using a base station emulator, RFxpert would be able to measure it
accurately.
www.emscan.com
27
23) How can I measure each side of the DUT in order to get a
full spherical pattern?
The DUT should be positioned along the longer axis of the scanner to ensure the aggregate node
combines them together properly. First, scan one side, flip the DUT, position it along the longer axis,
and run another scan. Then simply go to the Radiated Power “Data list” window – highlight one
sample (representing one side of the DUT), then using the CTRL key highlight and click on another
sample (representing the other side of the DUT). What is displayed is a full slice through the sphere
that reflects a merging of two hemispheres (one for each side of the DUT). This merging will also
apply to Bisection Polar View – Theta; and Bisection Polar View – Phi. TRP is also calculated.
www.emscan.com
28