1
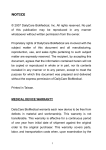
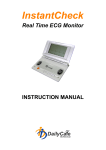
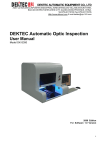
RFXPERT SOFTWARE
RF Monitoring and Analysis Software
USER MANUAL
REV 1.2
FORM 7604
© 2006 Sencore Electronics Inc.
All rights reserved. No parts of this work may be reproduced in any form or by any
means—graphic, electronic, or mechanical, including photocopying, recording, taping, or
information storage and retrieval systems—without the written permission of the
publisher.
Products that are referred to in this document may be trademarks and/or registered
trademarks of their respective owners. The publisher and author make no claim to these
trademarks.
While every precaution has been taken in the preparation of this document, the publisher
and author assume no responsibility for errors or omissions, or from damages resulting
from the use of information contained in this document or from the use of programs and
source code that may accompany it. In no event shall the publisher and the author be
liable for any loss of profit or any other commercial damage caused or alleged to have
been caused either directly or indirectly from this document.
Printed: October 2006 in Sioux Falls SD.
Form: 7604
Support and Service Information:
SENCORE Inc.
3200 Sencore Drive
Sioux Falls, S.D.
57107
USA
Phone:
Fax:
Internet:
Email:
(605)-339-0100
(605)-339-0432
http://www.sencore.com
[email protected]
RFXpert User Manual
Page 2 of 60
www.sencore.com
TABLE OF CONTENTS
1.1 Introduction ...................................................................................................5
2.1 Driver & Software Installation ......................................................................5
Installing the DTU-234 or DTU-235 Driver and Software ..............................5
Licensing the RF Probe for RFXpert..............................................................7
2.2 Additional Software Applications................................................................9
StreamXpert DTC-320* ....................................................................................9
3.1 Software Operations...................................................................................10
Client / Server Architecture ..........................................................................10
Launching the RFXpert Software.................................................................10
Connecting to the DTU-234 or DTU-235 ......................................................10
4.1 DTU-234 Operations ...................................................................................12
RFXpert Application General Layout...........................................................12
4.2 Creating a Channel Plan.............................................................................13
Building the Plan ...........................................................................................13
Editing Channel Information ........................................................................14
Additional Settings........................................................................................15
Selecting the Channel Plan and Channel ....................................................15
4.3 RF Measurement Tabs................................................................................16
System Monitor .............................................................................................16
Modulation Detail ..........................................................................................20
Multipath Detail..............................................................................................22
Spectrum Detail .............................................................................................24
About the RFXpert.........................................................................................26
4.4 Measurement and Log Settings.................................................................27
Alarm Settings ...............................................................................................27
Interval Logging Settings .............................................................................28
4.5 Snapshot .....................................................................................................29
4.6 Transport Stream Recording .....................................................................30
4.7 Equalizer Disable ........................................................................................30
4.8 Auto Inspect ................................................................................................31
Setting the Profile..........................................................................................31
Performing an Automatic Inspection...........................................................34
5.1 DTU-235 Operations ...................................................................................36
RFXpert Application General Layout...........................................................36
5.2 Channel Plans .............................................................................................37
Building the Channel Plan ............................................................................37
Editing Channel Information ........................................................................38
Additional Settings........................................................................................39
Selecting the Channel Plan and Channel ....................................................39
5.3 RF Measurement Tabs................................................................................40
System Monitor .............................................................................................40
Modulation Detail ..........................................................................................43
Spectrum Detail .............................................................................................45
About the RFXpert.........................................................................................47
RFXpert User Manual
Page 3 of 60
www.sencore.com
5.4 Measurement and Log Settings.................................................................48
Alarm Settings ...............................................................................................48
Interval Logging Settings .............................................................................49
5.5 Snapshot .....................................................................................................50
5.6 Transport Stream Recording .....................................................................51
5.7 Auto Inspect ................................................................................................51
Setting the Profile..........................................................................................52
Performing an Automatic Inspection...........................................................54
6.1 Using the DekTec StreamXpert (DTC-320)................................................56
Appendix A: RFXpert Default Values for DTU-234 ........................................57
Appendix B: RFXpert Default Values for DTU-235 ........................................58
Appendix C: Digital Channel Power Measurement and Spectral Displays ..59
Appendix D: QAM Constellation Impairment Examples................................60
RFXpert User Manual
Page 4 of 60
www.sencore.com
1.1 Introduction
The RFXpert software was designed to provide real-time analysis and monitoring of
radio frequencies directly on a PC or laptop computer. When used along with the
DTU-234 or DTU-235 RF Probes, RFXpert is part of a comprehensive solution for
doing fieldwork on a laptop computer.
2.1 Driver & Software Installation
Installing the DTU-234 or DTU-235 Driver and Software
1. Leaving the RF Probe disconnected from the PC, insert the USB flash drive
into any available USB port. Browse to the Software\RFXpert folder on the
USB flash drive.
2. Double-click on the RFXpert Installer.exe application to begin the installation.
(If the Microsoft .Net framework is not installed on the PC, the RFXpert
installer will begin by installing it. Default settings should be used.)
Figure 2.1a – RFXpert Installation
RFXpert User Manual
Page 5 of 60
www.sencore.com
3. Select the type of install to perform. Most users should select “Complete”.
• Complete
Installs both the RFXpert
server and the client
software.
• Client
Installs only the RFXpert
client software
• Server
Installs only the RFXpert
server software
Figure 2.1b – RFXpert Installation
4. Connect the RF Probe to the PC with the supplied USB cable. The New
Hardware Wizard will prompt for the location of the driver. The driver is
located in the C:\Program Files\Sencore\RFXpert\Drivers folder. On some
PCs, this process may be repeated a second time.
Figure 2.1c – Driver Installation
RFXpert User Manual
Page 6 of 60
www.sencore.com
Figure 2.1d – Driver Installation
5. Click the ‘Next’ button until finished with the driver installation.
Licensing the RF Probe for RFXpert
The DTU-234 or DTU-235 hardware may be purchased with or without licensed
software. If the RFXpert application is run with an unlicensed RF Probe, the only
features available will be creating channel plans and tuning channels—useful when
using the StreamXpert software without a need for RF measurements. To use the full
features of the RFXpert software, a license file must be installed. The license resides
in the RF Probe hardware, allowing it to be shared among several PCs or laptops. A
DTU-234 or DTU-235 RF Probe may only be physically connected to one
computer at a time.
When the RFXpert software is unlicensed, the application header will indicate the
software is running in “Limited Functionality Mode” and an activate button will be
present on the toolbar as shown in Figure 2.1e.
Figure 2.1e – Limited Functionality Mode
Click the activate button to begin the licensing process. A message box will appear
with the device type and serial number (Figure 2.1f). The license file must specifically
be for a unit with this serial number.
RFXpert User Manual
Page 7 of 60
www.sencore.com
Figure 2.1f – Device Type and Serial Number
Click the OK button to continue. A new window, as shown in Figure 2.1g, will prompt
for the location of the license file. All license files have an .xml extension. If the
license was purchased with the RF Probe, the license file will be located on the USB
flash drive that was included with the unit. If the license was purchased later, this file
will be sent separately. Select the appropriate license file and click the Open button.
Figure 2.1g – Locate the License File
If the license file is correct, a confirmation window similar to Figure 2.1h will complete
the license update process. Once the OK button is clicked, the RFXpert application
will close. When RFXpert is restarted, the licensed features will be available.
Figure 2.1h – License Activation Complete
Note: Procedures for Installing and licensing the Dektec StreamXpert (DTC-320)
software are contained in the StreamXpert manual included on the USB flash drive.
This software is available for purchase from Sencore. Please call for details.
RFXpert User Manual
Page 8 of 60
www.sencore.com
2.2 Additional Software Applications
The DTU-234 and DTU-235 RF Probes are designed for use with software
applications available from Sencore and its partner, Dektec. Please visit
www.sencore.com for complete details on current software.
StreamXpert DTC-320*
MPEG-2 transport stream analysis and monitoring software solution for checking
detailed statistics on PIDs, services, and tables including TR101-290 compliance.
* StreamXpert is a licensed trademark of Dektec Digital Video B.V. Sencore is the North
American distributor for Dektec products. Used with permission.
RFXpert User Manual
Page 9 of 60
www.sencore.com
3.1 Software Operations
Client / Server Architecture
The RFXpert software is comprised of two parts—the RFXpert server and a client
application. The server part of the software will start automatically when the PC is
booted and is mostly transparent to the user except for the tray icon in Figure 3.1a.
Figure 3.1a - Server Icon
When the tray icon is green, the RFXpert server is running properly. While the server
is starting or stopping, the tray icon may turn amber before becoming green. The
icon will be red when there is a server error or when the server is disabled.
Launching the RFXpert Software
The RFXpert client software can be started in two ways:
1. Double-click the desktop shortcut (Figure 3.1b).
2. Navigate to Start > All Programs > Sencore > RFXpert.
Figure 3.1b - RFXpert Client Shortcut on Desktop
Connecting to the DTU-234 or DTU-235
Before taking measurements, the RFXpert client must be connected to an RF Probe
on an RFXpert server. Because of the client/server architecture of the RFXpert, the
DTU-234 or DTU-235 can be connected to a local PC or a remote PC that is able to
be reached over a network.
The connection to either the DTU-234 or DTU-235 is made by clicking the Connect
button on the toolbar of the RFXpert client software.
RFXpert User Manual
Page 10 of 60
www.sencore.com
Figure 3.1c - Connecting to the DTU-235
A “Connect to…” dialog box will open and prompt for the server address and device
for the connection. When using the DTU-234 or DTU-235 as a local device, the
server address will be entered as localhost, as shown in Figure 3.1c. If the RF Probe
is physically connected to an RFXpert server that is available on the network, the
server address will be an IP address (i.e.10.0.0.200).
The “>>” button is used to poll for devices that are physically connected to the server
at the specified address. Up to six DTU-234 or DTU-235 devices can be connected
to a PC at the same time. If an RF Probe is not shown in the “Devices” dropdown
menu, clicking the “>>” button will refresh the list of devices.
Select the desired RF Probe in the Devices list and click the Connect button.
RFXpert User Manual
Page 11 of 60
www.sencore.com
4.1 DTU-234 Operations
RFXpert Application General Layout
1
2
3
4
6
5
Figure 4.1a RFXpert Overview
1. Tool Bar: Buttons for Connections, Auto Inspection, Settings, Snapshot
(screen capture), Record and an Equalizer toggle button.
2. Master Alarm: Allows a quick check of the signal integrity. Green indicates all
measurements are within user-defined limits. Red indicates an out-of-tolerance
condition exists on one or more measurements.
3. Signal Metering: Two-part visual displays for signal level, MER, and Margin.
Located above each meter is the tolerance range setting.
4. Error Information: Detailed information on PreFEC BER, PostFEC BER, SER,
and Error Seconds. An “LED” at the right of each measurement validates when
the reading falls outside of user-defined limits.
5. Histograms: Graphs the value over time for all measurement made in the
Signal Metering section.
6. Navigation Tabs: Provides more detailed information on the measured signal.
The tabs vary depending on the connected probe. The DTU-235 tabs include
Modulation Detail, Multipath Detail, Spectrum Detail, and About.
RFXpert User Manual
Page 12 of 60
www.sencore.com
7. Selected Channel Information: Lists the tuned channel number and name.
4.2 Creating a Channel Plan
Begin utilizing the RFXpert software by building a channel plan. Multiple channel
plans for separate locations or modulation types may be created.
Building the Plan
Start by clicking on the Settings button in the toolbar. Now select the General tab
within the Settings window.
Figure 4.2a Settings Page
1. Create New Channel Plan:
Channel plans can be created manually or
automatically. To create a channel plan
manually, click the “Create New Channel
Plan” button and provide a name for the plan.
Select the band (FCC Cable, IRC, HRC, or
Broadcast). All channels in the band will then
be added to the plan as follows:
Figure 4.2b Creating a Channel Plan
- Broadcast = 8-VSB
- FCC Cable = QAM-64B
- IRC/HRC Cable = QAM-256B
Individual channel information can be edited and channels can be added or removed
after the plan is created.
RFXpert User Manual
Page 13 of 60
www.sencore.com
2. Auto Channel Search: This button automatically
creates a channel plan. Enter a channel name, band, and
an RF level threshold which the RFXpert software will
then use to populate the channel plan. Modulation
schemes may be manually defined and the RF Probe will
attempt to lock onto each channel in the band using the
selected scheme. Any RF channel that has a level greater
than the specified threshold will be added to the plan. If
defining an NTSC channel, a C/N Noise Floor frequency
will need to be entered too.
You may go back and manually modify this automatically
created plan at a later time.
Figure 4.2c
Editing Channel Information
Figure 4.2d Modifying and Saving Channel Plans
The C/N Noise Floor Frequency must be defined to provide a reference for
calculating carrier to noise ratio measurements on NTSC channels. Pick a frequency
RFXpert User Manual
Page 14 of 60
www.sencore.com
that has no active channel (modulation) to serve as the measurement noise floor.
Each channel plan may have a different C/N Noise Floor frequency.
Additional Settings
There are three additional settings that must be defined before proceeding with RF
measurements.
1. BER Options: Define the
window size used for averaging /
resetting several measurements
that pertain to digital modulation.
Three minutes is the factory
default window size. BER, SER,
and PN-23 values are average
values and the window size
determines the time frame over
which the averaging is calculated.
The averaging is reset at an
interval equal to the window size.
Error Seconds and BurstES are
cumulative values and their
counters are reset at an interval
equal to the window size.
2
3
2. Burst Error Count: Burst
Error count defines how many errors must be present in one second before a
BurstES count is triggered.
3. Level Measurement Units: Select between dBmV or dBm.
Selecting the Channel Plan and Channel
To use a channel plan, simply select the channel plan from the list in the General
Settings page and click the OK button. The screen will return to the main display
containing the RF Measurement tabs.
Channel Tuning
To tune to a channel within the selected channel plan, go to the status bar and click
on the +/- buttons to move up or down one channel at a time. Right-click on the
channel information area to open a list of available channels to quickly select any
channel within the channel plan.
Note: Channel Plans are saved as .cha (xml) files. The plans will be retained even if the
software is upgraded. Channel Plan files can be found in the RFXpert program directory
under XML\Plans.
RFXpert User Manual
Page 15 of 60
www.sencore.com
Figure 4.2f Changing Channels
4.3 RF Measurement Tabs
The main analysis capabilities of the RFXpert software are displayed in a series of
tabs located in the lower center of the application. Navigate the tabs for information
on the overall system, modulation details, multipath, and spectrum analysis.
System Monitor
The System Monitor tab displays information concerning the overall status of the
incoming RF channel. It also includes two histogram displays and Pass / Fail / Warn
indications.
5
2
4
3
1
6
Figure 4.3a System Monitor Tab
1. Histogram Displays: The system monitor tab includes two histogram displays.
These displays include a time axis and a vertical auto-ranging signal level axis.
Zoom in or out on the histograms by holding down the left mouse button and moving
the mouse cursor over the selected histogram. Change what the histograms display
by right mouse clicking over the selected histogram and selecting a new
measurement parameter from the pop-up box.
RFXpert User Manual
Page 16 of 60
www.sencore.com
Available choices include: RF Level, Pilot Level, EVM, MER, Margin, PreFEC BER,
PostFEC BER, SER, ErrorSec, BurstES, and PN-23. See Figure 4.3b.
Figure 4.3b Changing the Histogram Display
2. RF Level Bar Graphs: The RF level bar graphs display a continuously updated
level measurements with Pass (green) / Fail (red) / Warn (yellow) color coded
thresholds for quick diagnosis. The level thresholds are user definable. 8-VSB
channels will display average channel power level and pilot level (dBc below the
average channel power level), QAM channels display average channel power level
only, and NTSC will display the video carrier level and the carrier to noise ratio.
Figure 4.3c RF Level Bar Graphs
3. Digital Modulation Bar Graphs: These bar graphs display the MER, Margin,
and EVM for 8-VSB and QAM channels. Pass (green) / Fail (red) / Warn (yellow)
color coded thresholds provide for quick diagnosis. The level thresholds are userdefinable in the settings page. This section will be grayed out when measuring an
NTSC channel.
MER (modulation error ratio) is the digital equivalent of an analog signal-to-noise
ratio displayed in dB. MER is a ratio of signal power to the power of the impairments
within the signal. The larger the MER value, the better the signal quality.
Margin represents how far the MER value is from the Threshold of Visibility (TOV) /
"digital cliff". Margin equals (MER – 15.2 dB) for 8-VSB and (MER – 18.5dB) for
QAM-64. See Appendix A for more details.
EVM (error vector magnitude) is a % RMS value that represents the amplitude ratio
of the RMS error vector amplitude to the largest symbol amplitude. This is a
measurement of how closely the modulated digital "symbols" are received compared
RFXpert User Manual
Page 17 of 60
www.sencore.com
to the theoretical ideal. EVM is calculated from the MER value. The lower the value,
the better the signal quality.
Figure 4.3d Digital Modulation Bar Graphs
4. Digital Bit Error Display: The Digital Bit Error Display within the system monitor
tab provides bit error statistics that are averaged (or counted) over a specified time
window. Defining the window size is done in the settings page. This section is valid
for 8-VSB and QAM measurements, but will be grayed out when measuring an
NTSC channel. Pass (green) / fail (red) / warn (yellow) color coded threshold
indicators provide for quick diagnosis. The thresholds are user-definable.
The PreFEC BER value is the Bit Error Rate expressed before any changes have
been made to the demodulated digital transport stream by the embedded Forward
Error Correction codes. This can be thought of as the raw bit errors in the digital
payload. Values lower than 1x10⁻⁶ are generally considered acceptable. Ranges
from 1x10⁻⁹ (near perfect signal) to 1x10⁻³ (TOV) are typical.
The PostFEC BER value is the Bit Error Rate expressed after changes have been
made to the demodulated digital transport stream by the embedded Forward Error
Correction codes. This can be thought of as the remaining bit errors in the digital
payload after all corrections (improvements) have been made. This value should be
numerically lower than the PreFEC BER. Values lower than 1x10⁻⁸ are generally
considered acceptable.
SER represents segment errors that are measured in the digital transport stream.
The MPEG stream is divided into packets or "segments". Each segment contains
187 data bytes plus one sync byte. A commonly used measure of quality of the final
output stream is Segment Error Rate (SER). SER is computed as the number of
segment errors per second. As with BER, the value is averaged over the duration of
the time window, and reset to 0 every time the window rolls over. An SER value of
about 3 (typically averaged over a 20 second window) occurs at TOV. Once segment
errors start to occur, SER rapidly increases as the signal worsens (cliff effect).
Smaller numbers are better.
ErrorSec represents errored seconds. An errored second is any second that contains
at least one error in the digital transport stream. This measure keeps a count of the
number of errored seconds that occur within the reset window. The value is reset to
0 when the window rolls over.
BurstES represents burst errored seconds - exactly the same as the errored seconds
measurement except that only seconds that contained greater than "burst" number of
errors are counted. A Burst Errored-Second is defined by the number of errors that
must occur to be a burst. This value is set in the Settings > General tab (see Figure
RFXpert User Manual
Page 18 of 60
www.sencore.com
18). This test is useful in distinguishing inconsistent "bursty" type interference
impairments from constant error-rate problems such as poor MER.
PN-23 - This is an industry standard Bit Error Rate test pattern available on most
modulators. For this test to be used on the RFXpert, the modulator must be switched
to test mode to inject the pseudo-random PN-23 bit pattern into the payload data
area of the stream (i.e. the program is taken off-line, and the data bytes are replaced
with a known test pattern). A true BER counter is contained in the receiver of the RF
Probe. It generates the identical pattern, synchronizes itself with the incoming
pattern, and counts actual bit errors via a bit-by-bit comparison.
Note: The PN-23 values will not be valid unless a PN-23 signal is received. Also, the
PN-23 alarm will not indicate a Warn or Fail unless a valid PN-23 signal is received.
Figure 4.3e Digital Bit Error Display
5. Master Alarm: This box gives you a real time indication of the overall status of
the incoming RF channel. If all measurements Pass, the status box will be green. If
any measurement Fails, the status box will be red.
Figure 4.3f Master Alarm
6. Receiver and FEC Lock: These are simple Pass (green) and Fail (red) status
indicators for the incoming signal. Receiver lock is valid for 8-VSB and QAM
channels and is defined as the equalizer being able to synchronize to the incoming
signal. FEC lock indicates that the digital channel has a valid incoming transport
stream.
RFXpert User Manual
Page 19 of 60
www.sencore.com
Modulation Detail
The Modulation Detail tab provides you with measurements and diagrams particular
to a modulated digital (8-VSB and QAM) channel. The measurements will be grayed
out and the diagrams inactive when measuring an NTSC channel.
1
2
3
Figure 4.3g Modulation Detail Tab
1. Digital Modulation Bar Graphs: These three graphs display the exact same
information that was previously described in the System Monitor tab. However, there
are no Pass / Fail / Warn color indications. The bars are always green.
2. Constellation Diagram: The constellation diagram gives a visual indication of
how closely the demodulated digital "symbols" are received compared to the
theoretical ideal. The 8-VSB signal constellation display has 8 lines and the
individual dots (representing symbols) should ideally be in straight lines at the middle
of the vertical dotted lines. The QAM signal constellation display will contain 64
squares and the individual dots (representing symbols) should ideally be in the
center of the squares (QAM 64) or in the corners (QAM 256).
RFXpert User Manual
Page 20 of 60
www.sencore.com
Figure 4.3h 8-VSB and QAM Constellation Displays
3. Eye Diagram: The eye diagram gives another visual means to verify the quality
of the incoming digital channel. This diagram displays the "trace" as the incoming
symbols move from one value to another. The display will look very similar for both
8-VSB and QAM 64 channels (7 eyes, 15 eyes for QAM 256). You should have
"open eyes" in a good incoming signal.
8-VSB
"Eye"
Figure 4.3i Eye Diagram Display
RFXpert User Manual
Page 21 of 60
www.sencore.com
Multipath Detail
The Multipath Detail tab displays information gathered from the RF Probe's adaptive
channel equalizer. The adaptive equalizer uses knowledge of the ideal 8-VSB and
QAM signals to cancel out the effects of multipath (echoes and ghosts) and non-ideal
frequency response in the transmission channel. The DTU-234 RF Probe has been
characterized to remove contributions from the unit's own RF front-end (pre-amp,
tuner, etc.) from the information displayed in this mode. The "taps" of the equalizer
refer to the values of a sampled impulse response of the converged equalizer. The
tap values can reveal information about the types of impairment that the equalizer is
trying to compensate for. These measurements are valid for 8-VSB and QAM
channels and will be inactive on NTSC channels.
1
2
3
Figure 4.3j Multipath Detail Tab
1. Equalizer Loading Bar Graph: The equalizer loading number shows how "hard"
the equalizer is working. The load is computed by taking the RMS value of the taps,
(not including the center tap). This provides a measure of how much energy is going
into correcting for undesired reflections. A lower number indicates that the equalizer
is not working as hard and that the signal is of good quality.
RFXpert User Manual
Page 22 of 60
www.sencore.com
2. Multipath Echo Profile: This is a plot of the tap energy versus time delay from
the channel. The channel is shown as a spike at time t=0, and is represented as
100%. If reflections (echos) of the original signal are present, it will show as another
spike at some positive or negative time delay and reduced percentage from the
selected channel. This graph can assist in determining whether signal problems are
being caused by multipath problems, or not. The center tap (0 µs) corresponds to the
main signal and any other echo is interference and noise.
Figure 4.3k Multipath Echo Profile Graph
3. Channel Response: The Channel Response graph is an FFT transform of the
delay line tap values (time domain) converted to spectral (frequency domain) display.
Ideally, the channel response will be a flat line. However, due to multipath in the
incoming signal, the response will contain peaks and valleys. The 0 dB level is the
peak and the valleys will be at some –dB value below 0. The larger the peak to
valley difference, the worse the incoming signal quality.
Figure 4.3l Channel Response Graph
RFXpert User Manual
Page 23 of 60
www.sencore.com
Spectrum Detail
The RFXpert software includes a Spectrum Detail tab. Upon selecting the Spectrum
Detail tab, all logging, alarming, and channel specific measurements will be disabled.
This is due to the fact that the tuner will be in a sweep mode to provide the spectrum
measurements.
Figure 4.3m Entering Spectrum Detail Mode
All of the Spectrum Analysis windows are auto-ranging. There are three display
options available in the spectrum detail tab.
Channel Spectrum- The Channel Spectrum is a 6 MHz span with a 280 KHz
resolution bandwidth and 100 KHz measurement intervals. The center frequency will
be defined by the channel that you have selected.
Figure 4.3n Channel Spectrum Display
RFXpert User Manual
Page 24 of 60
www.sencore.com
Adjacent Spectrum- The Adjacent Spectrum is an 18 MHz span with a 280 KHz
resolution bandwidth and 200 KHz measurement intervals. The center frequency will
be defined by the channel that you have selected.
Figure 4.3o Adjacent Spectrum Display
System Spectrum- The System Spectrum is a full sweep (50-860 MHz) of the RF
input. A 280 KHz resolution bandwidth measurement is taken of each channel in the
band of the currently selected channel plan.
Figure 4.3p System Spectrum Display
RFXpert User Manual
Page 25 of 60
www.sencore.com
About the RFXpert
The final tab in the measurement display window is an "About" tab. This tab displays
the current version of RFXpert software, RF Probe driver, serial number of the
connected RF Probe, and .dll version numbers. The About tab provides information
only and no values may be changed.
Figure 4.3q RFXpert About Tab
RFXpert User Manual
Page 26 of 60
www.sencore.com
4.4 Measurement and Log Settings
The Settings icon in the Tool Bar of the RFXpert contains several advanced settings
pertaining to the alarming and interval logging parameters of the channel under test.
Figure 4.4a Measurement and Log Settings
Alarm Settings
To configure the alarm limits and alarm logging, select the Alarms tab within the
Settings window. Select the modulation mode in the upper left corner. This allows the
setup of unique alarm limits for each of the different supported modulation schemes.
Figure 4.4b Alarm Settings
Checking the Enable Alarm History Log checkbox will generate a log entry each time
there is a measurement alarm. An alarm is also triggered once a measurement
returns to a good state from a fail state. The location and type of log will be
discussed in the next section on Interval Logging. Users are able to select the
number of days the logs will be kept before purging. Each of the measurements
contained under the System Monitor tab may be set to generate a log entry by
checking the Log on Fail box next to the measurement type.
RFXpert User Manual
Page 27 of 60
www.sencore.com
Each of the measurements contain a series of values that define the Pass / Warn /
Fail limits. Custom values for each measurement can be defined. The values set
here will control the thresholds used throughout the RFXpert software.
The Restore Defaults button in the lower left corner will return all of the values to the
factory settings. The default values are derived from existing standards, industry
practices, and Sencore's extensive experience.
Interval Logging Settings
The Logging tab in the Settings window allows defining the parameters for Interval
Logging. Interval Logging is a snapshot of selected measurements of the tuned
channel at a defined time period that is stored in a log file.
Figure 4.4c Interval Logging
To perform Interval Logging, check the Enable Interval Logging checkbox in the
upper left corner. Then check the measurements that should be included in the
Interval Logging. Next, define the interval (frequency of occurrence) for the
measurement snapshots and how many days logs should be kept before purging.
The bottom portion of the Logging tab contains the path to the log files (both Alarm
and Interval). The default path is C:\Program Files\Sencore\RFXpert\logs\Alarm or
Interval. However, this may be changed by clicking on the Change Path button and
defining another directory path. The View Logs button opens the directory where the
logs are stored. The logs are created as a comma separated text file (.csv) that may
be opened with any text editing or spreadsheet software. One file is created per day
and the file name is based on the date it was created.
RFXpert User Manual
Page 28 of 60
www.sencore.com
Date
5/19/2005
5/19/2005
5/19/2005
5/19/2005
Time
8:56:18 AM
8:57:19 AM
8:58:19 AM
8:59:19 AM
Channel
29
29
29
29
Frequency
563
563
563
563
5/19/2005
9:00:19 AM
29
563
Modulation
Type
8VSB
8VSB
8VSB
8VSB
RF
Level
-10.73
0.73
-10.71
-10.52
-10.76
Pilot
Level
-12.40
-12.37
-12.53
-12.66
8VSB
Figure 4.4d Example Interval Log
Note: The example above only shows a portion of the entire logged
values.
4.5 Snapshot
The RFXpert contains a unique feature that allows you to quickly capture a JPEG
image of any measurement screen for viewing at a later time. To take a Snapshot,
click on the Snapshot button while the desired measurement screen is displayed.
Figure 4.5a Taking a Snapshot
Figure 4.5b Saving the Snapshot JPEG File
Select a location for saving the image. The default name is the date and time of day.
RFXpert User Manual
Page 29 of 60
www.sencore.com
EVM
7.08
7.26
7.11
7.01
4.6 Transport Stream Recording
The RFXpert software allows the incoming digital transport stream on 8-VSB and
QAM channels to be recorded to a transport stream file. The file will be recorded a
directory on the server PC. Click on the Record button to initiate transport stream
recording.
Figure 4.6a Recording a Transport Stream Step 1
A new window will open to enter some basic information.
Figure 4.6b Record Setup
The destination path of the record file is displayed at the top of the Record window
and may be changed by selecting the "…" browse button. Provide a file name using
a .trp extension. Define the duration of the recording in either length of time or by file
size. Click the Record button to initiate recording.
4.7 Equalizer Disable
The DTU-234 RFProbe has a built-in 8-VSB equalizer. Equalizers are widely used in
8-VSB receivers (set top boxes) to facilitate reception of marginal signals containing
large amounts multipath or other channel impairments. The equalizer attempts to
flatten the channel response by canceling signals caused primarily by multipath
echoes. Disabling the equalizer allows more "true" measurements that show signal
quality without the benefit of the channel being equalized. EQ disable is only valid on
8-VSB channels. Mulitpath measurements will be disabled when the EQ is disabled.
RFXpert User Manual
Page 30 of 60
www.sencore.com
Figure 41.7a Disabling the 8-VSB Equalizer
MER value and Constellation / Eye diagram degradation is the most obvious
indication that the EQ has been disabled.
With EQ “On”
With EQ “Off”
Figure 4.7b Signal Differences by Turning EQ On and Off
4.8 Auto Inspect
The Auto Inspect feature of the RFXpert software allows the automatic measurement
and logging of every channel within a defined channel plan. This feature makes it
simple to verify the status of the RF distribution system by providing a report detailing
overall status and measurement reports for individual channels within a plan.
Setting the Profile
Click on the Settings button in the tool bar and select the Auto Inspect tab in the
Settings Window to create profiles and define Auto Inspect parameters.
Figure 4.8a Entering Auto Inspect Settings
RFXpert User Manual
Page 31 of 60
www.sencore.com
2
1
3
Figure 4.8b Auto Inspect Settings Tab
1. Auto Inspect Profiles: The first step to setting up an Auto Inspection is to
define a Profile. The Profile ties a channel plan and a set of measurement
parameters together for performing an automatic analysis. Multiple profiles may
be created for use at many different locations. Profiles may be added/modified/
deleted at any time.
Figure 4.8c Creating an Auto Inspect Profile
After clicking on the Create New Profile button, a new window will prompt the user to
enter a Profile name. Click on the Create button.
2. Select the Channel Plan: A channel plan must be associated with the profile
once a name has been provided. Additional notes for this profile may be stored in the
description field.
RFXpert User Manual
Page 32 of 60
www.sencore.com
Figure 4.8d Defining Parameters for the Auto Inspect Profile
3. Defining the Auto Inspect Measurement Parameters: The bottom portion of
the window is used to define which measurements should be part of the inspection
and the Pass / Fail limits. Use the Mode dropdown box to select the modulation
scheme and define the appropriate measurements and limits. 8-VSB and QAM will
have the same measurements (but different limits) with the exception of Pilot Level
(8-VSB only). NTSC measurements are completely different. The preset
measurement limits are derived from the current settings in the Alarm tab.
RFXpert User Manual
Page 33 of 60
www.sencore.com
Performing an Automatic Inspection
Once an Auto Inspect profile has been defined, Now that you have defined an Auto
Inspect profile(s), you may proceed with performing automatic inspections. Start by
clicking on the Auto Inspect button in the tool bar.
Figure 4.8e Starting an Auto Inspection
The Auto Inspect window will now open. Select the profile to apply and the number of
times to perform the inspection. A single inspection will run once and then create the
report. Multiple inspection mode defines the number of inspections and the time
interval between each inspection. Click on the Run Auto Inspection button to initiate
the inspection. An Auto Inspect report will be generated for each time an inspection
is performed.
Figure 4.8f Performing an Auto Inspection
Figure 4.8g Multiple Auto Inspections in Progress
Enter a site name that will be associated with the inspection. The Auto Inspect report
will open automatically at the end of a single inspection. If multiple auto inspections
were performed, manually select the desired report from the list.
RFXpert User Manual
Page 34 of 60
www.sencore.com
Figure4.8h RFXpert Auto Inspect Report
The Auto Inspect report will not be saved until you click on the Save or Export
buttons at lower right corner of the inspection report. Save will create a file (.rst) that
may be viewed with the RFXpert application at a later time. Export creates a comma
separated text (.csv) file that may be viewed using a standard text editor or
spreadsheet application. Use the print button to send the Auto Inspect Report to a
printer. Saved reports may be viewed by clicking the “View Selected” button as
shown in Figure 4.8g.
RFXpert User Manual
Page 35 of 60
www.sencore.com
5.1 DTU-235 Operations
RFXpert Application General Layout
2
1
3
4
5
6
7
Figure 5.1a RFXpert Overview
1. Tool Bar: Buttons for Connections, Auto Inspection, Settings, Snapshot
(screen capture), and Record.
2. Master Alarm: Allows a quick check of the signal integrity. Green indicates all
measurements are within user-defined limits. Red indicates an out-of-tolerance
condition exists on one or more measurements.
3. Signal Metering: Two-part visual displays for signal level, MER, and Margin.
Located above each meter is the tolerance range setting.
4. Error Information: Detailed information on Pre-FEC BER, Post-FEC BER,
SER, and Error Seconds. An “LED” at the right of each measurement validates
when the reading falls outside of user-defined limits.
5. Histograms: Graphs the value over time for all measurement made in the
Signal Metering section.
6. Navigation Tabs: Provides more detailed information on the measured signal.
The tabs vary depending on the connected probe. The DTU-235 tabs include
Modulation Scheme, Modulation Detail, Spectrum Detail, and About.
7. Selected Channel Information: Lists the tuned channel number, channel
RFXpert User Manual
Page 36 of 60
www.sencore.com
center frequency, channel type, and channel bandwidth. Right-click this area to
directly access the channel by name or use the “+” and “-“ buttons to advance to
next and previous channels.
5.2 Channel Plans
To begin using the RFXpert software a channel plan must be defined. RFXpert
supports an unlimited number of plans, so separate plans may be defined for each
location or modulation type.
Building the Channel Plan
Start by clicking on the Settings button in the toolbar as shown in Figure 5.2a.
Figure 5.2a. Getting into the RFXpert Settings Page
In the General tab there are two buttons for creating plans. Any previously created
plans will be listed in the “Channel Plans” section above the buttons.
Figure 5.2b. Buttons for Creating Plans
RFXpert User Manual
Page 37 of 60
www.sencore.com
Button 1 – “Create New Channel Plan”: Manually creates a new channel plan.
Enter a plan name and select the base channel plan that will be used to begin the
process as shown in Figure 5.2a.
Available pre-defined base channel plans:
-
Australia
China
Eastern Europe
Indonesia
Ireland
Italy
-
Japan
New Zealand
South Africa
United States
Western Europe
Figure 5.2c - Manual Channel Plan Creation
The new channel plan will automatically be filled with the channels from the base
plan that was selected including the appropriate center frequency and channel
bandwidth for each channel. Individual channels may be added, edited or removed
later.
Button 2 – “Auto Channel Search”: The RFXpert software can automatically
generate a channel plan by scanning all channel frequencies in a pre-defined base
plan. Figure 5.2b illustrates setting a Plan Name and selecting the Country.
Unwanted channels can be avoided by setting a minimum RF level for the channel
search. At least one Broadcast Type must be selected for the search.
Figure 5.2d - Automatic Channel Plan Creation
Editing Channel Information
After the channel plans have been defined, individual channel settings may be
adjusted. The areas boxed in red (Figure 5.2e) allow the channel information to be
edited. From the main screen, click the Settings button. On the General tab, select
an available Channel Plan and Channel from the list to see the current settings.
RFXpert User Manual
Page 38 of 60
www.sencore.com
Channel Description
Allows a more convenient label to
be applied to a channel. (i.e.
“WABC HD”)
Center Frequency
Allows the center frequency of a
channel to be edited.
Broadcast Type
Select COFDM or PAL
Channel Bandwith
Select from 6, 7, or 8 MHz
Figure 5.2e - Modifying and Saving Channel Plans
Additional Settings
Below the Channel Plans are additional settings for defining the averaging window
size for signal measurement.
1. BER Options: Define the window size used for averaging / resetting several
measurements that pertain to digital modulation. Three minutes is the factory default
window size. PreFEC BER, PostFEC BER, and SER are average values and the
window size determines the time frame over which the averaging is calculated. The
averaging is reset at an interval equal to the window size. Error Seconds is a
cumulative values and their counters are reset at an interval equal to the window
size.
2. Burst Error Count: Burst Error count defines how many errors must be present
in one second before a BurstES count is triggered.
3. Level Measurement Units: Select between dBmV or dBm.
Selecting the Channel Plan and Channel
A channel plan must be selected before useful measurements can be made using
the DTU-235 RF Probe. Select the channel plan from the list in the General Settings
page and click the OK button. The screen will return to the main display containing
the RF Measurement tabs.
Channel Tuning
To tune to a channel within the selected channel plan, go to the status bar and click
on the +/- buttons to move up or down one channel at a time. Right-click on the
channel information area to open a list of available channels to quickly select any
channel within the channel plan.
RFXpert User Manual
Page 39 of 60
www.sencore.com
Note: Channel Plans are saved as .cha (xml) files. The plans will be retained even if the
software is upgraded. Channel Plan files can be found in the RFXpert program directory
under XML\Plans.
Figure 5.2f Changing Channels
5.3 RF Measurement Tabs
Navigation to the different analysis sections of the RFXpert software is accomplished
by using the series of tabs just below the main detail area. Different views are
available on the System Monitor, Modulation Scheme, Modulation Detail, and
Spectrum Detail pages.
System Monitor
Overall RF signal monitoring and status is displayed on the System Monitor tab. This
view includes the signal RF level, simple error monitoring with “Pass/ Warn/ Fail”
indictors, and selectable histograms.
5
2
4
3
1
6
Figure 5.3a System Monitor Tab
RFXpert User Manual
Page 40 of 60
www.sencore.com
1. Histogram Displays: The system monitor tab includes two histogram displays.
These displays have a time axis of 5 minutes and the level axis is auto-ranging.
Zoom in or out on the histograms by holding down the left mouse button and moving
the mouse cursor over the selected histogram. Change what the histograms display
by right mouse clicking over the selected histogram and selecting a new
measurement parameter from the pop-up box.
Available histogram choices include: RF Level, EVM, MER, PreFEC BER, Post FEC
BER, SER, ErrorSec.
2. RF Level Bar Graph: The RF level bar graph continuously displays color-coded
measurements for quick diagnosis of Pass (green)/ Warn (yellow)/ Fail (red). Alarm
thresholds are user-definable in the settings.
Figure 5.3b RF Level Bar Graphs
3. Digital Modulation Bar Graphs: These bar graphs display the MER, Margin,
and EVM for COFDM channels. Color coded thresholds of Pass (green)/ Warn
(yellow)/ Rail (red) provide for quick diagnosis. The thresholds are user-definable.
MER (modulation error ratio) is the digital equivalent of an analog signal-to-noise
ratio displayed in dB. MER is a ratio of signal power to the power of the impairments
within the signal. The larger the MER value, the better the signal quality.
Margin represents how far the MER value is from a QEF (Quasi Error Free) signal.
Quasi error free reception in Digital Video Broadcast 8DVB) is defined as one noncorrectable error per hour at the input of an MPEG 2 decoder. The bit error rate
(BER) is 10exp-11. Reference the COFDM table near the end of the manual for more
information.
EVM (error vector magnitude) is a % RMS value that represents the amplitude ratio
of the RMS error vector amplitude to the largest symbol amplitude. This is basically
how closely the modulated digital "symbols" are received compared to the theoretical
ideal. EVM is calculated from the MER value. The lower the value, the better the
signal quality.
4. Digital Bit Error Display: The Digital Bit Error Display within the system monitor
tab provides bit error statistics that are averaged (or counted) over a specified time
window. Defining the window size was described in the previous section. This
section is valid for 8-VSB and QAM measurements, but will be grayed out when
RFXpert User Manual
Page 41 of 60
www.sencore.com
measuring an NTSC channel. Pass (green) / fail (red) / warn (yellow) color coded
threshold indicators provide for quick diagnosis. The thresholds are user-definable.
PreFEC BER value is the Bit Error Rate expressed before any changes have been
made to the demodulated digital transport stream by the embedded Forward Error
Correction codes. This can be thought of as the raw bit errors in the digital payload.
Values lower than 1x10⁻⁶ are generally considered acceptable. Ranges from 1x10⁻⁹
(near perfect signal) to 1x10⁻³ (QEF) are typical.
PostFEC BER value is the Bit Error Rate expressed after changes have been made
to the demodulated digital transport stream by the embedded Forward Error
Correction codes. This can be thought of as the remaining bit errors in the digital
payload after all corrections (improvements) have been made. This value should be
numerically lower than the PreFEC BER. Values lower than 1x10⁻⁸ are generally
considered acceptable.
SER represents segment errors that are measured in the digital transport stream.
The MPEG stream is divided into packets or "segments". Each segment contains
187 data bytes plus one sync byte. A commonly used measure of quality of the final
output stream is Segment Error Rate (SER). SER is computed as the number of
segment errors per second. As with BER, the value is averaged over the duration of
the time window, and reset to 0 every time the window rolls over. An SER value of
about 3 (typically averaged over a 20 second window) occurs at QEF. Once segment
errors start to occur, SER rapidly increases as the signal worsens (cliff effect).
Smaller numbers are better.
ErrorSec represents errored seconds. An errored second is any second that contains
at least one error in the digital transport stream. This measure keeps a count of the
number of errored seconds that occur within the reset window. The value is reset to
0 when the window rolls over.
Figure 5.3c Digital Bit Error Display
5. Master Alarm: This box gives a real time indication of the overall status of the
incoming RF channel. If all measurements pass, the status box will be green. If any
measurement fails, the status box will be red.
6. Receiver and FEC Lock: These are simple “Pass” (green) and “Fail” (red) status
indicators for the incoming signal. Receiver lock is valid for COFDM channels and is
defined as the equalizer being able to synchronize to the incoming signal. FEC lock
indicates that the digital channel has a valid incoming transport stream.
RFXpert User Manual
Page 42 of 60
www.sencore.com
Modulation Detail
The Modulation Detail tab provides you with measurements and diagrams particular
to a modulated COFDM channel.
1
2
3
Figure 5.3d Modulation Detail Tab
1. Digital Modulation Bar Graphs: These three graphs display the exact same
information that was previously described in the System Monitor tab. MER, Margin,
and EVM values are displayed for convenient reference.
2. Constellation Diagram: The constellation diagram gives a visual indication of
how closely the demodulated digital "symbols" are received compared to the
theoretical ideal. The QAM signal constellation display will contain 64 squares and
the individual dots (representing symbols) should ideally be in the center of the
squares (QAM 64).
Figure 5.3e COFDM – QAM64 Constellation Display
RFXpert User Manual
Page 43 of 60
www.sencore.com
3. Eye Diagram: The eye diagram gives another visual means to verify the
modulation quality of the incoming digital channel. This diagram displays the "trace"
as the incoming symbols move from one value to another. Open “eyes” indicate a
good incoming signal.
“Eye"
Figure 5.3f Eye Diagram Display
RFXpert User Manual
Page 44 of 60
www.sencore.com
Spectrum Detail
The RFXpert software includes a Spectrum Detail tab. Upon selecting the Spectrum
Detail tab, all logging, alarming, and channel specific measurements will be disabled.
This is due to the fact that the tuner will be in a sweep mode to provide the spectrum
measurements.
Figure 5.3g Entering Spectrum Detail Mode
All of the Spectrum Analysis windows are auto-ranging. There are three display
options in the Spectrum Detail tab.
Channel Spectrum- The Channel Spectrum is a 6, 7, or 8 MHz span with a 280
KHz resolution bandwidth and 100 KHz measurement intervals. The center
frequency will be defined by the channel that you have selected.
Figure 5.3h Channel Spectrum Display
RFXpert User Manual
Page 45 of 60
www.sencore.com
Adjacent Spectrum- The Adjacent Spectrum is an 18, 21, or 24 MHz span with a
280 KHz resolution bandwidth and 200 KHz measurement intervals. The center
frequency will be defined by the channel that you have selected.
Figure 5.3i Adjacent Spectrum Display
System Spectrum- The System Spectrum is a full sweep (50-850 MHz) of the RF
input. A 280 KHz resolution bandwidth measurement is taken of each channel in the
band of the currently selected channel plan.
Figure 5.3j System Spectrum Display
RFXpert User Manual
Page 46 of 60
www.sencore.com
About the RFXpert
The final tab in the measurement display window is an "About" tab. This tab displays
the current version of RFXpert software, RF Probe driver, serial number of the
connected RF Probe, and .dll version numbers. The About tab provides information
only and no values may be changed.
Figure 5.3k RFXpert About Tab
RFXpert User Manual
Page 47 of 60
www.sencore.com
5.4 Measurement and Log Settings
The Settings icon in the Tool Bar of the RFXpert contains several advanced settings
pertaining to the alarming and interval logging parameters of the channel under test.
Figure 5.4a Measurement and Log Settings
Alarm Settings
To configure the alarm limits and alarm logging, select the Alarms tab within the
Settings window. Select the modulation mode in the upper left corner. This allows the
setup of unique alarm limits for each of the different supported modulation schemes.
Figure 5.4b Alarm Settings
Checking the Enable Alarm History Log will generate a log entry each time there is a
measurement alarm. An alarm is also triggered once a measurement returns to a
good state from a fail state. The location and type of log will be discussed in the next
section on Interval Logging. Users are able to select the number of days the logs will
be kept before purging. Each of the measurements contained under the System
Monitor tab may be set to generate a log entry by checking the Log on Fail box next
to the measurement type.
Each of the measurements contain a series of values that define the Pass / Warn /
Fail limits. Custom values for each measurement can be defined. The Restore
Defaults button in the lower left corner will return all of the values to the factory
RFXpert User Manual
Page 48 of 60
www.sencore.com
settings. The default values are derived from existing standards, industry practices,
and Sencore's extensive experience.
Interval Logging Settings
The Logging tab in the Settings window allows you to define the parameters for
Interval Logging. Interval Logging is basically a snapshot of selected measurements
of the tuned channel at a defined time period that is stored in a log file.
Figure 5.4c Interval Logging
To perform Interval Logging, check the Enable Interval Logging box in the upper left
corner. Then check which measurements should be included in the Interval Logging.
Next, define the interval (frequency of occurrence) for the measurement snapshots
and how many days worth of logs to keep before purging.
The bottom portion of the Logging tab contains the path to the log files (both Alarm
and Interval). The default path is :\Program Files\Sencore\RFXpert\logs\Alarm or
Interval. However, this may be changed by clicking on the Change Path button and
defining another directory path. The View Logs button opens the directory where the
logs are stored. The logs are created as a comma separated text file (.csv) that may
be opened with any text editing or spreadsheet software. One file is created per day
and the file name is the date it was created.
RFXpert User Manual
Page 49 of 60
www.sencore.com
Date
11/03/2006
11/03/2006
11/03/2006
11/03/2006
11/03/2006
Time
1:07:55 PM
1:07:57 PM
1:07:59 PM
1:10:44
:10:44 PM
1:10:44 PM
Ch
3
3
3
3
3
Frequency
57.504
57.504
57.504
57.504
57.504
Type
COFDM
COFDM
COFDM
COFDM
COFDM
Test
RF Level
PreFEC BER
PreFEC BER
Margin
Value
-34.3
3.30E-04
1.70E-04
-3.1
Figure 5.4d Example Interval Log
Note: The example above is only shows a portion of the entire logged
values.
5.5 Snapshot
The RFXpert contains a unique feature that allows you to quickly capture a JPEG
image of any measurement screen for viewing at a later time. To take a Snapshot,
simply click on the Snapshot button while the desired measurement screen is
displayed.
Figure 5.5a Taking a Snapshot
Select a location to save the image and name the JPEG image. The default name is
the date and time of day.
Figure 5.5b Saving the Snapshot JPEG File
RFXpert User Manual
Page 50 of 60
www.sencore.com
Event
FAIL
FAIL
GOOD
FAIL
5.6 Transport Stream Recording
The RFXpert software allows you to capture the incoming digital transport stream on
8-VSB and QAM channels. The file will be recorded a directory on the server PC.
Click on the Record button to initiate transport stream recording.
Figure 5.6a Recording a Transport Stream Step 1
A new window will open to enter some basic information.
Figure 5.6b Record Setup
The destination path of the record file is displayed at the top of the Record window
and may be changed by selecting the "…" browse button. Provide a file name; a .trp
extension will be added to all record files. Define the duration of the recording in
either length of time or by file size. Click the Record button to initiate recording.
5.7 Auto Inspect
The Auto Inspect feature of the RFXpert software allows the automatic measurement
and logging of every channel within a defined channel plan. This feature makes it
simple to verify the status of the RF distribution system by providing a report detailing
overall status and measurement reports for individual channels within a plan.
RFXpert User Manual
Page 51 of 60
www.sencore.com
Setting the Profile
Click on the Settings button in the tool bar and select the Auto Inspect tab in the
Settings Window to create profiles and define Auto Inspect parameters.
Figure 5.7a Entering Auto Inspect Settings
2
1
3
Figure 5.7b Auto Inspect Settings Tab
1. Auto Inspect Profiles: The first step to setting up an Auto Inspection is to define
a Profile. The Profile ties a channel plan and a set of measurement parameters
together for performance of an automatic analysis of the system. Multiple profiles for
use at many different locations may be created. Profiles may be added/modified/
deleted at any time.
Figure 5.7c Creating an Auto Inspect Profile
RFXpert User Manual
Page 52 of 60
www.sencore.com
After clicking on the Create New Profile button, a new window will prompt the user to
enter a Profile name. Click on the Create button to proceed.
2. Select the Channel Plan: Associate the Channel Plan with the Profile. You may
also enter notes in the Description field.
Figure 5.7d Defining Parameters for the Auto Inspect Profile
3. Defining the Auto Inspect Measurement Parameters: Define which
measurements should be part of the inspection and the Pass / Fail limits. Use the
Mode dropdown box to select the modulation scheme and define the appropriate
measurements and limits. The preset measurement limits are derived from the
current settings in the Alarm tab.
RFXpert User Manual
Page 53 of 60
www.sencore.com
Performing an Automatic Inspection
Once an Auto Inspect profile has been defined, Now that you have defined an Auto
Inspect profile(s), you may proceed with performing automatic inspections. Start by
clicking on the Auto Inspect button in the tool bar.
Figure 5.7e Starting an Auto Inspection
The Auto Inspect window will now open. Select the profile that you wish to apply and
the number of times you wish to perform the inspection. A single inspection will run
once and then create the report. Multiple inspections are defined by the number of
inspections and the interval between each inspection. Click on the Run Auto
Inspection button to initiate the inspection. An Auto Inspect report will be generated
for each time an inspection is performed.
Figure 5.7f Performing an Auto Inspection
You will now be prompted to enter a site name that will be associated with the
inspection.
Figure 5.7g Entering a Site Name
RFXpert User Manual
Page 54 of 60
www.sencore.com
Figure 5.7h Multiple Auto Inspections in Progress
The Auto Inspect report will open automatically at the end of a single inspection.
You must manually select the desired report from the list if a multiple auto inspection
was performed (see figure above).
Figure 5.7i RFXpert Auto Inspect Report
The Auto Inspect report will not be saved until you click on the Save or Export
buttons at lower right corner of the inspection report. Save will create a file (.rst) that
may be viewed with the RFXpert application at a later time. Export creates a comma
separated text (.csv) file that may be viewed using a standard text editor or
spreadsheet application. You may also select print to receive a hard copy from an
attached printer. Select the Open and View Inspection Results button in the Auto
Inspect window to view saved reports.
RFXpert User Manual
Page 55 of 60
www.sencore.com
6.1 Using the DekTec StreamXpert (DTC-320)
Transport stream analysis capabilities can be added to the DTU-234 or DTU-235 RF
Probe by purchasing the DekTec StreamXpert (DTC-320) software. The software
and manual can be found on the USB Flash drive included with the RF Probe. A
license must be purchased and installed to use the StreamXpert software.
All information regarding software installation and operation is contained in the
StreamXpert manual.
Figure 6.1a DekTec StreamXpert (DTC-320) Software Application
RFXpert User Manual
Page 56 of 60
www.sencore.com
Appendix A: RFXpert Default Values for DTU-234
RF Level
Digital
Alarm Settings
Low
Low
Fail
Warn
-15
-10
Video Carrier
Level
Pilot Level
NTSC
-15
-10
40
8VSB
-16
-14
-9
Carrier/Noise
Ratio
MER
NTSC
43
8VSB
MER
Mod Type
High
Warn
40
High
Fail
45
Histogram
Low
High
-30
50
45
-30
50
9
-20
10
48
0
80
18
23
0
35
QAM64B
20
24
0
35
MER
QAM256B
25
29
0
35
EVM
8VSB
6.6
11.7
0
16
EVM
QAM64B
5.8
9.3
0
16
EVM
QAM256B
3.3
5.2
0
16
Margin
Digital
0
20
Pre BER
Digital
1E-5
2E-4
Post BER
Digital
1E-6
2E-5
SER
Digital
10
15
ErrorSec
Digital
10
15
BurstES
Digital
5
8
PN-23
Digital
1E-6
2E-5
3
8
Standard TOV Values used in Margin Calculation
8VSB = 15.2 dB
QAM64B = 18.5 dB
QAM256B = 23.5 dB
RFXpert User Manual
Page 57 of 60
www.sencore.com
Appendix B: RFXpert Default Values for DTU-235
RF Level
Digital
Alarm Settings
Low
Low
Fail
Warn
-15
-10
Video Carrier
Level
MER
PAL
-15
-10
Digital
3+
QEF
8+
QEF
ErrorSec
Digital
10
15
EVM
Digital
6.6
11.7
Margin
Digital
Pre BER
Digital
1E-6
2E-4
Post BER
Digital
1E-6
2E-5
SER
Digital
10
15
Mod Type
3
High
Warn
40
High
Fail
45
40
45
8
Histogram
Low
High
-30
50
-30
50
0
20
0
16
0
20
Quasi Error-Free (QEF) Reference
Constellation
QPSK
QPSK
QPSK
QPSK
QPSK
16-QAM
16-QAM
16-QAM
16-QAM
16-QAM
64-QAM
64-QAM
64-QAM
64-QAM
64-QAM
RFXpert User Manual
Code Rate
1/2
2/3
3/4
5/6
7/8
1/2
2/3
3/4
5/6
7/8
1/2
2/3
3/4
5/6
7/8
QEF (dB_
3.1
4.9
5.9
6.9
7.7
8.8
11.1
12.5
13.5
13.9
14.4
16.5
18.0
19.3
20.1
Page 58 of 60
www.sencore.com
Appendix C: Digital Channel Power Measurement and
Spectral Displays
This appendix provides information on power measurement and spectrum displays.
These concepts are then applied to the DTU-234 or DTU-235 RF Probe and RFXpert
software.
The power of digital communications channels such as 8-VSB or COFDM modulated
TV channels is usually expressed in dBm or dBmV. dBm is a measure of power as
dBmV is a measure of voltage.
0 dbmV = 1milliVolt
0 dBm = 1milliWatt
X(dBmV) = 20*LOG(Y(volts)/.001)
X(dBm) = 10*LOG(X(watts)/.001)
In order to convert between dBm and dBmV, the system impedance must be known.
(Because a signal with a given fixed power will generate different voltages across
different impedances).
In a 75 Ohm system:
0 dBm = +48.75 dBmV
0 dBmV = -48.75 dBm
In a 50 Ohm system:
0 dBm = +47 dBmV
0 dBmV = -47 dBm
The channel power is the average power measured within the 3dB bandwidth of the
channel (approximately 5.38MHz for 8-VSB, 5.06MHz for QAM 64, and 5.38MHz for
QAM 256). The average digital channel power is often measured with a signal level
meter, spectrum analyzer, or power meter.
The Sencore DTU-234 or DTU-235 RF Probe has built-in averaging circuits to
accurately measure the average channel power of a digital channel (8-VSB,
COFDM).
Viewing the digital channel on the RFXpert spectral display can be confusing
because the signal trace indicates a level that is much lower than the actual average
channel power (level) measurement. This difference is due to the narrow bandpass
filter in the spectral display's signal detector, also known as the resolution-bandwidth
(RBW) filter. The spectral display is created by sweeping the RBW filter across the
bandwidth of the channel. The noise like qualities of a digital channel cause it to be
attenuated by the narrow RBW filter. This attenuation is what causes the difference
between the trace level and the level displayed on the System Monitor tab.
RFXpert User Manual
Page 59 of 60
www.sencore.com
Appendix D: QAM Constellation Impairment Examples
The following constellation diagrams are examples of impairments on a QAM 64
channel. This will also apply to QAM 256. These apply to the DTU-234 only.
Noise
CW Interference
Phase Noise
I/Q Gain Error
#156
II/Q Phase Error
RFXpert User Manual
IF Compression
Page 60 of 60
www.sencore.com