1
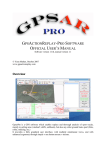
user manual english versione 1.0.0 Index 1. Generality pag. 3 2. Important Parameters in Gait Analysis pag. 4 3. System Components pag. 8 4. Components Installation pag. 9 5. Sensor Positioning pag. 11 6. Exam Execution pag. 12 7. Results Evaluation pag. 15 8. Walking Pattern Manual Identification pag. 23 9. WALK-‐L5 XL -‐Lower Trunk Kinematic During Walking pag. 26 -‐Results Analysis pag. 27 10. Protocol Validation pag. 31 2 GENERALITY The spatial and temporal walking parameters control is one of the more useful exam to evaluate riabilitative, post traumatic and post operating conditions, to characterize pathology and to study walking. This parameters are usually identified through stereophotogrammetric systems which involve professional staff and extremely long execution time. An important part of this parameters con be revealed also through the use of G-‐Walk system. The measurements executed through G-‐Walk system respect the fundamental rules to be considered scientific. The test should satisfy three basic criteria to be considered scientific: • A test should be valid, that is the degree of the agreement between the measure and the phenomenon "true" value must be high. The validity assessment requires an external standard reference. • A test should be reproducible, i.e. it must agree between same phenomenon repeated measures. It provides a measure of detection method "accuracy". Is obtained when measuring the same thing several times and under the same conditions (tools, time, place), I get the same results. • A test should be reliable, that is the variability of the observer and the instrument must be kept to a minimum. From these considerations was born G-‐Walk system you choose and you are going to use. 3 IMPORTANT PARAMETERS IN GAIT ANALYSIS Human movement is a complex phenomenon influenced by several factors: physiological, mechanical, psychological, etc.. The ability to define qualitative and quantitative parameters of the movement provides a source of knowledge for clinicians to accurately diagnose and treat a wide variety of medical conditions. Human movement has been studied in relation to various diseases. Many of these involve reductions of mobility as osteoarthritis, obesity, stroke, chronic pulmonary disease, multiple sclerosis and Parkinson's disease. Many other areas of study investigated, such as the analysis of young and elderly subjects activity patterns, people with neck and back pain, the mentally ill persons, subjects with chronic diseases, etc.. Walking is one of the most common human physical activity and plays an important role in daily living. During walking, more than 1,000 muscles are synchronized to move more than 200 bones around 100 mobile joints. Gait adaptation, as occurs in the elderly population or in presence of specific motor deficits, may be associated with the overall muscle strength reduction due to loss of motor neurons, muscle fibers and aerobic capacity. Although "Walking" is considered a complex task, a healthy person who walks to his chosen speed, made his task to a minimum energy cost. In fact, a decline in mobility economy indicates that more work is required to perform a physical task, for example: walking, and may promote an abnormal gait pattern. A model of normal gait is essential to maintaining independence in older adults or in pathological subjects. Hence a definite need for objective measures, because without them, you reduce the quality of treatment decisions, due to the surveys are often subjective and unreliable. In fact they must be used quantitative measurements if you have to demonstrate the effectiveness of a treatment protocol or function, which becomes increasingly important as a resource for health care and which is increasingly used, and suggests more responsible who provides care health. The gait analysis is a daily responsibility for the therapist who practices it but it has shown that the visual detection, which is almost universally used for this purpose, at best, is not reliable while the measurement of gait time and distance factors have proven clinically useful.The G-‐Walk system provides effortless valid and reliable measurements in real time, such as symmetry, cadence, stride length, speed, and many other important gait parameters. Here we try to explain in more detail how the 4 quantitative value of these parameters might influence the walking evaluation by the clinician or sports training, attracting some of the most common pathological conditions. • Simmetry In general, healthy subject walk is symmetric both with regard to temporal and spatial phases of contact with the surface. In case of movement disorder pathologies such as stroke or limbs amputation, the subject abandons movement symmetry to make up for lateral sensorimotor deficiencies due to an improper foot-‐ground contact. Symmetry is an important feature of walking, especially after stroke episodes. Representing the extent of the parallel between the two legs, the symmetry can provide some measures of walking control, different from that provided by conventional measures such as speed and can play a decisive role in guiding decisions on the treatment choice by the clinician. In fact, the gait symmetry is clinically relevant since it can be associated with a number of consequences with respect to pathological condition such as inefficiency, problems in balance control, the risk of non-‐paretic lower limb musculoskeletal injury and the decrease in bone mass density in the paretic limb. For these reasons, the asymmetry in the spatial-‐temporal parameters has been commonly used in clinic to review the walking pattern in patients who have suffered a stroke. In particular the temporal asymmetry of the swing phase is a significant parameter for predicting the hemiparetic walking performance, because it is strongly correlated with the phases of motor recovery, walking speed and falls. The step length asymmetry is related to propulsive force generation during hemiparetic walking. The subjects walk creating a lower propulsion in the paretic side with relatively longer steps. This suggests that the motor mechanism to run a longer step in the paretic side, may be the most non-‐paretic leg compensatory propulsion. In addition, those with more severe hemiparesis (which depend on abnormal muscles flexor and extensor synergies) walk with paretic steps longer than in the non-‐paretic side. Nevertheless, the step asymmetric length not necessarily limits self-‐determined walking speed due to other compensatory mechanisms. Symmetry is a very important parameter in the evaluation and design of prostheses for lower limb, since, in rehabilitation, it is common practice trying to restore the lower limb amputee with perfect walking symmetry. This happens, usually using the so-‐called "visual gait analysis," or relying only on observational skills of the therapist. Studies on different populations with an amputee lower limb, have shown that all amputees have a asymmetric gait also in presence of high-‐tech prosthetic components. On the other hand, the results suggest that a perfect time symmetry is not sufficient to balance the shock load between the healthy side and the amputee, and then the rehabilitation process should aim to more subject-‐ specific objectives, supported by quantitative and objective data. The quantitative analysis of the movement, applied through wearable and easy to use devices, can be a valuable addition to what has been done so far and allow the creation of reference database, useful for patients comparative assessment. • Speed A healthy individual, who has a symmetrical stride, can reach walking speed of the order of 1.3 m/s. Normal subjects, although they can voluntarily modify, if necessary, their walking speed, have a spontaneous speed which is defined as free walking speed, which expresses the optimal functional balance of the physical qualities of the subject. The factors that determine the free walking speed in normal subjects are stride length and cadence, with a fairly constant and linear relationship between the various subjects. This value, however, shows significant changes due to 5 various factors such as anthropometric characteristics, age, activity motivation and health status. In fact, it remains stable until about age 70, then decreases by about 15% for each decade of life. The speed is reduced because the elderly tends to walk with shorter strides. Where there is a neural, skeletal or muscle deficit, the optimal speed from an energy standpoint is abandoned for one that gives you more stability, less pain and greater safety. This results in an overall reduction in gait speed, decreased joints motion range and attenuation in dynamics actions changing of the subject. Therefore, speed becomes an important parameter for any diseases that go to influence gait, such as neurological disorders that lead to hemiparesis like stroke or to evaluate the effectiveness of a lower limb prosthesis. The walking ability recovery and the gait cycle rehabilitation are extremely important in these patients. The walking pattern of hemiparetic subject is characterized by a speed, cadence and stride length reduction. An important effect in slowing down or in an asymmetric walk is to increase the energy consumed walking the same distance: an hemiparetic subject adopting an extremely low spontaneous walking speed appears to have a double energy consumption compared to a healthy subject. Furthermore, the speed variability is the best predictive factor of falls during walking (accuracy of 65%). For these falls, the step length variability inclusion, as a second gait measure in the logistic model, significantly improved the predictions (accuracy of 75%). • Double and single support The double support is the moment when both feet are on the ground. Increases over the years (from 18% in young adults it gets to 26% in the elderly). If the time spent standing in double support increases, the walking speed and leg progress also reduce; this can occur when walking on land that has balance problems. For example in the hemiparetic subjects are recorded a not affected limb single support period and a double support duration significantly increased compared to normal. Moreover, despite speed variability is the best predictive factor of falls, also the double support time variability would be a strong predictive factor, with the advantage of requiring only temporal data. So it might be more appropriate in some clinical settings. • Cadence It is preferred for each individual and represents the walking path with a lower rate of energy expenditure for subjective body composition: generally subjects higher make longer steps at a slower pace, lower ones make shorter steps at a faster pace. Women have a cadence (steps or strides frequency) higher than men: 117 steps/ min against 111 steps / min for men. The adult average cadence (men and women) is about 113 steps/ min. Cadence does not change with age but as a result of pathological conditions there may be a significant reduction. • Stride length The step length for normal people is on average 1.41 m with gender differences. Men have a stride length of 14% higher than women. Decreases in the elderly and pathological subject in part because of muscle weakness and partly due to the difficulty of balance control in monopodalic load. • Stride length as percentage of height The step length is in normal walking speed to about 80-‐90% of the body height. It depends on the lower limbs length, on dual support instant (which is reduced to zero in the transition from walking to running, because at higher speeds the stance phase reduces), the knee extension degree, the hind limb metatarsophalangeal joints extension, the anterior limb thigh flexion. 6 • Stance and Swing According to J. Peery definition, the gait cycle can be divided into two main periods: the period of support or Stance and the period of Swing. The first represents the time interval during which the foot is in contact with the ground (60% of gait cycle). The second represents the time interval during which the limb is suspended and produces the forward progression (40% of gait cycle). The stance phase includes the thigh extension with ankle dorsiflexion to move the body forward. There is a pelvis lateral shift toward the side of the body in stance. Knee flexion occurs at the time of heel contact followed by its extension and a further flexion just before the pre-‐swing phase. The knee is flexed at the initial stage of the swing then stretching in preparation for the next heel contact. So there are two cycles of flexion and extension at each gait cycle. The ankle is plantarflexed from initial contact until the beginning of single support then there is dorsiflexed for the remainder of the single support phase. There is a substantial plantarflexion in pre-‐swing and then the ankle is dorsiflexed in the neutral position to guarantee foot stability during swing. The various rehabilitation programs must take into account the importance of muscle contraction and relaxation synergies and identify the most appropriate training exercises to perform a given motor task in pathological subjects. For example, individuals with upper motor neuron lesions have difficulty with the support, propulsion and balance. Patients suffering from the consequences of a head injury, albeit with significant differences between a person and another, also depending on the pathological condition severity, are characterized by a decreased walking speed with reduced stride length, a lower stance duration and an increased swing duration of the limbs involved in motor dysfunction. The healthy limb has a rather more prolonged stance phase. From phases duration variability analysis during walking, you can test the rehabilitation treatment efficacy. Similarly, it is possible to analyze the correct behavior of prostheses and orthoses that have the task of replicating the natural movement of the lower limbs during walking in hemiparetic patients or with amputated limbs. Prostheses and orthoses, for example, it attempts to replicate the knee controlled flexion which will be a walking speed function to ensure full flexion during the swing. In fact it is important to note that if you want the energy consumed in the walk is similar to that charge during a normal walking, motion should be made as regular as possible. Hence the importance of studying the walking rolling and swing phases which could be easily obtained with the G-‐Walk system. 7 SYSTEM COMPONENTS The protocol WALK uses the L1Sens-‐B type sensor, G-‐SENSOR with Bluetooth connection to PC. • G-‐SENSOR 8 COMPONENTS INSTALLATION Before starting a new session of analysis follow the following connection procedure: 1. Use the icon to check your computer's Bluetooth . 2. Select the connection sequence: 3. Select the device: 4. Activate the connection, at the end the following screen will appear: 9 5. You can now start the protocol WalkL5 by selecting it from G-‐STUDIO: 6. Whatever protocol you will get a screen that has the following zone configuration: 7. Use the following button to connect the G-‐SENSOR after you setted on the correct communication port 8. At the end you will get the connection confirmation. 10 . SENSOR POSITIONING The sensor has to be placed on L5 as shown. Position the sensor with switch placed upward and picture facing out. To apply the sensor use the proper belt or other elastic belts. Pay attention, when you position the sensor, it is as vertical as possible with connector placed upward. 11 EXAM EXECUTION After checking the lights on the device does not blink (battery discharged), proceed by starting the BIOMECH STUDIO program. After entering the patient, select the G-‐Walk protocol called WALK L5. It will appear the following window: Proceed to connect as reported previously, depending on the sensor used. 12 Verify that the sensor is working properly. To do this, use the icon and move the sensor. If it works properly, a list of real time sensor values will be presented on the screen left side and on the screen you will see the sensors curves. Just below the display window of the signals curves is on the left shows the device while on the right are the commands that allows you batteries level to enable or disable the display of each of the three signals of the accelerometer, magnetometer and gyroscope. On the last line of the screen there are the following information: -‐ the communication port number; -‐ the "G" values and frequency of the sensor. Press the Stop Exercise command to stop the on line visualization . : Verify the sensor setting after connection through the command this command gives the possibility to set the acquisition frequency and the accelerometer sensitivity. For this type of analysis, the frequency can be set to 50 Hz or 100 Hz while the “g” value should be set to 0. Remember, if you want to change 13 accelerometer sensitivity, to disconnect and reconnect the device after change to make the setting effective. To perform the exam press the Start On Line command, then, when the subject is , wait a few seconds with the subject in static ready, press the button position to stabilize the accelerometer signal, then instruct the subject in the exercise performance, asking him to perform several walking repetitions and start the acquisition. The subject can freely walk for a 20 metres distance and can start walking with his preferred foot. In the case the subject stops, turns around and starts walking again, there is not duty about the walking starting foot. It is possible to execute an illimited number of walking. To ensure a correct gait analysis should be carried out acquisitions of at least 10 seconds. We advise you to execute 3 or 4 walking. It is also necessary the subject remains a few seconds in a static position at the exercise end to ensure the stabilization of the signal prior to stopping the acquisition. At the end press the command . It will appear the following window: Press OK to continue. To end this analysis phase press the command . Remember to close the Bluetooth connection using the command . 14 RESULTS EVALUATION Pressing Ok after a capture session or opening a test from the archive (see G-‐ STUDIO manual) examination summary page will be allocated as follows: Here you can identify 4 different windows using the scroll bar. You can read their description on end. 1. Data In the Table on the top, the characteristic walking parameters summarizing data are reported. You can also compare them with normative data usually reported in literature. 15 In particular it is possible visualize data about: -‐Cadence [strides/min], as the number of strides in a minute; -‐Left Step Length [% of the gait cycle], as the distance between left heel strike and right heel strike per cent of gait cycle length; -‐Right Step Length [% of the gait cycle], as the distance between right heel strike and left heel strike per cent of gait cycle length; -‐Gait Cycle Duration [s], as time between two consecutive heel strikes of the same foot; -‐Left Step Duration [s], as time between left heel strike and right heel strike. On the right it is shown the Symmetry [%] value per cent of gait cycle. -‐Right Step Duration [s], as time between right heel strike and left heel strike. On the right it is shown the Symmetry [%] value per cent of gait cycle; -‐Stance Duration [% of the gait cycle], as right and left average foot support phase duration per cent of gait cycle; -‐Left Stance Duration [% of the gait cycle], as left foot support phase duration per cent of gait cycle; -‐Right Stance Duration [% of the gait cycle], as right foot support phase duration per cent of gait cycle; 16 -‐Swing Duration [% of the gait cycle], as right and left average foot swing phase duration per cent of gait cycle; -‐Left Swing Duration [% of the gait cycle], as left foot swing phase duration per cent of gait cycle; -‐Right Swing Duration [% of the gait cycle], as right foot swing phase duration per cent of gait cycle; -‐Double support duration [% of the gait cycle], as both feet support phase duration per cent of gait cycle; -‐Single support duration [% of the gait cycle], as one foot support phase duration per cent of gait cycle; It is reported the mean value and the standard deviation of each parameters. 2. Times and synchronization: From the signal peaks identification it is possible to calculate the step duration, as the time between the support of one foot and the support of the contra lateral foot. On the window below the acceleration signal one, you can see the synchronization, i.e. the alternative succession of foot contact, represented with a red rounds for the left foot and with a blue rounds for the right foot, and the single step temporal duration. The software can recognize automatically if you start walking with right or left foot. 3. Gait Cycle: 17 The curve above reproduces the gait cycle in the form traditionally provided by Gait Analysis. In this case it is possible to distinguish the following phases: Time – a..b: LEFT STEP, the positive peak a indicated the left heel strike while the positive peak b indicated the right heel strike. Time – b..c: RIGHT STEP, the positive peak b indicated the right heel strike while the positive peak c indicated the left heel strike which completes the stride cycle. Time – a..d: DUOBLE SUPPORT, the positive peak a indicated the left heel strike while the negative peak d indicated the right toe off. During this phase both feet are in contact with the ground. Time – d..b: RIGHT SWING (or SINGLE SUPPORT), the negative peak d indicated the right toe off while the positive peak b indicated the right heel strike. During this phase only the left foot is in contact with the ground (single support) while the right is in swing phase. 18 Time – b..e: DUOBLE SUPPORT, the positive peak b indicated the right heel strike while the negative peak e indicated the left toe off. During this phase both feet are in contact with the ground. Time – d..b: LEFT SWING (or SINGLE SUPPORT), the negative peak e indicated the left toe off while the positive peak c indicated the left heel strike. During this phase only the right foot is in contact with the ground (single support) while the left is in swing phase. Time – a..e: LEFT STANCE, the positive peak a indicated the left heel strike while the negative peak e indicated the left toe off. This interval has all the time when the left foot is in contact with the ground, from heel strike to toe off. The areas under the curve filled with oblique lines indicate the single support phases while those filled with points the double support phases. 4. Graph of the body advancing : The figure shows the average (green line) and the standard deviation (transparent green band) of normalized strides (right and left). The standard deviation gives informations about the walking regularity: more the band is tight so the subject made strides more similar to each other. The two parts of the curve, with different color area below, show the two body sides advancing, each of them characterized 19 by a maximum peak representing the foot support. By comparing the maximum values, you can verify the support balance. The equality of advancing phases percentages (50%) of the stride cycle represents the step uniformity. This view is intuitive and can be interpreted more easily for the walk postural assessment. In fact the comparison between the % of red and blue areas gives the time advancement balance while the peaks equality characterizes the feed force amount. Clicking on the icon , on the top left opens a new page containing the graphic where you can view the acceleration signal pattern from the sensor. In these zone is presented the graphic of the filtered anterior-‐posterior acceleration, which has horizontal and forward direction. Through this signal it is possible to describe the subject walking advancing. Some remarkable curve points were identified to detect strides, defined as the movements between two consecutive contact of the same foot. Gait cycle characteristic parameters were calculated for each of them (see summarizing data table reported on end). 20 The software automatically detects the signal highest and smallest peaks which respectively corresponds to foot heel strike and toe off instants. If the subject begins walking with his right foot, the first positive peak corresponds to the right foot support, the next minimum to the left toe off followed by left foot support (the second positive peak) and right toe off (the second minimum), completing the gait cycle with right support represented by the third positive peak. On the right you can pout a video of the exam and review it synchronized with the analysis. The following commands are present: Select the video using Use the icons . to start and stop the film. It is necessary to synchronize the first frame of the movie. To do that is necessary to position the reference line on the graph as above. Then using the control slide: 21 to set the frame and press the command . The command allows to copy and export the actual image. To be able to return to the home screen of the WALK-‐L5 protocol, simply click the button 22 again. WALKING PATTERN MANUAL IDENTIFICATION If the acceleration signal is too irregular to prevent the software from automatically recognizing the walking characteristic pattern, it is possible to make a manual identification. One can become aware of the occurrence to be in a situation like this, paying attention to the following: • Acceleration graphic (1): the software has not marked all the signal peaks with a red circle. The following table shows an example of correct and wrong recognition. Correct Recognition Wrong Recognition • Times and synchronization graphic (2): due to lack of some peaks recognition, software shows a very small number of steps with some individual steps blocks. Below you can see an example of a correct recognition and incorrect recognition. Correct Recognition 23 Wrong Recognition • Parameters values (4): the space-‐time parameters in the table are outliers, such as step length more than one meter and half and stride length greater than three meters. Upon the occurrence of these situations must resort to walking pattern manual recognition which consists of the following steps. By clicking with the right mouse button on the acceleration signal window and pressing the command Walking pattern Manual Identification, a new signal window opens on which the user has to identify a positive peak, which represents the walking starting point. It is important to select the positive peak where the acceleration trend is more regular as it possible. With a double click on this point, the software automatically recognizes the last signal remarkable points. 24 If the identification is not correct yet, it is possible to cancel the wrong points through the button Remove Acc Z Points and to repeat the operation with three types of control. To make the program to use these controls for the signal recognition, it must press the commands Use Distance Control between Consecutive Points, Use Distance Control between Maximum, Use Band Control, respectively, before the manual recognition. After the click, each button is pressed and to disable the control it is necessary a second click on the same button. The software allows all the possible control combinations: only one control, a couple of controls or three controls at the same time, until the signal identification is correct. Every time you want to use a different control it is necessary to cancel all the wrong points. When the identification is correct, press the button OK to see analysis results. 25 WALK-‐L5 XL LOWER TRUNK KINEMATIC DURING WALKING Trunk kinematics are critically important to the maintenance of body equilibrium and should be examined as component of locomotion analysis. Some recent studies have shown that trunk posture and motion can influence gait patterns of the lower extremity and alter energy expenditure in the pathologic gait compared to a normal gait. In fact the role of trunk motion in balance and proprioceptive function in gait is being investigated by studying pathologic gait in patients with neurological, vestibular, or musculoskeletal diseases. Hence the importance of the possibility to have available quantitative measures of trunk rotation angles around the three coordinate axes during walking. The WALKL5-‐XL protocol allows to obtain the rotation movement of the trunk lumbar region during walking. Kinematic trunk motion data are presented for the sagittal, coronal and transverse planes, which are defined as flexion-‐extension angle, rotation angle (clockwise and counterclockwise) and abduction-‐adduction angle (or right and left side bending), respectively. Positive angular values are defined for forward bending, rotation to the right side of the body and bending to the left side of the body; negative values represent the opposite movements. 26 WALK-‐L5 XL RESULTS ANALYSIS After running a test using WALKL5 XL protocol as described previously, in the screen showing results analysis will show the following graphics: 27 On the left, the graphs of the average rotation angles around the three axes are shown normalized to the average gait cycle curve represented using a scale of 1 to 100%. From top to bottom you can see: • Angle of Flexion(+)/Extension(-‐): represents the rotation angle of the trunk lumbar region around the x axis of the gyroscope that is the medial-‐lateral axis directed towards the left. Positive angular value is defined for forward flexion and negative angular value for backwards extension. • Angle of Rotation (Right(+)/Left(-‐)): represents the rotation angle of the trunk lumbar region around the y axis of the gyroscope that is the vertical axis directed upward. Positive angular value is defined for clockwise rotation (that is toward the right body side) and negative angular value for counterclockwise rotation (that is toward the left body side). • Angle of Lateral Flexion (Left(+)/Right(-‐)): represents the rotation angle of the trunk lumbar region around the z axis of the gyroscope that is the anterior-‐ posterior axis directed forward. Positive angular value is defined for lateral 28 flexion toward the left body side and negative angular value for lateral flexion toward the right body side. On the right of each graph, minimum and maximum angles and their ranges for the different rotations detected by the protocol are shown. Then it is possible to compare the angular range values obtained with normal values for men and women divided. In order to better understand the trunk movement during gait cycle, below graphics is reported the gait cycle division in different phases like in the initial screen of WALK-‐L5 protocol. Clicking on the icon at the top left, you can see the pattern during the walking exercise acquired of the three angles described previously, by three graphs placed under the anterior-‐posterior acceleration curve. 29 30 PROTOCOL VALIDATION The protocol was validated at Istituti Ortopedici Rizzoli (Bologna). This work is reported following. Technical Specification for G-‐Walk sensors Operational Power Supply Supply current Operating time Battery charging time Communication Interface Dimensions Weight (inc. Battery) Temperature Acceleration Dynamic Range Max Offset Sensitivity Nonlinearity Noise Bandwidth 3,3 12 4 Bluetooth ZigBee 68x42x18 78x48x20 48 62 0-‐60 V mA mA hour hour hour hour mm mm gr gr C° ±1,5 o ± 6 ± 40 ±0.002 ±1 350 400 Angular Rate Dynamic Range Sensitivity Nonlinearity Noise Bandwidth Magnetic Field Dynamic Range Sensitivity Noise Resolution Bandwidth ±300 o ±1200 0.83 ±1 0.018 140 g mg %/C° %FSO µg/ HZ dps mV/dps (1200 dps) %FSO dps/ HZ ±6 1 50 120 5 gauss mV/V/gauss nV/ µgauss MHZ 31 headquarters viale Forlanini 40 20024 Garbagnate M.se MI Italy tel +39 02 366 490 00 fax +39 02 366 490 24 R&D centre via della Croce Rossa 11 35129 Padova PD Italy tel +39 049 981 5500 fax +39 049 792 9260 www.btsbioengineering.com [email protected]