1
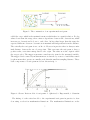
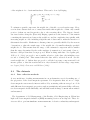
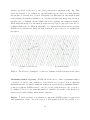
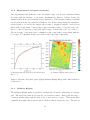
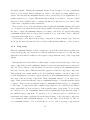
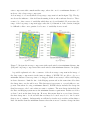
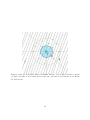
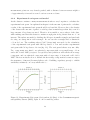
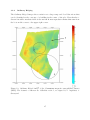
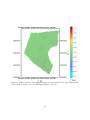
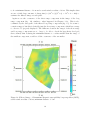
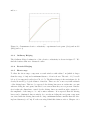
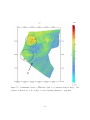
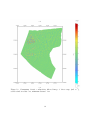
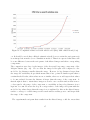
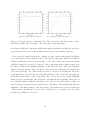
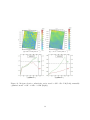
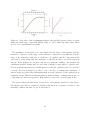
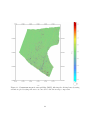
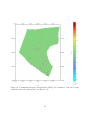
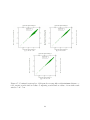
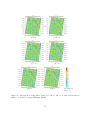
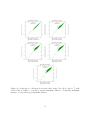
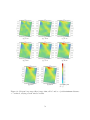
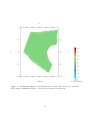
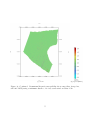
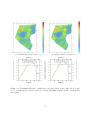
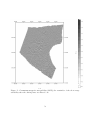
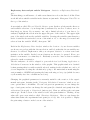
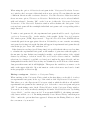
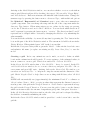
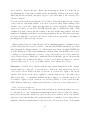
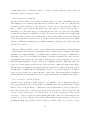
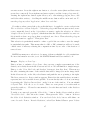
mS m−1 .
Figure 16: Carnuntum electric conductivity: experimental variogram (dots) and model
(line) (mS m−1 )
3.3.3
Ordinary Kriging
The Ordinary Kriged estimation of the electric conductivity is shown in figure 17. We
find the features that were discussed earlier.
3.3.4
Factorial Kriging
3.3.5
Short range
To filter the short range component a search window with radius 5 m (which is larger
than the range of 4 m) and a minimum distance of 1 m is chosen. The ratio of 1/5 is well
below 1/3 as suggested earlier (see Ch. 3.1.5). The filtered image is shown in figure 18. It
clearly shows the geological features of interest. There are also some very faint residuals
of the driving lanes. This is to be expected: the driving lanes were not taken into account
when modeling the variogram, but this does not mean that they are not present. But the
fact is that the disturbance caused by the driving lanes are small enough compared to
the amplitude of the image to be only a minor nuisance. It is expected that the driving
lanes can be eliminated almost entirely by correctly modeling the variogram component
associated with the driving lanes and choosing a minimum distance smaller than the driving lane distances (≈ 0.7 m). For the reasoning behind this claim we refer to Chapter 3.4.3
32