1
56
6
6
June Tole
School,SHP
Majh Bari
Jaubari
8
9
10
11
6
28
Grand Total
183
93
8
14
-
18
20
16
17
31
32
8
19
90
181
87
9
15
19
21
17
6
32
33
9
20
94
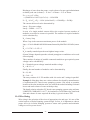
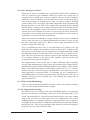
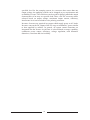
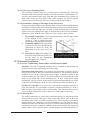
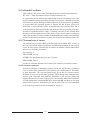
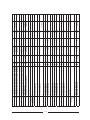
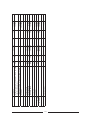
Domestic Water Demand
Present
Base
Population
Population
(P)
(PO)
(Nos.)
P(1+r)^n1
[4]
[5]
238
113
11
20
25
28
22
7
43
44
11
27
125
Design
Population
(Pn)
P(1+r)^(n1+n)
[6]
5950
2,825
275
500
-
625
700
550
175
1,075
1,100
275
675
3,125
Total
Domestic
Demand
(lpd)
[8]
150
150
150
-
0
-
-
1500
1,500
1,500
-
Institutional Water Demand
Other
Total
Institutional Institutional
Demand
Demand
(Nos.)
(lpd)
(lpd)
[9]
[10]
[11]
No. of Pupil
in School
0
-
-
(lpd)
[11-1]
7450
4,325.00
275
500
1,500
625
700
550
175
1,075
1,100
275
675
3,125.00
(lpd)
[12]
0.14
0.08
0.01
0.01
0.02
0.01
0.02
0.01
0.00
0.02
0.02
0.01
0.01
0.07
(lps)
[13]
33.00
21.00
3.00
3.00
3.00
3.00
3.00
3.00
3.00
3.00
3.00
3.00
3.00
12.00
(Factor)
[14]
0.42
0.23
0.02
0.03
0.05
0.04
0.05
0.03
0.01
0.07
0.07
0.02
0.04
0.20
(lps)
[15]
1.10
0.70
0.10
0.10
0.10
0.10
0.10
0.10
0.10
0.10
0.10
0.10
0.10
0.40
(lps)
[16]
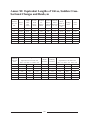
Tap Flow Calculation
Live Stock Total Water
Average Tap
Design
Peek Factor Peek Flow
Demand
Demand
Flow
Flow
32.70
16.67
10.00
5.88
7.69
6.67
9.09
25.00
4.55
4.35
16.67
7.14
32.70
(lps)
[17]
Adjusted
Peek Factor
[18]
Remarks
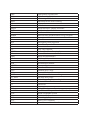
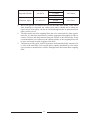
NOTE : 1 Peak factor of 3 has been adopted
2 Design Tap Flow has been adjusted for the Peak flow by rounding off to nearest 0.01lps.
3 If flow is less than 0.1 lps then it has been adjusted to 0.1 lps and if flow is greater than 0.25 lps provide additional tapstand.
17
1
3
-
2
5
3
3
4
4
1
2
11
(Nos.)
[3]
Nos of HH
sub total
6
6
6
Goreto
Majh Tole
6
6
5
5
5
5
[2-1]
Ward No.
7
Bhirbari
RVT2
[2]
RVT1
Deaurai tole
Majh Tole
Tallo Tole
Raju ko Rukh
sub total
Cluster Name or
Locality
5
1
2
3
4
[1]
Tap No.
Discription of Tap
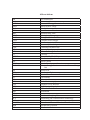
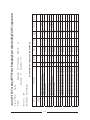
SCHEME NAME :Kattike WSP
SUPPORT ORGANIZATION :
LOCATION :
WARD NO :
4,5,6 VDC : Sundarijal
DISTRICT :
Kathmandu
Name of Community :
Sundarijal
Required Datas:
Peak Factor:3
Per Capita Demand :25 lpcd
Per Capita Demand for Students:
10 lpcd
Minimum flow rate
0.10 lps
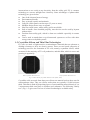
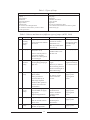
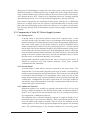
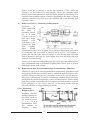
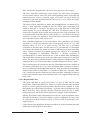
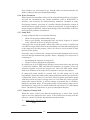
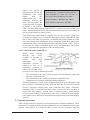
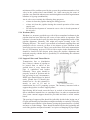
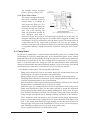
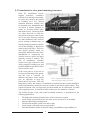
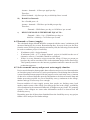
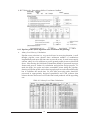
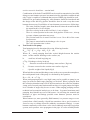
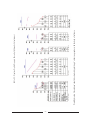
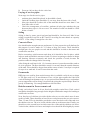
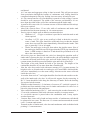
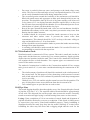
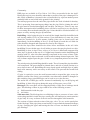
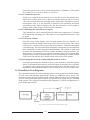
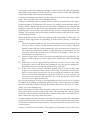
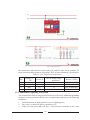
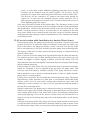
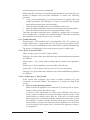
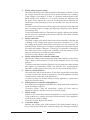
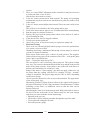
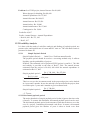
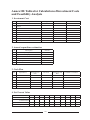
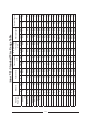
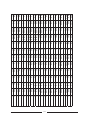
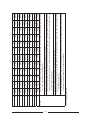
Table 8-1: Example of a Spreadsheet to Compute the ‘Water Demand’