1
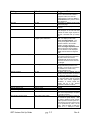
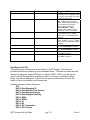
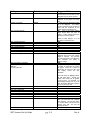
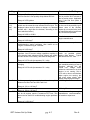
Setting
Selection
Suggested Value
GPS CDI
On / Off
Slip Indicator
On / Off
Turn Rate Indicator
On / Off
Wind Indicator Mode
Off / Vector & Digital Speed / Vector
& Digital Speed & Direction
Digital Head / Cross Wind Display
On / Off
Baroset units
Inches Hg / millibars
Artificial Runways
On / Off
Flight Path Marker
On / Off
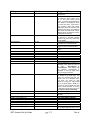
Airspeed display size
Altimeter display Size
Track/Heading display size
Airspeed Resolution
Normal / Large
Normal / Large
Normal / Large
Fine / Coarse
Max indicator vertical speed
1000 / 2000 / 3000 / 5000
GRT Horizon Set Up Guide
pg. 3-2
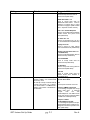
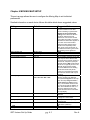
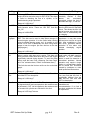
runway, flight path marker and HITS
occurs. Since the PFD includes a
flight path marker, the need for
traditional bars is reduced. Nose is
recommended, but try both to chose
your preference.
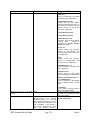
On Enables or disables the GPS CDI
on the PFD page.
On Controls the display of the slip
indicator.
On Controls the display of small
greet triangles on the roll scale that
indicate the bank angle required to
achieve a standard rate (2 minute)
turn.
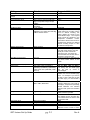
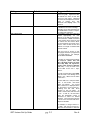
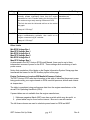
Vector & Digital Speed & Direction
OFF – No display of wind data.
Vector and Digital Speed – The
vector (arrow) points to the wind
direction relative to the aircraft’s
heading. Speed is displayed.
Vector and Digital Speed/Direction
Same as previous except a digital
value of direction is also displayed.
Digital value is relative to magnetic
north.
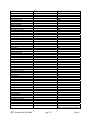
On Controls display of head and
cross wind components in the lower
left portion of the PFD screen.
Head/Tailwinds are shown with H/T
and cross winds are shown with L/R
for left/right.
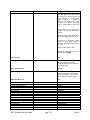
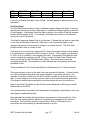
Inches Hg Defines the units used for
setting barometric pressure in the
altimeter. Inches of Hg is used in the
US; millibars are used in many
places outside the US.
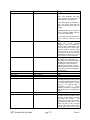
On When ON, an artificial view of
runways at airports within 10 miles of
the aircraft is depicted on the PFD.
On The Flight Path Marker (FPM) is
the projected flight path the aircraft
will take with current flight/wind
conditions. It shows where the
aircraft will be if the present
flight/wind conditions continue.
Normal
Normal
Normal
Fine Fine shows graduations of 5
mph on the airspeed tape, compared
to 10 mph in Coarse.
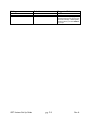
1000 Selects the maximum range for
the vertical bar graph display. With
the 1000 or 2000 fpm scale, the bar
graph represents vertical speed in a
linear manner, that is a speed of 750
fpm is represented by a bar ¾ of full
scale. With the 3000 or 5000 fpm
scales, 0 to +/- 1000 fpm is linear
Rev A