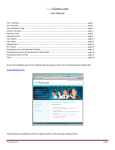
1
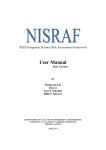
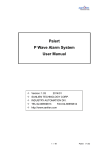
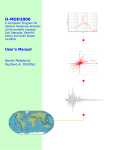
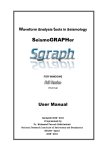
The COSMOS VDC User Manual
Table of Contents
I. Introduction
2
II. Searching for Data
A. Using the Earthquakes page
B. Using the Stations page
C. Using the Map
D. Search with Metadata Parameters
Basic
Advanced
3
4
6
7
8
8
10
III. Previewing Data
A. Acceleration
B. Response spectra
12
13
IV. Downloading Data
Strong-Motion Data Files
Metadata Parameters
15
17
1
I. Introduction
The COSMOS Strong-Motion Virtual Data Center, or VDC, is affiliated with COSMOS,
the Consortium for Strong-Motion Observation Systems, a consortium of government
agencies, private organizations, universities, and private individuals who have a common
interest in promoting earthquake safety and education.
The VDC’s role in promoting safety and education is to provide easy and free access to
strong-motion earthquake data from a large and growing number of sources. The data are
available for download as text files containing raw (as digitized) acceleration recordings,
processed acceleration, velocity, displacement, and Fourier and response spectra (though
not all for each earthquake, especially older ones). You may also download tables of
metadata parameters, such as peak ground acceleration and s-wave velocity for all
stations reporting a given earthquake.
The VDC has various interfaces, which allow you to select data by earthquake, by
recording station, via a map interface or by searching metadata parameters. You may also
preview the acceleration and the response spectra before downloading the data files.
The VDC does not provide access to all recorded earthquake data. Intended primarily as a
resource for earthquake engineers, seismologists, risk assessment professionals, and
others concerned with the effects of damaging earthquakes, the VDC is restricted to
strong-motion data, principally from earthquakes of magnitude 5.0 or larger in
earthquake prone areas and 4.5 or larger in other areas. Nor is the data available in realtime; most data are reviewed by station owners, corrected to bring the mean value to zero
and band pass filtered.
Using feedback from users and from semiannual meetings with the COSMOS VDC
Working Group, we continue to improve the VDC in order to enhance its value to the
user community. We encourage you to submit recommendations for enhancements.
The COSMOS VDC gratefully acknowledges the NSF (CMS- 0201264), the USGS, the
California Geological Survey, the Southern California Earthquake Center and COSMOS
for their support and continued oversight; and the continuing valuable support of the
many agencies and organizations that have made their data available for your use. We
urge you to keep in mind that the data you obtain through the VDC is provided through
the generous support of these data providers. If you use any data for research that results
in a publication, please cite the owners of the data and the COSMOS VDC.
Starting out
The web site for the VDC is: http://db.cosmos-eq.org . Notice the links at the top of the
VDC home page (which are repeated at the bottom of the page). These links to various
search interfaces and informational pages are on every VDC page, so you can quickly
navigate around the website. Note too the links to the Cosmos home page, which
provides information about COSMOS activities and publications; and the Frequently
Asked Questions page, which may answer questions that crop up in your use of the VDC.
2
II. Searching for Data
There are multiple ways to search for data through the VDC, and each is interconnected
as shown in Fig. 1. You may, for example, search for all of the stations for a given
earthquake, use the results displayed on the Event page, select one of those stations, then
go to the Station summary page, which displays all the earthquakes which that station
recorded. Or you may use the Clickable map to find all stations and earthquakes within a
given area, then select successively each of the events and stations contained on it, to go
to their respective Event and Station Summary pages.
Fig. 1. VDC Search Options
3
A. Using the Earthquakes page
You can search by earthquake in several ways, but perhaps the easiest is on the
Earthquakes page. Selecting a region at the top of this page will get you to the
appropriate earthquake list more quickly, or you can scroll down to the region you are
looking for.
Fig. 2. The Earthquakes page
Earthquakes within a given region are listed in order of date, most recent first. Also listed
are the preferred magnitude, the number of stations for which there are data files, the
owners of that data, and optionally, a set of links to compressed collections (zips) of files
for that earthquake. This is a quick way to download a number of files at once if you
want all of the files for an earthquake. Currently only files distributed by the USGS and
the two Japanese networks, K-Net and Kik-Net are available as zip files, but we are
planning to add zips for all Cosmos-housed data soon. The suffixes cor and unc refer to
corrected and uncorrected data.
Earthquake Name. The earthquake name, as it is stored at the VDC, is listed on the left.
This may not be the name with which you are familiar, so the date and time are part of
the name. Later, if you want to search by metadata parameter, you will want to use this
text string or a subset of it if you want to enter a value for ‘earthquake name’. Clicking on
the earthquake name will direct you to the Event page, which displays all of the stations
available for that earthquake, along with earthquake metadata.
4
The Event Page: The References link, on the Event page, will take you to a page listing
sources for earthquake metadata, links to on-line shakemaps or moment tensor solutions,
or other information of interest about the earthquake.
Below the earthquake source parameters is a drop down list of stations on this page. This
is a short cut for going to a particular station of interest.
If you click the View Map link, you will see all of these stations and the earthquake
displayed as symbols on a map. California earthquakes and stations are displayed on a
map that also displays known fault lines.
If you click on the link
Summary Page for this
Station, you will be
directed to a page that
gives further metadata
for that station,
including, if available,
the owner’s station page,
as well as all
earthquakes that this
station has recorded.
From the Event page
you may also preview
the data using the Plot
Acceleration and Log
and Linear spectra plot
links. Please see Section
III for details.
Fig. 3. The Event page
From the Event page you may also select to be added to your ‘download bin’ for
downloading the data files:
1) individual traces, or
2) all traces for a given station for this earthquake, or
3) all traces on this page.
See Section IV for details on downloading data.
5
B. Using the Stations Page
The Stations page (Fig. 4) is reached using the link at the top of each VDC page. As on
the Earthquakes page, a drop-down menu allows you to jump forward to the region of
interest, or you may scroll down to the appropriate area of the page. Within each region,
stations are listed by the
acronym for the station
owner or network, then by
station name. To select a
station, highlight one station
name, then click on the ‘Go
to Station Summary Page’
button at the bottom of the
box displaying the station
names.
The Station Summary Page
is reachable from the Event
Page, any Map or the
Stations page. It displays
metadata on this station, and
all of the earthquakes
recorded by this station.
Fig. 4. The Stations Page
As on the Event page,
you may click on ‘View
Map’ to display on a
clickable map symbols
for this station and all of
the events listed on this
page. Following the link
to the ‘Summary page
for this earthquake’
directs you to the
corresponding Event
page.
From the Station
Summary page you may
also preview the data
using
the
Plot
Acceleration and Log
and Linear spectra plot
links. Please see Section
III for details.
Fig. 5. The Station Summary Page
6
You may select from this page all traces on the page, all traces for a given earthquake, or
individual traces to be added to you ‘Download Bin’ for downloading. See Section IV
for further details on downloading.
C. Using the Map
You can reach the World
Map using the links at
the top of each page, or
you can reach a subset of
the map from the map
links on Event or Station
summary pages.
When you enter from the
Event or Station
Summary page and are
requesting information
for a California or
Nevada earthquake or
station, the site
automatically selects a
more detailed map
showing fault lines.
You may use the map in
several ways:
Fig. 6. The World Map
1) Enter Latitude and Longitude. If you know the latitude and longitude ranges, you
may enter those in the box below the map and then click the ‘Create New Map’.
Maps do not display less than 1.5 degrees, however;
2) Click on an Icon. If you click on a given icon (solid diamond for earthquake and
open box for station), and you will be directed to the corresponding Event page or
Station Summary page;
3) Click on open space. You may click on any area of the map not covered by an icon.
The program zooms in and draws a new map, centered on the point you clicked. You
may reverse this by clicking on the ‘Zoom Out’ button. Since maps are generated
dynamically, there may be a slight delay in response;
4) Click on an earthquake name. If you are displaying a map that shows fewer than
50 earthquakes, these earthquakes will be listed below the latitude and longitude box.
Clicking on the earthquake name will direct you to the corresponding Event page.
Clicking on the highlight button next to the earthquake name will redraw the map and
highlight the corresponding earthquake and the stations that record it in a different
color.
7
D. Search with Metadata Parameters
There are two types of searches available, the Basic Search and the Advanced Search,
both accessed via the links at the top of the VDC pages.
The Basic Search
The Basic Search is a way to
quickly search by the most
commonly used parameters.
You can select using:
earthquake name, mechanism
and magnitude; station owner,
hypocentral distance and closest
distance to the fault; instrument
peak ground acceleration and
region. You do not need to
enter values for all of these
options, only the ones on which
you want to narrow the search.
For example, there is no point in
enter a min and max magnitude
of 0 and 10, respectively, since
that would cover all earthquakes
in the database. When you have
entered the values you wish,
click on the Search button at the
bottom of the page.
Full information (default): The
default search returns an html
page similar to the Event or
Station summary page, but showing all earthquakes and all stations that matched the
conditions you entered. If the search returns more than 60 stations, you will just see a list
of stations (with links to their respective Stations Summary pages), with their latitude,
longitude and distance.
Fig. 7. Basic Search page, showing parameters
that will be returned.
Earthquake only: You may also choose to return only earthquake information. For
example, if you enter ‘Parkfield’ into the earthquake name and nothing else under the
default condition, you will get a list of all stations for all Parkfield quakes listed in the
database, but if you select the button for ‘Return earthquake information only’, you will
receive a list of just the earthquakes whose names include the string ‘Parkfield’ (with
links to the Event pages for those earthquakes.
8
Station only: if you choose the Station only option, the page will return a list of stations
with latitude, longitude and distance, similar to that returned if you have selected more
than 60 stations. This is a quick way to see what stations are available for an earthquake.
Potential Problems
Incomplete data: not all parameters are present for every trace registered in the metadata
database, e.g. earthquake mechanism and closest distance to the fault are not present for
all traces. Currently only about 1/4 of the earthquakes have a mechanism listed, and
about 1/5 have closest distance to the fault. Therefore, if you choose these, you will only
be selecting from the set of traces for which those values have been entered into the
database.
Event name: The search compares the entire string entered to the earthquake name as it is
listed in the database (the earthquake list on the Earthquakes Page contains the name as it
exists in the Cosmos database). Note that this name includes the date in UTC time (e.g.
Parkfield, CA 2004 09 28 1715 UTC ). The search does not work like Google, where
you can enter separate words and it will search for them independently. Spaces are also
part of the search string, so if you put in an extra space, you won’t get the results you are
expecting. The best strategy is to choose the shortest string that will cover the
earthquakes you want (e.g. palm instead of palm springs). It is also better avoid any
punctuation or accent marks. Names are not case sensitive.
Station identifier: This initiates a search of several fields in the database including ones
that contain the city, state, country( if not U.S.), building name, address and owner’s
station code for the station. For example, you may be able to find the station you want by
entering just the street name. You may also enter words to generate searches for structure
type, like ‘dam’ or ‘array’ to find dams and geotechnical arrays, and ‘bldg’ or ‘story’ to
find buildings (not all buildings have number of stories listed, and not all buildings have
‘bldg’ in the name, so you might want to try both).
Earthquake magnitude: This initiates a search of the ‘preferred magnitude’ field, usually
the one reported by NEIC, whether it is moment, surface, local, or some other magnitude
(e.g. body wave, duration, but not seismic moment), in that order of preference. Since
these values are sometimes revised over time, be sure to enter a range of values large
enough to cover the ones you are interested in. The database only contains a few
earthquakes with magnitudes < 4.5.
9
The Advanced Search
The Advanced Search page allows you to search virtually all of the parameters stored at
the VDC, and returns results in three different formats:
1) A Station-Event page just like the result returned from the Simple Search;
2) An html table of all parameters selected and matching those for which you entered
values;
3) A tab-delimited table of all parameters selected and matching those for which you
entered values.
Option 1 shows all of the stations
that met the criteria selected, but
not necessarily what those values
are.
For example, if you select S-wave
velocity at 30m (available for
about 1/2 of all stations) and enter
some range of values, it will
return the stations that meet those
criteria, but since the StationEvent page doesn’t show S-Wave
velocity, you won’t see the actual
value.
Option 2 returns an html table of
actual values for all fields you
selected on the Advanced Search
page and meeting the criteria of
the fields for which you entered
constraints. When values are
missing in the database, there will
be an empty cell in the table.
Fig. 8. Part of the Advanced Search page.
Option 3 returns the same
information as the second option,
but as a tab-delimited file. If you
save the browser page that is
returned as an RTF file, you can
import it into Excel or a database.
For the second two options, you should choose all fields for which you want to receive
data, even if you are not going to use them to narrow the search. For example, if you
want to find all of the stations at the Parkfield 2004 09 28 earthquake with PGA > 100
cm/s/s, you will want to select peak ground acceleration and earthquake name or date (to
10
allow you to narrow the search to that earthquake and establish a range of PGA values),
but you also might select station location, auxiliary location, station latitude and
longitude, so that you can see what stations you have selected.
Advanced Parameters Page: After selecting fields of interest from this Advanced Search
page, you are directed to the next page, the Advanced Parameters page, which has text
boxes or drop-down lists for all of the fields. Again, you only need to fill in values for
fields that you want to constrain. If a field has minimum and maximum values, you do
not necessarily have to enter both. You might, for example, enter just the minimum, if
you are only interested in earthquakes with a magnitude > 6. For dates, however, there
are default values as shown, and so both beginning and end date are required if you
choose that field. All dates and times for searches are UTC.
At the bottom of the Advanced Parameters page are buttons for the 3 types of output you
can generate from the Advance Search (see above).
Potential Problems
See the Simple Search section above for potential problems related to earthquake name
and incomplete data.
Station identification: Station name refers to a station code, usually 3-4 characters, used
for some older stations. Agency Number is the code assigned by the owner (usually a 5digit code for CGS or USGS stations). If you want information on the city, state or
country, choose location instead. The name of a dam will also be listed in the location
field. Auxiliary location is a general field that may include building name or street
intersection (e.g. Hollywood & Vine), geotechnical array name (e.g. Lake Hughes Array
#4) or description (e.g. fire station, airport, hospital).
Geology: Geology is a text field into which the VDC has placed whatever the recording
station has offered for a description of site geology, so sometimes you might see ‘deep
alluvium’ and other times you might see a NEHRP code. As a consequence it is not very
useful as a search parameter, but still may contain useful information. Use S-wave
velocity at 30 m instead for a search parameter.
Text fields: enter the shortest possible string that matches the data you want and don’t use
punctuation or diacritical marks. Do not use characters to represent wild cards like *.
Numeric Fields: Numbers use American notation and are entered without commas. Do
not include other symbols (e.g. > or <) or units in the numeric fields.
11
III. Previewing data
A. Acceleration
You may preview time series acceleration plots from the Events page, the Station
Summary page or the Station-Event page, by selecting the ‘Plot Acceleration’ link on one
of these pages, as shown in Fig. 9. The acceleration plots are currently only available in
cm/s/s scaling.
Fig. 9. Choosing to Preview Data on the Station Summary page.
Fig. 10. Acceleration plot.
12
B. Response Spectra.
You may preview Response Spectra by choosing the ‘Log’ or ‘Lin’ link for logarithmic
or linear scaled plots, respectively, on the Events page, the Station Summary page or the
Station-Event page, as shown in Fig. 9. Currently, only data processed by the owner is
available as response spectra (approximately 1/2 of all files available through the VDC).
Both versions of the Response Spectra plots show spectra for acceleration, velocity and
displacement for each sensor at the selected station.
Fig. 11. Configuration Header and Acceleration from the
Logarithmic Response Spectra page.
Logarithmic. The page that displays the logarithmic scaled response spectra allows you to
choose from the available damping values, units for displaying the acceleration and the
maximum period plotted, as shown in Fig. 11. Default values are 5% damping, cm/s/s
for the units and the maximum period available in the file.
13
Linear. The linear scaled
response spectra plots are
designed especially for
engineers. In addition to
the options available on
the Logarithmic version,
you may scale the data,
and configure a design
spectrum and overlay it
over
the
response
spectrum.
Fig. 12. Linear Response Spectra page.
The Help links next to the design
spectra choices show plots describing
the corresponding input variables, as
shown in Fig. 13.
Fig. 13. The Design Spectra help plot for
the UBC 1997 standard.
14
IV. Downloading Data
Strong-Motion Data Files
Find data to download. To download data files through the VDC, you must first select
them using one of the search mechanisms described above. The results of your search
will be displayed on one of three pages, the Event page, the Station Summary page or the
Station-Event page, as shown in Fig. 14. On each of these pages there are 3 areas from
which you may select files to download; 1) the ‘Add all data on this page’ checkbox on
the left near the top of the page, 2) the ‘Add all of this station’s data’ checkbox on the left
above the individual component descriptions, and 3) the ‘Add this to bin’ checkbox on
the right of each individual component. Check whichever is appropriate for your
interests, then click on the ‘Go to Download Bin’ button near the top of the page, or one
of the ‘Go to Bin’ buttons on the right of each station block.
Fig. 14. Selecting Files to Download from the Event page.
15
Review selections. When you select one of the Go to Download Bin checkboxes from a
search result page, you are directed to the Download Bin, shown in Fig. 15. From this
Fig. 15. The Download Bin.
page, you may delete unwanted files using the Delete links at the right, or delete all files
from this selection by clicking on the ‘Start over with a new bin’ link. Once you are
satisfied with the selection, click on the ‘Proceed to download data’ link.
Fig. 16. The User Login page.
Log in. Next you are directed to the User Login page, shown in Fig.16. You must enter
your email address and then click the ‘Log In’ button. The VDC does not sell or give
away any information you submit here, but does use this email to issue New Event
notices and in some cases, the VDC has used these email addresses to advise users that
data recently downloaded by them has been modified. You may opt out of the New Event
notices at any time by returning a New Event notice with ‘Unsubscribe New’ in the title,
or writing to [email protected].
You will notice that you may also go directly to the Login page from the links at the top
of the page. Once you have submitted an email address, your search list is preserved for
6 months. If you leave the site and return, you may log in with that same email address
and recover the results of previous searches.
16
Download data. Once you log in, you are redirected to the Download Bin page, but the
page now shows buttons for each downloadable file as shown in Fig. 17. When there is a
long button with multiple data types listed, it means that all of those are bundled in the
same file, as is true for the Parkfield data from CSMIP, below. When there are multiple
buttons, as for the USGS data, it means that each of these exist as a separate file.
Fig. 17 Downloading Files from the Download Bin.
Individual files: If you click on the buttons with the data type listed on them, your
browser will display the file on the screen and you may then save it on your own disk.
Multiple files: If you click on the ‘Zip the checked files’ button at the top left of the
page, the VDC will collect these and zip and tar them for delivery as a one or more
compressed files (with up to 30 data files per compressed file). You may uncheck any
files you do not want to download before clicking on the ‘Zip the checked files’ button.
These zipped files will also contain a file with a list of the Internet addresses whence
these files were accessed.
Warning: If you receive a message that the zip file you have downloaded via Netscape is
corrupted, use another browser, or reset the zip file extension to ‘tgz’; Netscape
sometimes adds an additional .tar extension to the name.
Previous Searches. Note that below the Download Bin is a list of links to previous
searches, referenced by date, and including the number of traces from each search.
Clicking on one of these links will restore the Download Bin for that day’s searches to
the screen. In that case, your current search will be stored under the current date.
Metadata Parameters
To download metadata parameters, see Section II D above, ‘The Advanced Search’ under
’Search with Metadata Parameters’.
17