1
User's manual
for the
Precision thermometer
T 4200
(version no. 2.00 or better)
Copyright 2000
Dostmann electronic
26.05.2001
Table of contents
1. Important Safety Regulations ................................................................................................ 1
2. Introduction ........................................................................................................................... 2
3. Specifications ........................................................................................................................ 3
3.1 Range of goods delivered ................................................................................................. 4
4. First operation of the T 4200.................................................................................................. 4
5. Description of the instrument................................................................................................ 5
5.1 Assignment of plugs ......................................................................................................... 7
6. Manual Operation.................................................................................................................. 7
6.1 Measurements with reduced measuring times................................................................ 10
6.2 Measuring temperature changes..................................................................................... 10
6.3 The user menu ................................................................................................................ 10
6.3.1 Selection of units..................................................................................................... 10
6.3.2 Turning differential measuring on/off..................................................................... 11
6.3.3 Switching channels on/off....................................................................................... 12
6.3.4 Selection of sensor parameters................................................................................ 13
6.3.5 Loading the standard settings .................................................................................. 14
6.3.6 Starting a record of measuring values ..................................................................... 15
6.3.7 Setting the baud rate................................................................................................ 16
7. Operating the instrument from your PC .............................................................................. 16
8. Establishing sensor specific parameters.............................................................................. 22
8.1 Installation of the PC program to establish sensor specific parameters......................... 22
8.2 Operation of the PC-program to establish sensor specific parameters........................... 22
8.2.1 Establishing a new parameter set ............................................................................ 24
8.2.1.1 Establishing a parameter set for industrial temperature sensors ...................... 24
8.2.1.2 Establishing a parameter set for laboratory temperature sensors ..................... 26
8.2.2 Transmitting a parameter set to the T 4200............................................................. 27
8.2.3 Listing the parameter files available on the hard disk............................................. 28
8.2.4 Viewing a parameter file available on the hard disk ............................................... 28
8.2.5 Viewing the parameter sets available on the instrument......................................... 28
8.2.6 Deleting a parameter set from the thermometer...................................................... 28
9. Recording and presentation of measured values with SmartGraph..................................... 28
9.1. System requirements for the installation of SmartGraph .............................................. 28
9.2 Installation of SmartGraph ............................................................................................. 29
Table of contents
9.3 Introduction into SmartGraph ........................................................................................ 29
9.3.1 Recording measuring values ................................................................................... 29
9.3.2 Graphical and tabular presentation of the measuring values................................... 31
9.3.3 Analyzing and processing of measuring values ...................................................... 31
9.3.4 Documentation ........................................................................................................ 32
9.4 Description of the menu instructions.............................................................................. 32
9.4.1 File menu................................................................................................................. 32
9.4.2 Edit menu ................................................................................................................ 34
9.4.3 Window menu ......................................................................................................... 34
9.4.4 Options menu .......................................................................................................... 35
9.4.5 Help menu ............................................................................................................... 35
9.5 Storing the measuring data on the hard disk .................................................................. 35
10. Operating the thermometer with external multiplexers..................................................... 36
11. Errors and their correction................................................................................................. 38
12. Guarantee and repairs........................................................................................................ 40
Important Safety Regulations
1. Important Safety Regulations
1.
Please do read this manual before using the instrument for the first time.
2.
Avoid any inappropriate usage of the instrument.
3.
All the regulations, warnings and information in this manual have to be complied with.
4.
If there are any additional safety regulations those also have to be stuck to.
5.
The user is not allowed to open the instrument, as this is not necessary for an
appropriate usage. Maintenance must be carried out by qualified personnel only.
6.
The user has to ensure that none of the sensor or data wires are in contact with voltagecarrying parts.
7.
The user has to ensure that no operating conditions occur which could lead to
endangering or damage of property or personal injury.
8.
Measuring results do not only depend on the correct function of the instrument but also
on other circumstances (e.g. fixing of the sensors). That is why the measuring results have
to be checked critically (e.g. plausibility check), before decisions are made on the basis of
measuring values.
9.
The user's manual has to be at the operator's disposal at any time.
10. No alterations to the instrument may be made.
11. Never use a damaged instrument.
1
Introduction
2. Introduction
The T 4200 is intended for temperature measurements by means of platinum-resistance
thermometers with a nominal resistance of 100 ohms (Pt 100). For this purpose the
temperature-related resistance value of the sensor is initially measured. After that the
temperature value is calculated using sensor-specific calibrating data.
Normally temperature sensors are analysed using measuring methods based on ACs or DCs.
The AC-method in particular offers the advantage of a far-reaching insensitiveness to
irritating thermoelectric voltages. On the other hand measuring errors might occur using this
method because of parasitical capacities and inductances. The DC-method, however, has the
advantage of being quite insensitive to parasitical capacities and inductances and thus offers
the possibility to exchange sensors relatively unproblematically. This method however could
lead to incorrect measuring values because of irritating thermoelectric voltages.
In the T 4200 switched direct currents are used to measure the sensor resistance. By
comparing the results to a reference resistance which is integrated in the instrument a precise
measurement of the sensor resistance is guaranteed. Thus the T 4200 unites the advantages of
the methods based on ACs with the advantages of those based on DCs. At the same time the
respective disadvantages are avoided.
The conversion of the measured value of resistance into a temperature value is done with the
help of sensor specific calibration tables in the instrument. These calibration coefficients do
not have to be entered again into the measuring instrument after every exchange of sensors.
As it is possible to store the calibration coefficients for several sensors, in many cases it will
be sufficient to assign the appropriate calibration coefficients to the channel which has been
connected to a new sensor. If the coefficients of a new sensor are not yet stored in the
instrument, the user is able to establish them using the software which is included in the
package. The complete establishment and control of the calibration coefficients is done on the
PC. New calibration coefficients may easily be entered from your PC into the T 4200 with the
help of this software.
2
Spezifications
3. Specifications
The following specifications are only valid for a nominal operating voltage of 230V, 50Hz
and an environmental temperature of 23°C.
Measuring range:
-200°C up to 962°C (according to ITS-90)
-200°C up to 850°C (according to DIN EN60751)
Resolution:
1 mK
Measuring uncertainty:
10 mK (optionally 5mK in the range of -50°C up to 250°C)
Measuring channels:
2 (optionally up to 81 with multiplexers)
Sets of calibration data:
21 (optionally up to 81)
Sensors:
Pt-100 (optionally Pt-25) in a four-conductor-technology,
standard length of cable up to 2 m
Plug-and-socket connectors:
Lemo 1S, quadripolar, in front panel
Measuring current:
about 0.5 mA switched direct current (about 1 mA for Pt-25)
Measuring time:
about 1 sec. per channel, about 0,1 sec. with reduced resolution
Long-term stability:
≤ 5 mK/year
Temperature coefficient:
≤ 1 mK/°C
Display:
LCD, LED backlighted, 2 lines à 16 characters, height of
characters 9 mm
Units:
°C, °F, K, ohm
Interface:
RS-232, galvanically separated from the measuring instrument
Baud rate:
1200, 2400, 4800 or 9600 baud
Operation:
menu orientated, alternatively controllable by your PC
Memory:
9000 (optionally 45000) measuring values, buffered by
battery (Lithium battery CR 2032)
Supply:
115 or 230 V (tolerance: -10/+6%), 50 or 60 Hz, about 15 VA
Fuses:
230 V-mains: 200 mA slow-acting
115 V-mains: 400 mA slow-acting
Size:
260 x 80 x 240 (width x height x depth in mm)
Weight:
about 2.5 kg
Available accessories and possible extensions:
- external multiplexers
- temperature sensors
- memory expansion for up to 80 external measuring channels and 45000 measuring values
- SmartGraph, software measuring data acquisition and processing
3
First operation
3.1 Range of goods delivered
1. T 4200
2. Power supply cable
3. Cable for interface
4. Two covers for the two Sub-D plugs at the back of the instrument
5. Cover for one of the sensor connections
6. Software to establish and process sensor specific calibration coefficients
7. User's manual
4. First operation of the T 4200
Please do read the safety regulations at the beginning of the user's manual. Afterwards you
should check the delivery for completeness. Check the instrument for external damage. In case
there are noticeable damages you mustn't use the instrument. In this case you should contact
your dealer.
Please check whether the mains voltage set in the instrument corresponds with your mains
supply before you connect them. You can recognize the set voltage at the back of the
instrument above the mains plug. In case the set voltage does not correspond with your mains
supply, you must get an expert to carry out the following steps.
1. Remove the power supply cable.
2. Open the cover above the mains plug using a small screwdriver without force. To do this
insert the screwdriver into the little recess above the voltage indicator and turn slightly.
(see picture 5.2)
3. Insert the screwdriver from the top into the red plastic body and pull out the fuse holder.
4. Check whether the right fuses are inserted (see chapter "Specifications"). If needed the
matching fuses have to be inserted.
Safety instruction: Only the prescribed fuses are to be used!
5. Insert the fuse holder so that the desired voltage is readable (see picture 5.2).
6. Close the lid above the fuse holder.
4
First opertion
As soon as the right voltage is chosen the instrument may be switched on. It is now in the
normal operation state.
Note:
The sockets of the instruments which are not in use should be covered with
plastic lids. Thus it is ensured that the measurements are not interfered by
electrostatic discharges. The required lids for the two nine-pole plugs at the
back of the instrument and for one of the sensor plugs are included in the
delivery.
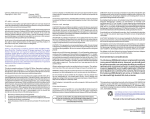
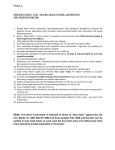
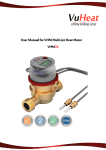
5. Description of the instrument
In the following the operating elements are explained.
1
2
3
A
B
10
9 7 4 6
5 8 11
FAST
ZERO
ESC
ENTER
T 4200
PRECISION THERMOMETER
Picture 5.1: Frontal view of the instrument
1.
Measuring channel A to plug in a temperature sensor.
2.
Measuring channel B to plug in a temperature sensor or an external multiplexer.
Safety instruction: Only the prescribed cables are to be connected to the instrument!
The operator has to ensure that no inadmissible voltages reach the
instrument.
3.
LCD with LED backlight.
4.
The button "FAST" offers faster measurements with a reduced resolution (see chapter
"Specifications"). Pressing the button "FAST" once switches over to the faster mode. If
5
Description of instrument
you press the button again it switches back to the normal measuring mode. In the fast
mode the appropriate LED is switched on. In the normal mode it is switched off.
5.
If you press the button "ZERO", the current measuring values are subtracted in any of the
following measurements. This function for example is equivalent to the tare function of
scales. Pressing the button again stops this function. In the "ZERO" mode the appropriate
LCD/LED is switched on. In the normal mode it is switched off.
6.
The button "arrow up" [⇑] is used for the menu-control only.
7.
The button "arrow left" [⇐] is used for the menu-control only.
8.
The button "arrow right" [⇒] is used for the menu-control only.
9.
The button "arrow down" [⇓] is used for the menu-control only.
10. The button "escape" [ESC] is used for the menu-control only.
11. Pressing the button "enter" [ENTER] starts up the user's menu.
1
2
3
4
2
230 V
1
0
RS 232
EXT
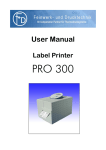
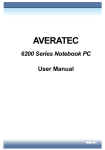
Picture 5.2: Back of the instrument
Picture 5.2 shows the elements explained in the following.
1
Display of the set supply voltage and lid of the fuse holder. (see chapter Usage of the T
4200)
2
The on/off-button switches the supply voltage on or off.
3
Socket for the supply voltage.
4
Socket for the serial interface (RS 232)
5
Socket for an external multiplexer.
6
Description of the instrument
Safety instruction: Only the prescribed cables are to be connected to the instrument!
The operator has to ensure that no inadmissible voltages reach the
instrument.
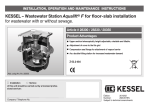
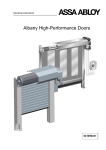
5.1 Assignment of plugs
The plugs to connect the temperature sensors (No. 1 and 2 in picture 5.1) are constructed in a
four-conductor-technology. The assignment of plugs is explained by picture 5.3.
I1
U1
U2
Pt100
•
•
I2
Pin 1: I1
Pin 4: I2
Pin 2: U1
Pin 3: U2
Picture 5.3: The assignment if a temperature sensor in four-conductor-technology
The socket of the serial interface (No. 4 in picture 5.2) is assigned in the following way:
Pin 1: not connected
Pin 6: not connected
Pin 2: to RXD connection of a PC
Pin 7: to RTS connection of a PC
Pin 3: to TXD connection of a PC
Pin 8: not connected
Pin 4: to DTR connection of a PC
Pin 9: not connected
Pin 5: earth
Safety instruction: Only the prescribed cables are to be connected to the instrument!
The operator has to ensure that no inadmissible voltages reach the
instrument.
6. Manual Operation
Any temperature measurement with resistive sensors consists of two steps, which is due to its
principle. In the first step the resistance value of the temperature sensitive sensor is taken. In
the second step the measured temperature value must be calculated from the sensor's
resistance value.
Due to the accuracy required for the resistance measurement three main problems occur for
the manufacturer of such thermometers:
7
Manual operation
-
an excellent linearity of the resistance measurements has to be guaranteed
-
the measurements require a long-term stability
-
to achieve the required resolution the thermometer has to be highly interference-proof
In the T 4200 the good suppression of interference and the excellent linearity are ensured by a
digital-analog converter developed especially for this thermometer. Here an integrating
conversion method is used which guarantees not only an excellent suppression of humvoltages but also a very high linearity. Due to the fact that the T 4200 - unlike many other
comparable thermometers - synchronises itself to the current supply frequency when switched
on, hum-voltages can be effectively suppressed even if the mains frequency diverges from its
nominal value. The excellent long-term stability is guaranteed by the measuring method as
well as the usage of a high-quality hermetically sealed precision resistance.
Due to the low measuring current and the instrument's insensitivity towards thermoelectric
voltages and parasitic capacities and inductances it is possible that sensors of various makes
can easily be exchanged.
The conversion of the resistance value into a temperature value makes a completely different
demand on the manufacturer. Whereas it is satisfactory for the measurement of the sensor
resistance if the manufacturer ensures a sufficient precision of the measuring instrument, in
many cases the user himself has to enter the sensor's coefficients, which are necessary to
calculate the temperature values. Here user-friendliness is of utmost importance. This demand
was already taken care of during the planning stage of the T 4200. In the instrument the
calibration coefficients required for calculating the temperature values are organized in sets of
parameters. The user is able to assign a set of parameters to a measuring channel and thus to
the sensor connected to it. The assignment is carried out with the help of a menu with short
and clear descriptions of the different sets. Only one set of parameters at a time can be
assigned to each measuring channel. The same set of parameters however can be used for
more than one measuring channel at the same time.
In addition to that the input of sensor parameters and the processing of calibration coefficients
of various sensors has been transferred to a PC (see chapter "Establishing sensor specific
parameters"). The user has the possibility to enter the sensors' calibration coefficients on his
8
Manual Operation
PC and to save them there as well. The PC software included in the package offers the
processing of sensor coefficients and the input of short descriptions. Those descriptions are
transmitted into the measuring instrument along with the calibration coefficients. Thus the
user is enabled to assign the fitting parameters easily to a sensor as he can recognize the
appropriate parameters with the help of those short descriptions and not by anonymous
numbers only. Whenever temperature sensors are exchanged the user can easily enter the
sensor coefficients required for the thermometer from his PC and does not have to enter them
again using the instrument's keyboard. On top of that the thermometer is able to store the
calibration coefficients of various sensors, so that it is not necessary to transmitt sensor data
again if a sensor is changed.
Furthermore an easy-to-learn system which is menu-controlled has been installed, which
offers a lot of easily accessible functions for the user. Most of the adjustments made by the
user are preserved when the instrument is switched off. Only the "ZERO"-mode and the
storage of measured valued are also switched off.
After switching the instrument on it is in a standard state set by the manufacturer. Here
channels A and B are activated. The measured values are displayed in °C. Unless arranged
differently with the supplier for both temperature sensors the standard coefficients are set
according to EN 60751. Initially when switched on the display shows the type of instrument
and its version.
T 4200
(V 1.03)
Picture 6.1: Example of the first display after switching on the thermometer
After a short time the second line changes and the instrument's number is displayed.
T 4200
AM00497010017800
Picture 6.2: Example of the display of the instrument's number
After the first measurement one of the following displays might appear for example.
9
Manual operation
A
123.456 °C
A
B
123.456 °C
78.901 °C
Picture 6.3: Examples of the display of measured values
In the following it is explained how the user might adjust the settings of the instrument.
6.1 Measurements with reduced measuring times
By pressing the button "FAST" a measuring mode can be activated in which the measuring
times are a lot shorter. This mode is intended especially for tasks when temperature values
tend to change quickly. Using an external multiplexer it still offers a high measuring rate for
each channel even with a higher number of measuring channels. In this faster mode the
measurements are carried out with a reduced resolution and accuracy. By pressing the "FAST"
button again this faster mode is stopped.
6.2 Measuring temperature changes
If you press the "ZERO" button the value measured last is temporarily stored. During the
following measurements the content of the temporary memory is subtracted from the current
measured value. This function is intended for applications used to describe changes in the
values measured. Pressing the "ZERO" button again stops this mode.
6.3 The user menu
Further functions are available to the user by means of a user menu. This menu is started when
pressing the "ENTER" button. Using the buttons "⇐" or "⇒" the user may choose an element
from the main menu which are explained in the following. Afterwards the chosen menu
element can be selected by pressing "ENTER". By pressing "ESC" one returns from the main
menu back to the measuring mode.
6.3.1 Selection of units
Firstly the element "Unit selection" in the main menu has to be clicked into with the buttons
"⇐" or "⇒".
unit selection
°C
Picture 6.4: Main menu element "Unit selection"
10
Manual Operation
After that this function can be activated with the "ENTER" key. Then the following will be
displayed for example.
°C
⇑ ⇓ ESC ENTER
Picture 6.5: Display after activation of main menu element "Unit selection"
The instrument supports the units °C, K, °F and ohm. Using the arrows "⇑" or "⇓" the
appropriate unit can be selected and can then be activated with the "ENTER" key. By pressing
"ESC" you will return to the main menu without activating a new unit.
6.3.2 Turning differential measuring on/off
Through a configuration of the second line of the display the differential measuring is
switched on or off. The thermometer is able to display the difference of the measured values
of channels A and B (A - B). To do this you have to select the element "2nd line configuration"
from the main menu by using the keys "⇐" or "⇒".
2nd line config
2nd line : B
Picture 6.6: Main menu element "2nd line configuration"
Subsequently this selection can be activated with "ENTER", so that you will get the following
display.
2nd line :
B
⇑ ⇓ ESC ENTER
Picture 6.7: Display after activation of the main menu element "2nd line configuration"
Using the arrows "⇑" and "⇓" it is possible to choose between the display of the measuring
value of channel B and the difference A - B in the second line. This function can be activated
with "ENTER". By pressing the "ESC" key you will return to the main menu without making
any changes.
11
Manual operation
6.3.3 Switching channels on/off
You have got the possibility of switching measuring channels on or off. To do this you have to
select "Channels on/off" from the main menu by means of the keys "⇐" or "⇒".
channels on/off
⇐ ⇒ ESC ENTER
Picture 6.8: Main menu selection "Channels on/off"
Afterwards this selection can be activated with "ENTER", so that the following display will
show.
channels on/off
⇑ ⇓
[manual]
Picture 6.9: Display after activation of the main menu element "Channels on/off"
Using the arrows "⇑" and "⇓" the user first has to decide whether he wants to switch each
channel on or off manually or whether all the wired channels should automatically be
switched on and the unwired ones switched off by the instrument. If the automatic mode is
selected the following display will appear.
channels on/off
setting channels
Picture 6.10: Display automatic mode "Channels on/off"
If the manual mode is chosen the following will be displayed.
A:
on
⇑ ⇓ ESC ENTER
Picture 6.11: Display manual mode "Channels on/off"
It is now possible to chose between "on" and "off" using the arrows "⇑" and "⇓". By pressing
"ESC" the old setting will be preserved. By pressing "ENTER" the selected function will be
12
Manual Operation
activated. This main menu element is left only when all the channels have been switched on or
off manually. You ought to switch on only those channels which are actually connected to a
sensor. Otherwise the measuring time will be increased unnecessarily.
6.3.4 Selection of sensor parameters
The selection of sensor parameters is of particular importance. Here the user has to determine
which calibration coefficients are to be used for the sensor connected to each channel. In
addition to the number of the set of calibration coefficients a short description (up to 16
characters) of the sensor, entered by the user himself on his PC, is shown to avoid any
operational errors.
Warning: The user has to ensure that the selected calibration coefficients belong to the
sensor in use. If the user selects incorrect calibration coefficients the
measured values might be wrong.
Note:
In case the user swaps any of the connected sensors, he obviously has to swap
the numbers of the parameter sets assigned to the measuring channels as
well.
At first the element "Selection of sensor parameters" has to be chosen from the main menu
with the keys "⇐" or "⇒".
sensor params
⇐ ⇒ ESC ENTER
Picture 6.12: Main menu element "Selection of sensor parameters"
As soon as this element is activated with the "ENTER" key, the following is displayed.
sensor params
ch A
Picture 6.13: Display after activation of "Selection of sensor parameters"
13
Manual operation
At first the measuring channel has to be selected whose sensor parameters have to be set.
After that the measuring channel (A or B) is chosen with the "ENTER" key. You can leave
this menu element by pressing "ESC". For the following pictures it is assumed that channel A
has been selected and clicked into with the "ENTER" key.
ch A
params 00
EN60751 Standard
Picture 6.14: Display when sensor parameters are set for channel A
The characters "ch A" in the top left corner of the display show that the parameters for the
sensor connected to channel A are to be selected. The expression "params 00" shows, that the
parameter set 00 is used. The second line displays the short description for the parameter set
00, entered on the PC. With "EN 60751 standard" the manufacturer of the T 4200 has labelled
a sensor parameter set which is described by means of the standard coefficients of EN 60751.
Using the keys "⇑" and "⇓" the number of the parameter set which is to be used can be
changed. Then the according short description appears in the second line. By pressing the
"ENTER" key a parameter set is assigned to a measuring channel. By pressing "ESC" the
previous menu level is reactivated without assigning a new parameter set to the selected
measuring channel.
6.3.5 Loading the standard settings
To set the instrument back into its original status, the standard settings can be re-loaded. To
do this the main menu element "load standard configuration" can be selected using the keys
"⇐" or "⇒".
load std. cfg.
⇐ ⇒ ESC ENTER
Picture 6.15: Main menu element "loading standard configuration"
Afterwards this menu element can be activated with the "ENTER" key, so that the following
display will appear.
load std. cfg.
14
Manual Operation
sure?
ESC ENTER
Picture 6.16: Display after activation of "Loading standard configuration"
Pressing "ESC" you can leave this level of the main menu again. If you press "ENTER" the
standard configurations are loaded. In doing so the unit is set back to °C; channels A and B
are switched on; the differential measurement A - B is deactivated as are the "FAST"-mode
and the "ZERO"-mode.
6.3.6 Starting a record of measuring values
The instrument offers the possibility of storing measured values in a battery-powered memory
(see "Specifications" for size of memory). By starting up a record the value memory is set
back and measurements are started anew. As it is possible to store measured values, the
measurements can be stored without a permanent connection of the instrument to your PC and
may be transmitted to a PC at a later time if necessary. To do this the main menu element
"start new storage" has to be selected using the keys "⇐" or "⇒".
start new storg.
⇐ ⇒ ESC ENTER
Picture 6.17: Main menu element "Start storage of measuring values"
If you activate the element afterwards with the "ENTER" key, the following will be displayed.
start new storg.
sure? ESC ENTER
Picture 6.18 Display after activation of "Start storage of measuring values"
You can go back to the previous level of the main menu by pressing "ESC". Pressing the
"ENTER" key starts up a new series of measurements. If the thermometer is switched off, no
new measured values are stored after switching it back on. Thus it is ensured that after
recording a series of measurements and switching the thermometer off, no further values are
added to the series right after switching the instrument back on (e.g. before the values have
been transferred to the PC).
15
Manual operation
6.3.7 Setting the baud rate
At first the element "Select baud rate" has to be chosen in the main menu using the keys "⇐"
or "⇒".
select baud rate
2400 Bd
Picture 6.19: Main menu element "Select baud rate"
After that this element can be activated with the "ENTER" key, so that the following display
will appear.
2400 Bd
⇑ ⇓ ESC ENTER
Picture 6.20: Display after activation of "Select baud rate"
The thermometer supports the baud rates 1200, 2400, 4800 and 9600Bd. Using the arrows "⇑"
or "⇓" the appropriate baud rate can be selected and then activated with the "ENTER" key. By
pressing "ESC" it is possible to return to the main menu without activating a new baud rate.
7. Operating the instrument from your PC
The instrument offers the possibility that nearly all of its functions can be controlled by a PC
via a serial interface. To do this the RS 232-interface (see picture 5.2) of the instrument has to
be linked with the matching PC connection.
Safety instruction: Only the prescribed cables are to be connected to the instrument!
The operator has to ensure that no inadmissible voltages reach the
instrument.
To ensure the current supply of the galvanically separated instruments of the thermometer's
interface the PC's DTR connection has to be set to "false" (-12 V) and the RTS to "true (+12
V). For the serial transfer the following parameters are set: 8 data bits, no parity bit, one stop
bit.
16
Operating from PC
Note:
If you do not need a connection between the thermometer and your PC, you
ought to remove the RS 232 cable, because the PC might influence your
measurements.
In the following the instructions necessary to control the thermometer by means of a PC are
explained. Here the abbreviation ACK is used for an okay-message (06h) and NAK for an
error-message (15h).
Instruction code "a" (Checking whether the instrument is ready to use)
To check whether the instrument is ready to use the PC sends the instruction code "a". The
instrument will answer with "ACK" if ready.
Instruction code "b" (Reading the instrument's number)
To read the instrument's number the PC sends the instruction code "b". The instrument will
answer with the text (16 characters), which also appears in the second line of the
thermometer's display after switching it on.
Instruction code "c" (Recognizing the software version)
To read the number of the software version the PC sends the instruction code "c". The
measuring instrument will answer with a text of 6 characters, which appears in the second line
of the display right after switching the thermometer on.
Instruction code "d" (Recognizing the number of measuring channels)
To count the number of measuring channels the PC sends the instruction code "d". The
instrument will answer with the full number of the available measuring channels, which
means that it answers with "02h" if no external multiplexer is connected. If, for example, an
external multiplexer with eight channels is connected the instrument will answer with "09h"
as channel B is not in use because of the external multiplexer.
Instruction code "e" (Read size of memory)
If the PC sends the instruction code "e" the instrument will answer with the number of
memory block units of 32 KB. In the basic version it thus will answer with "04h".
17
Operation from PC
Instruction code "f" (Reading short descriptions)
To read the short information on a sensor parameter set the PC firstly sends the instruction
code "f". After that it sends the number of the parameter set. The instrument will answer with
the 16 character-text that also appears on the display in the manual selection of a parameter
set. In case the parameter set is defect or not available the instrument will send the message
"NAK".
Instruction code "g" (Reading the value memory)
To read the memory of the measured values the PC sends the instruction code "g". The
instrument then sends the content of the value memory. Here the measured values are
transmitted as decimal point numbers in the single-precision format according to IEEE.
Instruction code "h" (Reading the latest measured value)
To read the latest valid measuring value the PC sends the instruction code "h" and the channel
number. The thermometer will test wether this channel is „on“. If not it will answer with
NAK. If there is no new measurement value it also will answer with NAK. If there is at least
one value which hasn't been transmitted from the thermometer to the PC, the measuring
instrument will firstly send ACK followed by and then the measured value in the singleprecision-format according to IEEE. STD 754
Instruction code "o" (Release a warm boot of the instrument)
To release a warm boot of the thermometer, the PC sends the instruction code "o". The
instrument will reply with "ACK" and carry out a warm boot afterwards. With the instruction
code "a" the PC then can check whether the thermometer is ready to use. After a warm boot,
in contrast to a cold boot, no keys are blocked and the "ZERO"-function as well as the storage
of measured values are not deactivated. Furthermore no search for external multiplexers is
carried out after a warm boot.
Instruction code "p" (Reset of value memory and start up of storage)
To reset the value memory and start up the storage of measured values the PC sends the
instruction code "p". The instrument will answer with "ACK" and start up a new series of
measurements.
18
Operating from PC
Instruction code "q" (Select baud rate))
To set the baud rate the PC sends the instruction code "q" followed by the appropriate code.
The following codes are used:
0 h for 1200 baud,
01h for 2400 baud,
02h for 4800 baud and
03h for 9600 baud.
If the PC send a different code number the instrument will answer with "NAK". In the regular
case it will answer with "ACK".
Instruction code "r" (Switching the instrument's keys on/off)
To switch off the instrument's keys the PC sends the instruction code "r" followed by "01h".
To switch it back on the PC sends "r" followed by "00h". The thermometer will answer with
"ACK" in both cases.
NOTE: In case the instrument should be controlled by means of a PC only it is
recommended that the thermometer's keyboard is switched off at first, so that
no configurations may be changed afterwards.
Instruction code "s" (Switching the "FAST"-mode on/off)
To switch on the "FAST"-mode the PC sends the instruction code "s" followed by "01h". To
switch the "FAST"-mode off the PC sends "s" followed by "00h". In both cases the
thermometer will answer with "ACK".
Instruction code "t" (Switching the "ZERO"-mode on/off)
To switch on the "ZERO"-mode the PC sends the instruction code "t" followed by "01h". To
switch the "ZERO"-mode off the PC sends "t" followed by "00h". In both cases the
thermometer will answer with "ACK".
Instruction code "u" (Setting the unit)
To select the unit the PC sends the instruction code "u" followed by the unit and the matching
code (see instruction code "h"). The thermometer will answer with "ACK" after every change.
19
Operation from PC
Instruction code "v" (Switching the differential measurement on/off)
To switch on the differential measurement the PC sends the instruction code "v" followed by
"01h". To switch it off again the PC sends "v" followed by "00h". The thermometer will
answer with "ACK" after every change.
Instruction code "w" (Switching a measuring channel on/off)
To switch on a measuring channel the PC sends the instruction code "w" followed by the
number of the channel (e.g. "01h" for channel B) and "01h". To switch off the appropriate
channel "00h" is sent as a third code. If the selected measuring channel is not available, the
instrument will send "NAK". Otherwise it will switch the appropriate channel on or off and
send "ACK".
Instruction code "x" (Assignment of a parameter set)
To select a sensor parameter set the PC sends the instruction code "x" followed by the number
of the measuring channel connected to this sensor followed by the number of the parameter
set to be used. The thermometer will send "NAK" if the number of the parameter set is bigger
than the possible maximum. Otherwise the demanded function will be carried out and the
instrument will send "ACK".
Instruction code E3h (Reading of the external multiplexer's version number)
To read the version number of the external multiplexer the PC sends the instruction code E3h.
If no multiplexer is connected the thermometer will answer "NAK". Otherwise it will answer
"ACK", read the version number of the multiplexers and send them to the PC.
Instruction code E4h (Reading version log number of the external multiplexers)
To read the version log number of the external multiplexers the PC sends the instruction code
E4h. If no multiplexer is connected the thermometer will just answer "NAK". Otherwise the
instrument will answer with "ACK", read the log version number of the multiplexers and send
them to the PC.
Instruction code F1h (Reading whether the storage of measuring values is switched on or
off)
20
Operating from PC
To read whether the storage of measuring values is switched on or off the PC sends the
instruction code F1h. The thermometer will send "00h" if the storage is switched off and
"01h" if the values are saved.
Instruction code F2h (Reading the status of the keyboard)
To read the status of the keyboard the PC sends the instruction code F2h. If the keyboard is
not blocked the thermometer will send "00h", if it is blocked it will send "01h".
Instruction code F3h (Reading the status of the "FAST"-mode)
To read the status of the "FAST"-mode the PC sends the instruction code F3h. The
thermometer will send "01h" if the "FAST"-mode is activated, otherwise it will send 00h.
Instruction code F4h (Reading the status of the "ZERO"-mode)
To read the status of the "ZERO"-mode the PC sends the instruction code F4h. The
thermometer will send "01h "if the "ZERO"-mode is activated, otherwise it will send 00h.
Instruction code F5h (Reading the unit)
To read the unit set in the thermometer the PC sends the instruction code F5h. The instrument
will send the code of the unit (see instruction code "h").
Instruction code F6h (Reading the status of the differential measuring)
To read the status of the differential measuring the PC sends the instruction code F6h. The
thermometer will send "01h" if the differential measuring is activated, otherwise it will send
00h.
Instruction code F7h (Reading the status of a measuring channel)
To read the status of a measuring channel the PC sends the instruction code F7h followed by
the channel number. The thermometer will answer "01h" if the channel is switched on,
otherwise it will send "00h".
Instruction code F8h (Reading the number of an assigned parameter set)
To read the number of a parameter set assigned to a measuring channel the PC sends the
instruction code F8h followed by the number of the measuring channel. The thermometer will
send the number of the parameter set.
21
Sensor specific parameters
8. Establishing sensor specific parameters
After the instrument has measured the sensor resistance it needs the calibration coefficients of
the sensor used to calculate a temperature value from the resistance value. These parameter
sets can be established on the PC using the program SEN4200 and can be transmitted to the
measuring instrument. Additionally this program offers the processing of an almost unlimited
number of various temperature sensor calibration coefficients.
8.1 Installation of the PC program to establish sensor specific parameters
To install the PC program to establish sensor specific parameters the program disk has to be
inserted into your PC. Now the installation program INSTT can be called on the DOS level.
At first this program allows to set the user language. After that it asks in which drive a new
directory for the program SEN4200 should be opened and what to call it. After that this
directory file along with the subdirectory SENSDATA is created. Then the program SEN4200
is copied into the new file. In addition to that two parameter sets are copied into the
subdirectory SENSDATA. The copied sets are a parameter set for temperature sensors with
the standard coefficients according to EN 60751 and a parameter set for a standard sensor
according to ITS 90.
Furthermore the installation programme wants to know which of the PC-interfaces COM1 or
COM2 are used for thermometer. The installation program enters the appropriate interface
into the file T4200.CFG.
The RS232-interface of the instrument has to be connected with the appropriate PC
connection used by the operator.
Safety instruction: Only the prescribed cables are to be connected to the instrument!
The operator has to ensure that no inadmissible voltages reach the
instrument.
8.2 Operation of the PC-program to establish sensor specific parameters
Whenever a new parameter set is established a new parameter file is created by the program.
Apart from the parameter set itself this file contains further data. On the one hand it contains
the name of the file. Firstly this can be transmitted to the thermometer along with the
parameter set, so that the user can easily find the file, in which one of the instrument's
22
Sensor specific Parameters
parameter sets is defined. Furthermore the parameter file contains some short information (16
bytes) which has to be entered by the user. This is also transmitted to the thermometer along
with the parameter set. In the instrument it enables the user to assign a parameter set easily to
a measuring channel. Besides there are five lines of information contained in the parameter
file, which can be entered by the user as he wants. Afterwards the parameter file contains
various calibration coefficients which have been entered by the user while establishing the
parameter set. These are the basis of the actual calibration coefficients. By means of
checksums the parameter files are protected against unwanted changes.
NOTE: To keep it clear the user should proceed in the following way. The name of the
parameter file consists of a maximum of eight characters. Here one can use the
name or the number of the sensor for example. The 16-character description,
which is also displayed on the thermometer, can be entered by the user. He
ought to use a description of the sensor which allows an especially easy
assignment of the parameter set to the sensor. Thus it is achieved that the user
easily recognized to which sensor a parameter set belongs.
After starting the PC-program the following menu will appear.
<a> define sensor
<b> copy sensordata from disk to T4200
<c> list filenames on disk
<d> display file
<e> list sensordata at T4200
<f> delete sensordata at T4200
<x> end
Picture 8.1: Menu after program start
The user now has the following possibilities of operation
a) Establishing a new parameter set
b) Transmitting a parameter set to the T 4200
c) Display of parameter files available on the hard disk
d) Looking at a parameter file on the hard disk
e) Display of parameter sets available on the thermometer
f)
Deleting a parameter set from the instrument
23
Sensor specific parameters
x) Stop program
In case the user wants to delete one of his own parameter files, this can be done with the
appropriate DOS-instruction.
8.2.1 Establishing a new parameter set
After a) has been chosen from the menu the user first has to enter the name of the new
parameter file. After that he can enter a short description of the sensor consisting of a
maximum of 16 characters. Using this short description the user has to assign the measuring
channel to the parameter set. Afterwards the user may enter another five lines of information.
In those five lines he should make a note of the specialities in defining the sensor. Among
other things those lines should help the user to find a certain parameter file on the hard disk of
his computer. After entering the last line of information the following menu appears.
<a>
<b>
<x>
Industrial thermometer (low alpha, EN 60751)
Laboratry thermometer (high alpha, ITS90)
end
Picture 8.2: First menu when defining a new parameter file
The user now has to decide whether the temperature sensor is intended for industrial
applications or for laboratory use.
The main difference between those two sensor types is shown in their alpha-value. Sensors for
industrial applications have got an alpha-value of 3.85 • 10-3. This kind of sensor is described
in the EN 60751 for example. The laboratory reference normals made of pure platinum show
an alpha-value of more than 3.9 • 10-3. Those sensors are used for measurements according to
the international temperature scale from 1990 [ITS 90] as interpolation instruments between
the fixed points prescribed in it. If the user does not know what type of sensor it is, he can get
this information from the supplier of the sensor.
8.2.1.1 Establishing a parameter set for industrial temperature sensors
If the user selects a temperature sensor for industrial applications the following submenu
appears. Here the user can select one out of three methods for establishing the parameter set.
24
Sensor specific Parameters
<a> Standard EN 60751 coeffizients
<b> Callendar van Dusen coeffizients
<c> Callendar van Dusen couples
<x> end
Picture 8.3: Submenu for the definition of an industrial temperature sensor
a) Establishing a parameter set with the constants specified in EN 60751
b) Entering the coefficients according to Callendar van Dusen. The coefficients used in the
EN 60751 are a special case of the Callendar van Dusen coefficients. In this point of the
menu the user can determine the coefficients himself. For example if you have a sensor
corresponding to EN 60751, with only its resistance value of 0°C deviating from the
value prescribed in the norm, the menu point b) would have to be selected and the correct
resistance value for 0°C would have to be entered. During the input the coefficients
according to the norm are automatically used if the user does not enter a different value.
c) The input of couples of values according to Callendar van Dusen enables the user just to
enter the values of the temperature sensor´s calibration sheet. The program calculates the
appropriate Callendar van Dusen coefficients and saves them in a new parameter file. For
this procedure the user firstly has to decide whether a parameter set is to be established
for positive temperatures (≥ 0°C) only or for both positive and negative temperatures.
Positive temperatures only:
If the parameter set is to be determined for positive temperatures only, just the
coefficients R0, A and B have to be calculated. To do this two to twenty observational
pairs can be entered. If only two observational pairs are entered, only the coefficients R0
and A are calculated. In that case the coefficient B values 0. For three or more
observational pairs all three of the coefficients are determined. If more than three
observational pairs are entered, the coefficients are calculated in a way that the resulting
function shows a deviation as small as possible for all observational pairs. The calculation
in this case is carried out using a least-square-algorithm.
Positive and negative temperatures:
If the parameter set is to be established for both positive and negative temperatures, all of
the four coefficients (R0, A, B and C) have to be calculated. To do this three observational
pairs for positive temperatures (≥ 0°C) have to be entered first. After that one
observational pair of a negative temperature (< 0°C) has to be entered.
25
Sensor specific parameters
After all the sensor coefficients have been entered or calculated the program asks for the
temperature minimum and maximum the parameter set has to be valid for. When used the
instrument will show an error message if the set temperature range is exceeded in either way.
Finally the user is asked whether the established parameter set should be transmitted to the
thermometer. If it shouldn't be transmitted, it is only stored in the subdirectory SENSDATA.
Transmitting the parameter set to the thermometer is described in chapter 8.2.2.
8.2.1.2 Establishing a parameter set for laboratory temperature sensors
In connection with the ITS 90 reference functions are fixed, which describe the performance
of ideal platinum temperature sensors. To fit real sensors to these reference functions
deviation functions are set in the ITS 90. This program allows the input or calculation of the
coefficients of those deviation functions. Whereas there are only two functions (for positive or
negative temperatures) for industrial sensors, 11 areas all in all are distinguished for the
laboratory sensors. This is the reason why the user first has to choose one or more temperature
ranges set for the ITS 90. As it might lead to contradictions if more than one temperature
range is chosen, the program only allows to combine temperature ranges which do not
overlap. After the choice of temperature ranges the following submenu appears. Here the user
may select one of the three methods to establish a new parameter set.
<a>
<b>
<c>
<x>
Use standard ITS90-coeffizients
Enter ITS90-coeffizients
Enter temperatur/resistance-couples
Abort
Picture 8.4: Submenu for the definition of a laboratory temperature sensor
In any case the value of the sensor resistance for the reference temperature of 0.01°C has to be
entered.
a) Establishing a parameter set for a sensor ideal in the sense of ITS 90
b) Input of coefficients of the deviation function(s). Each of the above selected temperature
ranges needs its own deviation function. As the different deviation functions use different
coefficients, the coefficient for each one of the deviation functions, which are necessary,
have to be entered.
26
Sensor specific Parameters
c) The input of temperature/resistance-couples enables the user to enter the values from the
calibration data of the temperature sensor. Afterwards the program calculates the
coefficients of the deviation function and later saves them in the new parameter file.
After all the sensor coefficients have been entered or calculated, the program asks for the
temperature minimum and maximum, which the parameter set will be valid for. The
instrument will display an error message if the set temperature range is exceeded in either
way. Finally the user is asked whether the newly established parameter set is to be transmitted
to the measuring instrument. In case it needn't be transmitted it is saved only in the current
drive of the PC. How to transmit the parameter set is described in chapter 8.2.2.
8.2.2 Transmitting a parameter set to the T 4200
After selecting the menu element to transmit a parameter set the name of the parameter file is
asked for. Afterwards the program reads the list of parameter sets available in the
thermometer. Then the following list of parameter sets contained in the instrument is
displayed on screen.
No. in T.
0
1
2
3
filename
shortinfo
EN60751.T
EN60751 Standard
ITS90STD.T
ITS90 Standard
------------ -------------------------- ---------------
Picture 8.5: Presentation of the thermometer's parameter sets
In picture 8.5 some of the parameter sets available in the thermometer is presented. To keep it
clear only the first four elements of the table were filled in. The maximum number of
parameter sets available in the instrument depends on its model version. In the basic model a
maximum of 21 parameter sets is intended. In an expanded version up to 81 parameter sets
can be entered. The left column shows the numbers under which the parameter set is listed.
The middle column contains the name under which the matching parameter file is saved on
the hard disk. In the right hand column one can find the short information. In this example
numbers 2 and 3 are empty.
The user now can decide where to fill in the parameter set, which is going to be transferred to
the thermometer. If he chooses a place already occupied by another parameter set this
27
Sensor specific parameters
parameter set will be recorded over. When using the thermometer later on the operator can use
the number set in this table to assign the respective parameter set to a measuring channel.
After the user has picked a number in the table the parameter set is transmitted to the
thermometer.
8.2.3 Listing the parameter files available on the hard disk
By selecting the menu element to read all the parameter files available on the hard disk the
user gets a list of all the parameter files contained in the subdirectory SENSDATA. Here only
the file names and the short descriptions are displayed.
8.2.4 Viewing a parameter file available on the hard disk
After clicking into the menu element to read a parameter file the user first has to enter the
file's name. Afterwards the content of this file is displayed on screen.
8.2.5 Viewing the parameter sets available on the instrument
To view the parameter sets available on the instrument the program reads the list of those
parameter sets. After that this list is shown on screen analogously to picture 8.5.
8.2.6 Deleting a parameter set from the thermometer
To delete one of the parameter sets available on the thermometer the program starts by reading
the list of sets available and displays it on screen afterwards analogously to picture 8.5.
Afterwards the user has the possibility to delete one of the parameter sets.
9. Recording and
SmartGraph
presentation
of
measured
values
with
The program SmartGraph offers the recording, storage and graphical presentation of measured
values. SmartGraph is a trademark of the Weiland-Meierhofer GmbH.
9.1. System requirements for the installation of SmartGraph
Hardware: You must own a personal computer with an 80386 microprocessor or better;
recommended are at least 4 MB RAM and a mouse. To connect the thermometer a
serial interface has to be available.
Software: MS-Windows 95 or MS-Windows 3.11 has to be installed on your computer.
28
SmartGraph
9.2 Installation of SmartGraph
-
Start up Windows
-
Insert the SmartGraph floppy disk into your disk drive.
-
Select the instruction "Ausführen" ("Run") from the menu "Datei" ("File") of the programmanager (Windows 3.11) or rather from the task bar (Windows 95).
-
After that enter the instruction: a:\setup (only if you have inserted the disk into drive a:,
otherwise you have to enter the appropriate name of the drive!) and choose "OK".
-
Follow the instructions on the screen. If you take over the settings the new program group
"SmartGraph" is created and the program files are copied into the subdirectory "c:\sg_T".
As soon as the installation is completed you can find the SmartGraph program icon in the
newly created program group " SmartGraph" or in the program group you have entered.
(Detailed instructions on how to work with the program manager can be found in your
Windows-manual. Apart from that you can always get help on the relevant active menu
element by pressing the button F1.)
9.3 Introduction into SmartGraph
9.3.1 Recording measuring values
SmartGraph contains a recorder to record any measured values of the connected thermometer
on your PC. For the communication with SmartGraph the baud rate of the instrument has to be
set on 9600. When starting a storage SmartGraph blocks the instrument's keyboard, so that its
settings (e.g. the unit) cannot be changed during a storage.
The file "Sensors.ini" contains information to describe the measured values transferred from
the thermometer. This information is organized as channel description sets.
[Sensor2100]
Hold=Temperatur A
Name=TA
Unit=°C
Max=962
Min=-200
Dec=3
Picture 9.1: Example of a channel description set
29
SmartGraph
At the beginning of each channel description set there is the number of the description set.
The thermometer tells SmartGraph the number of the description set belonging to a measured
value. The description sets 200 up to 2099 are used if the unit ohm is activated. For °C, K and
°F the description sets 2100 to 2199, 2200 to 2299 and 2300 to 2399 are used. In case the
differential measurement is activated on the instrument the description set numbers 2400 up to
2799 are used accordingly. If for example the unit °C is set on the thermometer and the
differential measuring is deactivated, the description set with the number 2101 is used for the
measured values of measuring channel B. For measured values of the measuring channel M05
the description set with the number 2106 would be used.
In the second line of the description set the measured value is described. In the example
shown in picture 9.1 "temperature A" was chosen for this line. "TA" is the short name which
has been set for this measuring value. For "unit" the unit "°C" was entered . The temperatures
962°C and -200°C have been set as maximum and minimum. The resolution was set to 3
decimal places. In the file "Sensors.ini" the rest of the entries were created by the
manufacturer according to the above mentioned example.
Using a text editor the user can change the file "Sensors.ini". If for example the temperature of
an oven is measured on the measuring channel A the user could change the description set
2100 as is shown in picture 9.2.
[Sensor2100]
Hold=Oven temperature
Name=TOven
Unit=°C
Max=160
Min=150
Dec=3
Picture 9.2: Example of a channel description set changed by the user
In the example shown in picture 9.2 the user has used application-specific descriptions. Apart
from that it was fixed that a the measured values are high-lighted if the temperature falls
below 150°C or exceeds 160°C.
30
SmartGraph
The recorder window is opened with the instruction "Start Recorder" from the menu "Datei"
("File"). Recording intervals from 1 second up to 60 minutes can be selected. Pressing the key
"Start" a record is started. The recorder window displays the most recently recorded
measuring values of all channels. In addition to that the graphics and table windows are updated. If the thermometer has not yet measured any new values when SmartGraph makes an
inquiry, no values are entered into the table at this time of record. Thus it is ensured that the
time pattern determined by the recording intervals isn't broken.
If the measuring instrument recognizes that the borders set in the technical specifications of
the thermometer or the borders set by the user during the definition of the sensor's calibration
coefficients are exceeded, this is reported to SmartGraph. SmartGraph will then ignore the
appropriate measuring values. The user can find a description of the error on the display of the
measuring instrument.
9.3.2 Graphical and tabular presentation of the measuring values
For a graphical and tabular presentation of the measuring values one has to use the instruction
"Öffnen" ("Open" in the menu "Datei" ("File").
SmartGraph will now present the measuring values graphically and tabulated in windows.
These windows can be moved, enlarged or reduced to a symbol. They can overlap or be
presented one below the other. If you have used other Windows-applications before the
operation will soon be familiar to you.
9.3.3 Analyzing and processing of measuring values
Every operation in any graphics window is also carried out in all the other graphics windows.
The graphics windows thus always present the same time span. (If displayed one over the
other the diagrams can be compared very well.)
To analyze the measuring values the time span can be zoomed to up to 10 seconds. As soon as
you move the pointer of the mouse into the area of presentation of a graphics window it
changes into a magnifying glass. To enlarge a specific area you have to put the magnifying
glass over it and double-click the left mouse button. The graphics are now zoomed to the next
level, keeping the selected area in the middle of the presentation. To zoom out you just have
31
SmartGraph
to double-click the right mouse button. Alternatively you can hold down the shift button and
double-click the left mouse button at the same time.
The levels of presentation are: year, month, week, day, 6 hours, 1 hour, 10 minutes, 1 minute
and 10 seconds (see also: instruction "enlarge" in the menu "edit")
Each graphics window has got image window scroll bars at the bottom to view different areas
of the image. You have to click on the left or right arrow to move the graphics one step to the
left or right. To leaf through the area just click on the left or right part of the scroll bars to
move to the left or right.
9.3.4 Documentation
For printing you have to use the instruction "Drucken" ("Print") in the menu "Datei" ("File").
Here the image will be printed by the printer installed in windows with full resolution.
The content of graphics windows can be transferred into other applications (e.g. MS-Word,
MS-Works or Wordperfect for Windows) using the Windows-Clipboard. For an numerical
processing of measuring values the data should be saved in a text format, so that it can
afterwards be read by a spreadsheet like for example Excel, etc.
- Click into the relevant window to activate it, or select it from the menu "Fenster"
("Window").
- Now select the instruction "Kopieren" ("Copy") in the menu "Bearbeiten" ("Edit").
- Change your application.
- In your new application choose "Einfügen" ("Paste") in the menu "Bearbeiten" ("Edit").
9.4 Description of the menu instructions
9.4.1 File menu
The selection of a file is done with the dialogue box "Datei öffnen" ("Open file").
- Enter the name of the respective file in the field "Name" ("name"),
- or select a file name from the list "Dateien" ("files"),
- or choose a file from another directory by selecting the appropriate directory from the list
"Verzeichnisse" ("directories").
32
SmartGraph
Selecting the function "Datei speichern unter" ("save as") you can save the data in a different
file. Here a dialogue box appears, in which you can enter a new name for the current file.
Warning: If you select a file which does already exist and if you confirm the further inquiry
this file is recorded over and the old data from this file is deleted.
The menu element "Start Recorder" opens the recorder window and starts up a storage of
measuring values using SmartGraph (comparable to a writer). This menu element changes
into "Stop Recorder" as soon as the recording is running. Here you are asked for a file name to
save the recorded values. Apart from that you can set the appropriate recording interval from 1
second up to a maximum of 60 minutes. Afterwards you click onto the "Start" button. The
graphics windows display 10 minutes going back from the actual PC system time. When the
right hand margin is reached in the image the graphics are moved to the left by one minute. In
the recorder window the most recently recorded values are displayed. If the alarm borders are
exceeded in any way the respective measuring value is written in red. The graphics and table
windows are updated at the same time. Every two minutes ( or rather with each record for
intervals >2 minutes) the measuring data is saved on the hard disk, so that it doesn't get lost in
case of a system or power failure.
After activating the instruction "Drucken" ("print") the dialogue box "Drucken" ("printing"
appears. By selecting the appropriate option you can choose what is to be printed: the table,
certain graphics, or all graphics (either all arranged on one page or one page per image). Tip:
In the top right corner the image saved in the file "LOGO.BMP" is printed. You can create
your own logo with the program "Paintbrush" for example.
Through the activation of the instruction "Seite einrichten" ("page setup") the dialogue box
"Seite einrichten" ("page setup") appears with the following options. In "Titel" ("title") you
can enter a headline printed at the top of each page (e.g. for user data). If the option "Tabelle
mit Rahmen drucken" ("Print table with frame") is not activated, the table will be printed
without frames and without the logo in the font set before. Thus the output rate is considerably
raised, especially for matrix printers. In the option "Seitenränder" "margins" you can enter the
appropriate margins in cm. (The size of page has to be set with the instruction "Drucker
einrichten" ("printer setup").)
33
SmartGraph
With the instruction "Drucker einrichten" ("printer setup" you can select the options of your
printer. With most printers you can choose between various graphics resolutions. A higher
resolution does increase the quality, but in the other hand the time needed for the printout
rises. The best thing is to try different resolutions. Tip: To print single graphics windows it is
best to use the page orientation "landscape"; to print all graphics at once or the table it is better
to use the orientation "portrait".
9.4.2 Edit menu
With the instruction "Kopieren" ("copy") graphics can be copied to the clipboard.
- Either click on the appropriate graphics window with the left mouse button or select it from
the menu "Fenster" ("window") so that it becomes the active window.
- Then choose the instruction "Kopieren" ("copy") from the menu "Bearbeiten" ("edit").
Now you can change your application program. In the new application select the instruction
"Einfügen" ("paste") from the menu "Bearbeiten" ("edit").
Using the instruction "Vergrößern" ("enlarge") the centre of the current graphics window is
enlarged to the next level. The same function is activated by the left mouse button while the
pointer is over the image of a graphics window (pointer = magnifying glass); here the centre
of the enlargement can be determined by the position of the magnifying glass.
Using the instruction "Verkleinern" ("reduce") the graphics window is reduced to the next
level. This function is identical with a double-click of the right mouse button and the pointer =
magnifying glass.
Using the instruction "Y-Bereich" (" area Y") the range of the current graphics window is
changed to the set values.
Selecting the function "Alarmgrenzen" ("alarm borders") alarm borders will be added into the
graphics windows. You will have to enter a minimum and a maximum for the alarm borders.
9.4.3 Window menu
The window menu contains instructions for the arrangement and selection of graphics and
table windows. Using the instruction "Nebeneinander" ("next to each other" the windows are
34
SmartGraph
arranged next to each other or above one another unless they are reduced to a symbol. Using
the instruction "Überlappend" ("overlapping") all the graphics/table windows which aren't
reduced to a symbol are presented in scales. Using the instruction "Symbole anordnen"
("arrange symbols") the graphics/table windows reduced to symbols are arranged at the
bottom of the SmartGraph window. Using the instruction "Fenster Xxx" ("window Xxx" the
selected window becomes the active window. The currently active window is marked in the
menu.
9.4.4 Options menu
Using the instruction "COM-Schnittstelle" ("COM-interface") an interface can be selected
where the measuring instrument is to be connected. Note: If by mistake you have selected the
interface your mouse is connected to, SmartGraph will display the message "Hardware
gesperrt" ("hardware blocked") whenever you try to open the interface.
Using the instruction "Dateiformat" ("file format") you can choose between internal file
format ( for fast reading and saving) and text format (readable for other programs). In the text
format the data is stored separated by tabulator characters line by line, and can immediately be
read in word-editing programs or spreadsheets. Many spreadsheets like for example MSWORKS or MS-EXCEL expect a comma for the decimal point in the German version. This is
why you ought to mark the respective option if you want to read the data in those programs.
9.4.5 Help menu
Under "Ergänzungen zum Handbuch" ("additions to the handbook") you can find the latest
changes and additions which have been added after the printing of this handbook. The
instruction "Inhalt" ("content") starts up the online help and displays the table of help topics.
By pressing "Hilfe benutzen" ("using help") you will get an introduction into the Windows
help system. Pressing "Info" ("information") you will be shown the version number and a note
on the copyright of the current program version.
9.5 Storing the measuring data on the hard disk
SmartGraph creates the subdirectory \data additionally to the SmartGraph program directory
(Unless something else was entered during the installation this directory is called c:\sg_T).
Measuring data can be saved either in the internal format (*.SGR) or in the text format
(*.TXT) (see instruction "Dateiformat" ("file format") in the menu "Optionen" ("options")).
35
Manual Operation
10. Operating the thermometer with external multiplexers
In case two measuring channels are not sufficient, external multiplexers may be used. Such
multiplexers can be fitted with 8 or 16 channels. The maximum number of external
multiplexers mustn't be more than five. Apart from that the log numbers of the various
multiplexers have to be identical. The number of external measuring channels is limited by the
model version. In the basic model up to 21 sensor parameter sets can be stored at the same
time. As a parameter set has to be available for each measuring channel, if the sensors
calibration coefficients deviate from each other, the maximum number of external measuring
channels is set to 20. With an expanded version up to 80 external measuring channels can be
connected. The external multiplexers have to be connected to channel B of the thermometer.
In the display of measuring values and for the settings of the instrument channel B is replaced
by the external measuring channels.
Safety instruction: Only the prescribed cables are to be connected to the instrument!
The operator has to ensure that no inadmissible voltages reach the
instrument.
The instrument recognizes the connected external multiplexers and the full number of
measuring channels automatically after a cold start.
MuxOut
N
9
10
11
12
13
SENSOR MULTIPLEXER
MuxIn
1
2
3
4
5
14
15
16
ATM 4016
6
7
8
Picture 10.1: Frontal view of an external multiplexer
The connection MuxIn is intended for the connection of further external multiplexers. The
connection MuxOut serves as a link between the multiplexer and channel B of the
thermometer or the MuxIn connection of another multiplexer nearer to the thermometer.
36
External Multiplexer
MuxOut
MuxIn
Picture 10.2: Back of an external multiplexer
For the connection of an external multiplexer with the thermometer two connection cables are
required. Apart from the above described connection of the measuring channels a connection
of the supply and of the control wires are necessary. The connection MuxIn is intended for the
connection of further external measuring channels. The connection MuxOut serves as a link
between the multiplexer and the connection EXT at the back of the instrument or the
connection MuxIn of another multiplexer which is closer to the measuring instrument.
37
Errors
11. Errors and their correction
1.
After switching on the display remains dark.
Proceed according to the chapter "First operation of the T 4200". Please contact your
supplier if the fault cannot be corrected.
2.
Faulty measuring values are displayed.
Check whether the parameter sets belonging to the sensors connected are assigned to the
measuring channels (see chapter "Manual Operation").
3.
The text "Battery too low!" appears on the display.
The battery to buffer the thermometer's memory is empty. Have the battery changed by an
expert.
Warning: The following work may be carried out by a trained expert only, as mains
voltage may occur in the instrument.
- Disconnect from the mains by pulling out the plug!
- Open the case of the instrument, by unscrewing the four upper screws in the sides of
the thermometer and lift the upper lid.
- Replace the instrument's battery (see chapter "Specifications")
- After the replacement of the battery the parameter sets have to be re-loaded (see
chapters "Establishing sensor specific parameters" and "Manual operation").
Afterwards the parameter sets and the sensors connected to the measuring channels
have to be co-ordinated again. In addition to that the other settings of the thermometer
have to be checked and adjusted if necessary.
4.
The text "SYSTEM FAILURE" and a number from 1 to 4 appears on the display.
This error cannot be corrected by the user. Please contact your supplier.
5.
The text "All chs are off!" appears on the display.
You have switched off all the measuring channels. You will have to switch on at least one
of the measuring channels (see chapter "Manual operation")
6.
The text "Params error" appears on the display.
The assignment of parameter sets to the measuring channels has been changed. This can
be caused by the connection or disconnection of an external multiplexer. Check whether
the assignment of parameter sets to the measuring channels is still correct (see chapter
"Manual operation").
38
Errors
7.
The texts "Sensordata Error" and "Deleting #" followed by a number appears on the
display.
An error has occurred in the parameter set with the number displayed. The parameter set
has been deleted. If you still need the parameter set, you have to transmit it again from
your PC to the thermometer (see chapter "Establishing sensor specific parameter sets").
Check whether the assignment of parameter sets to measuring channels is correct and
change them if necessary (see chapter "Manual operation")
8.
The text "Invalid Params" appears on the display.
A measuring channel has been assigned a number of a parameter set which doesn't exist.
Correct the mistake (see chapter "Manual operation").
9.
The text "open" appears on the display.
The value of the connected resistance is above the resistance area which can be realized
by the thermometer, or the connection line is open. Check whether the temperature sensor
is connected correctly.
10. The text "short" appears on the display.
The value of the connected resistance is below the resistance area which can be realized
by the thermometer, or the connection line is shorted. Check whether the temperature
sensor is connected correctly.
11. The text "to great" appears on the display.
In case the set unit is ohm:
The resistance value is higher than the maximum. Check whether the correct type of
sensor has been used.
In case the set unit is °C, K or °F:
The measured temperature value is higher than the maximum. Check whether the correct
type of sensor has been used or whether the measuring range has been exceeded caused
by the parameter set. You will find the maximum temperature value in the appropriate
parameter file on your PC (see chapter "Establishing sensor specific parameter sets").
12. The text "to small" appears on the display.
In case the set unit is ohm:
The resistance value is lower than the minimum. Check whether the correct type of sensor
has been used.
In case the set unit is °C, K or °F:
39
Errors
The measured temperature value is lower than the minimum. Check whether the correct
type of sensor has been used or whether the measuring range has been exceeded caused
by the parameter set. You will find the minimum temperature value in the appropriate
parameter file on your PC (see chapter "Establishing sensor specific parameter sets").
13. The text "range err" appears on the display.
This error is caused by the effects of exceeding the measuring range which can for
example occur during differential measurements.
14. The text "interface err" and a number from 1 to 3 appears on the display.
An error has occurred during the communication with your PC. Switch off the instrument
and then switch it on again. Restart the PC program.
15. The text "Mux-Error 1" appears on the display.
The external multiplexer has got an inadmissible version number , or in case more than
one multiplexers are used their log version numbers are not identical. Contact your
supplier.
16. The text "Mux-Error 2" appears on the display.
A too high number of measuring channels has been recognized. Reduce the number of the
external measuring channels or contact your supplier.
17. The text "Mux-Error 3" appears on the display.
A transmitting error has occurred during the communication with the external
multiplexer. Switch the instrument off and on again.
12. Guarantee and repairs
The manufacturer gives a twelve-month guarantee on the thermometer. The guarantee
includes parts and work. The cost of transport and any damage resulting from transport in case
of a repair have to be paid by the sender. The full address of the sender, a commission of
repair and a description of the error have to be enclosed with any instrument sent in for repair
works. The instrument has to be wrapped in such a way that it is protected from damage
during transport. Before carrying out a repair the manufacturer informs the sender about the
estimated cost of repairs and asks the sender to give his consent. Any costs for the return
transportation and for the insurance of the repaired instrument have to be paid by the sender.
The repaired instrument is sent back the cheapest possible way.
40
Notes
Notes:
41
Notes
42