1
Spectrum™ Technology Platform
Version 9.0
Master Data Management Guide
Notices
©
2013 Pitney Bowes Software Inc. All rights reserved. MapInfo and Group 1 Software are trademarks
of Pitney Bowes Software Inc. All other marks and trademarks are property of their respective holders.
®
USPS Notices
®
Pitney Bowes Inc. holds a non-exclusive license to publish and sell ZIP + 4 databases on optical and
magnetic media. The following trademarks are owned by the United States Postal Service: CASS, CASS
Link
Link
Certified, DPV, eLOT, FASTforward, First-Class Mail, Intelligent Mail, LACS , NCOA , PAVE,
Link
PLANET Code, Postal Service, POSTNET, Post Office, RDI, Suite
, United States Postal Service,
Standard Mail, United States Post Office, USPS, ZIP Code, and ZIP + 4. This list is not exhaustive of
the trademarks belonging to the Postal Service.
®
Link®
Pitney Bowes Inc. is a non-exclusive licensee of USPS for NCOA
processing.
Prices for Pitney Bowes Software's products, options, and services are not established, controlled, or
™
approved by USPS® or United States Government. When utilizing RDI data to determine parcel-shipping
®
costs, the business decision on which parcel delivery company to use is not made by the USPS or
United States Government.
Data Provider and Related Notices
Data Products contained on this media and used within Pitney Bowes Software applications are protected
by various trademarks and by one or more of the following copyrights:
©
Copyright United States Postal Service. All rights reserved.
©
2013 TomTom. All rights reserved. TomTom and the TomTom logo are registered trademarks of
TomTom N.V.
©
Copyright NAVTEQ. All rights reserved
Data © 2013 NAVTEQ North America, LLC
Fuente: INEGI (Instituto Nacional de Estadística y Geografía)
Based upon electronic data © National Land Survey Sweden.
©
Copyright United States Census Bureau
©
Copyright Nova Marketing Group, Inc.
Portions of this program are © Copyright 1993-2007 by Nova Marketing Group Inc. All Rights Reserved
©
Copyright Canada Post Corporation
This CD-ROM contains data from a compilation in which Canada Post Corporation is the copyright owner.
©
2007 Claritas, Inc.
The Geocode Address World data set contains data licensed from the GeoNames Project
(www.geonames.org) provided under the Creative Commons Attribution License ("Attribution License")
located at http://creativecommons.org/licenses/by/3.0/legalcode. Your use of the GeoNames data
(described in the Spectrum™ Technology Platform User Manual) is governed by the terms of the Attribution
License, and any conflict between your agreement with Pitney Bowes Software, Inc. and the Attribution
License will be resolved in favor of the Attribution License solely as it relates to your use of the GeoNames
data.
ICU Notices
Copyright © 1995-2011 International Business Machines Corporation and others.
All rights reserved.
Permission is hereby granted, free of charge, to any person obtaining a copy of this software and
associated documentation files (the "Software"), to deal in the Software without restriction, including
without limitation the rights to use, copy, modify, merge, publish, distribute, and/or sell copies of the
Software, and to permit persons to whom the Software is furnished to do so, provided that the above
4
Spectrum™ Technology Platform 9.0
Copyright
copyright notice(s) and this permission notice appear in all copies of the Software and that both the
above copyright notice(s) and this permission notice appear in supporting documentation.
THE SOFTWARE IS PROVIDED "AS IS", WITHOUT WARRANTY OF ANY KIND, EXPRESS OR
IMPLIED, INCLUDING BUT NOT LIMITED TO THE WARRANTIES OF MERCHANTABILITY, FITNESS
FOR A PARTICULAR PURPOSE AND NONINFRINGEMENT OF THIRD PARTY RIGHTS. IN NO
EVENT SHALL THE COPYRIGHT HOLDER OR HOLDERS INCLUDED IN THIS NOTICE BE LIABLE
FOR ANY CLAIM, OR ANY SPECIAL INDIRECT OR CONSEQUENTIAL DAMAGES, OR ANY DAMAGES
WHATSOEVER RESULTING FROM LOSS OF USE, DATA OR PROFITS, WHETHER IN AN ACTION
OF CONTRACT, NEGLIGENCE OR OTHER TORTIOUS ACTION, ARISING OUT OF OR IN
CONNECTION WITH THE USE OR PERFORMANCE OF THIS SOFTWARE.
Except as contained in this notice, the name of a copyright holder shall not be used in advertising or
otherwise to promote the sale, use or other dealings in this Software without prior written authorization
of the copyright holder.
Master Data Management Guide
5
Contents
Chapter 1: Getting Started..................................................................................9
Introduction to Master Data Management.........................................................10
Chapter 2: Persistent Storage..........................................................................11
Creating Models..................................................................................................12
Write to Hub................................................................................................12
Import to Hub..............................................................................................12
Visual Modeling..........................................................................................12
Querying Models.................................................................................................12
Query Hub..................................................................................................13
Read from Hub...........................................................................................13
Updating Models.................................................................................................13
Deleting Models and Model Data.......................................................................13
Chapter 3: Visual Modeling..............................................................................15
Creating and Updating Models with Visual Modeling......................................16
Chapter 4: Data Stewardship...........................................................................17
Data Security.......................................................................................................18
Monitoring Data...................................................................................................19
Splitting and Merging Entities............................................................................19
Editing Entities and Relationships ...................................................................20
Chapter 5: Data Visualization...........................................................................21
Styling Data..........................................................................................................22
Data Layouts........................................................................................................22
Data Charts..........................................................................................................22
Chapter 6: Analytics..........................................................................................25
Centrality Algorithms..........................................................................................26
Job Details...........................................................................................................26
Chapter 7: Data Hub Module............................................................................27
What is the Data Hub Module?...........................................................................28
Data Hub Databases..................................................................................28
Data Hub Components...............................................................................28
Backing Up Data Hub Models....................................................................28
Write to Hub.........................................................................................................29
Input............................................................................................................30
The Entities Tab..........................................................................................30
The Relationships Tab................................................................................31
The Options Tab.........................................................................................31
Sample Write to Hub Dataflow...................................................................32
Import to Hub.......................................................................................................40
Input ...........................................................................................................41
Options.......................................................................................................43
Output ........................................................................................................44
Read From Hub....................................................................................................45
The Query Tab............................................................................................45
The Fields Tab............................................................................................48
Output.........................................................................................................48
Query Hub............................................................................................................49
The Query Tab............................................................................................49
The Fields Tab............................................................................................52
Input/Output Requirements........................................................................53
Relationship Analysis Client..............................................................................53
Accessing the Relationship Analysis Client................................................54
The Relationship Analysis Client Canvas...................................................54
Creating Models.........................................................................................57
Managing Models.......................................................................................59
Viewing Models..........................................................................................66
Changing the Appearance of Model Data..................................................79
Analyzing Model Data.................................................................................94
8
Spectrum™ Technology Platform 9.0
Getting Started
In this section:
• Introduction to Master Data Management . . . . . . . . . . . .10
1
Introduction to Master Data Management
Introduction to Master Data Management
The Master Data Management Data Hub Module identifies and measures relationships between people,
groups of people, or almost any other type of entity. It can use your data to identify hidden, latent, or
non-obvious connections among people, groups, and organizations. It can also identify shifting patterns
of connectedness, distance, centrality, influence status, and importance. With this information, you can
predict customer influence and impact and categorize entities as leaders, followers, influencers, outliers,
or late adopters. You can also predict churn and offer more personalized customer service by anticipating
customer needs and optimizing offerings. You can even use it to detect and prevent fraud, crime, and
terrorism.
10
Spectrum™ Technology Platform 9.0
Persistent Storage
The Master Data Management Data Hub Module supports the practice of persistent
storage—or Create, Read, Update, Delete (CRUD). It is a complex tool that
provides multiple methods of achieving the same goal, depending on your data
and how you want to build and use your models.
In this section:
•
•
•
•
Creating Models . . . . . . . . . . . . . . . . . . . . . . . . . . . . . . . . .12
Querying Models . . . . . . . . . . . . . . . . . . . . . . . . . . . . . . . . .12
Updating Models . . . . . . . . . . . . . . . . . . . . . . . . . . . . . . . . .13
Deleting Models and Model Data . . . . . . . . . . . . . . . . . . . .13
2
Creating Models
Creating Models
The Data Hub Module provides three methods of creating models:
• Write to Hub
• Import to Hub
• Visual Modeling
Write to Hub
The Write to Hub stage uses your input data to define entities and relationships that can be queried
against in a Read From Hub stage or a Query Hub stage, or it can be visualized in the Relationship
Analysis Client to identify relationships and trends that otherwise may be hard to find.
In addition to defining entities and relationships, you can also define processing options and determine
how you want data to be written to the hub.
Import to Hub
The Import to Hub stage also uses your input data to create a model that can be queried against or
visualized in the Relationship Analysis Client. However, this stage differs from Write to Hub in that it
requires two incoming channels of data: one for entities and one for relationships. You do not need to
manually define those elements as you do with Write to Hub.
Visual Modeling
Another way to create models is to perform visual modeling in the Relationship Analysis Client by manually
adding entities and relationships from the Toolbox. You first need to establish types of entities and at
least one type of relationship, but after that you could either use the same types of entities and
relationships to populate your model, or you could create additional types of entities and relationships.
Within the visual modeling method in the Relationship Analysis Client, another way you can create and
populate your model is by using metadata. First you add information types, in the form of entities. From
there you can add relationships between those entities and completely populate the model from within
the Relationship Analysis Client, manually adding properties for the entities and relationships, or you
can instead populate it by mapping input fields to entities and defining relationships from within the Write
to Hub stage.
Models created from either method of visual modeling can be queried against just like models that are
created in Write to Hub or Import to Hub.
Querying Models
The Master Data Management Data Hub Module provides multiple methods of creating models. You
can use the Write to Hub stage or the Import to Hub stage to create a model from entities and
relationships defined from incoming data.
Another method is to create models in the Relationship Analysis Client Toolbox by manually adding
entities and relationships. You can completely populate the model from within the Relationship Analysis
Client, or you can create the structure of the model in the Relationship Analysis Client and then populate
12
Spectrum™ Technology Platform 9.0
Chapter 2: Persistent Storage
it from within the Write to Hub stage. You can also use the Toolbox to add properties associated with
entities and relationships in an existing model.
Query Hub
The Master Data Management Data Hub Module provides multiple methods of creating models. You
can use the Write to Hub stage or the Import to Hub stage to create a model from entities and
relationships defined from incoming data.
Another method is to create models in the Relationship Analysis Client Toolbox by manually adding
entities and relationships. You can completely populate the model from within the Relationship Analysis
Client, or you can create the structure of the model in the Relationship Analysis Client and then populate
it from within the Write to Hub stage. You can also use the Toolbox to add properties associated with
entities and relationships in an existing model.
Read from Hub
The Master Data Management Data Hub Module provides multiple methods of creating models. You
can use the Write to Hub stage or the Import to Hub stage to create a model from entities and
relationships defined from incoming data.
Another method is to create models in the Relationship Analysis Client Toolbox by manually adding
entities and relationships. You can completely populate the model from within the Relationship Analysis
Client, or you can create the structure of the model in the Relationship Analysis Client and then populate
it from within the Write to Hub stage. You can also use the Toolbox to add properties associated with
entities and relationships in an existing model.
Updating Models
Once a model has been created, you can update it by regenerating it from Write to Hub or Import to Hub.
Alternatively, you can use the Toolbox in the Relationship Analysis Client to manually add entities and
relationships to a model. You can also use the Relationship Analysis Client to add, delete, or modify
properties that are associated with a model's entities and relationships.
Deleting Models and Model Data
The Data Hub Module includes tools that enable you to delete data from a model or delete models
themselves. To delete data from a model, you can remove that data from your input file(s) and regenerate
the model. Another approach would be to manually delete entities and relationships from within the
Relationship Analysis Client. You can select individual or multiple elements from your model and simply
click Delete.
Deleting models themselves is a simple task also completed within the Model Management tool in the
Relationship Analysis Client.
Master Data Management Guide
13
Visual Modeling
Visual modeling is a method of manually creating or updating models in the
Relationship Analysis Client.
In this section:
• Creating and Updating Models with Visual Modeling . . .16
3
Creating and Updating Models with Visual Modeling
Creating and Updating Models with Visual Modeling
The Master Data Management Data Hub Module provides multiple methods of creating models. One
way is to use the Write to Hub stage or the Import to Hub stage to create a model from entities and
relationships that have been defined from incoming data.
Another way to create models is to perform visual modeling in the Relationship Analysis Client by manually
adding entities and relationships from the Toolbox. To start, you likely would need to establish at least
two types of entities and at least one type of relationship, but after that you could either use the same
types of entities and relationships to populate your model, or you could create additional types of entities
and relationships. For instance, if you were creating a model of insurance data that was comprised of
patient information, you might need an entity type of "Patient" for patient names and an entity type of
"Claim" for the illness or injury that instigated the claim. However, if your insurance model was comprised
of patients and doctors, you would need to add a third entity type of "Doctor". The relationship type
between patients and doctors might be "visited", and the relationship type between patient and claim
might be "claimed" or "reported". Alternatively, you could have a relationship type between "Doctor" and
"Claim" of "diagnosed". Using this data you could build a model that identifies potential fraud data if you
see a doctor repeatedly diagnosing—or a patient repeatedly claiming—a particular injury or illness.
Within the visual modeling method in the Relationship Analysis Client, another way you can create and
populate your model is by using metadata. First you add information types, in the form of entities. From
there you can add relationships between those entities and completely populate the model from within
the Relationship Analysis Client, manually adding properties for the entities and relationships, or you
can instead populate it by mapping input fields to entities and defining relationships from within the Write
to Hub stage. Using the previous example, let's say you create entity types of "Patient", "Doctor", and
"Claim" in the Relationship Analysis Client and then save your model with the name "Insurance Data".
Then, you could go into Enterprise Designer and create a dataflow that has a Read from File stage going
into a Write to Hub stage. You could configure the Read from File stage to view an input file of insurance
data that includes the following fields (among others): "TIN", "SSN", and "Dx". In the Write to Hub stage,
you would select "Insurance Data" in the "Model" field and then define entities by mapping input field
"TIN" to type "Doctor", "SSN" to type "Patient", and "Dx" to type "Claim". After creating these entities,
you would then define relationships between them. You could have "Patient visited Doctor" or "Doctor
treated Claim" or "Patient reported Claim". After defining all the entities and relationships, you would run
the job in Enterprise Designer, then go back to the Relationship Analysis Client, and you would see the
"Insurance Data" model populated with the information that was in your input file, showing the relationships
between the entities you just defined.
In addition to using the Relationship Analysis Client Toolbox to visually create models, you can also use
the Toolbox to add entities and relationships to an existing model. If you were looking at your "Insurance
Data" model, you could create additional relationships between entities, or you could create new entities
and add them to your model, linking them to other entities with existing or new relationships.
As you conduct visual modeling by creating a model or adding elements to your model, the Overview
pane, the Model Details pane, the Model Components pane, and the Selection pane update accordingly,
reflecting the properties in your model. This dynamic persistence enables you to use the tools of the
Relationship Anlaysis Client in real time as you update your model.
16
Spectrum™ Technology Platform 9.0
Data Stewardship
There are several ways in which the Master Data Management Data Hub Module
provides for data stewardship. You can apply role-based security measures,
designate who can execute algorithms, monitor your data for specific changes
and automatically take action when certain conditions are met, and edit the
components of your model.
In this section:
•
•
•
•
Data Security . . . . . . . . . . . . . . . . . . . . . . . . . . . . . . . . . . . .18
Monitoring Data . . . . . . . . . . . . . . . . . . . . . . . . . . . . . . . . . .19
Splitting and Merging Entities . . . . . . . . . . . . . . . . . . . . . .19
Editing Entities and Relationships . . . . . . . . . . . . . . . . . .20
4
Data Security
Data Security
Spectrum™ Technology Platform uses a role-based security model to control access to the system.
Within roles that are predefined or new roles that you may create in Management Console, you can
grant or deny a user permission for accessing various parts of the Data Hub Module. For example, you
may allow one role to have the ability to access model data and another role to have the ability to access
model metadata. You may allow one role to access monitors, and yet another role to access themes
within the Relationship Analysis Client. Likewise, you can specify who can execute algorithms, also
within the Relationship Analysis Client. Once you have established your roles, you can determine what
entity types are granted to each role.
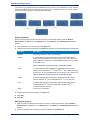
An entity type is a category of items to which you want to grant or deny access. The following entity
types control access to parts of the Data Hub Module.
Algorithms
Controls the ability to execute algorithms in the Relationship Analysis Client.
Model Admin
Controls the ability for users to perform the following actions using Data Hub stages
and the Relationship Analysis Client:
•
•
•
•
Read model data: entities, relationships, and their properties
Create models and model data: entities, relationships, and their properties
Modify model data: entities, relationships, and their properties
Delete models and model data: entities, relationships, and their properties
For example, if you had a model comprised of insurance data, you might have doctors
and patients as entities, with relationships such as "visited" or "filed a claim for," and
properties that depict the dates for those visits or claims. Using this example, the
Model Admin entity type would allow you to grant permissions for the following actions:
• Read data for doctors and patients and their visit or claim properties
• Create doctor and patient entities, link them together with visit or claim relationships,
and include any properties such as addresses, claim IDs, dates, and so on.
• Modify doctor and patient entities, their relationships, and their properties such as
addresses, claim IDs, dates, and so on.
• Delete doctors and patients from the model
Model
Metadata
Controls the ability for users to perform the following actions using Data Hub stages
and the Relationship Analysis Client:
•
•
•
•
Read entity types and relationship types
Create entity types, relationship types, and their properties
Modify entity type properties and relationship type properties
Delete entities and relationships
Note: This permission includes clearing a model in the Write to Hub stage.
Monitor Admin Controls the ability to create monitors in the Relationship Analysis Client that detect
changes to a model's entities or relationships.
Theme Admin Controls the ability to define themes for models in the Relationship Analysis Client.
If you create new roles within Management Console, you can also create security entity overrides for
those roles. For example, if you categorically denied a particular role access to monitors, you could
create a security entity override and grant access to monitors tied to a specific dataflow. Alternatively,
you could specify secured entity overrides for a particular user, which override the permissions granted
to the user by the user's roles. Note that you cannot apply overrides to predefined roles and users.
18
Spectrum™ Technology Platform 9.0
Chapter 4: Data Stewardship
For more information on managing security with Spectrum™ Technology Platform, please see the
Administration Guide.
Monitoring Data
The Relationship Analysis Client can monitor your models for data changes that meet certain conditions.
When those conditions have been met, you can designate that an email is sent or a service is run. This
kind of automated scrutiny enables you to keep an eye on your data without requiring the time or expense
of manual observation. You can simply have an email notification be sent to you or someone else, or
you can tell Spectrum™ Technology Platform to run a service of its own or a custom service that you
have created.
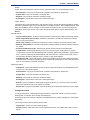
You can set monitors for entities or relationships. Conditions for entity monitors are based on entity
properties, which are evaluated against literals, or absolute values. For example, you could set a condition
on a property called "Nationality" and have a service run when an entity's nationality is "Swedish".
Conditions for relationship monitors are based on relationship properties as well as properties for the
source and target entities attached to those relationships. As with entity monitors, these properties can
be evaluated against literals, but they can also be evaluated against the properties themselves. For
example, you could set a condition to look for when a relationship property is equal to that same property
on the source or target entity. Likewise, you could set a condition to look for when a source entity's
property is equal to that same property on a target entity.
To implement monitoring, you need to assign a name to your monitor, set the conditions under which
you want to take action, and set up either an email notification or a service activation.
Note: Before creating an Email Action monitor, you must first set up Notifications in Management
Console.
Click here for more information on monitoring data.
Splitting and Merging Entities
Another way Master Data Management helps you control your data is by providing the flexibility of splitting
and merging entities in the Relationship Analysis Client.
If your model contains an entity that performs multiple functions within that model, you could split that
entity into two entities: one entity for one function, and a second entity for the other function. One way
this feature might be useful is in an organizational chart. Most entities are employees of someone in an
organizational chart, but some of those employees are also managers. If you needed to maintain the
integrity and structure of an organizational chart containing someone who fulfills both roles, you could
simply split that one entity into two separate entities. One entity would fall into the employee role, while
the other would fall into the manager role. In addition to splitting one entity into two, you can also determine
which properties and relationships are tied to each specific entity—all, some, or none. Or, you can tie
properties and relationships to both entities; they don't have to be tied to one or the other.
If your model contains two entities that represent the same subject, you could merge them and their
respective data together into one entity. Let's say that your organizational chart shows one entity
performing accounts receivable and another entity performing accounts payable. Then, the person
performing accounts payable resigns, and due to budget constraints you are not able to replace her.
Instead, the person conducting accounts receivable will absorb her duties. In this case, you could merge
those two entities together, keeping some of the properties of the accounts receivable employee (her
name, possibly her title) and adding some of the properties of the accounts payable employee (her
primary responsibilities, or possibly her manager).
The benefit is that you can tweak your data to account for changes without having to recreate your model.
Master Data Management Guide
19
Editing Entities and Relationships
For more information, see Splitting Entities and Merging Entities.
Editing Entities and Relationships
The Relationship Analysis Client is a flexible tool that enables you to manually add or delete entities or
relationships from models. This can be useful if you don't want to recreate the model but have data in
the form of an entity that you would like to add, or if your model contains entities or relationships that
are no longer valid.
You can also add, edit, or delete properties and modify values for properties that are associated with
entities and relationships. An example of this functionality might be that if your model uses data that is
looking to identify potential insurance fraud and one of the entity properties for a provider is his legal
status for practicing medicine. Because there are ongong investigations of this individual, you might
need to change the value of his "Legal Status" property to "prosecuted."
The pliability of real-time model editing saves you time and money by not having to alter your input data
and recreate the model.
See Editing Models for more information on editing entities and relationships.
20
Spectrum™ Technology Platform 9.0
Data Visualization
The Relationship Analysis Client provides an abundance of ways in which you
can change the appearance of your model and its data.
In this section:
• Styling Data . . . . . . . . . . . . . . . . . . . . . . . . . . . . . . . . . . . . .22
• Data Layouts . . . . . . . . . . . . . . . . . . . . . . . . . . . . . . . . . . . .22
• Data Charts . . . . . . . . . . . . . . . . . . . . . . . . . . . . . . . . . . . . .22
5
Styling Data
Styling Data
There are various features within the Relationship Analysis Client that enable you to draw attention to
the information in your model that you find most important. You can determine the size, shape, and color
of your model's entities, including selecting from a library of stock images that depict people, places,
transportation, finance, and more. For relationships you can specify line width, color, and point decoration
for both ends. You also can designate label settings for both entities and relationships.
The Gradient feature is a tool that enables you to visually change the style of a model using actual values
in the data. You can represent model elements and highlight important elements based on their values
by starting at one setting for the lowest value and another setting for the highest value. For instance, if
your model uses insurance claim data and one of the entity properties is the number of claims filed by
a provider, you could set pale yellow as the color for the entity with the lowest number of claims and
orange as the color for the entity with the highest number of claims, and the entities for everything in
between those two dates would fall somewhere between.
The Themes feature applies styles and filters to elements in your model based on conditions you set.
You can pre-determine aesthetic values for entities and relationships that meet the criteria set in your
conditions. When parts of your model meet the criteria set, the theme will be applied and you will be able
to visually identify those elements. You can even use filters to automatically hide from your model the
elements that meet the set criteria.
Click here for more information on styling the data in your model.
Data Layouts
The Layouts feature within the Relationship Analysis Client enables you to change the appearance of
model elements to show the entities and relationships visually. Certain data renders better in a particular
model layout. The Relationship Analysis Client offers five layouts for your models. There are also options
respective to each layout and options that are common to all layouts.
•
•
•
•
Circular Layout—Emphasizes group and tree structures within a network.
Hierarchic Layout—Highlights the main direction or flow within a directed model.
Organic Layout—Based on the force-directed layout paradigm.
Orthogonal Layout—Is a multi-purpose layout provider for undirected models; produces compact
drawings with no overlaps, few crossings, and few bends.
• Map Layout—Depicts locations of entities within your model using latitude and longitude.
For more information on these layouts and common options for layouts, see Using Layouts.
Data Charts
The Charts feature of Relationship Analysis Client enables you to visualize data from a model in graphic
format. You can select from four options the one that will best depict your data:
• Data bar—Presents numeric data from a model in bar chart format. Therefore, only properties with
numeric formats are eligible for use with data bar charts. Data bar charts display each entry for the
selected criteria from highest to lowest value. This represents the order of influence within the model,
from most influential to least influential.
• Treemap—Presents data in a heirarchical manner, resulting in several individual squares and rectangles
that together form a whole. The size and color of each rectangle reflects its value and influence within
22
Spectrum™ Technology Platform 9.0
Chapter 5: Data Visualization
the model, and when you hover over any given block the data upon which you created the map will
appear.
• Heat map—Presents data in table form using colors. A simple example of this is might be crime rate
data over the years by month. Each row represents one of the twelve months, and each column
represents a year in the time frame. Colors could range from very pale blue (lower crime rates) to dark
blue (higher crime rates). You could use more than one spectrum of color, especially if you wanted
your heat map to be more specific.
• Timeline—Presents data across a span of time. It can be used for entities, relationships, or both. You
can plot events, actions, and so on over a course of time, and once the timeline is created you can
zoom in or out to focus on more or fewer items.
For more information, see Using Charts.
Master Data Management Guide
23
Analytics
The Master Data Management Data Hub Module includes valuable tools to help
you analyze your data.
In this section:
• Centrality Algorithms . . . . . . . . . . . . . . . . . . . . . . . . . . . . .26
• Job Details . . . . . . . . . . . . . . . . . . . . . . . . . . . . . . . . . . . . . .26
6
Centrality Algorithms
Centrality Algorithms
Centrality algorithms measure the importance and significance, also known as the centrality, of individual
entities and relationships in a model. When you use algorithms you can determine leaders vs. followers,
influencers vs. outliers, and so on.
The Relationship Analysis Client provides four kinds of centrality measures to apply to your model:
• Betweenness—Used to identify entities that control the information flow between different parts of
the network.
• Closeness—Used to identify entities that may have best access to other parts of the network and
visibility of activities within the rest of the network.
• Degree—Used to identify entities that have the most direct links to others.
• Influence—Used to identify entities that have strong influence in the network due to their direct links
to other highly active or well-connected entities.
There are three types of directions an algorithm can be run:
• Incoming—The results will be based on relationships coming into the entity.
• Outgoing—The results will be based on relationships going out of the entity.
• Both—The results will be based on incoming and outgoing relationships.
There are additional measures that can take place with centrality algorithms. For instance, you can
select, roughly, how precise the results should be. A lower precision will return more accurate results,
but the algorithm will run more slowly. With the Closeness algorithm, you can select how the results
should be returned. You can also designate that the relationship property should be used as weight or
that low values should be considered more significant, such as if you were using data that ranks entities,
and #1 was the best possible ranking.
Click here for more information on centrality algorithms.
Job Details
The Model Management feature in the Relationship Analysis Client provides important statistics regarding
jobs that you have run when applying algorithms to your model. This information includes the following:
•
•
•
•
•
•
•
Job ID
Model name
Algorithm used
Status of the job
Start time
End time
Any messages that may have been returned when the job was run
Larger models can take a long time to run; the Status column indicates if a job is still running.
26
Spectrum™ Technology Platform 9.0
Data Hub Module
In this section:
•
•
•
•
•
•
What is the Data Hub Module? . . . . . . . . . . . . . . . . . . . . .28
Write to Hub . . . . . . . . . . . . . . . . . . . . . . . . . . . . . . . . . . . . .29
Import to Hub . . . . . . . . . . . . . . . . . . . . . . . . . . . . . . . . . . .40
Read From Hub . . . . . . . . . . . . . . . . . . . . . . . . . . . . . . . . . .45
Query Hub . . . . . . . . . . . . . . . . . . . . . . . . . . . . . . . . . . . . . .49
Relationship Analysis Client . . . . . . . . . . . . . . . . . . . . . . .53
7
What is the Data Hub Module?
What is the Data Hub Module?
The Data Hub Module provides a persistent repository to help you manage and understand your most
critical data assets. It supports Master Data Management and Business Intelligence initiatives. The Data
Hub Module is built on top of a graph database that allows companies to rapidly capture and evolve data
models based on real-world complex relationships that may span processes, interactions, hierarchies,
roles and domains, and extract actionable insight to drive business outcomes.
Data Hub Databases
The Data Hub Module uses graph databases, which have many differences from relational databases.
• Tables/hierarchical data vs. no schema
• Quick and easy traversal of links
• Having the model identifying relationships for you vs. knowing relationships up front
Data Hub Components
The Data Hub Module consists of the following five components:
• Write to Hub—A sink stage that allows you to intuitively create a model using input data to define
entities, relationships, and properties. Upon execution Write to Hub loads the data into the hub.
• Import to Hub—A stage that uses two incoming channels of data, one for entities and one for
relationships, to define a new model or populate an existing model. Includes an optional outgoing error
port that collects records not successfully processed by the dataflow.
• Read From Hub—A source stage that uses a saved or new query to read the data inside an existing
model. It then returns that data as fields in your dataflow's output stage and makes it available for use
with other stages or processes.
• Query Hub—An intermediate stage that uses incoming data rows to define queries that extract specific
entities and relationships from a model. For example, Query Hub can be used as part of a service to
understand a customer's influence score within the network or determine if a customer record already
exists in the hub.
• Relationship Analysis Client—A web browser tool that provides a visual interface for viewing
relationships and hierarchies within the hub, discovering hidden or non-obvious relationships, creating
what-if scenarios, performing temporal or geospatial analysis, creating rules-driven event triggers,
running centrality algorithms to determine influence score either against the entire network or against
the data being visualized within the client.
Backing Up Data Hub Models
After you have created a model, you can back it up for use if the original model becomes corrupt or is
somehow deleted from your server. After first enabling the use of model backups, you can use the JMX
Console to configure the backup.
Before you can perform hot backups, an administrator must enable the use of model backups by assigning
a unique port to each model. The selection of these ports can be done automatically or manually.
Automatic Assignments
1. Specify a starting base port number in the <Spectrum™ Technology Platforminstall
path>/server/modules/hub/db/neo4j.properties file. Ports will increment sequentially
starting at this base port plus 1 and will be assigned to models as they are created or accessed.
2. Uncomment and set the online.backup.base.port property.
28
Spectrum™ Technology Platform 9.0
Chapter 7: Data Hub Module
Manual Assignments
1. Copy the neo4j.properties file from <Spectrum™ Technology Platforminstall
path>/server/modules/hub/db/neo4j.properties to <Spectrum™ Technology
Platforminstall path>/server/modules/hub/db/model.<model
name>/neo4j.properties.
2. Edit this model-specific properties file by uncommenting and modifying the online.backup.port
property to be the port number to use for this model's online backup.
Performing Backups
After you have enabled the use of model backups, you can use the JMX Console to perform the backup
of specific models.
1. Open a web browser and go to http://<server>:<port>/jmx-console
Where: <server> is the IP address or hostname of your Spectrum™ Technology Platform server and
<port> is the HTTP port used by Spectrum™ Technology Platform. The default is 8080.
2. Enter the user name and password for a Spectrum™ Technology Platform account with administrator
rights. The default is "admin" for both the user name and the password.
3. Click the link for dcg.manager:service=HubEngine.
4. Set the name parameter of the backupGraph Operation to the name of the model you want to back
up.
5. Click true or false to indicate whether you want to perform a full backup.
Note: You must initially create a full backup and can then create incremental backups.
6. Enter the path and model name in the backupPath parameter. To create a full backup, this folder
must be empty. To create an incremental backup, this folder must first contain a full backup.
Note: The model name must begin with "model." For example, if the model you are backing up is
called "customers", you might enter "C:\ModelBackups\model.customers" in this field.
7. Click Invoke.
Write to Hub
The Write to Hub stage can be used to link data together, resulting in a complex network of relationships
called a hub, which can be displayed in a model. Once that model is created, it can be queried against
in a Read From Hub stage or a Query Hub stage, or it can be visualized in the Relationship Analysis
Client to identify relationships and trends that otherwise may be hard to find.
To configure a Write to Hub stage, you need to complete the Entities tab and the Relationships tab. You
can also use the Options tab to set processing preferences and determine how you want data to be
written to the hub.
Warning: Data Hub models must be stored in a local directory. If you installed your Spectrum™
Technology Platform on a network file system, you must redirect the models path to a local
directory. The setting for this path can be found in <Spectrum
Location>\server\modules\hub\hub.properties, line hub.models.path.base.
Click here for examples of configuring a Write to Hub dataflow from start to finish using a flat file and an
XML file.
Master Data Management Guide
29
Write to Hub
Input
The Write to Hub stage requires that your dataflow contain an input stage with defined field(s) that you
can use to create a model.
The Entities Tab
The Entities tab allows you to configure how entities are created and updated. These entities can represent
objects or events and will be stored in your model. You can use the Relationships tab to link them to
other entities and create relationships. To create entities for your model, you will need to complete the
following information:
1.
2.
3.
4.
Enter the name of your model in the Model field.
Click Add... to create a new entity. The Add Entity dialog box will appear.
Select the field name to be used to generate the Entity ID in the Input field field.
If you want the entity to have a name other than what is automatically provided, change the contents
of the Type field to the desired name.
5. On the Properties tab, select the fields you want to use to associate data with an entity (similar to
attributes in a table) by clicking the Include box for that field. Spectrum supports both simple and
complex data types; you can use fields deep within the hierarchical structure of your input file as an
entity. If you are using hierarchical data, you will also see a Filter control that allows you to filter out
data on the Property list based on the path of the field. Likewise, you will see a control that allows
you to hide non-primitive fields.
6. Change the name of the field in the Name column if you want to use a name other than the provided
field name.
7. Click the Updates tab. After an entity is created it can be updated over time when data with the same
ID is input into the Write to Hub stage. Select how you want Write to Hub to manage updates:
• Always update properties—Properties are always updated with the most recent information. This
includes updating with null or empty strings.
• Update properties unless all input is null—Properties are always updated unless all input fields
associated with the selected properties are null.
• Never overwrite properties with empty data—Properties are always updated unless the input
is a null or empty string.
• Never overwrite non-empty properties—Properties are never updated once populated with
non-empty data.
8. Repeat steps 4 through 7 to add additional entities. When you are done adding entities, click Close.
9. Select which fields you want to be indexed in your model by clicking the Indexes... button and
checking the box for those fields. Selecting which fields to index, rather than indexing all fields in
your model, results in faster performance when writing to a model. However, if you later attempt to
query fields in your model that were not indexed, the response time will be slower. For example, the
Specify starting entity option in the query tool for the Relationship Analysis Client works only on
indexed properties. You can query non-indexed properties using conditions, but the performance will
be slower.
In the Type column, you can choose whether the data should be indexed exactly as-is, with case
sensitivity, or if it should be indexed without case sensitivity, which typically results in greater response
to a search.
Note: The _stp_id, _stp_type, and _stp_label properties are internal properties and will always
appear in the list of indexed fields. You can deselect _stp_type and _stp_label, but _stp_id
must be indexed; however, you are able to designate whether its index type should be exact
or with case insensitivity.
30
Spectrum™ Technology Platform 9.0
Chapter 7: Data Hub Module
The Relationships Tab
The Relationships tab allows you to configure how relationships are created between source and target
entities. These relationships represent the connection between two entities (e.g., John knows Mary). To
create relationships for your model, you will need to complete the following information:
1. Click Add...
2. Select the entity to act as a source for your relationship in the Source field.
3. Click the appropriate label type for your relationship: string or field. If string, enter the string in the
text box underneath. If field, select the field you want to use to generate the label for this relationship
in the drop-down box.
4. If you want to allow a relationship to be created more than once between a source and target entity,
click the Allow more than one relationship based on unique ID box and select the field on which
to base the relationship in the drop-down box.
5. Select the entity to act as a target for your relationship in the Target field.
6. On the Properties tab, select the fields you want to use to associate data with an relationship by
clicking the Include box for that field.
7. On the Conditions tab, you can specify conditions that control when an relationship is created
between a source and target entity. Click Add to a add a new condition. The Add Condition dialog
box appears.
8. If you are creating the first condition, the Logical operator field will be grayed out. If you are creating
a subsequent condition, specify whether this condition should be used in conjunction with previous
conditions or if it should be used instead of previous conditions.
9. Select the element on which the condition will be based in the Data source field.
10. Select the field that the condition will be based in the Field name field.
11. Select the operator for the condition in the Operator field.
12. Enter the value for the condition in the Value field and click Add.
13. Repeat steps 7 through 12 to add additional conditions. When you are done adding conditions, click
Close.
14. Click the Updates tab.
15. Select the appropriate action for updating and overwriting properties. After an relationship is created
it can be updated over time when data with the same source and target ID is input into the Write to
Graph stage. Select how you want Write to Graph to manage updates:
• Always update properties—Properties are always updated with the most recent information. This
includes updating with null or empty strings.
• Update properties unless all input is null—Properties are always updated unless all input fields
associated with the selected properties are null.
• Never overwrite properties with empty data—Properties are always updated unless the input
is a null or empty string.
• Never overwrite non-empty properties—Properties are never updated once populated with
non-empty data.
16. Click Add....
17. Repeat steps 1 through 16 to add additional relationships. When you are done adding relationships,
click Close.
The Options Tab
The Options tab allows you to control processing options.
1. Click Initial load if you are loading the model for the first time. The model will be locked and unable
to be written to by other Write to Hub stages. When this mode is checked, the only available option
on the Updates tab in the Add Entity dialog box will be Never overwrite non-empty properties.
Therefore, if you have multiple input files in your dataflow, they can all create properties, but none
Master Data Management Guide
31
Write to Hub
of them can update existing properties with new values. This mode provides better performance
when initially loading a model. Existing data, if there is any, will be cleared prior to writing.
2. Click Concurrent writes if you want to allow the model to be written to by multiple Write to Hub
stages at the same time. When this mode is checked, the Clear model before processing option
is disabled and the model is created prior to running the job. If the model does not already exist, it
will be created when the stage is closed.
3. Click Exclusive lock (default) if you do not want to allow the model to be written to by multiple Write
to Hub stages. When this mode is checked, properties can be updated after they are created.
4. Check Clear model before processing if you wish to remove all existing entities and relationships
before processing new data. If this is not selected, new information will be used to update any existing
entities and relationships.
Note: Using this option does not alter security settings for the Data Hub module. The model will be
recreated, but the security settings will not remain the same.
5. Check Remove orphaned entities after processing if you wish to remove entities that have no
relationships.
6. Click OK.
Sample Write to Hub Dataflow
This section describes how to configure a simple dataflow that includes a Write to Hub stage. The first
example uses a flat file for input, and the second example uses an XML file for input; both files include
names of employees and their managers, along with other information described in more detail in the
following sections. The end result is the same for both dataflows: a model that depicts the reporting
structure of a small organization.
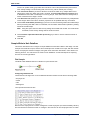
Flat Sample
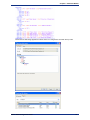
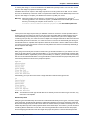
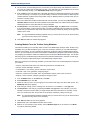
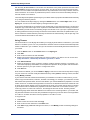
The Write to Hub dataflow that uses a flat file for input looks like this:
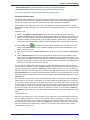
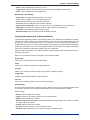
Configuring Read from File
The Read from File stage uses a comma-delimited file that includes records with the following fields:
•
•
•
•
Employee ID
Name
Title
Manager ID
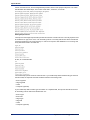
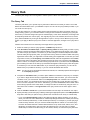
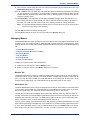
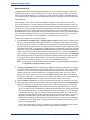
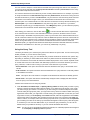
The input file itself looks like this:
Notice that two employees do not have manager IDs. These employees (Tom Smith and Mary Hansen)
are both directors and therefore have no manager in this exercise. All other employees have a number
32
Spectrum™ Technology Platform 9.0
Chapter 7: Data Hub Module
in the ManagerID field that refers to the employee who is their manager. For example, Paula Sheen's
record has "1" in the ManagerID field, indicating that Tom Smith is her manager.
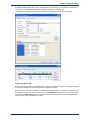
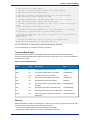
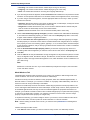
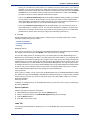
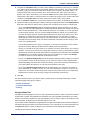
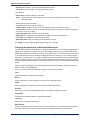
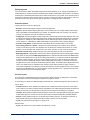
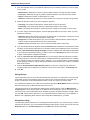
The Read from File stage appears as follows when it is configured to work with this input file:
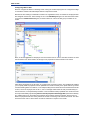
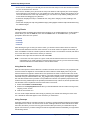
Configuring Write to Hub
Next we configure the Write to Hub stage. After naming the model "Employees" we configure the stage
to include the entities and relationships that will comprise the model.
Because we are creating a model that is similar to an organization chart, our entities are employees who
are assigned numeric IDs. The first thing we do on the Add Entity dialog box is click the browse button
to access the Field Schema dialog box, and then select "EmployeeId" from the list of available fields.
This is the first group of entities in our model.
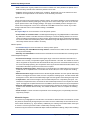
Master Data Management Guide
33
Write to Hub
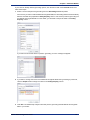
Next, we set the Type field to "Employee" and check the boxes for "name" and "title" because we want
the information from those fields to be brought in as properties for the EmployeeID entities in the model.
After setting properties for the Employee entity, we configure the processing options. The Updates tab
enables you to specify whether properties can be updated in the model once they are in place and if
they should overwrite existing data. For instance, in our example, Mary Hansen would be encountered
twice because on record 4, she is referred to as an employee, but on record 3, she is referred to as a
manager. When Write to Hub processes Mary for the second time, it could potentially overwrite or remove
data that was populated as a result of the first time it processed Mary. By selecting Never overwrite
properties with empty data (which is the default), any updates that occur will create new properties
and overwrite existing properties, but they will not blank out properties that were set by the first encounter
but missing in the second encounter. This also ensures that the order in which these records are read
has no impact on the model.
If we selected Always update properties, data would always be overwritten and only the last set of
property data would be reflected in the model. If we selected Update properties unless all input is
null, data would always be overwritten unless every field in the new record were blank. Finally, if we
selected Never overwrite non-empty properties, the first set of data for any given field would be
retained, unless that field were blank. In that case, the first set of non-blank data would be retained.
We repeat these steps to add "ManagerId" as the second group of entities in our model. Although
ManagerID and EmployeeID are different fields in the input file, both entities' types are set to “Employee.”
If we set ManagerID to a different type, the model would contain two entities for mid-level managers.
For example, Jim Waterman would have an entity as an employee and an entity as a manager. With
34
Spectrum™ Technology Platform 9.0
Chapter 7: Data Hub Module
both entities being set to "Employee" as the type, mid-level managers such as Jim will have just one
entity in the model. That entity will have other entities coming into it (from employees) and another entity
going out of it (to their respective manager). Note that we do not add properties to the ManagerID entities
because the values in those fields (name, title) apply to the employees, not the managers. Also, we
accept the Never overwrite properties with empty data default selection on the Updates tab.
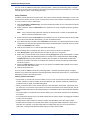
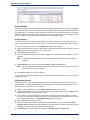
The completed Entities tab for this example appears as follows:
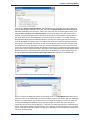
Now we configure the Relationships tab. The first thing we do on the Add Relationship dialog box is
select the source of the relationship from the list of entities created on the Entities tab. The relationship
between our entities reflects the reporting structure (employee to manager); therefore, we select the
"Employee:EmployeeID" entity as the source. Next, we select "String" as name of the relationship, and
we enter the text "Reports to." After that, we select the target of the relationship from the list of the entities
created on the Entities tab; for our example, we select "Employee:ManagerID." If we were using a
"manages" relationship instead of a "reports to" relationship, we would reverse the selections in the
source and target fields.
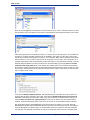
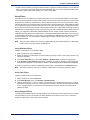
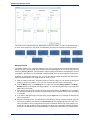
The completed Relationships tab for this example appears as follows:
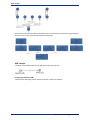
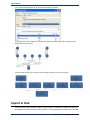
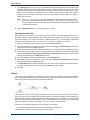
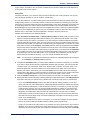
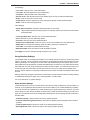
The configuration of this dataflow is complete and results in the following model, as depicted in the
Relationship Analysis Client. This example uses the Hierarchic layout with default settings for entities.
Master Data Management Guide
35
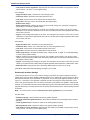
Write to Hub
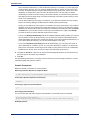
Another way to view this same data is with Panel style, as shown below. The benefit of using Panel style
is that you can see the properties associated with each entity.
XML Sample
The Write to Hub dataflow that uses an XML file for input looks like this:
Configuring Read from XML
The Read from XML stage uses a hierarchical file that contains the following:
36
Spectrum™ Technology Platform 9.0
Chapter 7: Data Hub Module
The Read from XML stage appears as follows when it is configured to work with this input file:
Master Data Management Guide
37
Write to Hub
Configuring Write to Hub
Next we configure the Write to Hub stage. After naming the model "Employees" we configure the stage
to include the entities and relationships that will comprise the model.
Because we are creating a model that is similar to an organization chart, our entities are employees who
are assigned numeric IDs. The first thing we do on the Add Entity dialog box is click the browse button
to access the Field Schema dialog box, and then select "id." This is the first group of entities in our
model.
Next, we set the Type field to "Employee" and check the boxes for "name" and "title" because we want
the information from those fields to be brought in as properties for the ID entities in the model.
After setting properties for the ID entity, we configure the processing options. The Updates tab enables
you to specify whether properties can be updated in the model once they are in place and if they should
overwrite existing data. For instance, in our example, Mary Hansen would be encountered twice because
for ID 2, she is an employee, but for ID 11, she is a manager. When Write to Hub processes Mary for
the second time, it could potentially overwrite or remove data that was populated as a result of the first
time it processed Mary. By selecting Never overwrite properties with empty data (which is the default),
any updates that occur will create new properties and overwrite existing properties, but they will not
blank out properties that were set by the first encounter but missing in the second encounter. This also
ensures that the order in which these records are read has no impact on the model.
38
Spectrum™ Technology Platform 9.0
Chapter 7: Data Hub Module
If we selected Always update properties, data would always be overwritten and only the last set of
property data would be reflected in the model. If we selected Update properties unless all input is
null, data would always be overwritten unless every field in the new record were blank. Finally, if we
selected Never overwrite non-empty properties, the first set of data for any given field would be
retained, unless that field were blank. In that case, the first set of non-blank data would be retained.
We repeat these steps to add "ManagerId" as the second group of entities in our model. Although
ManagerID and EmployeeID are different fields in the input file, both entities' types are set to “Employee.”
If we set ManagerID to a different type, the model would contain two entities for mid-level managers.
For example, Jim Waterman would have an entity as an employee and an entity as a manager. With
both entities being set to "Employee" as the type, mid-level managers such as Jim will have just one
entity in the model. That entity will have other entities coming into it (from employees) and another entity
going out of it (to their respective manager). Note that we do not add properties to the ManagerID entities
because the values in those fields (name, title) apply to the employees, not the managers. Also, we
accept the Never overwrite properties with empty data default selection on the Updates tab.
The completed Entities tab for this example appears as follows:
Now we configure the Relationships tab. The first thing we do on the Add Relationship dialog box is
select the source of the relationship from the list of entities created on the Entities tab. The relationship
between our entities reflects the reporting structure (employee to manager); therefore, we select the
"Employee:Staff/Employee/Staff-id" entity as the source. Next, we select "String" as name of the
relationship, and we enter the text "Reports to." After that, we select the target of the relationship from
the list of the entities created on the Entities tab; for our example, we select "Employee:id." If we were
using a "manages" relationship instead of a "reports to" relationship, we would reverse the selections in
the source and target fields.
Master Data Management Guide
39
Import to Hub
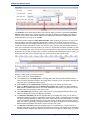
The completed Relationships tab for this example appears as follows:
The configuration of this dataflow is complete and results in the following model, as depicted in the
Relationship Analysis Client:
As with the flat sample, this model can also be viewed in Panel style, as shown below.
Import to Hub
The Import to Hub stage is used to create a complex network of relationships called a hub, which can
be displayed in a model. Once that model is created, it can be queried against in a Read From Hub stage
40
Spectrum™ Technology Platform 9.0
Chapter 7: Data Hub Module
or a Query Hub stage, or it can be visualized in the Relationship Analysis Client. You can also use the
Import to Hub stage to populate an existing model.
A dataflow that uses an Import to Hub stage requires two incoming channels of data: one for entities
and one for relationships. You'll then need to complete the Entities tab and the Relationships tab in the
Import to Hub stage to complete your dataflow and create or update your model.
Warning: Data Hub models must be stored in a local directory. If you installed your Spectrum™
Technology Platform on a network file system, you must redirect the models path to a local
directory. The setting for this path can be found in <Spectrum
Location>\server\modules\hub\hub.properties, line hub.models.path.base.
Input
The Import to Hub stage requires that your dataflow contain two channels: one that provides data for
entities going into the Entity Port (the top port) and one that provides data for relationships going into
the Relationship port (the bottom port). This requirement could be met by two source stages (each
containing one input file), or it could come from multiple source stages that feed into Record Combiners
and ultimately become two streams, or it could come from one source file whose data goes through a
Conditional Router or a Splitter that outputs the data into two streams. It doesn't matter which method
you use as long as the end result is a channel of entity data and a channel of relationship data that go
into the Import to Hub stage.
Entity Data
Data going into the Entity Port needs to include both type and ID information for your entities. You can
have a Type field ("Person") and an ID field ("Bob"), or you can have just an ID field that combines both
type and ID information, separated by a colon ("Person:Bob"). For instance, your file could look something
like the comma-delimited data below. The Type field tells us that the entities are people and places, and
the ID field provides the names of the people and places.
Alternatively, your input file could contain a single field that combines both type and ID:
Note: The fields that contain type and ID data do not actually need to be named "Type" and "ID"; any
field name is acceptable.
Relationship Data
Data going into the Relationship Port needs to include fields that identify source types, source IDs, target
types, target IDs, and labels that identify the relationships between the sources and targets. Note that
all source and target entity information must reference entities that are provided on the Entity Port. Your
relationship data may also include properties about those relationships. For instance, your file could look
something like the data below. In this case, the SourceType field tells us that all sources are people,
and the TargetType field tells us that the targets are people and places. The SourceID field provides
Master Data Management Guide
41
Import to Hub
names of all the sources, and the TargetID field provides names of the people and places. The Label
field identifies the relationships, in this case "works with", "works at", or "lives at".
Sorting Requirements
The Import to Hub stage requires that input data be sorted in a certain manner. The entity input file must
be sorted first on type, then on ID, in an ascending manner. The entity data shown above includes the
necessary fields but is not sorted correctly. In order for an Import to Hub dataflow to run correctly, that
entity data would need to look like this:
Or this, for combined fields:
The relationship input file must be sorted as well. If your relationship data includes both type and ID in
the same field, the input file should be sorted as follows in ascending order:
•
•
•
•
Source type/ID
Target type/ID
Label
Unique ID (optional)
If your relationship data contains type information in a separate field, the input file should be sorted in
an ascending manner with those fields broken out:
•
•
•
•
•
•
42
Source type
Source ID
Target type
Target ID
Label
Unique ID (optional)
Spectrum™ Technology Platform 9.0
Chapter 7: Data Hub Module
As with the entity data, the relationship data shown above includes the necessary fields but is not sorted
correctly. In order for an Import to Hub dataflow to run correctly, that relationship data would need to
look like this:
Or this, for combined fields:
Options
The Entities Tab
The Entities tab enables you to configure the entities that will be included in your model. These entities
represent objects or events, which may have properties associated with them, and these properties can
be stored in your model as well if you choose to include it. Entities are linked to each other via
relationships, which you will establish on the Relationships tab.
1. Enter the name of your model in the Model field.
2. Click the ID drop-down and select the field whose data you want to use to generate the entities for
your model.
3. If the entity's type is contained in its own field, check the Type in separate field box and select the
appropriate field in the Type drop-down.
4. The Internal Index grid includes a list of fields that are generated by the Import to Hub stage. The
_stp_id field is always indexed; the _stp_label and _stp_type fields are optional. These fields can be
indexed with or without case sensitivity.
5. The Field Name grid includes all the fields from your entity input file. Select the fields whose data
you want included in the model by clicking the Include box for those fields.
6. Select which fields you want to be indexed in your model by clicking the Index box for those fields.
Selecting which fields to index, rather than indexing all fields in your model, results in faster
performance when writing to a model. However, if you later attempt to query fields in your model that
were not indexed, the response time will be slower. For example, the Specify starting entity option
in the query tool for the Relationship Analysis Client works only on indexed properties. You can query
non-indexed properties using conditions, but the performance will be slower.
Master Data Management Guide
43
Import to Hub
7. In the Index Type column, you can choose whether the data should be indexed with or without case
sensitivity. Selecting Case Insensitivity typically results in greater response to a search. You cannot
change the Index Type for an existing property unless it has zero counts within the model. In other
words, if your model contains a property but none of the records that make up the model uses that
property, you can change the index type. If the one or mor records uses the property, you cannot
change the index type.
Note: The _stp_id, _stp_type, and _stp_label properties are internal properties and will always
appear in the list of indexed fields. You can deselect _stp_type and _stp_label, but _stp_id
must be indexed; however, you are able to designate whether its index type should be exact
or with case insensitivity.
8. Click the Relationships tab to continue creating your model.
The Relationships Tab
After determining the entities for your model, you need to establish the relationships between source
and target entities on the Relationships tab. These relationships represent the connection between two
entities (for example, John Smith is a customer of ABC Enterprises, Inc.). As with entities, relationships
may also contain properties, which you may or may not choose to include in your model.
1. Select the field that contains the source entity ID in the Source ID field.
2. If the source entity type is contained in its own field, check the Type in separate field box and select
the appropriate field in the Type drop-down.
3. Select the field that contains the relationship between the source and target in the Label drop-down.
4. If you want to allow a relationship to be created more than once between a source and target entity,
click the Allow more than one relationship based on unique ID box and select the field on which
to base the relationship in the Unique ID drop-down.
5. Select the field that contains the target entity ID in the Target ID field.
6. If the target entity type is contained in its own field, check the Type in separate field box and select
the appropriate field in the Type drop-down.
7. The Field Name grid includes all the fields from your entity input file. Select the fields whose data
you want included in the model by clicking the Include box for those fields.
8. Click OK.
Output
The Import to Hub stage has an optional outgoing port to which you can attach a sink stage that collects
any records that the dataflow did not process correctly. This is called the Error Port, and records that
pass through this port into the sink are considered malformed.
Capturing malformed records can help you identify the problem with those records. When you attach a
sink to the Error Port, the resulting output file will contain a superset of the fields from both input files. It
will also contain a Reason field that specifies why the record failed. So, for example, if your entities input
file contains Type, ID, and Location fields, and your relationships input file contains Type, ID, and Label
fields, your output file would contain Reason, Type, ID, Location, and Label fields.
Causes for record failure include, but are not limited to, the following:
• In the relationship configuration, the source entity equals the target entity.
• Relationships reference an entity that has not been defined.
44
Spectrum™ Technology Platform 9.0
Chapter 7: Data Hub Module
• Duplicate entities or relationships exist.
• Input fields are out of order (see Input on page 41.
• Type, ID, or label fields are empty.
Read From Hub
The Read From Hub stage uses a saved query or new query to read data from an existing model, then
returns data as fields in your dataflow's output.
The Query Tab
The Query tab allows you to provide a query that returns data from the model you select. The model
data is returned as data rows in your dataflow's output. You can use the query builder provided, or you
can create a custom query.
You can also select from or modify existing queries that are listed in the Query drop-down. When you
modify existing queries, you must either save the changes and overwrite the existing query (using the
same name) or save the changes and give the modified query a new name. Otherwise, the changes will
be temporarily saved as a custom query. The original query will not be modified, and the new, custom
query will be available only as long as the application is open or until you use a different query for that
model. If you apply a different query to the model or close the application, changes to the query will be
lost.
Follow these instructions to use the Read From Hub stage with the query builder:
1. Select the model you want to query against in the Model drop-down box.
2. Click All entities, All relationships, or Specify starting entities to identify what you want to query
against. The Specify starting entities selection allows you to determine at what point in the model
you want to begin your search. For instance, if you are looking at a model that depicts world-wide
terrorist activity during specific years, you might have country names for entities. Rather than query
against the entire model, you might want to look at activity just in Afghanistan. In this case you could
might select "Country" as the Property, leave Literal selected, and enter "Afghanistan" as the Value;
note that the value in this field is case sensitive and must be exact. You could also click Field and
select "Location," for example, rather than entering a specific value. If you select Field, an Input Data
grid containing the name of the field you just selected will appear under the query name along with
a cell where you can enter the default value. If you reuse this query elsewhere, you can use the
default value you provided in this step, or you can override the default at that time.
Note: You can only query properties that have been indexed; non-indexed properties will not appear
in the Property drop-down.
3. Complete the Conditions field if you want to place additional constraints on the query. For example,
if you want to target terrorist activity in Afghanistan between 2001 and 2010, you would create two
conditions. First, you would select "date" for the Property name, then "Greater Than or Equals",
leave Literal selected, and then enter "2001". You would follow this with a second condition set to
"And" that also uses "date," then "Less Than or Equals", then "2010". Alternatively, you could click
Field and select "Date" rather than entering a specific value. Add, delete, or change the order of
conditions by using the icons on either side of the conditions. Click Ignore Case if the query results
can be either upper or lower cased.
4. Click the Include in results box if you want the results from this step to be included in the output.
5. Specify the steps you want the query to take by selecting the appropriate option in the Add Operations
drop-down. Note that your options vary by whether the root element is an entity or a relationship.
• If you choose Entity to Entity (valid for All entities and Specify starting entities), you can then
refine your search to return data based on relationship label(s) between two entities (Connected),
Master Data Management Guide
45
Read From Hub
before entities (Predecessors), or after entities (Successors). For example, if you are querying a
model of family members, and you choose a Relationship label of "Father," a Connected query
will return all entities that have a Father label between them (in other words, fathers, sons, and
daughters). A Predecessors query will return all entities who are a source entity of a Father
relationship connected to another entity (in other words, fathers). A Successors query will return
all entities who are the target entity of a Father relationship connected to another entity (in other
words, sons and daughters).
You can add Conditions to the query. For example, you could look for fathers as source entities
who live in Texas by adding a condition where the State property equals Texas.
Finally, you can define how many steps out, or Iterations, the query should search. If you select 2
iterations, once the query finds a source entity that matches your query, it will search the entities
attached to the source entity as well as the entities connected to the second entity. Click the Include
in results box if you want the results from this step to be included in the output. Click Dedup if
you want the query to remove duplicate results from the output.
• If you choose Entity to Relationship (valid for All entities and Specify starting entities), your options
are very similar to those for Entity to Entity. You can refine your search to return data based on
relationship label(s) that attach two entities (Connected), occur before entities (Predecessors), or
occur after entities (Successors). You can also add Conditions to the query.
• If you choose Relationship to Entity (valid for All relationships), you can refine your search to
return data based on conditions you set. You can return data when a condition is in place for an
entity that is connected to another entity (Connected), an entity that is a source to a relationship
(Predecessors), and for when an entity is a target of a relationship (Successors).
6. Complete the Fields tab. Click here to read more about designating fields to be returned from the
query and put into the output of your dataflow.
7. Click OK.
Use the following information if you prefer to write a custom query for this stage via Gremlin, a model
traversal language using Groovy classes:
Gremlin Commands
Below are Gremlin commands for common actions.
Returning a Gremlin Pipeline for a Specific Node
g.idx('entities')[['propertyName':propertyValue]]
Converting a Gremlin Pipeline to an ArrayList
toList()
Converting a Type to a Gremlin Pipeline
_()
Accessing Input and Output
You can access input and output using the data variable in your Gremlin script. For example:
def name=data["FirstName"];
data["Variants"]=g.idx('entities')[['Name':name]].both.Name.toList()
Getting Properties
46
Spectrum™ Technology Platform 9.0
Chapter 7: Data Hub Module
Vertexes and relationships can have multiple properties where the key is a string and the value can be
any supported OrientDB types. To set a property use the following method:
void setProperty(String key, Object value)
To get a property use the following method:
Object getProperty(String key)
Sample Script
The following sample represents a complete script:
// Assigns the value of FirstName from an incoming data row to a variable
def name=data["FirstName"]
// Returns a pipeline of all Nodes that have a Name property equal to the
name variable
g.idx('entities')[['Name':name]]
// Returns all adjacent Nodes (Gremlin calls them Vertices)
g.idx('entities')[['Name':name]].both
// Returns a pipeline containing the Names for all adjacent Nodes
g.idx('entities')[['Name':name]].both.Name
// Converts the pipeline containing the Names to a List of Strings
g.idx('entities')[['Name':name]].both.Name.toList()
// Converts the entities pipeline to a list (so it can be used over and
over)
g.idx('entities')[['Name':name]].toList()
// Converts the entities pipeline to a list and assigns to a variable
def entities = g.idx('entities')[['Name':name]].toList()
// Converts the entities list back to a pipeline (so it can be used with
other Gremlin steps)
entities._()
// Assigns the Names List (List of string) to an output field
data["Variants"]=entities._().both.Name.toList()
For more information on using Gremlin model traversal language, click here.
For more information on using Groovy scripting, click here.
Transform-Based Steps
Gremlin comes with a collection of predefined steps, which map to pipes and create pipelines.
Transform-based steps take objects and transform them in some way. The in, out, and both transform
steps are shown below.
Table 1: Transform-Based Steps
Step
Filter?
Description
Pipe
out
yes
out adjacent vertices to the vertex
OutPipe
outE
yes
the outgoing relationships of the vertex
OutEdgesPipe
in
yes
in adjacent vertices to the vertex
InPipe
inE
yes
the incoming relationships of the vertex
InEdgesPipe
both
yes
both adjacent vertices of the vertex
BothPipe
Master Data Management Guide
47
Read From Hub
Step
Filter?
Description
Pipe
bothE
yes
both incoming and outgoing relationships of
the vertex
BothEdgesPipe
outV
yes
the outgoing tail vertex of the relationship
OutVertexPipe()
inV
yes
the incoming head vertex of the relationship
InVertexPipe()
bothV
yes
both incoming and outgoing vertices of the
relationship
BothVerticesPipe()
Filtering
Filter-based steps are used to remove objects, or paths, from a model. The generic filter step is "filter."
However, there are other steps, shown with examples below.
• Numeric Array: outE[10] will emit the 11th relationship in the step.
• Range Array: outE[0..10] will emit the first 11 relationships in the step.
• Map Array: outE[ [weight:1.0]] will emit all relationships with a weight property equal to 1.0.
• Closure: outE{it.label=='knows' | it.weight > 0.5} will emit all relationships with a label equal to ‘knows’
or weight greater than 0.5.
Sample Filter Script
Name=data['Name']
g.idx('entities')[['Name':Name]].outE.filter{it.label=='Roomate'}.inV.toList()
The Fields Tab
The Fields tab allows you to designate fields to be returned and put into the output of your dataflow.
1. Enter your query on the Query tab.
Note: This step should be completed before the Fields tab is completed.
2. Click the Fields tab.
3. If you are building a custom script, select either Entities or Relationship to identify the element you
are querying against. These buttons will be grayed out if you are using the query builder.
4. Specify which fields you want returned in your output. By default, all fields are selected. At minimum,
you need to include the field(s) that contain the data you are looking for.
5. If you want to change the name of the field in your output, enter the new name in the Field name
column.
6. Click OK.
Output
The Read From Hub stage requires that your dataflow contain an output stage that has defined, at
minimum, the field(s) that you are querying against. Otherwise, that data will not appear in your output.
For example, if your Read From Hub stage queries against the _stp_id field in your hub, your output
stage must contain a field that captures that data.
48
Spectrum™ Technology Platform 9.0
Chapter 7: Data Hub Module
Query Hub
The Query Hub stage uses incoming data to extract specific entities and relationships from a model.
The Query Tab
The Query tab allows you to provide a query that returns data from the model you select. The model
data is returned as data rows in your dataflow's output. You can use the query builder provided, or you
can create a custom query.
You can also select from or modify existing queries that are listed in the Query drop-down. When you
modify existing queries, you must either save the changes and overwrite the existing query (using the
same name) or save the changes and give the modified query a new name. Otherwise, the changes will
be temporarily saved as a custom query. The original query will not be modified, and the new, custom
query will be available only as long as the application is open or until you use a different query for that
model. If you apply a different query to the model or close the application, changes to the query will be
lost.
Follow these instructions to use the Query Hub stage with the query builder:
1. Select the model you want to query against in the Model drop-down box.
2. Click All entities, All relationships, or Specify starting entities to identify what you want to query
against. The Specify starting entities selection allows you to determine at what point in the model
you want to begin your search. For instance, if you are looking at a model that depicts world-wide
terrorist activity during specific years, you might have country names for entities. Rather than query
against the entire model, you might want to look at activity just in Afghanistan. In this case you could
might select "Country" as the Property, leave Literal selected, and enter "Afghanistan" as the Value;
note that the value in this field is case sensitive and must be exact. You could also click Field and
select "Location," for example, rather than entering a specific value. If you select Field, an Input Data
grid containing the name of the field you just selected will appear under the query name along with
a cell where you can enter the default value. If you reuse this query elsewhere, you can use the
default value you provided in this step, or you can override the default at that time.
Note: You can only query properties that have been indexed; non-indexed properties will not appear
in the Property drop-down.
3. Complete the Conditions field if you want to place additional constraints on the query. For example,
if you want to target terrorist activity in Afghanistan between 2001 and 2010, you would create two
conditions. First, you would select "date" for the Property name, then "Greater Than or Equals",
then enter "2001". You would follow this with a second condition set to "And" that also uses "date,"
then "Less Than or Equals", then "2010". Alternatively, you could click Field and select "Date" rather
than entering a specific value. Add, delete, or change the order of conditions by using the icons on
either side of the conditions. Click Ignore Case if the query results can be either upper or lower
cased.
4. Click the Include in results box if you want the results from this step to be included in the output.
5. Specify the steps you want the query to take by selecting the appropriate option in the Add Operations
drop-down. Note that your options vary by whether the root element is an entity or a relationship.
• If you choose Entity to Entity (valid for All entities and Specify starting entities), you can then
refine your search to return data based on relationship label(s) between two entities (Connected),
before entities (Predecessors), or after entities (Successors). For example, if you are querying a
model of family members, and you choose a Relationship label of "Father," a Connected query
will return all entities that have a Father label between them (in other words, fathers, sons, and
daughters). A Predecessors query will return all entities who are a source entity of a Father
relationship connected to another entity (in other words, fathers). A Successors query will return
Master Data Management Guide
49
Query Hub
all entities who are the target entity of a Father relationship connected to another entity (in other
words, sons and daughters).
You can add Conditions to the query. For example, you could look for fathers as source entities
who live in Texas by adding a condition where the State property equals Texas.
Finally, you can define how many steps out, or Iterations, the query should search. If you select 2
iterations, once the query finds a source entity that matches your query, it will search the entities
attached to the source entity as well as the entities connected to the second entity. Click the Include
in results box if you want the results from this step to be included in the output. Click Dedup if
you want the query to remove duplicate results from the output.
• If you choose Entity to Relationship (valid for All entities and Specify starting entities), your options
are very similar to those for Entity to Entity. You can refine your search to return data based on
relationship label(s) that attach two entities (Connected), occur before entities (Predecessors), or
occur after entities (Successors). You can also add Conditions to the query.
• If you choose Relationship to Entity (valid for All relationships), you can refine your search to
return data based on conditions you set. You can return data when a condition is in place for an
entity that is connected to another entity (Connected), an entity that is a source to a relationship
(Predecessors), and for when an entity is a target of a relationship (Successors).
6. Complete the Fields tab. Click here to read more about designating fields to be returned from the
query and put into the output of your dataflow.
Note: This step can be completed before or after the Query tab is complete.
7. Click OK.
Use the following information if you prefer to write a custom query for this stage via Gremlin, a model
traversal language using Groovy classes:
Gremlin Commands
Below are Gremlin commands for common actions.
Returning a Gremlin Pipeline for a Specific Node
g.idx('entities')[['propertyName':propertyValue]]
Converting a Gremlin Pipeline to an ArrayList
toList()
Converting a Type to a Gremlin Pipeline
_()
Accessing Input and Output
You can access input and output using the data variable in your Gremlin script. For example:
def name=data["FirstName"];
data["Variants"]=g.idx('entities')[['Name':name]].both.Name.toList()
Sample Script
The following sample represents a complete script:
// Assigns the value of FirstName from an incoming data row to a variable
def name=data["FirstName"]
// Returns a pipeline of all Nodes that have a Name property equal to the
name variable
50
Spectrum™ Technology Platform 9.0
Chapter 7: Data Hub Module
g.idx('entities')[['Name':name]]
// Returns all adjacent Nodes (Gremlin calls them Vertices)
g.idx('entities')[['Name':name]].both
// Returns a pipeline containing the Names for all adjacent Nodes
g.idx('entities')[['Name':name]].both.Name
// Converts the pipeline containing the Names to a List of Strings
g.idx('entities')[['Name':name]].both.Name.toList()
// Converts the entities pipeline to a list (so it can be used over and
over)
g.idx('entities')[['Name':name]].toList()
// Converts the entities pipeline to a list and assigns to a variable
def entities = g.idx('entities')[['Name':name]].toList()
// Converts the entities list back to a pipeline (so it can be used with
other Gremlin steps)
entities._()
// Assigns the Names List (List of string) to an output field
data["Variants"]=entities._().both.Name.toList()
For more information on using Gremlin model traversal language, click here.
For more information on using Groovy scripting, click here.
Transform-Based Steps
Gremlin comes with a collection of predefined steps, which map to pipes and create pipelines.
Transform-based steps take objects and transform them in some way. The in, out, and both transform
steps are shown below.
Table 2: Transform-Based Steps
Step
Filter?
Description
Pipe
out
yes
out adjacent vertices to the vertex
OutPipe
outE
yes
the outgoing relationships of the vertex
OutEdgesPipe
in
yes
in adjacent vertices to the vertex
InPipe
inE
yes
the incoming relationships of the vertex
InEdgesPipe
both
yes
both adjacent vertices of the vertex
BothPipe
bothE
yes
both incoming and outgoing relationships of
the vertex
BothEdgesPipe
outV
yes
the outgoing tail vertex of the relationship
OutVertexPipe()
inV
yes
the incoming head vertex of the relationship
InVertexPipe()
bothV
yes
both incoming and outgoing vertices of the
relationship
BothVerticesPipe()
Filtering
Filter-based steps are used to remove objects, or paths, from a model. The generic filter step is "filter."
However, there are other steps, shown with examples below.
• Numeric Array: outE[10] will emit the 11th relationship in the step.
• Range Array: outE[0..10] will emit the first 11 relationships in the step.
Master Data Management Guide
51
Query Hub
• Map Array: outE[ [weight:1.0]] will emit all relationships with a weight property equal to 1.0.
• Closure: outE{it.label=='knows' | it.weight > 0.5} will emit all relationships with a label equal to ‘knows’
or weight greater than 0.5.
Sample Filter Script
Name=data['Name']
g.idx('entities')[['Name':Name]].outE.filter{it.label=='Roommate'}.inV.toList()
The Fields Tab
The Fields tab allows you to designate fields to be returned and put into the output of your dataflow. If
you are building a custom script, you may add, modify, or remove fields. If you are using the query builder
the fields are populated for you, but you can change the name and properties of the entities and
relationships that were auto-populated.
1. Create your query on the Query tab.
Note: This step can be completed before or after the Fields tab is complete.
2. Click the Fields tab.
3. Click Add to open the Add Input Field dialog box.
4. Use the Fields drop-down and the Add button to select the fields you want to query in the model.
The fields available for selection depend on the fields assigned in the dataflow's input stage. Spectrum
supports both simple and complex data types; you can use fields deep within the hierarchical structure
of your input file in your query.
5. Click Close when you're done adding input fields.
6. Click Add to open the Add Output Field dialog box.
7. Select the type of output field you want to add from the Type drop-down box. The following data
types are supported:
Data Type
Description
boolean
A logical type with two values: true and false.
double
A numeric data type that contains both negative and positive double
-1074
-52
1023
precision numbers between 2
and (2-2 )×2
. In E notation, the
range of values is 4.9E-324 to 1.7976931348623157E308. For information
on E notation, see:
http://en.wikipedia.org/wiki/Scientific_notation#E_notation
relationships
The links between entities; the factor they share with other entities. If you
choose this type of output field, you can change field names and determine
which relationships to include upon output. You will need to include in your
Gremlin script a command to retrieve a list of relationships and assign
them to that data type, as shown in this example:
data["Variants"]=g.idx('entities')[['Name':name]].bothE
Note: If you create an output field this way, Query Graph will
auto-populate the schema for you.
float
A numeric data type that contains both negative and positive single
-149
23
127
precision numbers between 2
and (2-2 )×2 . In E notation, the range
of values is 1.4E-45 to 3.4028235E38. For information on E notation, see:
http://en.wikipedia.org/wiki/Scientific_notation#E_notation
52
Spectrum™ Technology Platform 9.0
Chapter 7: Data Hub Module
Data Type
Description
integer
A numeric data type that contains both negative and positive whole
31
31
numbers between -2 (-2,147,483,648) and 2 -1 (2,147,483,647).
long
A numeric data type that contains both negative and positive whole
63
63
numbers between -2 (-9,223,372,036,854,775,808) and 2 -1
(9,223,372,036,854,775,807)
entities
The individual entities that have the relationships you are identifying. If
you choose this type of output field, you can change field names and
determine which entities to include upon output. You will need to include
in your Gremlin script a command to retrieve a list of entities (a.k.a. vertices)
and assign them to that data type, as shown in this example:
data["Variants"]=g.idx('entities')[['Name':name]].both
Note: If you create an output field this way, Query Graph will
auto-populate the schema for you.
string
A sequence of characters.
You can also add a new, user-defined, custom data type if necessary. Among other types of data,
a new type can be a list of any defined data type (though for string, double, integer, long, float, or
Boolean types you would select that type from the drop-down options and click the List check box).
You can also select an output field based on entities and relationships in your model. If you create
an output field this way, Query Graph will auto-populate the schema for you. Additionally, you would
need to retrieve the entities and/or relationships from Gremlin and then iterate over them, creating
a loop. This would result in you building up the fields' child rows and assigning data as you go.
8.
9.
10.
11.
Specify a name for the output field you want to add in the Name field.
Click the List check box if you created a custom data type in the form of a list.
When you are done adding output fields, click Close.
Click OK.
Input/Output Requirements
The Query Graph stage requires that the input stage of your dataflow has defined the input fields that
are accessed using data (“input”). Also, any input fields or output fields accessed using the data command
need to be defined in the Fields tab in the input and output stages. Otherwise, they will not appear as
input and output fields in other stages in your dataflow.
Relationship Analysis Client
The Relationship Analysis Client component of the Data Hub Module is used to view data in a graphical
manner that identifies and depicts structure and relationships between entities. You can view and
manipulate models that were created in the Write to Hub stage, or you can create new models in the
Relationship Analysis Client itself. You can also use the tool to manipulate entities and relationships
based on their properties and values.
• Click here for an overview of the Relationship Analysis Client canvas.
• Click here to read about managing models, including:
• An overview of data for each model
Master Data Management Guide
53
Relationship Analysis Client
• Information on adding centrality measures to a model as well as a list of details that are provided
on the Jobs tab after you apply those measures
• Information on defining monitors to watch for data changes that meet certain conditions
• Click here to read about all the ways you can view and manipulate the contents of a model, including:
•
•
•
•
The functions of the Model Detail and Query tabs in the Open Model window
The buttons on the Canvas Options ribbon
Using the Selection and Query tools
Using filters
• Click here to read about how to change the appearance of elements in a model, including:
•
•
•
•
•
Viewing a model in multiple ways simultaneously
Determining the appearance of entities and relationships
Configuring gradient settings to visually depict a range of values
Applying Panel Style to a model's entities and show property data
Configuring and applying themes to models, which potentially saves you time if you have multiple
models that you want to look the same
• Applying layouts that change the visual structure of models based on what you want to emphasize
(for example, group structure, heirarchy, locations, and so on)
• Click here to read about how to analyze data in a model, including:
• Using the Discovery feature to load specific information based on conditions that you set, then add
back in elements that were excluded in the original load.
• Running centrality algorithms on models
• Using groups to reveal latent relationships
• Adding and deleting entities and relationships as well as the properties tied to those elements.
Accessing the Relationship Analysis Client
To access the Relationship Analysis Client:
1. Be sure the Spectrum™ Technology Platform server is running.
2. Open a web browser and go to: http://<servername>:<port>/hub/. For example, if your
server is named "myserver" and it uses default HTTP port 8080, you would go to:
http://myserver:8080/hub/.
3. When the login screen appears, enter the same user name and password that was used to launch
Enterprise Designer when you created the model. Press OK.
4. Click the Open button on the Home tab and select a model from the list. Press OK.
You can now use all of the features within the Relationship Analysis Client.
The Relationship Analysis Client Canvas
The initial Relationship Analysis Client canvas consists of the following elements:
Canvas Buttons
The following buttons are always present on the Relationship Analysis Client canvas:
Icon
Description
Enables you to undo your last action. You can set the number of changes to undo in the
Default Options dialog box. Default is 5.
54
Spectrum™ Technology Platform 9.0
Chapter 7: Data Hub Module
Icon
Description
Enables you to redo the last action that was undone. You can set the number of actions to
redo in the Default Options dialog box. Default is 5.
Enables you to set default options.
Opens the Event Log. Debug mode provides additional details for what is taking place within
the system.
Allows you to do two things:
• Move the button bar below the ribbon
• Minimize or de-minimize the ribbon
Canvas Menus
The following menus are available on the Relationship Analysis Client canvas.
Note: Press Ctrl-Q-Tab to activate hot keys for menu items.
Menu Item
Description
Home
Provides options for managing models, viewing canvas contents, and selecting
model elements.
View
Provides the ability to activate tools and options for filtering by selection and filtering
by type.
Data
Provides options for manipulating and analyzing a model.
Styling
Enables you to configure style settings for entities and relationships.
Layouts
Enables you to select from multiple layouts and set options for those layouts.
Overview Pane
The Overview Pane allows you to determine the part of the model on which the primary pane should
focus. It provides a complete view of the model with a shaded rectangular area representing the current
view port, which represents a subset of the model. Click your cursor near the area of the model where
you want to focus and see the model move in the primary pane. Click the center of your model to have
the focus on the entire model. .
Model Details Pane
The Model Details Pane shows analysis details about your model. It will show information for the following
characteristics:
•
•
•
•
Name—The name of the model whose data you are viewing.
Entities—Number of entities
Relationships—Number of relationships
Is Acyclic—Formed by a collection of entities and directed relationships, each relationship connecting
one entity to another, such that there is no way to start at some entity v and follow a sequence of
relationships that eventually loops back to v again.
• Is Biconnected—Connected and inseparable, such that if any entity were to be removed, the model
would remain connected.
• Is Bipartite—Entities can be divided into two disjoint sets U and V such that every relationship connects
an entity in U to one in V; that is, U and V are independent sets. Equivalently, a bipartite model is a
model that does not contain any odd-length cycles.
Master Data Management Guide
55
Relationship Analysis Client
• Is Connected—A path exists from one entity in the model to any other entity in the model.
• Is Cyclic—Consists of a single cycle, or in other words, some number of entities connected in a closed
chain.
• Is Forest—An undirected model, all of whose connected components are trees; in other words, the
model consists of a disjointed union of trees. Equivalently, a forest is an undirected cycle-free model.
• Is Multiple Relationship Free—Is free of two or more relationships that are incident to the same two
entities.
• Is Planar—Can be drawn in such a way that no relationships are intersecting.
• Is Rooted Tree—One entity has been designated the root, in which case the relationships have a
natural orientation, towards or away from the root.
• Is Strongly Connected—A path exists from each entity in the model to every other entity. In particular,
this means paths in each direction; a path from a to b and also a path from b to a.
• Is Tree—An undirected model in which any two entities are connected by exactly one simple path.
Primary Pane
The Primary Pane displays the part of the model you chose to focus on in the Overview Pane. You can
manually select entities, relationships, and labels in this pane, or you can use the Selection Pane to
identify qualifying properties in your data and have the appropriate model elements selected by the
Selection tool. If you double-click an element in the model, it will automatically zoom in to and center
that element. To zoom in on multiple selected elements, press Ctrl and double-click anywhere in the
pane.
Model Components Pane
The Model Components Pane displays model data in grid format. Entity data and relationship data are
shown on two tabs. However, the Entities grid also includes data for predecessors and successors to
each entity. You can determine which are predecessors and which are successors by the direction the
green arrow is pointing.
Let's say you are looking at a model with insurance data, attempting to identify potential fraud. You might
have entities representing individuals who sought treatment connected to entities representing doctors
or clinics those individuals visited. In the Entities tab of the Model Components pane, if you clicked the
plus sign next to an entity to expand the data, you would probably see the doctors and/or clinics that
person visited. And if you clicked the plus sign next to one of the doctor or clinic entities, you would see
all of the metadata associated with that entity.
In the Relationships grid you will see data grouped by the relationships between entities. Using the
insurance fraud example, you might see in the first column of that grid "visited" to represent that the
person visited a doctor or clinic.
Selection Pane
The Selection Pane allows you to use the Selection Tool to identify qualifying properties in your data
and select model elements (also known as items) that contain those properties. It also shows the properties
and relationships for selected elements. If multiple elements are selected, it will show the properties and
relationships for the element that was selected last. For more information, see Using the Selection
Pane.
Query Pane
The Query Pane allows you to use the Query Tool to perform a query. For more information on using
the Query Tool, see Using the Query Tool on page 70.
56
Spectrum™ Technology Platform 9.0
Chapter 7: Data Hub Module
Creating Models
This feature enables you to create models from within the Relationship Analysis Client by manually
adding entities and relationships from the Toolbox. It also allows you to add properties associated with
those entities and relationships.
As you add elements to your model, the Overview pane, the Model Details pane, the Model Components
pane, and the Selection pane update accordingly, reflecting the properties in your model.
Warning: Data Hub models must be stored in a local directory. If you installed your Spectrum™
Technology Platform on a network file system, you must redirect the models path to a local
directory. The setting for this path can be found in <Spectrum
Location>\server\modules\hub\hub.properties, line hub.models.path.base.
Adding Entities to a New Model From the Toolbox
This feature allows you to add entities to a new model you are creating using the Relationship Analysis
Client Toolbox.
1. From the Model ribbon on the Home tab, click New.
2. Select Model, then click OK.
3. From the Entities tab in the Toolbox, drag the New icon onto the model canvas. The Add Entity
dialog box appears.
Note: If this is not the first entity you are adding to the model, you may have multiple entity icons
to choose from in the Toolbox.
4. Enter a Label for the new entity. This label is the name of the entity you are creating, such as
"BobSmith" or "AlliedInsurance".
5. Enter the Type. This is the type of entity you are creating, such as "Person" or "FirmName".
Note: If this is not the first entity you are adding to the model, you can pick from an existing type
or enter a new type.
6. Add Properties to the entity by completing the Name, Type, and Value fields. For example, if you
were building a model of insurance data, you might include ZIP Code information for providers. In
that case, you would enter "ZIP" as the name of the property, followed by "String" as the type, and
"78232" as the value.
Note: The Type field will automatically populate when you enter a name, but you can select another
type from the drop-down box if necessary.
7. Click Add, then OK. The new entity appears.
8. Repeat steps 3-7 to add your remaining entities.
9. Click Save and enter the name of your new model in the Save As dialog box.
Adding Relationships to a New Model From the Toolbox
This feature allows you to add relationships between entities in a new model you are creating using the
Relationship Analysis Client Toolbox.
1. With a new model open and two or more entities on the canvas, click the Relationships tab in the
Toolbox. The <New> icon will be selected by default.
Note: If this is not the first relationship you are adding to the model, you may have multiple
relationship icons to choose from in the Toolbox.
Master Data Management Guide
57
Relationship Analysis Client
2. On the canvas, click and drag from the source entity to the target entity and release the mouse. If
you chose an existing type of relationship in Step 1, the relationship is now established. If you chose
a new relationship in Step 1, the Add Relationship dialog box appears.
3. Enter a Label for the new relationship. This label describes the relationship between the two entities
you are connecting. For example, if you were building a model of insurance data, the label might be
"Visited" (between a patient entity and provider entity) or "Billed" (between a provider entity and an
insurance company entity).
4. If the two entities have multiple relationships with the same label, you must check Use unique
identifier value and enter a value that is specific to this relationship. Two entities cannot have multiple
relationships with the same label without a unique identifier.
5. Add Properties to the relationship by completing the Name, Type, and Value fields. For example,
if you were building a model of insurance data, you might include ZIP Code information for providers.
In that case, you would enter "ZIP" as the name of the property, followed by "String" as the type, and
"78232" as the value.
Note: The Type field will automatically populate when you enter a name, but you can select another
type from the drop-down box if necessary.
6. Click Add, then OK. The relationship appears.
Creating Models From the Toolbox Using Metadata
This feature enables you to manually create a model in the Relationship Analysis Client Toolbox using
metadata. First you add information types, in the form of entities, and then you can add relationships
between those entities. You can completely populate the model from within the Relationship Analysis
Client, or you can create the structure of the model in the Relationship Analysis Client and then populate
it by mapping input fields to entities and relationships from within the Write to Hub stage. You can also
add entity types in the Relationship Analysis Client but add the relationships in the Write to Hub stage;
you are not required to add relationships in the Relationship Analysis Client.
When you create a new model using metadata, you can select icons from several categories to represent
your entities:
•
•
•
•
•
•
People—male and female icons from all kinds of professions and walks of life
Places—houses, buildings, churches
Transportation—cars, trucks, planes, helicopters, boats, bikes
Financial—cash, coins, gold bars, shopping images
Abstract—various forms of media, tools, success/failure images, pawns, stars, and more
Shapes—circles, squares, triangles, pentagons, hexagons, stars
1. From the Model ribbon on the Home tab, click New.
2. Select Metadata, then click OK.
3. Select an entity icon from one of the groups in the Toolbox and drag it onto the model canvas. The
Add Entity dialog box appears.
4. Enter the type of entity you are creating, such as "Person" or "FirmName", in the Type field.
5. Add Properties to the entity by completing the Name and Type fields. For example, if you were
building a model of insurance data, you might include ZIP Code information for providers. In that
case, you would enter "ZIP" as the name of the property, followed by "String" as the type.
Note: The Type field will automatically populate when you enter a name, but you can select another
type from the drop-down box if necessary.
6. Click Add, then OK. The new entity appears.
7. Repeat steps 3-6 to add additional entities to the model.
8. With two or more entities on the canvas, click the Relationships tab in the Toolbox. The <New>
icon will be selected by default.
58
Spectrum™ Technology Platform 9.0
Chapter 7: Data Hub Module
9. On the canvas, click and drag from the source entity to the target entity and release the mouse. The
Add Relationship dialog box appears.
10. Enter a Label for the new relationship. This label describes the relationship between the two entities
you are connecting. For example, if you were building a model of insurance data, the label might be
"Visited" (between a patient entity and provider entity) or "Billed" (between a provider entity and an
insurance company entity).
11. Add Properties to the relationship by completing the Name and Type fields. For example, if you
were building a model of insurance data, you might include ZIP Code information for providers. In
that case, you would enter "ZIP" as the name of the property, followed by "String" as the type.
Note: The Type field will automatically populate when you enter a name, but you can select another
type from the drop-down box if necessary.
12. Click Add, then OK. The relationship appears.
13. Click Save and enter the name of your new model in the Save As dialog box.
Managing Models
The Model Management feature provides an overview of data for each model without opening that model.
It enables you to view model information, add and update centrality measures using algorithms, define
monitors, and remove models. It also provides detailed information for the jobs run in the Model Algorithms
tab.
•
•
•
•
•
•
Viewing Model Information
Applying Centrality Measures to a Model
Monitoring Models
Querying Models
Removing Models
Viewing Job Information
Follow these steps to access model management:
1. With the Home tab selected, click the Manage button.
2. Select a model from the list in the Models dialog box by clicking it.
Models Tab
The Models tab shows the number of entities and relationships for each model. If you click anywhere in
a particular model's row (for example, in the Name, Entities, or Relationships columns), that model will
open. If you click the column header, the model data will sort in ascending order for that column. If you
click the column header twice, the model data will sort in descending order for that column.
Model Detail Tab
The Model Detail tab shows the number of entities and the number of relationships for a selected model.
If you click the column header, the model data will sort in ascending order for that column. If you click
the column header twice, the model data will sort in descending order for that column.
This tab also provides model metadata in grid format. Entity data and relationship data are shown on
two tabs. The Entities grid includes data for predecessors and successors to each entity as well as the
properties associated with each entity. The Relationships grid includes the types of relationships that
exist in the model and the properties associated with each relationship.
Let's say you are looking at a model with insurance data, attempting to identify potential fraud. You might
have entities representing individuals who sought treatment connected to entities representing doctors
or clinics those individuals visited. In the From Relationships section of the Entities tab, if you clicked
the plus sign next to an entity to expand his or her data, you might see "Person" in the From column,
Master Data Management Guide
59
Relationship Analysis Client
"Visited" in the Type column, and "Doctor" in the To column, followed by the number of times someone
visited a doctor.
In the Relationships grid you will see data grouped by the relationships between entities. Using the
insurance fraud example, you might see "Visited" in that grid, and if you clicked the plus sign next to that
relationship to expand its data, you would probably see "Claimant" in the "From" column, "Visited" in the
"Type" column, "Provider" in the "To" column, followed by the number of instances of that relationship
in the model in the "Count" column.
The Entities Tab
The Entities tab includes a list of each entity in your model along with the number of times that entity
occurs in the model.
If you click the plus sign next to an entity, the information described below will appear for that entity. If
you click the plus sign next to "All," the information described below will appear for all entities.
• The From Relationships tab shows information for relationships in your model where the entity type
you have selected is in a "from," or source, position. In this tab, the From column will always be the
entity whose data you are viewing. Information is then organized by Type, which depicts the relationship
between the From and To entities. In the example above the type represents the relationship between
two persons. The To column includes entity types that are in the "to," or target, position in the
relationship. In the example above, we are looking at Person entities coming into other Person entities.
This tab also provides the Count for each relationship type, indicating how many occurrences there
are of that relationship type for the entity whose data you are viewing. In our example, there are six
incidents of persons who provided money to another person and two incidents of a person being a
father to another person.
• The To Relationships tab shows information for relationships in your model where the entity type you
have selected is in the "to," or target, position. The From column includes entity types that are in the
"from," or source, position in the relationship. As with the previous tab, information is then organized
by Type. In this tab, the To column will always be the entity whose data you are viewing. The Count
column is the same as described for the previous tab.
• The Properties tab shows information for all the properties associated with the entity whose data you
are viewing. This tab also shows the Type of each property as well as the Count, which represents
60
Spectrum™ Technology Platform 9.0
Chapter 7: Data Hub Module
the number of occurrences there are of each property for the entity whose data you are viewing. Any
given entity may not include every single property listed, but at least one entity will contain each property
listed.
The Relationships Tab
The Relationships tab includes a list of each entity in your model along with the number of times that
entity occurs in the model.
If you click the plus sign next to a relationship, the information described below will appear for that
relationship. If you click the plus sign next to "All," the information described below will appear for all
relationships.
• The Relationships tab shows information for the selected relationship in your model. In this tab, the
From column represents the source entity of the relationship. Information is then organized by Type,
which depicts the relationship between the From and To entities. In the example above the type
represents the relationship between two persons. The To column includes entity types that are in the
"to," or receiving, position in the relationship. In the example above, we are looking at Person entities
coming into Event and Place entities. This tab also provides the Count for each relationship, indicating
how many occurrences there are of that relationship type for the entity whose data you are viewing.
In our example, there are 19 incidents of persons who an event and 37 incidents of a person attending
a place.
• The Properties tab shows information for all the properties associated with the relationship whose
data you are viewing. This tab also shows the Type of each property as well as the Count, which
represents the number of occurrences there are of each property for the relationship whose data you
are viewing. Any given relationship may not include every single property listed, but at least one
relationship will contain each property listed.
Model Algorithms Tab
The Model Algorithms tab allows you to apply centrality to a model. Centrality is a way of measuring the
importance and significance of individual entities and relationships. When you run centrality algorithms,
the higher the value, the more important the element.
1. Click the Algorithm drop-down to select the kind of centrality measure you want to apply to your
model.
• Betweenness—Used to identify entities that control the information flow between different parts
of the network.
• Closeness—Used to identify entities that may have best access to other parts of the network and
visibility of activities within the rest of the network.
• Degree—Used to identify entities that have the most direct links to others.
• Influence—Used to identify entities that have strong influence in the network due to their direct
links to other highly active or well-connected entities.
2. Select the direction in which you want to apply the algorithm:
Master Data Management Guide
61
Relationship Analysis Client
• Incoming—The results will be based on relationships coming into the entity.
• Outgoing—The results will be based on relationships going out of the entity.
• Both—The results will be based on incoming and outgoing relationships.
3. If you are using an Influence algorithm, slide the Precision scale to determine how precise the results
should be. A lower precision will return more accurate results, but the algorithm will run more slowly.
4. If you are using a Closeness algorithm, click the appropriate button for the way in which you want
results to be returned:
• Standard—Results are based on the number of attachments, or relationships, a entity has as well
as the reverse of the sum of shortest paths to each entity.
• Dangalchev—Results are based not only on the number of entities linked to another entity but
also the number of relationships in each of the linked entities.
• Opsahl—Results are based on the sum of reversed shortest paths to each entity.
5. Click the Use relationship property as weight if you want to measure how unfavorable an relationship
is, and select the relationship property you want to use from the Property drop-down. In this case,
a higher value indicates a negative association.
6. Click the Low values are more significant box if you are using a relationship property as weight
and that property is one where a lower value is considered better than a higher value. For example,
if the property is some sort of ranking system, typically 1, or 1st, is the best value. Another example
is if the property is distance, and you are trying to determine the shortest route: 5 miles is considered
better than 10 miles.
7. Click the Override default output property name if you want the output property name to be
something other than the algorithm you selected. Then enter the new name in the Property field.
8. Click Run.
9. Click the Jobs tab to view job details after running the algorithm. It will provide the job ID, the model
name, the algorithm used, the status of the job, the start time, and the end time. Be aware that the
bigger the model, the longer it takes the algorithm to run; watch the Status column to determine if a
job is still running.
Note:
Results are not stored over time. If you close Relationship Analysis and reopen it, the information
on the Jobs tab is cleared.
Model Monitors Tab
The Relationship Analysis Client tool allows you to monitor your models for data changes that meet
certain conditions. You can set monitors for entities or relationships.
Conditions for entity monitors are based on entity properties, which are evaluated against literals, or
absolute values. For example, you could set a condition on a property called "Nationality" and have a
service run when an entity's nationality is "Canadian".
Conditions for relationship monitors are based on relationship properties as well as properties for the
source and target entities attached to those relationships. As with entity monitors, these properties can
be evaluated against literals, but they can also be evaluated against the properties themselves. For
example, you could set a condition to look for when a relationship property is equal to that same property
on the source or target entity. Likewise, you could set a condition to look for when a source entity's
property is equal to that same property on a target entity.
To implement monitoring, you need to assign a name to your monitor, set the conditions under which
you want to take action, and set up either an email notification or a service activation.
Note: Before creating an Email Action monitor, you must first set up Notifications in Management
Console.
Follow these steps to add a monitor:
1. Click Add and select whether you want to create an entity monitor or a relationship monitor.
62
Spectrum™ Technology Platform 9.0
Chapter 7: Data Hub Module
2. Enter a Name for the monitor you are creating.
3. Click Add Conditions to build the scenario(s) under which you want to take action
a) If you are creating a relationship monitor, select the source type (Property, Source Entity, or
Target Entity).
b) Select the property whose data you are monitoring.
c) Select the operand you are using to create the condition.
d) Enter the value at which an email or service should be activated. Note that if the property you
are monitoring is a date, time, or datetime type, and you have selected "Increased By" or
"Decreased By" as the operand, the value in this field must represent a time span using the
following variables, either alone or combined with a space in between: "y" for years, "w" for weeks,
"d" for days, "h" for hours, "m" for minutes, and "s" for seconds. For example, if you had a date
field with a value of 10/05/13 and you wanted to set a condition to be activated when the date
reached 12/19/13, you would enter "2m 2w". Or, if you had a time field with a value of 3:00:00
PM and you wanted to set a condition to be activated when the time reached 11:00:00 PM, you
would enter "8h". Alternatively, if you had a datetime field with a value of 04/18/12 10:30:00 AM
and you wanted to set a condition to be activated when the date reached 10/28/13 and the time
reached 4:00:00 PM, you would enter "1y 6m 2w 3d 5h 30m".
e) If you do not want the monitor to consider case when evaluating model data, click the Ignore
Case check box.
4. Repeat Step 5 to add more conditions. Note that you can move the conditions up and down in order
of priority by selecting the condition and using the up and down arrows.
5. Under Actions, click Add and select the type of action you want to take.
6. Complete the steps for Email Actions or Service Actions.
Creating Email Actions
1. Enter a valid email address in the To: field.
2. Enter what you would like the subject line of the Email Action to be in the Subject: field. Alternatively,
you can right-click to use the Cut, Copy, and Paste functions or select Insert to select from a list of
tokens.
Note: Pressing $ will also activate the list of tokens.
3. Enter the text you would like to appear in the body of the Email Action. You can manually enter a
message of your choice or use the list of tokens to build a message. Using tokens allows you to
format the email using variables that are replaced with actual values at runtime. As you add tokens,
you will see the code update dynamically in the Message box of the Email Action.
4. Click OK twice. Your email monitor is now created.
Creating Service Actions
1. Select the service you want to activate when the monitor finds the data and conditions you are looking
for. Both Spectrum and custom services are available in the drop-down list. The fields in that service
will appear in the Field Mappings table.
2. Map fields from your model to input fields in the service.
• The Source Type defaults to "Entity Property" or "Relationship Property," depending on whether
the service action is for an entity or a relationship; you can also select "Literal" to tell the monitor
to look for specific text. If the service action is for a relationship, you can also select from "Source
Entity" or "Target Entity" as the source type.
• Select the appropriate property in the Source column drop-down to map it to the field shown in
the Field column. If you selected "Literal" as the Source Type, enter the exact text you want the
monitor to look for.
3. Click Options to override the default options for the service you are activating. You can sort the fields
by Name or Value.
Note: Only exposed options will appear in this table.
4. Click OK twice. Your service monitor is now created.
Master Data Management Guide
63
Relationship Analysis Client
Model Queries Tab
The Model Queries tab in Model Management enables you to create queries that return data from a
selected model. After you create a model query, you can run it by opening the model from the Query
tab on the Open Model dialog box. You can also run a query that was created in Model Management
from the Query pane on the Relationship Analysis Client canvas. It will appear in the Query drop-down.
Creating Queries
When creating a query, you can use the query builder provided, or you can write a custom query.
You can also select from or modify existing queries that are listed in the Query drop-down. When you
modify existing queries, you must either save the changes and overwrite the existing query (using the
same name) or save the changes and give the modified query a new name. Otherwise, the changes will
be temporarily saved as a custom query and will be accessible only from Open Model and not from
Model Management. The original query will not be modified, and the new, custom query will be available
only as long as the application is open or until you use a different query for that model. If you apply a
different query to the model or close the application, changes to the query will be lost.
Follow these instructions to use the query builder:
1. Click All entities, All relationships, or Specify starting entities to identify what you want to query
against. The Specify starting entities selection allows you to determine at what point in the model
you want to begin your search. For instance, if you are looking at a model that depicts world-wide
terrorist activity during specific years, you might have country names for entities. Rather than query
against the entire model, you might want to look at activity just in Afghanistan. In this case you could
might select "Country" as the Property, leave Literal selected, and enter "Afghanistan" as the Value;
note that the value in this field is case sensitive and must be exact. You could also click Field and
select "Location," for example, rather than entering a specific value. If you select Field, an Input Data
grid containing the name of the field you just selected will appear under the query name along with
a cell where you can enter the default value. If you reuse this query elsewhere, you can use the
default value you provided in this step, or you can override the default at that time.
Note: You can only query properties that have been indexed; non-indexed properties will not appear
in the Property or Property name drop-downs.
2. Complete the Conditions field if you want to place additional constraints on the query. For example,
if you want to target terrorist activity in Afghanistan between 2001 and 2010, you would create two
conditions. First, you would select "Date", then "Greater Than or Equals", then enter "2001". You
would follow this with a second condition set to "And" that also uses "date," then "Less Than or
Equals", then "2010". Alternatively, you could click Field and select "Date" rather than entering a
specific value. Add, delete, or change the order of conditions by using the icons on either side of the
conditions. Click Ignore Case if the query results can be either upper or lower cased.
3. Click the Include in results box if you want the results from this step to be included in the output.
4. Specify the steps you want the query to take by selecting the appropriate option in the Add Operations
drop-down. Note that your options vary by whether the root element is an entity or a relationship.
• If you choose Entity to Entity (valid for All entities and Specify starting entities), you can then
refine your search to return data based on relationship label(s) between two entities (Connected),
before entities (Predecessors), or after entities (Successors). For example, if you are querying a
model of family members, and you choose a Relationship label of "Father," a Connected query
will return all entities that have a Father label between them (in other words, fathers, sons, and
daughters). A Predecessors query will return all entities who are a source entity of a Father
relationship connected to another entity (in other words, fathers). A Successors query will return
all entities who are the target entity of a Father relationship connected to another entity (in other
words, sons and daughters).
You can add Conditions to the query. For example, you could look for fathers as source entities
who live in Texas by adding a condition where the State property equals Texas.
64
Spectrum™ Technology Platform 9.0
Chapter 7: Data Hub Module
Finally, you can define how many steps out, or Iterations, the query should search. If you select 2
iterations, once the query finds a source entity that matches your query, it will search the entities
attached to the source entity as well as the entities connected to the second entity. Click the Include
in results box if you want the results from this step to be included in the output. Click Dedup if
you want the query to remove duplicate results from the output.
• If you choose Entity to Relationship (valid for All entities and Specify starting entities), your options
are very similar to those for Entity to Entity. You can refine your search to return data based on
relationship label(s) that attach two entities (Connected), occur before entities (Predecessors), or
occur after entities (Successors). You can also add Conditions to the query.
• If you choose Relationship to Entity (valid for All relationships), you can refine your search to
return data based on conditions you set. You can return data when a condition is in place for an
entity that is connected to another entity (Connected), an entity that is a source to a relationship
(Predecessors), and for when an entity is a target of a relationship (Successors).
5. Click OK.
Use the information below if you prefer to write a manual query for this stage via Gremlin, a model
traversal language using Groovy classes:
• Gremlin Commands
• Transform-Based Steps
• Filtering
Modifying Queries
Once a query is created, you can modify it from the Model Queries tab on the Model Management dialog
box. Simply select the query and click Modify. Then edit your query accordingly.
You can also modify queries on the Query Pane, on the Query tab in the Open Model dialog box, in
Read from Hub, and in Query Hub. When you modify queries from these locations, you must either save
the changes and overwrite the existing query (using the same name) or save the changes and give the
modified query a new name. Otherwise, the changes will be temporarily saved as a custom query and
will be accessible only from Open Model and not from Model Management. The original query will not
be modified, and the new, custom query will be available only as long as the Relationship Analysis Client
is open or until you use a different query for that model. If you apply a different query to the model or
close the Relationship Analysis Client, the changes to the query will be lost.
Copying Queries
Once a query is created, you can copy it from the Model Queries tab on the Model Management dialog
box. Select the query and click Copy. The Modify Query dialog box will open, containing all the settings
from the query you copied. You can then change the query in any way, adding, editing, or removing
steps and conditions.
Removing Queries
In addition to modifying a query on the Model Queries tab, you can also remove a query by selecting it
and clicking Remove.
Removing Models
Follow these steps to access this information:
1.
2.
3.
4.
With Relationship Analysis Client open, click the Manage button.
Select a model from the list in the Model Management dialog box by clicking it.
Click the Remove button.
Click Yes to remove the model.
Jobs Tab
The Jobs tab provides details for algorithms you run on the Models tab. It provides the following
information:
Master Data Management Guide
65
Relationship Analysis Client
•
•
•
•
•
•
Job ID
Name of the model against which the algorithm was run
Name of the algorithm that was run
Status of the job
Start time and end time
Any messages that may have been returned when the job was run
Viewing Models
The Relationship Analysis Client offers several methods to view model data:
•
•
•
•
•
Opening a Model
Canvas Options
Using the Selection Tool
Using the Query Tool
Using Filters
Opening a Model
The Open Model dialog box of the Relationship Analysis Client tool provides an overview of data for
each model even before that model is open. It also enables you to write a query that returns data from
the model you select.
Follow these steps to access this information:
1. With Relationship Analysis Client open, click the Open button.
2. Select a model from the list by clicking it.
3. Remain on the Models tab or click one of the other two tabs.
Models Tab
The Models tab shows the number of entities and relationships for each model. If you click anywhere in
a particular model's row (for example, in the Name, Entities, or Relationships columns), that model will
open. If you click the column header, the model data will sort in ascending order for that column. If you
click the column header twice, the model data will sort in descending order for that column.
Model Detail Tab
The Model Detail tab shows the number of entities and the number of relationships for a selected model.
If you click the column header, the model data will sort in ascending order for that column. If you click
the column header twice, the model data will sort in descending order for that column.
This tab also provides model metadata in grid format. Entity data and relationship data are shown on
two tabs. The Entities grid includes data for predecessors and successors to each entity as well as the
properties associated with each entity. The Relationships grid includes the types of relationships that
exist in the model and the properties associated with each relationship.
Let's say you are looking at a model with insurance data, attempting to identify potential fraud. You might
have entities representing individuals who sought treatment connected to entities representing doctors
or clinics those individuals visited. In the From Relationships section of the Entities tab, if you clicked
the plus sign next to an entity to expand his or her data, you might see "Person" in the From column,
"Visited" in the Type column, and "Doctor" in the To column, followed by the number of times someone
visited a doctor.
In the Relationships grid you will see data grouped by the relationships between entities. Using the
insurance fraud example, you might see "Visited" in that grid, and if you clicked the plus sign next to that
relationship to expand its data, you would probably see "Claimant" in the "From" column, "Visited" in the
66
Spectrum™ Technology Platform 9.0
Chapter 7: Data Hub Module
"Type" column, "Provider" in the "To" column, followed by the number of instances of that relationship
in the model in the "Count" column.
Query Tab
The Query tab allows you to create a query that returns data from the model you select. You can use
the query builder provided, or you can create a manual query.
You can also select from or modify existing queries that are listed in the Query drop-down. When you
modify existing queries, you must either save the changes and overwrite the existing query (using the
same name) or save the changes and give the modified query a new name. Otherwise, the changes will
be temporarily saved as a custom query and will be accessible only from Open Model and not from
Model Management. The original query will not be modified, and the new, custom query will be available
only as long as the application is open or until you use a different query for that model. If you apply a
different query to the model or close the application, changes to the query will be lost.
Follow these instructions to use the query builder:
1. Click All entities, All relationships, or Specify starting entities to identify what you want to query
against. The Specify starting entities selection allows you to determine at what point in the model
you want to begin your search. For instance, if you are looking at a model that depicts world-wide
terrorist activity during specific years, you might have country names for entities. Rather than query
against the entire model, you might want to look at activity just in Afghanistan. In this case you could
might select "Country" as the Property, leave Literal selected, and enter "Afghanistan" as the Value;
note that the value in this field is case sensitive and must be exact. You could also click Field and
select "Location," for example, rather than entering a specific value. If you select Field, an Input Data
grid containing the name of the field you just selected will appear under the query name along with
a cell where you can enter the default value. If you reuse this query elsewhere, you can use the
default value you provided in this step, or you can override the default at that time.
Note: You can only query properties that have been indexed; non-indexed properties will not appear
in the Property or Property name drop-downs.
2. Complete the Conditions field if you want to place additional constraints on the query. For example,
if you want to target terrorist activity in Afghanistan between 2001 and 2010, you would create two
conditions. First, you would select "Date", then "Greater Than or Equals", then enter "2001". You
would follow this with a second condition set to "And" that also uses "date," then "Less Than or
Equals", then "2010". Alternatively, you could click Field and select "Date" rather than entering a
specific value. Add, delete, or change the order of conditions by using the icons on either side of the
conditions. Click Ignore Case if the query results can be either upper or lower cased.
3. Click the Include in results box if you want the results from this step to be included in the output.
4. Specify the steps you want the query to take by selecting the appropriate option in the Add Operations
drop-down. Note that your options vary by whether the root element is an entity or a relationship.
• If you choose Entity to Entity (valid for All entities and Specify starting entities), you can then
refine your search to return data based on relationship label(s) between two entities (Connected),
before entities (Predecessors), or after entities (Successors). For example, if you are querying a
model of family members, and you choose a Relationship label of "Father," a Connected query
will return all entities that have a Father label between them (in other words, fathers, sons, and
daughters). A Predecessors query will return all entities who are a source entity of a Father
relationship connected to another entity (in other words, fathers). A Successors query will return
all entities who are the target entity of a Father relationship connected to another entity (in other
words, sons and daughters).
You can add Conditions to the query. For example, you could look for fathers as source entities
who live in Texas by adding a condition where the State property equals Texas.
Finally, you can define how many steps out, or Iterations, the query should search. If you select 2
iterations, once the query finds a source entity that matches your query, it will search the entities
attached to the source entity as well as the entities connected to the second entity. Click the Include
Master Data Management Guide
67
Relationship Analysis Client
in results box if you want the results from this step to be included in the output. Click Dedup if
you want the query to remove duplicate results from the output.
• If you choose Entity to Relationship (valid for All entities and Specify starting entities), your options
are very similar to those for Entity to Entity. You can refine your search to return data based on
relationship label(s) that attach two entities (Connected), occur before entities (Predecessors), or
occur after entities (Successors). You can also add Conditions to the query.
• If you choose Relationship to Entity (valid for All relationships), you can refine your search to
return data based on conditions you set. You can return data when a condition is in place for an
entity that is connected to another entity (Connected), an entity that is a source to a relationship
(Predecessors), and for when an entity is a target of a relationship (Successors).
5. Click OK.
Use the information below if you prefer to write a manual query for this stage via Gremlin, a model
traversal language using Groovy classes:
• Gremlin Commands
• Transform-Based Steps
• Filtering
Canvas Options
The Canvas Options for Relationship Analysis Client include the following:
• Zoom In—Narrows the focus to the central point on the current view. Use the Overview pane to move
the focus to a specific area on the model.
• Zoom Out—Expands the focus to show more of the model. Works as an undo for zooming in, if
applicable.
• Toggle Auto Zoom—Enables you to turn automatic zooming off and on. Auto zoom will zoom in on
items as they are selected, fitting all selected items into the viewport.
• Fit to Bounds—Fits the entire model within the bounds of the model view.
• Selection Fading—Causes items that are not selected to fade into the background. When nothing is
selected, all items appear in the foreground.
Using the Selection Tools
The Selection Tools enable you to select elements in a model based on certain criteria. Using the
Selection ribbon, you can select types of elements (entities or relationships); you can also select entities
based on their connection to the current (or last selected) element (all connected, predecessors, or
successors). The Selection pane provides a search function for locating elements within a model.
Using the Selection Ribbon
The Selection Ribbon enables you to quickly select elements or groups of elements in a model.
•
•
•
•
Select All—Selects all elements on the canvas.
Select All Entities—Selects all entities on the canvas.
Select All Relationships—Selects all relationships on the canvas.
Keep Selection—Keeps the highlighted element selected when performing other actions. For example,
if you have an entity selected and click Keep Selection followed by Select Connected, that one entity
plus all elements selected to that entity would be selected.
• Current Item—Causes actions to be taken only for the selected element. For example, if you have
an entity selected and click Current Item followed by Select Predecessors, all elements coming into
that item will be selected. If you then click Select Successors, only successors to the initial entity will
be returned. Successors to the entities brought in when you clicked Select Predecessors will not be
returned.
• Select Connected—Selects all elements connected to the selected element.
68
Spectrum™ Technology Platform 9.0
Chapter 7: Data Hub Module
• Select Predecessors—Selects all elements coming into the selected element.
• Select Successors—Selects all elements going out of the selected element.
You can also access these options by right-clicking in the Primary Pane.
Using the Selection Pane
The Selection Pane enables you to designate qualifying properties in your data and select model elements
that contain those properties. For example, if you are looking at data involving the United States of
America, you might want to see which states have a population greater than 10,000,000.
Use the Search tab to select elements in your model based on a simple Where statement. Use the
Advanced tab to select elements in your model that are connected in some manner to currently selected
elements.
The Search Tab
1. Select either Entities or Relationships as the model element whose data you're searching.
2. Complete the Where step by selecting the property whose data you're searching, the operator you
want to use in your selection, and the value that determines whether an item is returned. Using the
population example, your Where step could be State Population, Greater Than, and 10,000,000.
This would return data and select entities for states whose population is greater than 10,000,000.
3. Click the Run button:
. The items whose data met the requirements of the selection task are
shown in the Selected items list box. (Likewise, all data is shown for each selected entity in the
Model Components pane.)
4. Click any of the items in the Selected items list box to see all of that item's data in the Properties
tab.
5. Click the Relationships tab to see a list of items that are linked to the item you clicked in step 4.
Again, using the population example, this selection would return Texas, among other states. If you
click Texas in the Selected items list box and then clicked the Relationships tab, you might see that
Texas has relationships as a border state with Arkansas, Louisiana, New Mexico, and Oklahoma. In
this view, you can sort by relationship or by entity.
You can perform a subsequent selection task that yields results opposite those returned in your first
selection task. For instance, using the population example, a subsequent inverse selection task would
result in all states whose population is less than 10,000,000 being selected. You can even retain the
selections returned in your first selection task. After performing an initial selection task, check the Keep
current selection box if you want to retain the selections returned in your first selection task. If you do
not want to retain the original selections, leave this box blank. Check the Select inverse box and click
the Run button:
You could also use the inverse function combined with the Filter tool to select and remove entities and
relationships you do not want, thus allowing you to isolate entities and relationships you do want. Say
you are using a model comprised of state data and you want to know which states have more than four
electoral votes. You could create a selection that uses entities where Votes in Electoral College equals
4, click the Select inverse box, and click the Apply button. This will cause all states who have more or
less than four votes in the electoral college to be selected. From there, you could click the Filters tab,
click Entities in the Selection box, and only entities whose states have 4 electoral college votes would
remain.
The Advanced Tab
When you have selected one or more elements of your model you can use these advanced functions
to select additional elements. Choose to return elements who are connected to, precede, or succeed
currently selected entities. If you would like to select more than just first-degree connections, specify
how many layers of connections to return in the Depth field. A depth of 1 would return only the entities
that are connected to the selected entity. A depth of 2 would return those entities plus the entities
connected to them, and so on.
Master Data Management Guide
69
Relationship Analysis Client
You can choose to keep the current element selected when performing other actions. For example, if
you have an entity selected and click Keep current selection followed by Connected, that one entity
plus all relationships would be selected.
You can also cause actions to be taken only for the currently selected element. For example, if you have
an entity selected and click Current item only followed by Predecessors, all elements coming into that
item will be selected. If you then click Successors, only successors to the initial entity will be returned.
Successors to the entities brought in when you clicked Select Predecessors will not be returned.
Another option on the Advanced tab is to return all items connected to currently selected entities by the
Shortest path. If you check the Directed box, the path will go just in one direction. If you leave it
unchecked, the path may go in multiple directions. In the Weight drop-down, you can select the property
the Selection tool should look at when determining shortest paths.
After making your selections, click the Run button:
. The items whose data met the requirements
of the selection task are shown in the Selected items list box. (Likewise, all data is shown for each
selected entity in the Model Components pane.) Click any of the items in the Selected items list box to
see all of that item's data in the Properties tab. Click the Relationships tab to see a list of items that are
linked to the item you clicked in step 4. Sticking with the population example, this selection would return
Texas, among other states. If you click Texas in the Selected items list box and then clicked the
Relationships tab, you might see that Texas has relationships as a border state with Arkansas, Louisiana,
New Mexico, and Oklahoma. In this view, you can sort by relationship or by entity.
Using the Query Tool
The Query tool allows you to create a query that returns data for the open model. You can use the query
builder provided, or you can write a custom query.
Before you create your query, you must decide how you want results to be returned. Your options vary,
depending on whether you have loaded a full model or a partial model into the Relationship Analysis
Client. A full model is one that has all entities and relationships present on the canvas. A partial model
is one that has some but not all entities and relationships present on the canvas because you used a
query, selection, or filter function to bring in just some of the elements of your model.
• Select elements—This option will cause the elements identified in the query to be selected on the
canvas.
• Add elements—This option will cause elements identified in the query that were not already loaded
to be added to the canvas .
Note: This option cannot be used for a complete model because all elements are already present.
• Show result—This option will cause the Relationship Analysis Client to display raw data returned
from the query in the Result window.
Follow these instructions to use the query builder:
1. Click All entities, All relationships, or Specify starting entities to identify what you want to query
against. The Specify starting entities selection allows you to determine at what point in the model
you want to begin your search. For instance, if you are looking at a model that depicts world-wide
terrorist activity during specific years, you might have country names for entities. Rather than query
against the entire model, you might want to look at activity just in Afghanistan. In this case you could
might select "Country" as the Property, leave Literal selected, and enter "Afghanistan" as the Value;
note that the value in this field is case sensitive and must be exact. You could also click Field and
select "Location," for example, rather than entering a specific value. If you select Field, an Input Data
grid containing the name of the field you just selected will appear under the query name along with
a cell where you can enter the default value. If you reuse this query elsewhere, you can use the
default value you provided in this step, or you can override the default at that time.
Note: You can only query properties that have been indexed; non-indexed properties will not appear
in the Property or Property name drop-downs.
70
Spectrum™ Technology Platform 9.0
Chapter 7: Data Hub Module
2. Complete the Conditions field if you want to place additional constraints on the query. For example,
if you want to target terrorist activity in Afghanistan between 2001 and 2010, you would create two
conditions. First, you would select "Date", then "Greater Than or Equals", then enter "2001". You
would follow this with a second condition set to "And" that also uses "date," then "Less Than or
Equals", then "2010". Alternatively, you could click Field and select "Date" rather than entering a
specific value. Add, delete, or change the order of conditions by using the icons on either side of the
conditions. Click Ignore Case if the query results can be either upper or lower cased.
3. Click the Include in results box if you want the results from this step to be included in the output.
4. Specify the steps you want the query to take by selecting the appropriate option in the Add Operations
drop-down. Note that your options vary by whether the root element is an entity or a relationship.
• If you choose Entity to Entity (valid for All entities and Specify starting entities), you can then
refine your search to return data based on relationship label(s) between two entities (Connected),
before entities (Predecessors), or after entities (Successors). For example, if you are querying a
model of family members, and you choose a Relationship label of "Father," a Connected query
will return all entities that have a Father label between them (in other words, fathers, sons, and
daughters). A Predecessors query will return all entities who are a source entity of a Father
relationship connected to another entity (in other words, fathers). A Successors query will return
all entities who are the target entity of a Father relationship connected to another entity (in other
words, sons and daughters).
You can add Conditions to the query. For example, you could look for fathers as source entities
who live in Texas by adding a condition where the State property equals Texas.
Finally, you can define how many steps out, or Iterations, the query should search. If you select 2
iterations, once the query finds a source entity that matches your query, it will search the entities
attached to the source entity as well as the entities connected to the second entity. Click the Include
in results box if you want the results from this step to be included in the output. Click Dedup if
you want the query to remove duplicate results from the output.
• If you choose Entity to Relationship (valid for All entities and Specify starting entities), your options
are very similar to those for Entity to Entity. You can refine your search to return data based on
relationship label(s) that attach two entities (Connected), occur before entities (Predecessors), or
occur after entities (Successors). You can also add Conditions to the query.
• If you choose Relationship to Entity (valid for All relationships), you can refine your search to
return data based on conditions you set. You can return data when a condition is in place for an
entity that is connected to another entity (Connected), an entity that is a source to a relationship
(Predecessors), and for when an entity is a target of a relationship (Successors).
5. Click OK.
Use the information below if you prefer to write a manual query for this stage via Gremlin, a model
traversal language using Groovy classes:
• Gremlin Commands
• Transform-Based Steps
• Filtering
Using the Map Tool
The Map tool shows geographic points on a map, represented by push pins, which correspond to selected
entities within a model. Using latitudes and longitudes, the map is updated dynamically as you select
entities on the canvas. Likewise, the map automatically zooms in and out, based on the locations of the
selected entities, to display all of the selected entities at one time.
If your model contains Latitude and Longitude fields, the Map tool will detect them and automatically use
that data to identify the locations of the selected entities. If your model does not contain those fields, use
the Options dropdown to point the Map tool to the fields that contain latitude and longitude data.
The Map tool provides the following features:
Master Data Management Guide
71
Relationship Analysis Client
• Zoom control—enables you to manually zoom in and out of the map. You can also use the scroll wheel
on your mouse to zoom in and out.
• Pan control—enables you to pan across the map in all directions. Although the pan control displays
arrows pointing in four directions, you can actually pan in any direction. Simply click anywhere in the
control to shift the focus of the map. Alternatively, you can move the map itself by holding down the
mouse button and dragging in any direction.
• Road view—displays the map in a traditional view, using vector imagery of roads, buildings, and
geography.
• Aerial view—displays the map using satellite imagery and highlights roads and major landmarks among
the satellite images.
Using Charts
The Charts feature of Relationship Analysis Client enables you to visualize data from a model in graphic
format. When you click the View tab, then click the Charts button on the Tools ribbon, you will be
prompted to select from four options:
• Data bar
• Treemap
• Heat map
• Timeline
After selecting the type of chart you want to create, you will then need to select criteria on which the
chart should be based and click the check mark icon. If the check mark icon appears to be faded, you
have not fulfilled the minimum criteria required to create the chart. If no results are returned, that means
none of the data in the model met the criteria you selected.
To delete a chart, right-click the chart's tab and select Hide.
Note: If more than one view is open for a given model, the last selected view is the one used for the
chart display. If you make changes to values that are used in a chart, you must close the existing
chart and relaunch the Charts feature to see the latest values.
Using Data Bar Charts
Data bar charts present numeric data from a model in bar chart format. Therefore, only properties with
numeric formats are eligible for use with data bar charts. Data bar charts display each entry for the
selected criteria from highest to lowest value. This represents the order of influence within the model,
from most influential to least influential. For instance, if you were looking at a model of suspected insurance
fraud data, and you selected entities, with _stp_indegree as the property name, you might see a data
bar chart that showed a list of providers. The providers who saw the most patients (represented in the
model as incoming relationships to the providers) would be at the top of the chart, and the providers who
saw the least amount of patients would be at the bottom of the chart.
1. Select either Entities or Relationships.
2. Select from the Property Name field whether you want the data bar chart to include incoming counts,
outgoing counts, or both.
3. Click the check mark icon.
You can create multiple data bar charts simply by selecting new criteria and clicking the check mark
icon. All data bar charts will appear on the canvas as you create them.
Using Treemaps
Treemaps present data in a heirarchical manner, resulting in several individual squares and rectangles
that together form a whole. The size and color of each rectangle reflects its value and influence within
the model, and when you hover over any given block the data upon which you created the map will
appear. For instance, if you were looking at a model of suspected insurance fraud data, you might select
the following criteria:
72
Spectrum™ Technology Platform 9.0
Chapter 7: Data Hub Module
•
•
•
•
Entities
Group by BusinessName
Groups include all
_stp_degree as the business names' value
With these settings, you might see a treemap of blocks representing each company against whom
workers' compensation claims have been filed. In a model of 16 claims, a company with eight claims
would have a block that comprises half of the treemap, a company with 4 claims would comprise a
quarter of the map, and companies with 2 claims would comprise an eighth of the map. If you hovered
over the block for the first company, its name and "8" would appear; if you hovered over the block for
the second company, its name and "4" would appear, and so on.
1. Select either Entities or Relationships.
2. Select a property in the Group by drop-down. You can also select <none> if you do not want the
treemap to be based on a specific property.
3. Specify in the Groups drop-down which groups within that property you want to be included in the
treemap. If you selected <none> in step 2 this field will not appear.
4. Select from the Value field whether you want the treemap to include incoming counts, outgoing
counts, or both.
5. Click the check mark icon.
You can create an additional treemap by selecting Charts > Treemap and following steps 1-5 again.
However, if you select new criteria from the existing treemap and click the check mark icon, a new
treemap will appear in place of the existing treemap.
Using Heat Maps
Heat maps present data in table form using colors. A simple example of this is unemployment data over
the years by month. Each row represents one of the twelve months, and each column represents a year
in the time frame. Colors could range from very pale red (lower unemployment rates) to dark red (higher
unemployment rates). You could use more than one spectrum of color, especially if you wanted your
heat map to be more specific. Using the unemployment example above, you could select the range of
reds for 1%-5% unemployment, and then add a range of blues for 6%-10% unemployment.
Note: Only properties with numeric formats are eligible for use with heat maps.
1.
2.
3.
4.
5.
Select whether you want the heat map to use values By property or By relationship.
Select whether you want to use entity or relationship data in the heat map.
Select the field you want to use in the rows of the heat map.
Select the field you want to use in the columns of the heat map.
Select from the Value field whether you want the heat map to include incoming counts, outgoing
counts, or both.
6. Click the check mark icon or continue with advanced settings.
Advanced settings are not required; they allow you to fine-tune the heat map configuration.
1. Select how you want the rows to be sorted. You can sort them ascending or descending, by field
name or by value. Using the unemployment example above, you could sort the rows ascending (or
descending) by month, or you could sort them ascending (or descending) by value.
2. Select how you want the columns to be sorted. You can sort them ascending or descending, by field
name or by value. Using the unemployment example above, you could sort the columns ascending
(or descending) by year, or you could sort them ascending (or descending) by value.
3. Specify the range of colors you want to use in your heat map in the Low Value and High Value
fields.
4. Specify the maximum number of rows that can be on a single page. The minimum you can enter is
15 and the maximum you can enter is 50.
5. Specify the maximum number of columns that can be on a single page. The minimum you can enter
is 5 and the maximum you can enter is 50.
6. Click the check mark icon.
Master Data Management Guide
73
Relationship Analysis Client
You can create an additional heat map by selecting Charts > Heat map and following steps 1-6 again.
However, if you select new criteria from the existing heat map and click the check mark icon, a new heat
map will appear in place of the existing heat map.
Using Timelines
Timelines present data across a span of time. They can be used for entities, relationships, or both. You
can plot events, actions, and so on over a course of time, and once the timeline is created you can zoom
in or out to focus on more or fewer items.
1. Click either Entities or Relationships. You must complete information for one or both of these options
to generate a timeline.
2. Select a field from which the Start date can be extracted. You must complete this field to generate
a timeline.
Note: If any component that meets the criteria of the timeline does not have an associated start
date, it will not be included in the chart.
3. Select a field from which the End date can be extracted. You can use the same field for the end date
as you did for the start date; alternatively, you can use a different field.
4. If you did not select an end date, select a Duration for the timeline. This figure represents the number
of days from the start date through which the timeline should take place. This field can only contain
values if the End date field is empty.
5. Click the check mark icon or continue with advanced settings.
Advanced settings are not required; they allow you to fine-tune the timeline configuration.
1. Click Group items to group elements in the timeline by type or by component.
2. Select how you want the data to be grouped. Selecting By type will group entities based on values
in the _stp_type field and relationships based on the value of the relationship label. Selecting By
components will group items based on whether they are entities or relationships. Entities with
durations are shown in blue bars, and instant-item entities are shown as blue dots. Relationships
are shown in green.
3. Specify the Date format you want to use in your timeline. The default date is based on the format
used in the start date value format.
4. Click the check mark icon.
You can create an additional timeline by selecting Charts > Timeline and following steps 1-5 again.
However, if you select new criteria from the existing timeline and click the check mark icon, a new timeline
will appear in place of the existing timeline.
Viewing Timeline Information
• Instant items on a timeline do not have a label, but if you hover over the item the label will appear as
a tooltip. Likewise, tooltips for entities show their labels as well. However, tooltips for relationships
include the source, target, and relationship labels.
• When you select an item on the canvas, that item is also selected in the timeline. Conversely, when
you select one or more items on the timeline, those items are selected on the canvas as well. You can
also see detailed information for the selected item(s) on the Model Components Pane and the Selection
Pane.
• The vertical slider on the bottom of the timeline allows you to scroll back and forth across all dates in
the timeline.
• You can adjust the level of zoom in the timeline either with the mouse wheel or by dragging the handles
on either end of the slider.
• Double-click the slider selection to have the timeline include data for the entire range of dates.
• Double-click the handle on the left side of the slider to change the visible timeframe to begin at the
start date. For example, if your date range was from 1990-2000, and your current view showed
1995-1997, clicking the left handle would change your view to start at 1990.
74
Spectrum™ Technology Platform 9.0
Chapter 7: Data Hub Module
• Double-click the handle on the right side of the slider to change the visible timeframe to end at the end
date. For example, if your date range was from 1990-2000, and your current view showed 1995-1997,
clicking the right handle would change your view to end at 2000.
Using Filters
The Filters section of Relationship Analysis Client allows you to hide selected entities or relationships
from your canvas. Selection and Type filters enable you to clear out extraneous elements—those whose
properties don't meet your requirements or whose data doesn't factor into your current interest. Using
these kinds of filters can reveal important connections in the elements left behind. Temporal filters enable
you to capture a segment of data in a specific time frame. They can also help you compare the activity
of your network from one time to another. Numeric filters enable you to capture data containing a property
that falls within a range that you specify. For instance, if your data contains information about insurance
claims, you might have a field called "NumberOfVisits" for the number of times a doctor has claimed
treating a particular patient, with relationships in your model reflecting that relationship. If you are trying
to isolate relationships with 10 or more visits, you could filter your data based on that field, and set the
minimum value to 10. This would remove relationships that have a number lower than 10 in the
NumberOfVisits field.
Note: When an entity is filtered, all connecting relationships will also be filtered. When an relationship
is filtered, the connecting entities are not filtered.
Using Selection Filters
Follow the steps below to use Selection filters.
1. With a model open, click the View tab.
2. Select the entities or relationships you want to hide by clicking on them in the primary canvas or by
running a selection.
3. In the Filter Selection group, click either Entities or Relationships, whichever is appropriate.
4. Click Selected or Non-Selected, depending on whether you want the entities or relationships that
are selected to disappear, or if you want the entities or relationships that are not selected to disappear.
If you wish to restore the entities or relationships you removed, click Clear all in the Selection group.
Note: This restore feature works only for entities or relationships removed using Selection filters.
Using Type Filters
Follow the steps below to use Type filters.
1. With a model open, click the View tab.
2. In the Filter By Type group, click Entities or Relationships.
3. Click the entity type (e.g., person, location, event, and so on) or relationship property (e.g., brother,
Afghanistan, bombing, and so on). These types are specified in the Write to Hub stage and viewed
in the _stp_type property of an element. The elements that meet the criteria of your filter will be
hidden from view.
Using Temporal Filters
The image below identifies parts of a temporal filter. You should see this entire pane when you activate
a temporal filter. If you do not see the Time Span Scroll Bar at the bottom of the pane, increase the
height of the filter pane until the entire pane is visible.
Master Data Management Guide
75
Relationship Analysis Client
The View Port is the visual representation of the span of dates you select. It includes the Selection
Thumb, which enables you to change the dates in the filter by clicking and dragging the handles on
either end of the thumb. Note that the Selection start date and the Selection end date fields update
dynamically when you let go of the handles.
The View Port also includes the Time Span Scroll Bar, which enables you to zoom in (or out) on the
selected dates by clicking and dragging the handles on either end of the bar. As shown in the two
examples below, when you drag the handles closer to each other, you will see years turn into months,
months into weeks, and weeks into days. The reverse occurs when you drag the handles away from
each other. The benefit of this tool is that as you zoom in or out with the Time Span Scroll Bar, you then
have more flexibility and control over the time span the Selection Thumb covers; the thumb will update
dynamically as you make changes with the scroll bar. If initially the thumb spanned a year or month, you
could adjust the view with the scroll bar and then use the thumb to span a week or day.
Follow the steps below to use Temporal filters.
1. With a model open, click the View tab.
2. In the Tools group, click Range Filter. The Range Filter pane will open underneath the Primary
Pane. The pane should look similar to the image above. If it does not, you may need to increase the
size of the pane to reveal the bottom portion.
3. Select Entities and/or Relationships, depending on which set of data you want to filter.
4. Select the Entity property and/or the Relationship property that contains the date information.
Note: Entities or relationships that do not contain valid data in the property you select here will not
be filtered and thus will remain visible in the model.
5. In the Value data type drop-down, select "Temporal" if it is not already selected by default. Then
select the language in which your dates are formatted.
6. The Selection start date field will auto-populate after you complete step 4, but you can enter a
different value here if you want to increase the minimum of the range. For example, if you are looking
at insurance data and filtering on dates during which claims were filed, the earliest date in your data
may be 01/02/2001. However, perhaps you don't want to look at claims from the first few years of
data. You could, hypothetically, change the Selection start date to 01/02/2004. This would cause all
data with dates 01/01/2004 and earlier to be removed from the model.
7. The Selection end date field will auto-populate after you complete step 4, but you can enter a
different value here if you want to decrease the maximum of the range. For example, if you are looking
at insurance data and filtering on dates during which claims were filed, the latest date in your data
76
Spectrum™ Technology Platform 9.0
Chapter 7: Data Hub Module
may be 12/31/2010. However, perhaps you don't want to look at claims from the last few years of
data. You could, hypothetically, change the Selection end date to 12/31/2007. This would cause all
data with dates 01/01/2008 and later to be removed from the model.
8. Use the Selection Thumb and the Time Span Scroll Bar to set a more specific range for which you
want to return results. The model will dynamically update, removing entities and relationships, as
you move the slider and let go of the handles.
Using Numeric Filters
Follow the steps below to use Numeric filters.
1. Click the View tab.
2. In the Tools ribbon, click Range Filter. The Range Filter pane will open.
3. Select Entities and/or Relationships, depending on which set of data you want to filter.
4. Select the Entity property and/or the Relationship property that contains the numeric information.
Note: Entities or relationships that do not contain valid data in the property you select here will not
be filtered and thus will remain visible in the model.
5. In the Value data type drop-down, select "Numeric".
6. The Minimum value field will auto-populate after you complete step 4, but you can enter a different
value here if you want to increase the minimum of the range. For example, if you are looking at
insurance data and filtering on claim numbers, the lowest claim number in your data may be 1001.
However, perhaps you don't want to look at the first thousand claims. You could, hypothetically,
change the Minimum value to 2001. This would cause all data with claim numbers of 2000 and lower
to be removed from the model.
7. The Maximum value field will auto-populate after you complete step 4, but you can enter a different
value here if you want to decrease the maximum of the range. Using the example in Step 6, the
highest claim number in your data may be 9000, and perhaps you don't want to view the last thousand
claims. You could, hypothetically, change the Maximum value to 8000. This would cause all data
with claim numbers of 8001 and higher to be removed from the model.
8. Use the slider to set the range for which you want to return results. The model will dynamically update,
removing entities and relationships, as you move the slider.
Using the Entity Profile Report
The Entity Profile Report enables you to see all data associated with a particular entity in one place.
Information in an Entity Profile Report includes the following:
•
•
•
•
The entity's label (usually its name)
The entity's type (for example, "person" or "event")
The total number of relationships connected to the entity
A list of each property tied to the entity as well as the value for each of those properties. For instance,
a property of "Latitude" may have a value of "23.424076."
• A list of each incoming relationship, with the source, relationship label, and target for that relationship.
In this list, the target will always be the entity on whom the report is based. For instance, in a model
used to identify insurance fraud, this list might have an entry with a source of someone's name, a
relationship of "is patient of," and a target of "Dr. Smith."
• A list of each outgoing relationship, with the source, relationship label, and target for that relationship.
In this list, the source will always be the entity on whom the report is based.
To generate an Entity Profile Report, simply select an entity within a model, then right-click that entity
and select Entity Profile Report from the context menu. The report will appear on top of the model; use
the arrows to scroll through the pages. You can choose to have the report dockable or floating by
right-clicking the report's tab and selecting the appropriate option. You can also print the report or save
it in PDF format.
To close the report, right-click the report's tab and select Hide.
Note: If you select this option the report will be deleted; you will need to regenerate it to view the report
again.
Master Data Management Guide
77
Relationship Analysis Client
Using the Model Metadata Report
The Model Metadata Report provides counts for model, entity, and relationship metadata associated
with a model. By using Advanced Settings, you can determine how much or how little of that data you
want the report to return; the default settings return all data.
Note: You must select at least one of the options in Advanced Settings; otherwise, the report will simply
say, "No data to display."
Assuming you have selected at least one option in Advanced Settings, information in a Model Metadata
Report always includes the following:
• The model's name
• The total number of entities in the model
• The total number of relationships in the model
Optional information in a Model Metadata Report includes the following:
Model Metadata
• Screen capture—A screen capture that depicts the model's entity types (for example, "Provider" or
"Patient Name") and relationship types (for example, "Treated" or "Filed A Claim With")
• Entity types—Entity types and the counts for each type
• Properties (under Entity types)—Entity properties, the format of the property (for example, "string" or
"Boolean"), and the counts for each property
• Relationships—Relationship types and the counts for each type
• Properties (under Relationships)—Relationship properties, the format of the property (for example,
"string" or "Boolean"), and the counts for each property
Entity Metadata
The following information, broken down by each entity type:
• Include entity type metadata—The total number of entities for a given type (for example, a "Person"
entity might have 5 Doctor entities and 3 Patient entities, giving you a count of 8 for the "Person" type)
• Incoming relationships per type—The number of incoming relationships for a given entity type
• Outgoing relationships per type—The number of outgoing relationships for a given entity type
• Source, relationship, and target connections for any given entity type's incoming and outgoing
relationships, as well as counts for each (for example, your model may have 4 instances of "Joe Smith"
[source] "Visited" [relationship] "Robert Johnson, M.D." [target])
• Properties per type—The total number of properties for a given entity type
• Property names and property types for a given entity type, as well as counts for each
Relationship Metadata
The following information, broken down by each relationship type:
• Include relationship metadata—The total number of relationships for a given type (for example, for
a relationship of "Visited": 3 Person entities could have "Visited" Robert Johnson, M.D., and 4 other
Person entities could have "Visited" Patricia Benson, M.D., giving you a count of 7 for the relationship
type "Visited")
• Connections per relationship—Source, relationship, and target connections for a given type, as well
as counts for each (using the previous example, 3 Persons [source] could have "Visited" [relationship]
Robert Johnson, M.D. [target])
• Properties per relationship—The total number of properties for a given relationship type
• Property names and property types for a given relationship type, as well as counts for each
To generate a Model Metadata Report, have a model open and click Model Metadata from the Reporting
ribbon on the Data tab. The report will appear on top of the model; use the arrows to scroll through the
pages. If you want to customize your report and have it include some but not all of the optional information
78
Spectrum™ Technology Platform 9.0
Chapter 7: Data Hub Module
listed above, click Show advanced settings and select the options you want to include. The report will
update dynamically as you select and deselect options.
You can choose to have the report dockable or floating by right-clicking the report's tab and selecting
the appropriate option. You can also print the report or save it in PDF format.
To close the report, right-click the report's tab and select Hide.
Note: If you select this option the report will be deleted; you will need to regenerate it to view the report
again.
Changing the Appearance of Model Data
The Relationship Analysis Client of the Data Hub Module has several tools you can use to alter the
appearance of model data. This feature allows you to highlight or call out specific entities and relationships
that you want focus on.
Using Multiple Views
In Relationship Analysis Client, you can create multiple views of the same model. Likewise, you can
compare different parts of the same model using multiple views. This feature allows you to manipulate
model data while preserving the integrity of the original model. You can compare models as you toggle
among views to identify possible relationships, establish how many events of a certain type (such as
flights to a particular country) took place on a particular date or time, consider the same data in varying
layouts, and so on.
To create an additional view for your model, click New View in the Graph pane. An identical model will
open in a new tab with the name "View 1." You can manipulate the data in this view just as you would
your original model. After you make changes to the original model or another view for that model, you
will notice that as you bring each view to the forefront by clicking its tab, the surrounding panes will
update accordingly with information for that view.
When you add and remove entities and relationships or modify relationship properties that are used as
weights, centrality measurements for that model will change. By creating multiple views and altering the
model in those subsequent views, you can rerun centrality algorithms to see how the changes affect the
model. For example, if Osama bin Laden were the most central entity in a terrorism model and you
removed him from that model, he obviously would no longer be the most central entity. This might uncover
another primary entity that did not stand out in the previous view. Using multiple views allows you to
make these changes and examine alternative scenarios while keeping you from altering the original
model.
Click here for more information on centrality measures.
Using Default Options
Default options can be designated for the following:
Using General Settings
This feature allows you to set default options for animation and undo/redo.
Animation
1. Click the Animate layout transitions box if you want the Relationship Analysis Client to show
animation during transitions from one view to another.
2. If you clicked the box in Step 1, select the number of seconds you want the animation to appear in
the Duration control. Default is 1 second and the maximum is 10 seconds.
Undo
1. Click the Track changes for undo and redo box if you want to use undo and redo functionality.
Master Data Management Guide
79
Relationship Analysis Client
2. If you clicked the box in Step 1, select the number of instances you want the Relationship Analysis
Client to track in the Max changes control. Default is 5 instances and the maximum is 25 instances.
Selected Items This option enables you to change how selected entities or relationships are represented.
You can change their color or the thickness of their outline.
Current Item This option enables you to change how the current entity or relationship is represented.
If you have multiple items selected, the last item is considered the current item. This item's information
is displayed in the Selection pane of the Relationship Analysis Client. As with selected items, you can
change the current item's color or the thickness of its outline.
Query result limits This option enables you to impose limits on the number of entities or relationships
that can be loaded into the Relationship Analysis Client. The maximum for both fields is 1,000 to avoid
overloading the Relationship Analysis Client tool.
Entities panel style option This option enables you to determine the maximum number of properties
that should appear on the Panel Style tool when used to style entities. The default is 5 properties, and
the maximum is 10.
Using Entities Decoration
This feature allows you to determine default shape and label settings for entities.
Entity Shape Settings
•
•
•
•
•
•
•
•
•
Shape—Sets the default shape of entities.
Image—Sets an image to represent entities.
Width—Sets the default width of the entities.
Maintain aspect ratio—Automatically adjusts the height based on the width, to maintain the aspect
ratio of the entities.
Height—Sets the default height of the entities.
Fill Color—Sets the default interior color of the entities.
Shadow—Adds the appearance of a shadow behind the entities.
Border Color—Sets the default color of the entities' borders.
Thickness—Sets the default width of the entities' borders.
Entity Label Settings
•
•
•
•
•
•
•
•
•
Show labels—Activates labels on the model.
Font—Sets the default font of the labels.
Font size—Sets the default font size of the labels.
Location—Sets the default location of the entity labels as inside or outside the entities.
Position— Sets the default position of the entity labels relative to the entities. The label can appear
on any side or corner of the entity.
Color—Sets the default color of the labels.
Wrap label—Forces labels exceeding maximum width to break onto multiple lines.
Trim label—Trims labels exceeding maximum width.on
Maximum width—Sets the maximum width allowable for labels.
Using Relationships Decoration
This feature allows you to determine line and label settings for relationships.
Relationship Line Settings
•
•
•
•
•
80
Line color—Sets the default color of the relationships.
Cross style—Sets the default appearance for crossed lines.
Line type—Sets the default appearance of the relationships.
Thickness—Sets the default width of the relationships.
Source arrow—Sets the default appearance of the starting point (source) of relationships.
Spectrum™ Technology Platform 9.0
Chapter 7: Data Hub Module
• Scale—Sets the default size of the source arrow.
• Target arrow—Sets the default appearance of the ending point (target) of relationships.
• Scale—Sets the default size of the target arrow.
Relationship Label Settings
•
•
•
•
•
•
•
•
Show labels—Activates relationship labels on the model.
Color—Sets the default color of the relationship labels.
Font—Sets the default font for the relationship labels.
Font size—Sets the default size of the relationship label.
Distance from relationship—Sets how close to or far from the labels are to the relationships.
Wrap label—Forces labels exceeding maximum width to break onto multiple lines.
Trim label—Trims labels exceeding maximum width.
Maximum width—Sets the maximum width allowable for labels.
Changing the Appearance of Selected Entities
The Selected Entity Settings ribbon on the Styling tab allows you to determine the appearance of entities.
This gives you further control over your data by allowing you to manually make certain entities stand out
by using size, color, border thickness, and so on. For instance, if you are looking at data involving the
United States of America, you could use the Selection Tool to identify and select states with population
greater than 10,000,000. Then, you could change the entities of those states to be a different shape and
color than the entities for states with population less than 10,000,000.
Settings made here will apply only to selected entities, whereas settings made in the Gradient section
will apply to all entities.
With one or more entities selected, change any of the following settings.
Entity shape
Allows you to change the shape of selected entities.
Image
Allows you to change the image for the selected entities.
Property
Allows you to change the selected entity's current label to a different property.
Toggle label
Activates and deactivates labels for selected entities.
Fill color
Allows you to change the interior color of the selected entities.
Entity Settings
Access the following settings by clicking the arrow in the bottom-right corner of the Entity Settings area
of the ribbon. Allows you to use shape and label settings to alter the appearance of entities.
Shape Settings
•
•
•
•
Shape—Sets the shape of the entities.
Image—Allows you to change the image for the selected entities.
Width—Sets the width of the entities.
Maintain aspect ratio check box—Automatically adjusts the height based on the width, to maintain
the aspect ratio of the entities.
• Height—Sets the height of the entities.
• Fill color—Sets the interior color of the selected entities.
• Shadow—Adds the appearance of a shadow behind the selected entities.
Master Data Management Guide
81
Relationship Analysis Client
• Border color—Sets the color of the selected entities' borders.
• Thickness—Sets the width of the selected entities' borders.
Label Settings
• Show labels—Activates labels on the model.
Note: Large models will load and change layouts more quickly if labels are turned off for both entities
and relationships.
•
•
•
•
•
•
•
•
Font—Sets the font of the labels.
Font size—Sets the font size of the labels.
Label location—Sets the location of the entity labels as inside or outside the entities.
Label position—Sets the position of the entity labels relative to the entities. The label can appear on
any side or corner of the entity.
Color drop-down box—Sets the color of the labels.
Wrap label—Forces labels exceeding maximum width to break onto multiple lines.
Trim label—Trims labels exceeding maximum width.
Maximum width—Sets the maximum width allowable for labels.
Click Apply to make shape and label settings changes to your model.
Changing the Appearance of Selected Relationships
The Selected Relationship Settings ribbon in the Styling tab allows you to determine the appearance of
relationships. This gives you further control over your data by allowing you to manually make certain
relationships stand out by using color, line type, arrow type, and so on. You can also turn labels off and
on and determine how far from the entity the label should be. For instance, if you are looking at data
involving the insurance claims, you could use the Selection Tool to identify and select relationships with
a label of "Claimant." Then, you could change those relationships to be a different type and color than
the relationships with different labels. You could also change the font and size of the selected relationships'
labels.
Settings made here will apply only to selected relationships, whereas settings made in the Gradient
section will apply to all relationships.
With one or more relationships selected, change any of the following settings.
Lines
Sets the appearance of selected relationships.
Source
Sets the appearance of the starting point (source) of selected relationships.
Target
Sets the appearance of the ending point (target) of selected relationships.
Property
Allows you to change the selected relationship's current label to a different property.
Toggle label
Activates and deactivates labels for selected relationships.
Line color
Sets the color of selected relationships.
Edge Settings
Access the settings below by clicking the arrow in the bottom-right corner of the Edge Settings area of
the ribbon. Allows you to use line and label settings to alter the appearance of relationships.
82
Spectrum™ Technology Platform 9.0
Chapter 7: Data Hub Module
Line Settings
•
•
•
•
•
•
•
Line color—Sets the color of the relationships.
Line type—Sets the appearance of the relationships.
Thickness—Sets the width of the relationships.
Source arrow—Sets the appearance of the starting point (source) of selected relationships.
Scale—Sets the size of the source arrow.
Target arrow—Sets the appearance of the ending point (target) of selected relationships.
Scale—Sets the size of the target arrow.
Label Settings
• Show labels check box—Activates relationship labels on the model.
Note: Large models will load and change layouts more quickly if labels are turned off for both entities
and relationships.
•
•
•
•
•
•
•
Color drop-down box—Sets the color of the relationship labels.
Font—Sets the font for the relationship labels.
Font size—Sets the size of the relationship label.
Distance from relationship—Sets how close to or far from the labels are to the relationships.
Wrap label—Forces labels exceeding maximum width to break onto multiple lines.
Trim label—Trims labels exceeding maximum width.
Maximum width—Sets the maximum width allowable for labels.
Click Apply to make line and label settings changes to your model.
Using Gradient Settings
The Gradient ribbon on the Styling tab enables you to visually change the style of a model using actual
values in the data. You can represent model elements and highlight important elements based on their
values by starting at one setting for the lowest value and another setting for the highest value. You do
this by determining the appearance of entities and relationships. For instance, if your model uses insurance
claim data and one of the entity properties is the dollar amount of claims, you could set pink as the color
for the entity with the lowest claim amount and red as the color for the entity with the highest claim
amount, and the entities for everything in between those two dates would fall somewhere between pink
and red.
Settings made here will apply to all entities or relationships, whereas settings made in the Entity Settings
or Relationship Settings are apply only to selected entities or relationships.
For more information on gradient settings:
Entity Gradient Settings
These settings allow you to use color and size to represent the range of differences among entities. For
example, if your model uses cities as entities, and one of the fields in your model's database is population,
you could show the color gradient from yellow (smallest city) to green (largest city). Likewise, you could
set the shape as a star, and the smallest city would have a small star and the largest city would have a
large star. (You determine the size of the largest and smallest stars, and everything else falls in between.)
Gradient Value
• Gradient property—Sets the field on which the gradient is based.
• Override least/most significant values—Overrides the default lowest and highest values used for
gradient.
• Least significant value—Shows the value for the lowest gradient property.
• Most significant value—Shows the value for the highest gradient property.
Master Data Management Guide
83
Relationship Analysis Client
• Low values are more significant—Specifies that low values are preferable to high values, such as
with a scale of 1-5, when "1" is the highest rating.
Color Settings
•
•
•
•
•
•
Apply to entities color—Activates the color settings options.
Use these colors—Overrides the existing element's color.
Low value—Sets the color for the entities with the lowest value.
High value—Sets the color for the entities with the highest value.
Reduce color range—
Scale entity color by—Retains the entity's fill color but with varying hue, saturation or brightness
(depending on each entity's gradient value).
• Low %—Sets the low percentage for the scale. For example, if this number is "20" and you chose
"Saturation" in the previous field and red as the fill color, entities with the lowest gradient value would
have a 20% red color.
• High %—Sets the high percentage for the scale. For example, if this number is "100" and you chose
"Saturation" in the previous field and red as the fill color, entities with the highest gradient value would
have a 100% red color.
Size Settings
•
•
•
•
•
Apply to entities size—Activates the size settings options.
Use these sizes—Allows you to select the sizes you want the gradient to use.
Low value—Sets the size for the entities with the lowest value.
High value—Sets the size for the entities with the highest value.
Scale entity size by—Changes the entities' sizes, varying overall, in height, or in width (depending
on each entity's gradient value).
• Low %—Sets the low percentage for the scale. For example, if this number is "20" and you chose
"Width" in the previous field, entities with the lowest gradient value would have a width that is 20% of
the highest number's width.
• High %—Sets the high percentage for the scale. For example, if this number is "100" and you chose
"Width" in the previous field, entities with the highest gradient value would have a width that is 100%.
• Scale label size—Changes the size of the entity's label relative to the size of the entity.
Click OK to make shape and label settings changes to your model.
Relationship Gradient Settings
These settings allow you to use color and line settings to represent the range of differences among
relationships. Using the Entity Gradient Settings example, your model with city information may have a
field that includes each city's rank based on population. The city having the highest population, with a
rank of "1", could have a color gradient of lavender, and the city having the lowest population, with a
rank of 100 (presuming there were 100 cities in the model), could have a color gradient of dark purple.
Likewise, you could set the thickness of the relationship to go from thinnest (lowest-ranked city) to thickest
(highest-ranked city). You determine the size of the thinnest and thickest lines, and everything else falls
in between.
Note: You would need to check the Low values are more significant box for this example.
Gradient Value
• Gradient property—Sets the field on which the gradient is based.
• Override least/most significant values—Overrides the default lowest and highest values used for
gradient.
• Least significant value—Shows the value for the lowest gradient property.
• Most significant value—Shows the value for the highest gradient property.
• Low values are more significant—Specifies that low values are preferable to high values, such as
with a scale of 1-5, when "1" is the highest rating.
84
Spectrum™ Technology Platform 9.0
Chapter 7: Data Hub Module
Color Settings
•
•
•
•
•
Apply to relationships color—Activates the color settings options.
Use these colors —Allows you to select the colors you want the gradient to use.
Low value—Sets the color for the relationships with the lowest value.
High value—Sets the color for the relationships with the highest value.
Scale relationship color by —Retains the relationship's color but with varying hue, saturation or
brightness (depending on each entity's gradient value).
• Low %—Sets the low percentage for the scale. For example, if this number is "20" and you chose
"Saturation" in the previous field and red as the fill color, relationships with the lowest gradient value
would have a 20% red color.
• High %—Sets the high percentage for the scale. For example, if this number is "100" and you chose
"Saturation" in the previous field and red as the fill color, relationships with the highest gradient value
would have a 100% red color.
Line Settings
•
•
•
•
•
Apply to relationships thickness—Activates the line settings options.
Use these sizes—Allows you to select the sizes you want the gradient to use.
Low value—Sets the size for the relationships with the lowest value.
High value—Sets the size for the relationships with the highest value.
Scale relationship thickness by—Changes the relationships' sizes (depending on each entity's
gradient value).
• Low %—Sets the low percentage for the scale. For example, if this number is "20", relationships with
the lowest gradient value would have a size that is 20% of the highest number's size.
• High %—Sets the high percentage for the scale. For example, if this number is "100", relationships
with the highest gradient value would have a size that is 100%.
• Scale label size—Changes the size of the relationship's label relative to the size of the relationship.
Click OK to make color and line settings changes to your model.
Using Panel Style
The Panel Style ribbon on the Styling tab enables you to view property data for each entity within the
canvas, providing more model data at a time than can be shown in the Model Components or Selection
panes.
The panel will display a title, which is the entity's identification and is fulfilled by the _stp_id field in the
model. It can contain up to 300 characters. The panel also contains data for up to 10 of the most-used
properties for its type; if entities contain more than 10 properties, the panel will display data for the 10
that are used most frequently. See here for more information on configuring the number of properties
on panels. Property data can contain up to 200 characters each. The panel also provides the number
of connections the entity has; it displays the total number of connections, the number of entities coming
in (predecessors), and the numger of entities going out (successors).
In the image above, the title of the panel, or the entity's identification, is Khalid al-Mihdhar, and it tells
us he is a person. The Name, Associate, Nationality, Role, and Residence fields are properties associated
Master Data Management Guide
85
Relationship Analysis Client
with the entity Khalid al-Mihdhar. The number 13 at the bottom of the panel represents the total number
of connections coming into and going out of this entity. You can see by the incoming arrows and the
number "6" on the bottom of the panel that there are six predecessors to this entity. Likewise, there are
seven successors. The number of predecessors plus the number of successors will always add up to
the total number of connections.
The Panel Style view updates dynamically as you edit the values of properties and add entities manually
or by using the Discovery feature.
You can activate Panel Style simply by clicking the Entities button on the Panel Style ribbon in the
Styling tab. You can turn off Panel Style by clicking that button again.
If you remove entities that are connected to other entities and you are using Panel Style, you will see a
small plus sign in the bottom-right corner of panels for selected entities who have missing connections,
as indicated by the red arrow in the following image. This will also occur if you open a partial model that
is missing entities that were previously connected to those entities returned in the partial model. If you
wish to restore the entities that were previously connected to the selected entity, click the plus sign. The
connected entities will reload into the model.
Using Themes
The Themes ribbon on the Styling tab enables you to apply styles and filters to elements in your model
based on conditions you set. You can pre-determine aesthetic values for entities and relationships that
meet the criteria set in your conditions, and you can use filters to automatically hide those elements from
your model.
1.
2.
3.
4.
5.
6.
7.
8.
Click the Define button on the Themes ribbon in the Styling tab.
Click Add.
Enter a name for the theme and click Add.
Select from the list of styles or filters that you want to include in your theme. You can choose from
entity decorations, relationship decorations, gradients, or filters.
Click Add Conditions.
Select the property for which you want to create a condition and apply a theme. For example, you
could select a property called "Date" and complete the expression to say "Equals" and "09/11/2001".
Edit the options for your style or filter to configure the theme.
Click OK twice.
Once a theme is defined, you can click Define > Apply or select it from the Themes drop-down to apply
it to your model. You can also modify and delete themes by clicking Define, selecting a theme, and then
clicking Modify or Delete.
If you have a theme that contains characteristics you would like to include in another theme, you can
make a copy of the first theme, rename it, and alter it accordingly. For example, you could have a model
with entities that represent states, and one of the fields in your model's database is population. You could
create "Theme 10" for states with a population of more than 10,000,000 and set those entities' fill color
as green (among other settings, such as the shape of the entity or an image used in place of a shape).
If you wanted to call out states with a population of at least 5 million but no more than 10 million, you
could copy Theme 10, save it as "Theme 5", and change the Fill Color to blue. That way, entities
representing large states would look different from entities for the remaining states in your model, and
they would look similar to each other, but just different enough that you can see which have a population
of 5 million to 10 million and which have a population of 10 million or more.
To copy a theme:
1.
2.
3.
4.
86
Click Define.
Select a theme from the list and click Copy.
Enter a name for the new theme in the Name field.
Click Add to apply additional settings to the theme, or click Modify to alter the existing settings for
the theme.
Spectrum™ Technology Platform 9.0
Chapter 7: Data Hub Module
Using Layouts
The Layouts feature within the Relationship Analysis Client enables you to change the appearance of
model elements to show the entities and relationships visually. Certain data renders better in a particular
model layout. The Relationship Analysis Client offers five layouts for your models. There are also options
respective to each layout and options that are common to all layouts. Click the links below to see more
information about each layout and the type of data that is most appropriate for that layout.
Common Options
These options are common to all layouts.
• Default—Routes relationships using the shortest straight lines.
• Organic—Routes relationships organically to ensure that they do not overlap entities and that they
keep a specifiable minimal distance to the entities. This algorithm will work correctly only if there is
enough room between each pair of entities in the model.
• Orthogonal—Routes a diagram's relationships using vertical and horizontal line segments only. The
positions of the diagram's entities will remain fixed. Usually, the routed relationships will not cut through
any entities or overlap any other relationships. Some relationships may be re-drawn after the user
moves entities or, subsequently, added relationships may be drawn to fit the existing diagram.
• Consider entity labels—Guarantees that entity labels will not overlap entities in the model.
• Use existing layout as a sketch—Interprets the initial model layout as a sketch for the desired
outcome of the layout process. The algorithm tries to identify the entities that should lie on a entity
partition's circle boundary and maintain their cyclic order around the center of the entity partition.
• Selected elements only—Applies settings only to selected elements and not all elements.
• Multi-page layout— Displays the contents of a model in logical clusters across multiple pages, making
them easier to view. Click the Multi-page layout button to activate this feature and let the Relationship
Analysis Client distribute the contents accordingly. Alternatively, if you want the results to appear within
a specific number of pages, enter the minimum and/or maximum number of pages onto which the
contents should be distributed and then click the Multi-page layout button. The smaller the value in
the Max field, the more quickly the results will be returned. Note: The Relationship Analysis Client may
return more pages than you indicate as the maximum if the model contains a higher number of
unconnected segments. For example, if you set the maximum number of pages to 5 but 7 unconnected
segments are identified when you click the button and the algorithm is run, 7 pages will be returned.
Use the arrow keys to scroll through the pages.
Circular Layout
A circular layout emphasizes group and tree structures within a network. It analyzes the connectivity
structure of the network and arranges the partitions as separate circles.
A circular layout is useful for models that depict social networks, network management, and eCommerce.
Layout Style
• Compact (default)—Each partition will represent a so-called biconnected component of the model.
This component consists of entities that are reachable by two relationship-disjoint paths. Entities that
belong to more than one biconnected component will be assigned exclusively to one partition.
• Isolated—Entity partitions will be formed similarly to those in Bcc Compact with the exception that all
entities belonging to more than one biconnected component will be assigned an isolated partition.
• Groups—Entity partitions that form circles will be provided by the user. To specify the partitions, a
data provider holding such supplemental layout data must be bound to the model.
• Cycle—All entities will be arranged on a single circle.
Partition Style
• Cycle—All entities from a given partition are placed on a circle.
Master Data Management Guide
87
Relationship Analysis Client
• Disk—Entities from a given partition that connect to entities from other partitions are placed on the
disk's boundary while all other entities are placed on the inside.
• Organic—Used to arrange the entities from a partition. Entities that connect to entities from other
partitions can be placed both on the inside or on the boundary of the disk.
Layout Options
The Circular layout has general options, partition options, and options related to how the model tree is
arranged. Access the following settings by clicking the arrow in the bottom-right corner of the Circular
Layout Options ribbon. After changing settings, click Apply to immediately view the changes on the
canvas in the background or move on to another tab. Click OK to return to the canvas. If you make
changes and later wish to restore default settings, click Revert.
General Options
See Layout Style for more information on the drop-down options.
• Place children on common radius—Enables tighter drawings by using adapted radii for child entities.
By default, the entities in tree-like structures connecting to a circle are always placed on a common
radius according to their distance from the root entity. Tighter drawings can be achieved by abandoning
the common radius and instead placing these child entities using radii adapted to the size of an actual
child entity and the sizes of entities in its vicinity.
Partition Options
• See Partition Style for more information on the drop-down options.
• Automatically set radius/Minimum entity distance—Determines the radius of each circle/disk in
the layout automatically.
• Manually set radius/Radius—Determines the fixed radius for all circles/disks in the resulting layout.
Tree Arrangement Options
• Preferred child wedge—Determines the angular range of the sector that will be reserved for the
children of a root entity. The possible angular range lies between 1 and 359. The smaller the chosen
value, the greater the impression that the entities drive away from their root entities and the center of
the model. Generally speaking, the compactness of the layout will decrease with smaller values. Very
small values will lead to layouts that consume a lot of space.
• Minimum relationship length—Determines the minimal length of an relationship that connects two
entities that lie on separate circles. The smaller the chosen value, the more compact the resulting
layout.
• Maximum deviation angle—Determines the allowed angular deviation from the optimal relationship
direction. The bigger the chosen value, the more compact the resulting layout. If a value smaller than
90 degrees is chosen, then the tree relationships might cross through the circular arranged components.
• Compactness—Influences the length of the tree relationships as it is computed by the layout. The
smaller the compactness factor, the shorter the tree-relationships and the more compact the overall
layout. The bigger the compactness factor the more difficult, and hence slower, the layout computation.
• Minimum entity distance—Determines the minimal distance between the borders of two adjacent
entities on the circle/the disk's boundary. The smaller the distance, the more compact the resulting
layout.
• Allow overlaps—Further increases compactness of the resulting layout, but potentially introduces
slight entity overlaps.
Hierarchic Layout
A hierarchic layout highlights the main direction or flow within a directed model. The entities of a model
are placed in hierarchically arranged layers such that most of the relationships of the model show the
same overall orientation (e.g., top-to-bottom). Additionally, the ordering of the entities within each layer
is chosen in such a way that the number of relationship crossings is small.
A hierarchic layout is useful for models that depict workflows, database modeling, and process modeling.
88
Spectrum™ Technology Platform 9.0
Chapter 7: Data Hub Module
Orientation
• Top to Bottom (default)—Layout will be oriented from top to bottom.
• Bottom to Top—Layout will be from bottom to top, which means that the layout will be flipped along
the x axis.
• Left to Right—Layout will be from left to right, which means that the layout will be rotated by 90
degrees counterclockwise.
• Right to Left—Layout will be from right to left, which means that the layout will be rotated by 90
degrees clockwise.
Style
• Orthogonal (default)—Vertical and horizontal line 90-degree segments only.
• Polyline—A continuous line composed of one or more 45-degree line segments.
Layout Options
The Hierarchic layout has general options, relationship options, and layer options. Access the following
settings by clicking the arrow in the bottom-right corner of the Hierarchic Layout Options ribbon. After
changing settings, click Apply to immediately view the changes on the canvas in the background or move
on to another tab. Click OK to return to the canvas. If you make changes and later wish to restore default
settings, click Revert.
General Options
See Orientation for more information on the drop-down options.
• Minimum distance—The minimum distance between two entities in the same layer, an entity and a
non-adjacent relationship in the same layer, two relationships in the same layer, or two layers.
• Layout components separately—Place unconnected sub-models vertically, or stacked. Otherwise
they are placed horizontally.
• Symmetric placement—Return a more symmetric model, although it is likely to have more bends.
Relationship Options
• Routing style—Choose one of the following options:
Orthogonal (default)—Vertical and horizontal line segments only.
Polyline—A continuous line composed of one or more line segments.
• Automatic relationship grouping—Groups as many relationships as possible without changing the
semantic of the model. Edges are grouped either at a common source entity or at a common target
entity.
• Backloop routing—Forces relationships that connect to targets located above their source entities
to exit at the bottom and enter at the top of their source and target, respectively, emphasizing the main
direction of the diagram.
• Port constraint optimization—The Relationship Analysis Client tries to find a better source port
constraint if the current constraint is null. A port constraint expresses at what position an relationship
is allowed to connect to either its source or target entity. A weak port constraint limits the position of
the port to a particular side of a entity. A strong port constraint fixes the position of the port completely
to the position of the current port coordinates.
• Minimum —The minimum length of the first segment, the last segment, the relationship itself, or the
distance between one relationship to another.
• Slope (for polyline routing style only)—Determines the minimum slope of the relationship's mid segments
in a vertical layout.
• Labeling—Choose one of the following styles:
None (default)—No labels will appear on selected relationships.
Generic—Finds label positions for the labels from a given model so that they, ideally, do not overlap
with each other or with model elements. It does so without altering entities or relationships in any way.
Master Data Management Guide
89
Relationship Analysis Client
Hierarchic (default)—Finds optimal placements for relationship labels such that there are no overlaps
of labels with each other or with model elements.
• Label model(inactive when "None" is selected for Labeling)—choose one of the following styles:
As Is (default)—Retains labels as they are; they will not be altered.
Center—Places labels in the center of the relationships.
Side (default)—Places labels on the side of the relationships.
Free—Allows for unspecified label positions.
Layer Options
• Assignment Policy—Assigns the entities of a model to separate layers. Choose one of the following
styles:
Optimal (default)—Assigns layers in such a way that the overall sum of the layer distances of all
relationships in the layout is minimal.
Tight Tree Heuristic—Approximates the layering done by Hierarchical-Optimal.
BFS Layering (breadth-first search) (default)—Results in all relationships spanning at most one layer
in the resulting drawing. Edges between entities that belong to the same layer are possible.
From Sketch—Tries to find a layering that is similar to the one in the input model. When this layering
strategy is used, the layout algorithm may place entities in the same layer, even though they are
connected by a relationship. These inner layer relationships are always routed in an orthogonal style.
Topmost—Assigns all entities without incoming relationships (in degree zero) to the topmost layer of
the layout. The number of separate layers will be as small as possible.
• Scale(From Sketch assignment policies only)—Sets the size of the halo around an entity or the
respective insets that are used to calculate layer overlaps.
• Halo(From Sketch assignment policies only)—Sets the scale of an entity's height.
• Minimum size—(From Sketch assignment policies only) Allows a group entity to accommodate the
size of its label, provided it meets minimum size standards.
• Maximum size—(From Sketch assignment policies only) Allows a group entity to accommodate the
size of its label, provided it meets maximum size standards.
• Alignment within layer—Determines how to align the entities within the layer. Choose one of the
following styles:
Top of Entities —Aligns the layer's entities along the top.
Center of Entities —Aligns the layer's entities along the center.
Bottom of Entities (default)—Aligns the layer's entities along the bottom.
Organic Layout
An organic layout is based on the force-directed layout paradigm. When calculating a layout, the entities
are considered to be physical objects with mutually repulsive forces, such as protons or electrons. The
connections between entities also follow the physical analogy and are considered to be springs attached
to the pair of entities. These springs produce repulsive or attractive forces between their end points if
they are too short or too long. The layout algorithm simulates these physical forces and rearranges the
positions of the entities in such a way that the sum of the forces emitted by the entities and the
relationships reaches a (local) minimum. Resulting layouts often expose the inherent symmetric and
clustered structure of a model; they show a well-balanced distribution of entities and have few relationship
crossings.
An organic layout is useful for models that use enterprise networking, system management, and WWW
visualization.
90
Spectrum™ Technology Platform 9.0
Chapter 7: Data Hub Module
Output
Output determines whether the layout is fit into a particular shape or to a specified aspect ratio.
•
•
•
•
No Restriction—Layout is not restricted to a particular output shape or aspect ratio.
Aspect Ratio—Layout is restricted to an aspect ratio.
Elliptical—Layout will be output into an elliptical shape.
Rectangular—Layout will be output into a rectangular shape.
Layout Options
The Organic layout has general options and restriction options. Access the following settings by clicking
the arrow in the bottom-right corner of the Organic Layout Options ribbon. After changing settings, click
Apply to immediately view the changes on the canvas in the background or move on to another tab.
Click OK to return to the canvas. If you make changes and later wish to restore default settings, click
Revert.
General Options
• Layout is deterministic—Produces identical results for identical input models and identical settings.
• Allow entity\relationship overlaps—Guarantees the absence of entity and relationship overlaps
even for very dense models.
• Allow entity overlaps—Guarantees the absence of entity overlaps even for very dense models.
• Minimum entity distance—Prevents entity (label) overlaps and keeps minimum distances between
the entities.
• Preferred relationship length—Specifies the general preferred length of all relationships.
• Compactness—Produces significantly more or less compact layouts. Small values for property
"Compactness" result in large area drawings with a relatively sparse entity distribution. Values greater
than 0.5 result in artificially compacted layouts, and values next to 1.0 result in layouts with near to
minimal space allocations. Obeyed only for medium or high quality settings..
• Quality/Time ratio—Uses small values to produce acceptable layouts for huge models (thousands
of entities within seconds) and greater values to produce high-quality layouts, which may take longer
(up to a few minutes for hundreds of entities).
Restriction Options
• Output area—Determines whether the layout is fit into a particular shape or to a specified aspect ratio.
Choose one of the following styles:
No Restriction—Layout is not restricted to a particular output shape or aspect ratio.
Aspect Ratio—Layout is restricted to an aspect ratio.
Elliptical—Layout will be output into an elliptical shape.
Rectangular—Layout will be output into a rectangular shape.
• Bounds—(Only for Elliptical or Rectangular output area) Allows you to set the X and Y bounds as
well as the width and height of the ellipsis or rectangle.
• Aspect ratio—(Only for Aspect Ratio output area) Allows you to specify the aspect ratio of your output.
Orthogonal Layout
An orthogonal layout is a multi-purpose layout provider for undirected models. It produces compact
drawings with no overlaps, few crossings, and few bends.
An orthogonal layout is useful for models that use database schema, system management, and software
engineering.
The orthogonal layout has the options shown below.
• Layout style—choose one of the following styles:
Normal (default)—Node sizes will not be changed by this layout. The drawing will contain very few
bends.
Master Data Management Guide
91
Relationship Analysis Client
Box—Nodes are resized according to the number and position of their neighbors to reduce the overall
number of bends.
Fixed Box—Similar to Box but retains original entity sizes.
Fixed Mixed—Similar to Mixed but retains original entity sizes.
Mixed—Resembles Box but resizes all entities to equal size. Introduces additional bends and routes
the last relationship segment of these relationships non-orthogonally to their adjacent entities.
Normal Tree—Similar to Normal but larger subtrees are processed using a specialized tree layout
algorithm, which is better suited for tree-like structures than the original orthogonal layout style.
Uniform—All entity sizes will be changed to equal size before the model is processed.
• Reduce relationship crossings—Reduces the overall number of relationship crossings. The cost
for the reduction is increased execution time of the layout.
• Length reduction—Reduces the overall relationship lengths. The cost for the reduction is an increased
execution time of the layout algorithm.
• Consider entity labels—Guarantees that entity labels will not overlap entities in the model.
Access the following settings by clicking the arrow in the bottom-right corner of the Organic Layout
Options area of the ribbon. After changing settings, click Apply to apply the changes and move on to
another tab. Or, click OK to return to the canvas. If you make changes you wish to undo and have not
yet clicked Apply or OK, click Revert.
General Tab
• Layout style—See description above.
• Grid spacing—Defines the virtual grid spacing used by the layout algorithm. Each entity will be placed
in such a way that its center point lies on a grid point. Edges will be routed in such a way that their
segments lie on grid lines, if the terminal entities of the relationships allow to place the ports accordingly.
Note that this option is only guaranteed to be obeyed for Normal layout style.
• Reduce relationship crossings—See description above.
• Length reduction—See description above.
• Minimize bends—Avoids helical arrangement of chains of entities.
• Use randomization—Increases overall layout quality with high probability. The cost for this layout
optimization is increased execution time and non-deterministic results for subsequent layout invocations.
• Use face maximization—
• Use existing layout as a sketch—Interprets the initial model layout as a sketch of the resulting
orthogonal layout. The layout algorithm tries to "orthogonalize" the given sketch without making too
much modifications in respect to the original drawing
• Consider entity labels—See description above.
• Edge labeling—choose one of the following styles: None (default)—No labels will appear on selected
relationships. Generic—Finds label positions for the labels from a given model so that they, ideally,
do not overlap with each other or with model elements. It does so without altering entities or relationships
in any way. Integrated (default)—used in conjunction with layout style "Normal." Taken into consideration
when determining both entity placement and relationship path generation. With this strategy it is
guaranteed that no relationship label will overlap other objects in the diagram.
• Edge label mode(inactive when "None" is selected for Labeling)—choose one of the following styles:
As Is (default)—Retains labels as they are; they will not be altered.
Center—Places labels in the center of the relationships.
Side (default)—Places labels on the side of the relationships.
Free—Allows for unspecified label positions.
92
Spectrum™ Technology Platform 9.0
Chapter 7: Data Hub Module
Style
• Box—Nodes are resized according to the number and position of their neighbors to reduce the overall
number of bends.
• Fixed Box—Similar to Box but retains original entity sizes.
• Mixed—Resembles Box but resizes all entities to equal size. Introduces additional bends and routes
the last relationship segment of these relationships non-orthogonally to their adjacent entities.
• Fixed Mixed—Similar to Mixed but retains original entity sizes.
• Normal (default)—Node sizes will not be changed by this layout. The drawing will contain very few
bends.
• Normal Tree—Similar to Normal but larger subtrees are processed using a specialized tree layout
algorithm, which is better suited for tree-like structures than the original orthogonal layout style.
• Uniform—All entity sizes will be changed to equal size before the model is processed.
Layout Options
The Orthogonal layout has general options. Access the following settings by clicking the arrow in the
bottom-right corner of the Orthogonal Layout Options ribbon. After changing settings, click Apply to
immediately view the changes on the canvas in the background or move on to another tab. Click OK to
return to the canvas. If you make changes and later wish to restore default settings, click Revert.
• Layout style—See description above.
• Grid spacing—Defines the virtual grid spacing used by the layout algorithm. Each entity will be placed
in such a way that its center point lies on a grid point. Edges will be routed in such a way that their
segments lie on grid lines, if the terminal entities of the relationships allow to place the ports accordingly.
Note that this option is only guaranteed to be obeyed for Normal layout style.
• Reduce relationship crossings—Reduces the overall number of relationship crossings. The cost
for the reduction is increased execution time of the layout.
• Length reduction—Reduces the overall relationship lengths. The cost for the reduction is an increased
execution time of the layout algorithm.
• Minimize bends—Avoids helical arrangement of chains of entities.
• Use randomization—Increases overall layout quality with high probability. The cost for this layout
optimization is increased execution time and non-deterministic results for subsequent layout invocations.
• Use face maximization—
• Relationship labeling—Choose one of the following styles:
None (default)—No labels will appear on selected relationships.
Generic—Finds label positions for the labels from a given model so that they, ideally, do not overlap
with each other or with model elements. It does so without altering entities or relationships in any way.
Integrated (default)—used in conjunction with layout style "Normal." Taken into consideration when
determining both entity placement and relationship path generation. With this strategy it is guaranteed
that no relationship label will overlap other objects in the diagram.
• Relationship label model (inactive when "None" is selected for Labeling)—choose one of the following
styles:
As Is (default)—Retains labels as they are; they will not be altered.
Center—Places labels in the center of the relationships.
Side (default)—Places labels on the side of the relationships.
Free—Allows for unspecified label positions.
Map Layout
A map layout depicts locations of entities within your model using latitude and longitude.
A map layout is useful for models that contain geographic data that helps you identify relationships,
activity, or influence.
Master Data Management Guide
93
Relationship Analysis Client
Layout Options
The primary pane of the Map layout contains controls that you can manipulate to change the focus of
the view or zoom in or out on an entity. You can also switch between Road View and Aerial View. When
Aerial View is selected, you have the option of turning off labels for easier viewing of the map. If you
prefer to view the map with no controls, click the double-arrow to hide them.
Note: When the Map layout is selected, the Overview pane is unavailable.
The Map layout has general options that are available from the Map Layout Options ribbon.
• Latitude—Enables you to select a field from your model that contains latitude information.
• Longitude—Enables you to select a field from your model that contains longitude information.
• Filter invalid entities—Filters out entities that do not contain latitude or longitude information
Analyzing Model Data
The Data section of Relationship Analysis Client provides tools help you analyze the data in your model.
Using Discovery
The Discovery feature enables you to load the smallest number of elements based on conditions specified
in a query. It also enables you to load additional elements that are most important for the analysis task.
For example, you could be using a model that contains terrorism data, and you might only want to see
activity that is tied to a particular suspect, or entity. After you view this data, you may decide to look at
other entities this suspect is connected to. You could use Discovery to load all elements connected to
this suspect, or you could load only the elements who succeed, or follow, this suspect.
After you have reloaded your model to include additional elements, you may want to remove some of
those elements. Using the previous example, perhaps the suspect has young sons or daughters as
connections. Because of their age, you do not consider them suspects. You can use the Unload function
to return entities with a relationship of "Son" or "Daughter".
Using Discovery Options, you can determine whether or not to restore additional relationships after
performing a Discovery function. You can also set the maximum number of entities to return using
Discovery.
Returning Elements
If you open a partial model using the Query function on the Data tab, the Discovery feature enables
you to query the model to return entities that are somehow connected to the existing, selected entity.
You can return the following types of entities to your partial model:
• All entities that are connected to the selected entity
• Entities that precede the selected entity
• Entities that follow the selected entity
You can further filter these results by selecting a Relationship Label and then clicking Connected,
Predecessors, or Successors. For example, if you are viewing a partial model of terrorism suspects,
you could select one or more entities, then select a TraveledWith relationship label, and then click
Connected. The model would reload with the original entities along with all entities who were connected
to and traveled with the original entities.
To use Discovery:
1. Open a partial model using the Query function on the Open tab.
2. Select the entity whose immediate connection(s) you want to identify.
Note: If you select multiple entities, Discovery will return results only for the last one selected.
3. Select a Relationship Label if you want to filter the connections.
94
Spectrum™ Technology Platform 9.0
Chapter 7: Data Hub Module
4. Click Connected, Predecessors, or Successors. The model will reload, showing any additional
entities that were connected to the original entities in the manner you selected. If the graph becomes
fully loaded with all of its entities, Discovery will become disabled.
Note: The availability of these options depends on your model's contents. Sometimes Predecessors
or Successors will be grayed out.
Unloading Elements
After you use Discovery to bring additional entities and relationships into the model, you can unload
some of the data that is brought in by using the Unload feature. Using the same example above, after
you brought in entities who traveled with the existing entities, you could then unload the entities who
have a relationship label of "wife" because you might be looking only at male suspects.
1. Click the entities you want to remove from your model, or click the entities whose connected entities
you want to remove. For example, you might want to remove all connections to a terrorism suspect
if the only connections are family members who are not considered suspects.
2. Select a Relationship Label if you are unloading entities connected to selected entities and want
to filter which ones are removed based on the relationships between them. Using our example, you
might select "Wife" or "Child."
Note: You can only unload entities that have no connections other than to the entity you select in
Step 1. [Luke: What if the entities have connections only to other entities being deleted?
For example, continuing with the above example, what if there were a connection
between siblings, and both siblings would be unloaded based on the relationship
label? Can they then be unloaded, or does this rule apply no matter what?]
3. Click Unload.
4. Choose one of the following options.
Selected entities
Removes all entities currently selected.
Unselected entities
Removes all entities not currently selected.
Connected leaves
Removes all entities and relationships connected to the currently
selected entities.
Predecessor leaves
Removes all entities and relationships that come into, or precede,
the currently selected entities.
Successor leaves
Removes all entities and relationships that go out of, or succeed,
the currently selected entities.
Note: The availability of these options depends on your model's contents. Sometimes you can
choose only Selected entities or Unselected entities.
Options
By checking Fill in relationships in the Discovery Options box, you can return additional relationships
revealed in Discovery. If the discovered entities were connected to additional entities already on the
canvas (other than the one(s) you selected prior to using Discovery), those relationships will also be
returned.
You can also determine the maximum number of entities or relationships to return. The default is 100.
Using Centrality
Centrality is a way of measuring the importance and significance of individual entities and relationships.
When you run centrality algorithms, the higher the value, the more important the element.
Master Data Management Guide
95
Relationship Analysis Client
1. From the Centrality ribbon on the Data tab, select the kind of centrality measure you want to apply
to your model.
•
•
•
•
Betweenness—Reflects the number of shortest paths between one entity and other entities.
Closeness—Reflects the length of geodesic distances between one entity and other entities.
Degree—Reflects the number of relationships on a entity.
Influence—Reflects the importance of a entity, based on its connections to high-scoring entities.
2. Select the direction in which you want to apply the algorithm:
• Incoming—The results will be based on relationships coming into the entity.
• Outcoming—The results will be based on relationships going out of the entity.
• Both—The results will be based on relationships both coming into and going out of the entity.
3. If you are using a Closeness algorithm, click the appropriate button for the way in which you want
results to be returned:
• Standard—Results are based on the number of attachments, or relationships, a entity has as well
as the reverse of the sum of shortest paths to each entity.
• Dangalchev—Results are based not only on the number of entities linked to another entity but
also the number of relationships in each of the linked entities.
• Opsahl—Results are based on the sum of reversed shortest paths to each entity.
4. If you are using an Influence algorithm, slide the Precision scale to determine how precise the results
should be. A lower precision will return more accurate results, but the algorithm will run more slowly.
5. Click the Use relationship property as weight if you want to measure how unfavorable an relationship
is, and select the relationship property you want to use from the Property drop-down. In this case,
a higher value indicates a negative association.
6. Click the Low values are more significant box if you are using a relationship property as weight
and that property is one where a lower value is considered better than a higher value. For example,
if the property is some sort of ranking system, typically 1, or 1st, is the best value. Another example
is if the property is distance, and you are trying to determine the shortest route: 5 miles is considered
better than 10 miles.
7. Click the Override default output property name if you want the output property name to be
something other than the algorithm you selected. Then enter the new name in the Property field.
8. Click OK.
Using Groups
The Groups feature lets you select biconnected elements, which are in a model that is connected and
inseparable, such that if an arbitrary entity were removed, the model would remain connected. This
shows you that there are at least two different paths to reach one entity from another entity.
You can determine whether your model is biconnected by clicking the Model Details button on the Tools
ribbon and seeing if the "Is Biconnected" field is set to "True".
This feature also lets you set relationship betweenness clustering options. Click the Betweenness
clustering button on the Groups ribbon of the Data tab. On this dialog box you can set minimum and
maximum group count and designate which relationship property should be used as the weight. When
you click OK, you will see the elements in your model that meet the requirements you set appear in a
different color. Highlighting these elements can identify latent relationships in your data.
Using Geocoding
The Geocoding feature enables you to manually geocode the entities in your model by using a service
that performs geocoding. If you have already defined geocoding options, simply click the top half of the
Geocode button from the Geocoding ribbon on the Data tab to perform geocoding.
96
Spectrum™ Technology Platform 9.0
Chapter 7: Data Hub Module
If you have not already defined geocoding options, click the bottom half of the Geocode button and
follow these steps:
1. Select a service that performs geocoding from the Geocoding service dropdown.
If the service you select contains latitude and longitude fields, the Geocoding feature will automatically
detect those fields and populate the Entity Property column. If the service performs geocoding but
the latitude and longitude data is in other fields, you will need to map those fields in the Entity
Property column:
If you select a service that does not perform geocoding, an error message will appear:
2. If you want to change the name of the latitude and longitude fields when geocoding is performed,
click the Output tab and change the names in the Entity Property column:
3. Click OK. The Relationship Analysis Client will perform geocoding and add latitude and longitude
data to your model:
Master Data Management Guide
97
Relationship Analysis Client
Editing Models
This feature enables you to manually add or delete entities or relationships from models. It also allows
you to manually add, edit, or remove properties and modify values for properties associated with entities
and relationships. An example of this functionality might be that if your model uses data for the United
States of America and one of the entity properties for a state is population, you could change its value
if for some reason the population has changed since your model was created.
Adding Entities
This feature allows you to manually add entities to an existing model. This can be useful if you don't
want to recreate the model but have data in the form of an entity that you would like to add to a model.
1. With an existing model open, click the Entities dropdown in the Toolbox.
2. Drag the appropriate icon onto the model canvas. Choose from the existing types of entities or choose
<New> if the entity is a type that is new to your model.
3. Enter a Label for the new entity.
4. If you are adding a new type of entity, enter the Type. You can pick from an existing type or enter a
new type.
Note: If you added an existing type of entity, this field will automatically populate and cannot be
changed.
5. Add Properties to the entity by completing the Name, Type, and Value fields.
Note: The Type field will automatically populate when you enter a name, but you can select another
type from the dropdown if necessary.
6. Click Add, then OK. The new entity appears.
If you save your model after adding the entity, it will be included in the counts shown when you open or
manage the model.
Adding Relationships
This feature allows you to manually add relationships to an existing model. This can be useful if you
have identified new relationships between existing entities or if you have added new entities to your
model that you now need to tie to other entities.
1. With an existing model open, click the Relationships dropdown in the Toolbox.
2. Click the appropriate icon. Choose from the existing types of relationships or choose <New> if the
relationship is a type that is new to your model.
3. On the canvas, click and drag from the source entity to the target entity and release the mouse. If
you chose an existing type of relationship in Step 2, the relationship is now established. If you chose
a new relationship in Step 2, the Add Relationship dialog box appears.
4. Enter a Label for the new relationship.
5. If the two entities have multiple relationships with the same label, you must check Use unique
identifier value and enter a value that is specific to this relationship. Two entities cannot have multiple
relationships with the same label without a unique identifier.
6. Add Properties to the relationship by completing the Name, Type, and Value fields.
98
Spectrum™ Technology Platform 9.0
Chapter 7: Data Hub Module
Note: The Type field will automatically populate when you enter a name, but you can select another
type from the dropdown if necessary.
7. Click Add, then OK. The relationship appears.
If you save your model after adding the relationship, it will be included in the counts shown when you
open or manage the model.
Deleting Entities and Relationships
This feature enables you to manually delete entities and relationships in an existing model. This can be
useful if you don't want to recreate the model but have entities or relationships you would like to remove
from your model.
1. With an existing model open, click the Edit model button on the Editing ribbon.
2. Click the entity or relationship you want to remove and press Delete. The model updates accordingly.
3. Save the model. Run the Centrality algorithm to see differences in the model after these changes.
Note: When you delete an entity, the relationships attached to it are deleted as well. However, when
you delete a relationship, the entities it connects are not deleted.
Splitting Entities
This feature enables you to split one entity into two entities. If your model contains entities that perform
multiple functions within that model, you could create one entity for one function, and a second entity
for the other function. Using the organization chart example from Write to Hub, you might want to create
two entities out of the entity for Jim Waterman, who has employee ID 3. Jim is a manager to Marcus
David (employee ID 12), but he is also an employee of Tom Smith (employee ID 1). Therefore, in that
model, you might want a manager entity and an employee entity.
In addition to splitting one entity into two, you can also determine which properties and relationships are
tied to each specific entity—all, some, or none. Or, you can tie properties and relationships to both
entities; they don't have to be tied to one or the other.
1. With an existing model open, click the entity you want to split.
2. Click the Split button on the Editing ribbon or right-click and select Split entity. The Split Entity
dialog box will appear, with the Original Entity in the middle, New Entity 1 on the left, and New Entity
2 on the right. By default, all properties and relationships will appear for all three entities.
3. If you want to change the labels for the new entities, enter new names in the Label field. In our
example, we will keep the label as "3" because using the employee ID is consistent with the rest of
the entities in the model.
4. If you want to change the types of the new entities, use the Type field. In our example, we will keep
the type for New Entity 1 as "Employee," but we will change New Entity 2 to "Manager."
Note: Each entity must have a unique combination of label and type. In our example, we can have
two entities with the label of "3" since the types are different, but we could not have two
entities with the label of "3" and a type of "Employee."
5. Determine which properties you want tied to each entity by clicking a property and then using the
blue arrows in between the entities in the Properties field. Our example will keep the "name" and
"title" properties for both new entities because this information is useful as an employee and as a
manager.
6. Determine which relationships you want tied to each entity by clicking a relationship and then using
the blue arrows in between the entities in the Relationships field. In our example, we will keep the
outgoing "Reports To" relationship for New Entity 1 because that represents the relationship between
Jim as an employee and his manager Tom. We will keep the incoming "Reports To" relationship for
New Entity 2 because that represents the relationship between Jim as a manager and his employee
Marcus.
The completed Split Entity dialog box for our example looks like this:
Master Data Management Guide
99
Relationship Analysis Client
The model for our example has been updated with the two new entities. You can see that New Entity 1
is shown as an employee to Tom Smith, and New Entity 2 is shown as a manager to Marcus David.
Merging Entities
This feature enables you to merge two entities into one. If your model contains two entities that represent
the same subject, you can merge them and their respective data together into one entity. Using the end
result from Splitting Entities, you might want to merge together the entities for Jim Waterman, who has
two entities in that model: one as a manager to Marcus David, and one as an employee of Tom Smith.
In addition to merging two entities into one, you can also determine which properties and relationships
will be associated with the new, single entity—all, some, or none.
1. With an existing model open, select two entities you want to merge. You can do this by clicking and
dragging over the two entities, or you can click one entity and Ctrl-click the second entity.
2. Click the Merge button on the Editing ribbon or right-click and select Merge entities. The Merge
Entities dialog box will appear, with Original Entity 1 in on the left, Original Entity 2 on the right, and
New Entity in the middle.
3. If you want to change the label for the new entity, enter a new name in the Label field. In our example,
we will keep the label as "3" because using the employee ID is consistent with the rest of the entities
in the model.
4. If you want to change the type of the new entity, use the Type field. In our example, we will keep the
type as "Employee."
5. Determine which properties you want tied to the new entity by clicking a property and then using the
blue arrows in between the entities in the Properties field. Our example will keep the "name" and
"title" properties for the new entity because this this is consistent with the rest of the entities in the
model. We can pull the data for those properties from either of the two entities because the data is
the same ("Jim Waterman" and "Support Manager," respectively). Note that as you add properties
100
Spectrum™ Technology Platform 9.0
Chapter 7: Data Hub Module
to the new entity, they are prefaced with a [1] or [2], indicating the original entity that property came
from.
Each property must have a unique name. Therefore, if you want to merge two properties with the
same name but different data, you would need to modify the name of the property for one of the
entities by clicking a property, clicking the green arrow to open the Advanced Property Mapping
dialog box, and either accepting the default new name (which appends a number to the end of the
property name, such as "name2") or entering a new name.
For example, if our organization chart model included start dates for each entity, Original Entity 1
(the employee role) might have a start date of 04/20/2000 and Original Entity 2 (the management
role) might have a start date of 08/15/2004. If you wanted to include both start dates in the merged
entity, you could click "start date" for Original Entity 1, click the green arrow, and either accept "start
date2" or enter "original start date" in the New Name field.
6. Determine which relationships you want tied to each entity by clicking a relationship and then using
the blue arrows in between the entities in the Relationships field. In our example, we will keep both
"Reports To" relationships because they represent the relationships for Jim as an employee and as
a manager. Note that as you add relationships to the new entity, they are prefaced with "[1]" or "[2]",
indicating the original entity that relationship came from.
Unlike properties, each relationship does not need to have a unique name. Two relationships can
be merged into one new relationship by clicking the relationship, then clicking the green arrow to
open the Advanced Relationship Mapping dialog box, doing nothing with the Label and Unique ID
fields, and pressing OK. If you do merge two relationships into one, you will see it prefaced with
"[1,2]"to represent that the relationship came from both original entities.
If you want to retain two relationships that have the same name, you would need to modify the name
of the relationship for one of the entities by clicking the relationship, clicking the green arrow to open
the Advanced Relationship Mapping dialog box, and entering something in the Unique ID field. After
that, if the relationship has properties associated with it, you would also need to determine which
properties should be carried over from the left and right relationships to the new relationship.
For example, let's say that our organization chart model used titles instead of names and employee
numbers, and that one of the employees worked for two people with the title of "Director." To merge
those two relationships that say "Reports to Director" but keep them unique within the model, you
would need to click one of the relationships, click the green arrow, and enter a unique identifier of
some sort in the Unique ID field. In our case, that would probably be the name of the director, and
you would repeat this action for the other director so both relationships for the entity include the
respective director's name.
The completed Merge Entities dialog box for our example looks like this:
Master Data Management Guide
101
Relationship Analysis Client
The model for our example has been updated with just one entity for Jim Waterman. You can see that
the Marcus David entity (Jim's employee) is coming into the Jim Waterman entity, and the Tom Smith
entity (Jim's boss) is going out of the Jim Waterman entity.
Adding Properties
With an existing model open and at least one entity or relationship selected, click the Entities,
Relationships, or All button on the Editing ribbon in the Data tab. The Edit Properties dialog box
appears.
1. Enter the name of the new property in the Name field.
2. Select the type of the new property in the Type drop-down box. The following data types are supported:
Data Type
Description
Boolean
A logical type with two values: true and false.
Double
A numeric data type that contains both negative and positive double
-1074
-52
1023
precision numbers between 2
and (2-2 )×2
. In E notation, the
range of values is 4.9E-324 to 1.7976931348623157E308. For information
on E notation, see:
http://en.wikipedia.org/wiki/Scientific_notation#E_notation
Float
A numeric data type that contains both negative and positive single
-149
23
127
precision numbers between 2
and (2-2 )×2 . In E notation, the range
of values is 1.4E-45 to 3.4028235E38. For information on E notation, see:
http://en.wikipedia.org/wiki/Scientific_notation#E_notation
Integer
A numeric data type that contains both negative and positive whole
31
31
numbers between -2 (-2,147,483,648) and 2 -1 (2,147,483,647).
Long
A numeric data type that contains both negative and positive whole
63
63
numbers between -2 (-9,223,372,036,854,775,808) and 2 -1
(9,223,372,036,854,775,807)
String
A sequence of characters.
3. Add the value of the new property in the Value field.
4. Click Add.
5. Click OK.
Modifying Properties
1. With an existing model open and at least one entity or relationship selected, click the Entities,
Relationships, or All button on the Editing ribbon in the Data tab. The Edit Properties dialog box
appears.
2. Select the property whose value(s) you wish to change from the Name field.
102
Spectrum™ Technology Platform 9.0
Chapter 7: Data Hub Module
3. Enter new information in the Value field and click Modify.
4. Click OK.
5. Save the model.
Removing Properties
This feature enables you to manually remove properties associated with entities and relationships.
1. With an existing model open and at least one entity or relationship selected, click the Entities,
Relationships, or All button on the Editing ribbon in the Data tab. The Edit Properties dialog box
appears.
2. Select the property you want to remove from the Name field and click Remove.
3. Click OK.
4. Save the model.
Master Data Management Guide
103
Notices
©
2013 Pitney Bowes Software Inc. All rights reserved. MapInfo and Group 1 Software are trademarks
of Pitney Bowes Software Inc. All other marks and trademarks are property of their respective holders.
®
USPS Notices
®
Pitney Bowes Inc. holds a non-exclusive license to publish and sell ZIP + 4 databases on optical and
magnetic media. The following trademarks are owned by the United States Postal Service: CASS, CASS
Link
Link
Certified, DPV, eLOT, FASTforward, First-Class Mail, Intelligent Mail, LACS , NCOA , PAVE,
Link
PLANET Code, Postal Service, POSTNET, Post Office, RDI, Suite
, United States Postal Service,
Standard Mail, United States Post Office, USPS, ZIP Code, and ZIP + 4. This list is not exhaustive of
the trademarks belonging to the Postal Service.
®
Link®
Pitney Bowes Inc. is a non-exclusive licensee of USPS for NCOA
processing.
Prices for Pitney Bowes Software's products, options, and services are not established, controlled, or
™
approved by USPS® or United States Government. When utilizing RDI data to determine parcel-shipping
®
costs, the business decision on which parcel delivery company to use is not made by the USPS or
United States Government.
Data Provider and Related Notices
Data Products contained on this media and used within Pitney Bowes Software applications are protected
by various trademarks and by one or more of the following copyrights:
©
Copyright United States Postal Service. All rights reserved.
©
2013 TomTom. All rights reserved. TomTom and the TomTom logo are registered trademarks of
TomTom N.V.
©
Copyright NAVTEQ. All rights reserved
Data © 2013 NAVTEQ North America, LLC
Fuente: INEGI (Instituto Nacional de Estadística y Geografía)
Based upon electronic data © National Land Survey Sweden.
©
Copyright United States Census Bureau
©
Copyright Nova Marketing Group, Inc.
Portions of this program are © Copyright 1993-2007 by Nova Marketing Group Inc. All Rights Reserved
©
Copyright Canada Post Corporation
This CD-ROM contains data from a compilation in which Canada Post Corporation is the copyright owner.
©
2007 Claritas, Inc.
The Geocode Address World data set contains data licensed from the GeoNames Project
(www.geonames.org) provided under the Creative Commons Attribution License ("Attribution License")
located at http://creativecommons.org/licenses/by/3.0/legalcode. Your use of the GeoNames data
(described in the Spectrum™ Technology Platform User Manual) is governed by the terms of the Attribution
License, and any conflict between your agreement with Pitney Bowes Software, Inc. and the Attribution
License will be resolved in favor of the Attribution License solely as it relates to your use of the GeoNames
data.
ICU Notices
Copyright © 1995-2011 International Business Machines Corporation and others.
All rights reserved.
Permission is hereby granted, free of charge, to any person obtaining a copy of this software and
associated documentation files (the "Software"), to deal in the Software without restriction, including
without limitation the rights to use, copy, modify, merge, publish, distribute, and/or sell copies of the
Software, and to permit persons to whom the Software is furnished to do so, provided that the above
106
Spectrum™ Technology Platform 9.0
Copyright
copyright notice(s) and this permission notice appear in all copies of the Software and that both the
above copyright notice(s) and this permission notice appear in supporting documentation.
THE SOFTWARE IS PROVIDED "AS IS", WITHOUT WARRANTY OF ANY KIND, EXPRESS OR
IMPLIED, INCLUDING BUT NOT LIMITED TO THE WARRANTIES OF MERCHANTABILITY, FITNESS
FOR A PARTICULAR PURPOSE AND NONINFRINGEMENT OF THIRD PARTY RIGHTS. IN NO
EVENT SHALL THE COPYRIGHT HOLDER OR HOLDERS INCLUDED IN THIS NOTICE BE LIABLE
FOR ANY CLAIM, OR ANY SPECIAL INDIRECT OR CONSEQUENTIAL DAMAGES, OR ANY DAMAGES
WHATSOEVER RESULTING FROM LOSS OF USE, DATA OR PROFITS, WHETHER IN AN ACTION
OF CONTRACT, NEGLIGENCE OR OTHER TORTIOUS ACTION, ARISING OUT OF OR IN
CONNECTION WITH THE USE OR PERFORMANCE OF THIS SOFTWARE.
Except as contained in this notice, the name of a copyright holder shall not be used in advertising or
otherwise to promote the sale, use or other dealings in this Software without prior written authorization
of the copyright holder.
Master Data Management Guide
107