1
NetAnalyzer
Documentation
In-depth explanation of the program and its functions
Version 4
Carleton University
Summer 2015
Table of Contents
Specific Section Information .................................................................................................. 5
General...................................................................................................................................................... 5
Title Screen ............................................................................................................................................... 5
Main .......................................................................................................................................................... 6
Location Generator ................................................................................................................................... 6
General..................................................................................................................................................................6
NS2 ........................................................................................................................................................................6
OPNET ...................................................................................................................................................................6
CORE ....................................................................................................................................................................6
Dynamic Statistics ..................................................................................................................................... 7
Static Statistics .......................................................................................................................................... 7
Statistics Summary .................................................................................................................................... 7
Spreadsheet Creator ................................................................................................................................. 7
Full Statistical Run Through ...................................................................................................................... 8
Animations and Graphs............................................................................................................................. 8
GraphViz .................................................................................................................................................... 8
goInput ...................................................................................................................................................... 9
Steps Taken Between Version 1 & 2 ....................................................................................... 9
Steps Taken Between Version 2 & 3 ....................................................................................... 9
Steps Taken Between Version 3 & 4 ....................................................................................... 9
Location Generator Output File Format ............................................................................... 10
Statistic Output File Formats ............................................................................................... 10
Individual Dynamic Scenarios ................................................................................................................. 10
Average Neighbours............................................................................................................................................10
Average Path Length ...........................................................................................................................................10
Components ........................................................................................................................................................10
Diameter .............................................................................................................................................................10
Most Neighbours.................................................................................................................................................10
Node Centrality ...................................................................................................................................................10
Links ....................................................................................................................................................................10
Coverage .............................................................................................................................................................11
Neighbourhood Instability ..................................................................................................................................11
Clustering Coefficient ..........................................................................................................................................11
Degree of Randomness/Predictability.................................................................................................................11
2
Run Time .............................................................................................................................................................11
Individual Static Scenarios ...................................................................................................................... 11
Average Neighbours............................................................................................................................................11
Average Path Length ...........................................................................................................................................11
Components ........................................................................................................................................................11
Diameter .............................................................................................................................................................11
Most Neighbours.................................................................................................................................................11
Node Centrality ...................................................................................................................................................11
Summary of Dynamic Scenarios.............................................................................................................. 12
Average Neighbours Summary ...........................................................................................................................12
Average Path Length Summary ..........................................................................................................................12
Components Summary ........................................................................................................................................12
Diameter Summary .............................................................................................................................................12
Files .....................................................................................................................................................................12
Links Summary ....................................................................................................................................................12
Coverage Summary .............................................................................................................................................12
Average Instability Summary ..............................................................................................................................12
Average Clustering Summary ..............................................................................................................................12
Predictability Summary .......................................................................................................................................12
Run Time .............................................................................................................................................................12
Summary of Static Scenarios................................................................................................................... 13
Average Neighbours Summary ...........................................................................................................................13
Average Path Length Summary ..........................................................................................................................13
Components Summary ........................................................................................................................................13
Diameter Summary .............................................................................................................................................13
Files .....................................................................................................................................................................13
Next Steps / Future Improvements ...................................................................................... 13
Improve GUI ............................................................................................................................................ 13
Linux Support .......................................................................................................................................... 13
The Number of Shortest Routes Changed Every Time Interval .............................................................. 13
MATLAB Visualization ............................................................................................................................. 13
Animation Control................................................................................................................................... 14
General Code Clean-up ........................................................................................................................... 14
Static Statistics ........................................................................................................................................ 14
3
Location Generator ................................................................................................................................. 14
Dynamic Statistics ................................................................................................................................... 14
Spreadsheet Creator ............................................................................................................................... 14
Open Source Adaptation......................................................................................................................... 14
3D Compatibility ..................................................................................................................................... 14
Useful Links ......................................................................................................................... 15
4
Specific Section Information
General
Assumes that user defined sequence is only used is specified file names and not in any folder
along the path.
ex.
C:\50 test\Scenario50-1.txt (If user chooses to look for matching sequence of '50'
program will crash as 50 is found in folder name)
Title Screen
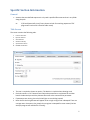
The screen contains the following tabs:
1.
2.
3.
4.
5.
Location Generator
Dynamic Statistics
Static Statistics
Statistics Summary
Spreadsheet Creation
6. MATLAB Visualization
The user is required to choose an option. The decision is implicit when selecting a tab.
Each tab contains a “Go” button that will write the parameters to a plaintext file and then
launch the Net Analyzer with the plaintext file name as the command line parameter.
If parameters are missing, then the GUI will give an error dialog instead.
Note: the file the GUI generates will appear to be a single string of text in Notepad. There are
carriage return characters, they simply do not register in Notepad for some reason (the Net
Analyzer program will read the file correctly).
5
Main
Reads input from a plaintext file
File name is taken as a command line parameter
If more than one parameter is entered (or if no parameter is given) then the program will ask for
the name of the plaintext file
Location Generator
General
User is required to enter desired transmission range and refresh rate to be used in the statistical
analysis. The GUI gathers the information using spinboxes, with minimum values of 1 (integers
only).
Default transmission range: 250.
When using multi-file option, the function used (FindNextFile) does not search in any set order,
the order it searches for files is system dependent.
This stage of program ignores z-coordinate positions
On second line of file, last number is 0 for normal mode and 1 for troubleshoot mode. Only used
in matlab section but seems to be useless and causes program crash
NS2
Looks for .txt files
Generation can take over 30 minutes for scenarios that have one or more node with really small
event times (less than 0.00001)
OPNET
Looks for .xml files
Generation can take long time if too many destination changes (more than 10,000)
Assume that folder containing trajectory files has exact same name as setup file (not including
extension)
Assumes that trajectory files have the node number specified at the end of the file name in the
format: 'filename.#.trj '.
Determines the number of nodes from setup file (.xml) by looking for node names that are only
numbers
ex.
<node name="1" model=...
User is required to specify the x and y axis values as that information isn't contained within the
scenario files.
When using multiple files, make a copy of the setup (.xml) file for each folder containing
trajectory files, and rename them to match.
In scenarios tested, the input values are: transmission range = 1000, refresh = 1, runtime = 2000,
x=2000 and y=4000
CORE
Looks for .imn files
Assume both scenario and setup file have same name with different extensions
Skips over static nodes (defined by model 'router')
6
Find the amount of nodes by looking for specific model (mdr) after finding the proper type
(router)
ex.
node n1 {
type router
model mdr
Dynamic Statistics
If run time is too large program will crash as it initializes arrays using that number
ex. int* location_time = new int[run_time_int*num_nodes*2];
(Known crash when trying to run program for 70 node scenario with run time over 500,000)
User can choose to create graphViz visualization for scenario within the run time for any
multiple of the refresh rate.
Discounts all links created at time 0 when calculating total and average values
Viewed some occurrences (very few) where code showing '% complete' doesn't work or is not
exact (ex. 499/1000 50% complete)
Link changed statistics doesn't match numbers from scenario files (NS2); this could be caused by
location generation only being per second and not smaller. Because the program only generates
locations of the nodes every second, links can be broken and created within a second’s time.
These changes would go unnoticed by the program.
Static Statistics
Could be possible to get rid of StaticStatistics function and just integrate this section into the
location generator
Opnet and Core scenarios only tested for single file. Further testing should be done (including
multi-file testing)
Statistics Summary
Assumes that individual statistics have been created for select scenarios already and output files
and folder are in same directory as scenario files
Assumes all files within given folder with proper extension and matching sequence are scenarios
with output folder already generated. The program will not look if, for example, '.txt' files (NS2)
within folder are scenarios and not just random text files. The program will run on all text files
within the folder
Summary files are held within folder with following format: '*sequence*.summary' (*...* stands
for user specified data)
Run time must be less than the total run time of each individual scenario. Don’t forget to take
into account the refresh rate.
For links summary, total amount of added and broken links at end of file seem to be too large by
a factor of ten. This should be reviewed to see if this is actually the case and to fix it.
Spreadsheet Creator
At current stage of program only functions for NS2 type scenarios with scenario file name of
'Scenario#-#.txt' format. Also only works for folders containing scenarios with 10-20...-100
(multiples of 10) nodes with a max of 25 scenarios for each node set. Only works with this
7
format because it uses the number within the file name to keep track of the data's position in
the tables.
Note that max number of scenarios must be changed within code (controlled by variable:
max_scenario)
For Dynamic: Creates 3 spreadsheets within file; the first is a summary of links, the second is the
statistics at time 1, and the last is the statistics at the run time.
For Static: Creates single spreadsheet showing all statistics
Statistic Summary must be run for the files BEFORE creating a spreadsheet, the Spreadsheet
Creator relies of the 'files.txt' output from the summary to locate the included files.
The sequence used to match for files must be the exact same sequence used to create the
summary files
Spreadsheet is created within summary folder. Name of file is: '*sequence*.spreadsheet.xml'
(*...* stands for user specified data)
Full Statistical Run Through
Only for dynamic scenarios
Automatically creates graphViz visualizations at end of run time
If user chooses single file option and that file is not contained within the program directory then
the Dynamic Statistics portion of the program won't work as it uses doesn't account for the file
path when the user inputs the file location (assumes file is in same directory as program)
Animations and Graphs
Assumes all files are within their own scenarios given output folder with format:
‘Filename output\’
When animation is running, keeps animation figure in front of screen so animation doesn’t plot
onto other figures. User must pause the animation in order to view other figures.
Program creates array using the run time and the amount of nodes:
location = zeros(num_nodes*run_time, 4);
If run time is too large, it may cause program to crash as too much memory is used up. Warning
shows if number exceeds 1 million.
Valid animation controls become visible/invisible depending on if they can be used or not.
Animation resets to 0 if run time is hit. User can view the scenario at the run time if the
animation is paused and by dragging the slide bar all the way to the right.
GraphViz
GraphViz visualizations are named in following format: 'graphViz_#.dot' where the # is the time
at which the visualization was created (if run for static scenario, '#' gets replaced with word
'static')
8
goInput
Function of the GUI
Runs when the user clicks “Go”
Collects all the input of the user and compiles it into a plaintext file with default name in.put.
In.put is then passed as a command line parameter to NetAnalyzer.exe, which will then read it
to obtain parameters for statistics calculations.
Steps Taken Between Version 1 & 2
See 'Future Version - Fixes' file for explanation on the improvements/fixes that Jordan suggested be
done to program.
Made all sections of program accessible from one file
Made program compatible with all file types
Added ability to do multiple files from single folder at once
Organized outputted files into single folder
Created section to take summary statistics from batch of files in single folder
Created section to take batch of NS2 scenarios and output statistics in table format that can be
read in Excel
Added ability to do both dynamic and static network scenarios
Added simple text based menu system
Added simple controls for MATLAB animation
Steps Taken Between Version 2 & 3
Added multiple new outputs to the Dynamic Statistics section (coverage, surface graph,
neighbourhood instability, average instability, clustering coefficient, average clustering, and
predictability)
Clarified instructions on how to handle OPNET scenarios
Added additional outputs to the dynamic statistics summary (coverage summary, instability
summary, clustering summary, and predictability summary)
Fixed minor bugs in the MATLAB program and added the ability to graph additional outputs
(coverage, instability and clustering)
General code cleanup, removing old debugging code and adding comments for clarity
Steps Taken Between Version 3 & 4
Created a GUI using Qt
Changed parsing of NS2 files (now supports Bonn Motion)
Changed main to read in parameters from a text file instead of prompting the user to enter
them manually
9
Location Generator Output File Format
First line is the name of the scenario file that the output file was generated from. Second line gives basic
scenario information (from left to right); first number is number of nodes, second number is refresh
rate, third is the transmission range, fourth and fifth are the x and y axis and the last is 0 for normal
mode and 1 for troubleshoot mode. After this is each nodes locations per second until they become
static. The format for each line is (from left to right); First number is the given node, second is the time,
third is x position, the final is the y position. Notes that node has reached its destination by line: "Node #
has reached its destination.”. At the end of the file, after '#', the final number is the total time the
scenario needs to become static.
Statistic Output File Formats
(Numbers as being read from left to right)
Individual Dynamic Scenarios
For each different statistics file the first number in each given line is always the time, from 0 to the given
run time. Explanation of all statistics can be found in user manual under Statistics Calculated section.
Average Neighbours
Number after time is average neighbours number.
Average Path Length
Number right after time is average path length in hops, then beside that is average path length in
meters.
Components
Number right after time is the number of components in scenario at given time.
Diameter
Number after time is diameter in hops, then beside that is the diameter in meters.
Most Neighbours
The numbers following the time are the nodes that share the most node neighbours at given time.
Number within circle brackets is the number of neighbours each of these nodes have.
Node Centrality
The numbers following the time are all the nodes sharing the most node centrality.
Links
Number beside time is amount of links created at given time, number beside that is number of links lost.
Total added links number at end is the total amount of added links from time 1 to run time. Same for
Total broken links. Average links added per second number is the average amount of links added from
time 1 to run time. Same for average links broken per second. Link changes number represents the total
number of times a link was created or broken for each node from time 1 to run time. Following that is
each nodes individual link change number.
10
Coverage
The number following the time is the current percent coverage of the defined area. It approximates how
much of the area has had a node pass through, based on dividing the area into a 100-by -100 grid and
keeping track of the cells. At the very bottom it outputs an array of the values of each cell (how much
time it has been occupied). A separate output, called surface_graph, provides an alternate format of it
that can be copied into MATLAB to visualize the node distribution over time.
Neighbourhood Instability
The program outputs the instability of each node (number of link changes divided by the number of
neighbours) over a ten-second period, which is indicated by the first two numbers in each row. The
average of all nodes over the run time is listed at the bottom. There is a separate output
(average_instability) which gives the average of all nodes at each point in time.
Clustering Coefficient
The numbers following the time are the clustering coefficients of each node (ratio of radio links among
neighbours and the number of neighbours) going from first to last. The average of all nodes over the run
time is listed at the bottom. There is a separate output (average_clustering) which gives the average of
all nodes at each point in time.
Degree of Randomness/Predictability
The output is a single value indicating the approximate predictability of the movement of the nodes.
Run Time
Run time for statistics that user specified.
Individual Static Scenarios
Explanation of all statistics can be found in user manual under Statistics Calculated section.
Average Neighbours
Average neighbours number.
Average Path Length
First is the average path length in hops, then beside that is average path length in meters.
Components
The number of components in the scenario.
Diameter
First is the diameter in hops, then beside that is the diameter in meters.
Most Neighbours
The numbers are the nodes that share the most node neighbours. Number within circle brackets is the
number of neighbours each of these nodes have.
Node Centrality
The numbers are all the nodes sharing the most node centrality.
11
Summary of Dynamic Scenarios
For each different statistics file the first number in each given line is always the time, from 0 to the given
run time. Explanation of all statistics can be found in user manual under Statistics Calculated section. All
number are simply averaged by added each number from every included file then dividing by the
amount of files used. The average number at the bottom of each file is calculated by adding all the
numbers for the given run time then dividing by the run time.
Average Neighbours Summary
Number after time is average neighbours number.
Average Path Length Summary
Number right after time is average path length in hops, then beside that is average path length in
meters.
Components Summary
Number right after time is the average number of components in the scenarios at given time.
Diameter Summary
Number after time is average diameter in hops, then beside that is the average diameter in meters.
Files
List of all scenarios used to create summary files.
Links Summary
Number beside time is amount of average links created at given time, number beside that is average
number of links lost. Total added links number at end is the total amount of added links from time 1 to
run time for all scenarios. Same for Total broken links. Average links added per second number is the
average amount of links added from time 1 to run time. Same for average links broken per second.
Coverage Summary
Number beside time is the average percent coverage of the scenarios at the given time.
Average Instability Summary
The output lists a time range of 10 seconds, followed by the average neighbourhood instability of the
scenarios at the given time.
Average Clustering Summary
Number beside time is the average network clustering of the scenarios at the given time.
Predictability Summary
Number given is the average degree of randomness/predictability over the entire run time.
Run Time
Run time for statistics that user specified.
12
Summary of Static Scenarios
Explanation of all statistics can be found in user manual under Statistics Calculated section. All number
are simply averaged by added each number from every included file then dividing by the amount of files
used.
Average Neighbours Summary
Average neighbours number.
Average Path Length Summary
First is the average path length in hops, then beside that is average path length in meters.
Components Summary
Average components in all the scenarios.
Diameter Summary
First is the average diameter in hops, then beside that is the average diameter in meters.
Files
List of all scenarios used to create summary files.
Next Steps / Future Improvements
Improve GUI
Adding an icon for the executable and increasing aesthetic quality
Currently, the GUI needs to either be run from Qt Creator or requires some .dll files to be copied
from the Qt installation. The next step will be to build a singular executable that can be
deployed separately from Qt. Information on this is available here: http://doc.qt.io/qt5.4/deployment.html. This applies to both the Windows and Linux versions.
Better communication of crashes/errors in NetAnalyzer.exe
Linux Support
To do this, the source code of the application must be pasted into a Linux C++ environment
(GCC for example)
Animation_graphs.m should work on the Linux version of MATLAB with no issues
(although not tested)
The GUI will need to be recompiled for Linux
The Number of Shortest Routes Changed Every Time Interval
Add the ability to calculate how many shortest paths change every time Interval
Perhaps do this by storing the shortest path for each node in an array of length num_nodes
This would store the path from 1 to 2, 1 to 3, etc.
Add one to a counter every time one of these values changes
MATLAB Visualization
Have the GUI automatically execute the animations_graphs function
13
Animation Control
Further work on animation controls
Could generate more user friendly GUI for program using Matlabs GUIDE tool
Add ability to create graphs from the summary files. Should be simple as the only difference is
no animation.
General Code Clean-up
Look through all the code in the program and tidy it up, make the program run faster and more
efficiently. Some specific things that can be done are:
Organize sections of re-used code into functions
Re-name variables for increased clarity
Get rid of un-used/needed variables
Make sure all dynamically allocated variables are freed before exiting functions
Create error checking at every step of program to prevent crashes
Static Statistics
Further test static Core scenarios (only tested for 1 scenario)
Location Generator
Create ability to generate node locations at less than 1 second intervals for more accuracy, also
add ability to generate locations only up to certain point and not until static to speed up
process.
Dynamic Statistics
The “degree of randomness/predictability” code is not the most efficient, and tends to cause
stack overflow issues if the 4-dimensional predictability array is too large. A more efficient
implementation may fix these issues.
Spreadsheet Creator
Have the spreadsheet creator work with NS2 files that are not named ScenarioX-Y.txt
Open Source Adaptation
Add the program to Source Forge. Will be useful when GUI is programmed and MATLAB
integration is complete.
3D Compatibility
Allow the program to handle 3D node movement. This will require massive changes to the
program, and is not to be taken lightly.
14
Useful Links
The following are links I've found useful to help create the program.
http://www.cplusplus.com/
http://www.cplusplus.com/reference/regex/
http://blogs.msdn.com/b/brian_jones/archive/2005/06/27/433152.aspx
http://home.fnal.gov/~stoughto/build/graphviz-2.22.2/windows/cmd/gvedit/GVedit.html
http://pdcurses.sourceforge.net/ (may be used to implement arrow key menu control)
http://www.mathworks.com/help/matlab/creating_guis/writing-code-for-callbacks.html
http://www.mathworks.com/help/matlab/ref/uicontrol_props.html - bqxoipv
http://www.mathworks.com/videos/creating-a-gui-with-guide-68979.html
http://www.mathworks.com/discovery/gallery.html
http://doc.qt.io/
http://www.site.uottawa.ca/~lucia/courses/2131-05/labs/Lab3/CommandLineArguments.html
15