1
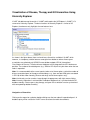
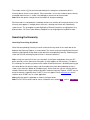
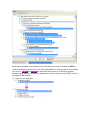
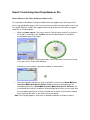
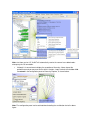
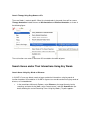
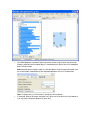
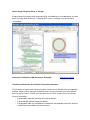
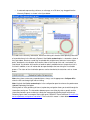
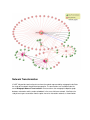
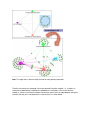
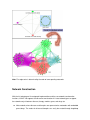
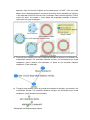
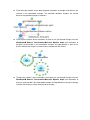
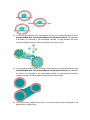
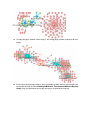
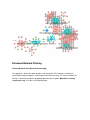
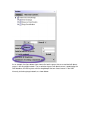
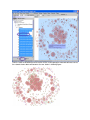
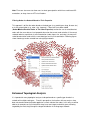
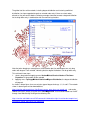
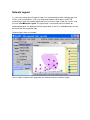
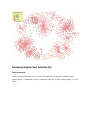
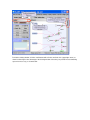
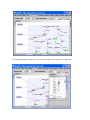
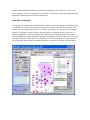
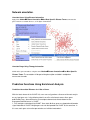
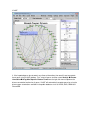
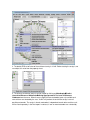
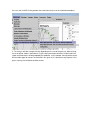
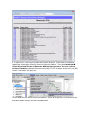
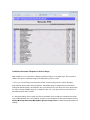
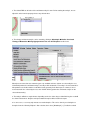
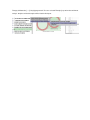
VisANT 4.0 User Manual
Contents
Visualization of Disease, Therapy and GO Hierarchies Using Hierarchy Explorer
......................................................................... 2
Navigation of Hierarchies ............................................... 2
Searching the Hierarchy .................................................. 3
Searching Terms Using Key Words ...................................... 3
Search Terms Using Gene/Drug Names or IDs ................................ 5
Search Disease or GO Terms Using Gene Names or IDs ................... 5
Search Therapy Using Drug Names or IDs................................ 7
Search Genes and/or Their Interactions Using Key Words ................... 7
Search Genes Using Key Words of Diseases ............................. 7
Search Drugs Using Key Words of Therapy ............................... 9
Visualize the Hierarchies of the Node's Hierarchical Information ............. 9
Network Transformation .................................................. 11
Network Construction .................................................... 13
Enhanced Network Filtering .............................................. 18
Filtering Network Using Biomedical Knowledge ........................... 18
Filtering Nodes in a Network Based on Their Properties ................... 21
Enhanced Topological Analysis ........................................... 21
Network Legend .......................................................... 23
Enhanced Graphic User Interface (UI) .................................... 24
Docking windows: .................................................... 24
Node/edge customization.............................................. 27
Network annotation. ..................................................... 28
Annotate Genes Using Disease Information .............................. 28
Annotate Drugs Using Therapy Information .............................. 28
Prediction Functions Using Enrichment Analysis .......................... 28
Prediction Associated Diseases for A Set of Genes ....................... 28
Prediction Associated Therapies for A Set of Drugs ....................... 33
This user manual describes the new features available in VisANT 4.08. Manuals for the functions
developed before VisANT 4.0 can be found at: http://visant.bu.edu/vmanual/
Visualization of Disease, Therapy and GO Hierarchies Using
Hierarchy Explorer
VisANT 4.0 add two new hierarchies in VisANT and therefore the GO Explorer in VisANT 3.5 is
renamed as Hierarchy Explorer. The basic functions of Hierarchy Explorer is similar to GO
Explorer, therefore we only highlights the new features here.
As shown in the figure above, there are four disease hierarchies available in VisANT, which
however, is a temporary solution because among the four databases where disease-gene
associations are collected, only KEGG Disease database adopts ICD-10 (International
Classification of Disease). The other disease databases will be integrated into ICD-10 whenever
possible. The number of annotated genes (e.g., 2529 for ICD-10) will only be shown when the tree
node is expanded.
Note: it is recommended that the current species to be set as Homo sapiens so that the number of
disease associated gene (or therapy associated drugs, e.g., there are total 2529 genes annotated
in ICD-10) will be shown correctly (disease and drugs are for Homo sapiens only).
Note: the hierarchy can be saved as image through the popup menu with right mouse-clicking.
Note: hierarchy information is retrieved from Predictome database that is synchronized with GO
database monthly. Disease-gene, drug-therapy, and gene-GO association are also synchronized
with corresponding database monthly
Navigation of Hierarchies
Clicking on the expansion symbol or double-clicking over the tree node will expand/collapse it. A
database query will be sent to the VisANT server to retrieve the node’s descendents:
The number shown in [ ] for each tree node indicates the total genes annotated under this
hierarchy branch for the current species. Other information, such as the number of genes directly
annotated under the term, is shown in the tooltip by a mouse-over of the tree node.
Note: When the species changes these information will change accordingly.
Each tree node is associated with a checkbox to allow user selection of hierarchy branches. If the
hierarchy term appears in multiple places of the tree, selecting one of them will automatically
select the rest. This also applies to node highlighting. Different hierarchies are highlighted using
different colors. GO Terms under different categories are also highlighted using different color.
Searching the Hierarchy
Searching Terms Using Key Words
Select the corresponding hierarchy to search, and enter the key words in the search box at the
bottom of the Hierarchy Explorer, as shown below. The search results are the paths from the terms
containing (highlighted) the key words to the root of the corresponding hierarchy. Following figure
shows the result of searching key word “inflam” in disease hierarchies:
Note: usually the search will results in the hundreds (in the figure shown below, there are 237
paths returned), or even thousands of the paths (usually happens for GO hierarchy). To address
this challenge, the searching is processed in another thread and the tree is disabled (meaning you
will not be able to click the tree nodes) and the number of the paths being added to the tree is
shown in the status bar (bottom of the above figure). At the same time, you can still play with the
network. Because of the large number of the paths shown the Hierarchy Explorer, VisANT may run
out of the memory, especially when VisANT is run as an Applet. Please reference here for the
solutions when VisANT runs as a local application.
Note: partial key word is supported as shown in the figure below
Note: For GO, GO id can be used for search, it however must stat with GO:, such as GO:0019385
By default the complete list of child terms for the hierarchy term shown in the path will NOT be
shown when display the path unless it has been queried before. In order to know all its child nodes,
user can first collapse then expand the interested hierarchy term in the Hierarchy explorer.
Following figure shows the result of such operation for the term "response to virus[107]" (shown at
the bottom of above figure):
Search Terms Using Gene/Drug Names or IDs
Search Disease or GO Terms Using Gene Names or IDs
The search box at the bottom of Hierarchy Explorer does not support search of Disease or GO
terms using gene/protein names or IDs unless the name is part of the term description, such as the
case of p53. However, VisANT does support indirect search of disease or GO terms using gene
names/IDs as illustrated below:
1. Make sure Homo sapiens is the current species. Enter the gene names/IDs (e.g. pten) in
the VisANT's search box in the ToolBox, and click the Search button, all interactions
associated with pten will be shown:
Note: in the case there is no interaction of pten, it will still be shown in the screen so long
as this gene exist in Entrez Gene database.
Alternatively, you can add this gene to the network as shown below:
2. Select the node pten and query its disease annotation using the menu NodesDisease
Annotation Use Most Specific Disease Terms, and then annotate pten with GO
annotation by the menu : NodesGO Annotation Use Most Specific GOTerms, The
associated disease and GO annotations will be available when mouse over the node. And
the corresponding hierarchies of these annotation will be shown in the Hierarchy Explorer
when clicking on the node, as also shown in the figure below:
Note: For illustration purpose, some of the associated annotations have been removed
Note: start from version 3.5, VisANT will automatically resolve the name of user-added nodes
when query the GO annotation.
3. Although it is convenience to display the annotation of hierarchy, it does impact the
performance and you may want to turn off this function: simply uncheck the checkbox Link
to network in the configuration panel of Hierarchy Explorer, as shown below:
Note: The configuration panel can be activate/deactivated by the small button circled in above
figure..
Search Therapy Using Drug Names or IDs
The menu Nodes is context specific. When the selected node is drug node, there will be a menu
Therapy Annotation instead of menus of GO Annotation and Disease Annotation, as shown in
the following figure:
The rest functions are same as disease or GO annotations for nodes of genes.
Search Genes and/or Their Interactions Using Key Words
Search Genes Using Key Words of Diseases
In VisANT 3.5 users are able to search of genes and/or their interactions using key words of
functions based on GO annotation. In VisANT 4.0, genes can now be searched using key words of
disease, as illustrated below:
1. In the search box of Hierarchy Explorer, select Disease as the target hierarchy for the
searching, and enter the key word such as "breast cancer", and click Search button (for
detail, following the session Searching Terms Using Key Words), 73 paths appears:
2. The OMIM database annotated 5 genes for breast cancer, Drag the term from Hierarchy
Explorer and drop into the network panel. A metanode of the disease with all 5 embedded
genes will be created
Note: before drag the network, make sure that the options (click the expansion button near
the search button shown below) of the drag&drop operation are set as shown below:
Note: To drag a term, first left-click on it, then drag it to the network
3. If interested, query of all known interactions of 5 genes are illustrated in the figure below, or
user can query interactions between 5 genes only.
Search Drugs Using Key Words of Therapy
Simply change the hierarchy to be searched to Drug, and following the same procedures to search
genes using key words of diseases. Following figure shows an example using the key word
‘inflammatory’ :
Interactive Visualization of GO Hierarchy in A Network
Back to main manual
Visualize the Hierarchies of the Node's Hierarchical Information
The hierarchies of a given term is defined as paths from the term to the root of the corresponding
ontology. Because terms may have multiple ancestors, they may therefore have many different
paths to reach the root. In VisANT, there are three cases in which a node will have associated
hierarchy information:
•
A gene/protein node with queried disease/GO annotations
•
A drug node with queried therapy annotations
•
A gene/protein node, or a metanode of a subnetwork, with predicted disease/GO functions
resulted from the annotation enrichment analysis
•
A metanode representing a disease, or a therapy, or a GO term (e.g. dragged from the
Hierarchy Explorer) as shown in the figure below.
If a node has the hierarchy information, left mouse-clicking will show the corresponding hierarchies
of associated terms in the Hierarchy Explorer if the Link to network option is selected as shown in
the figure above. Because a node may associated with multiple terms and terms have multiple
paths; therefore the visualization of hierarchies takes a little time to finish and is carried out in a
new thread. Visualization of hierarchies of another node is prohibited unless the previous task is
finished. In addition, users will not be able to expand/collapse the tree during the visualization
process. The status of the visualization process can be checked at the status bar such as shown
below.
Note: when there are too many expanded terms, always use the popup menu Collapse All to
clean the GO tree through right mouse-clicking.
Note: Uncheck the Link to network option in the configuration panel to enhance the performance
Updated Exploratory Navigation
Starting from an initial gene/drug of interest, exploratory navigation allows you to walk through the
interactions one by one. The interactions between genes are either physical or genetic and the
interactions between genes and drugs indicate the corresponding binding targets of the drugs.
Following figure shows an example starting with gene CACNA1D. Please reference this macro link
for the exploratory navigation of nteractions. The result of this macro is shown below:
Network Transformation
VisANT 4.0 provides two function to transform the network represented by metagraph to facilitate
the study of the network from different perspective. The two functions are available under the
menu Metagraph/Network Transformation. One transforms the metagraph to bipartite graph
between metanodes and the nodes embedded. In the case of disease network, it facilitates the
study disease-gene association from the point view of an interaction network, as shown below:
Note: The edge color is determined by the color of corresponding metanode
The other transforms the metagraph into a co-metanode interaction network, i.e., it creates an
interaction network between components embedded in a metanode. In the case of disease
network, it creates an interaction network of co-disease genes where an edge between two genes
indicates that they are associated with the same disease, as shown below:
Note: The edge color is determined by the color of corresponding metanode
Network Construction
With the full advantage of its metagraph implementation and the new network transformation
functions, VisANT 4.0 supports the convenient construction of 11 total network types to support
the network analysis between disease, therapy, modules, gene, and drugs etc.
Meta-network, where diseases and therapies are represented as metnaodes with embedded
genes/drugs. The nodes for diseases/therapies can easily be created through drag&drop
operations from the Hierarchy Explorer to the network panel in VisANT. There are 4 total
options for the drag&drop operation, and two of them allows for the embedding of sub-terms
in the metanodes to achieve the multi-scale visualization (Please reference previous VisANT
manual for detail). An example is shown below with expanded metanodes of diseases
represented using convex polygons:
Disease-disease network, where only collapsed metanodes of diseases are retained in the
metanetwork example. The correlations between diseases are inferred based on shared
components (genes) between two metanodes, or based on the interactions between
components in two metanodes.
Therapy-therapy network, where only collapsed metanodes of therapies are retained in the
metanetwork example. The correlations between therapies are inferred based on shared
components (drugs) between two metanodes.
Disease-therapy network, where both collapsed metanodes of therapies and diseases are
retained in the metanetwork example. The correlations between therapies are inferred
based on integrated drug-target associations.
Disease-gene network, where metanodes of diseases are transformed through the menu
MetaGraph Network Transformation Create Bipartite Graph and metanodes of
therapies are discarded in the metanetwork example. An edge between a gene and a
disease indicate that the gene is known to be associated with the disease.
Therapy-drug network, where metanodes of therapies are transformed through the menu
MetaGraph Network Transformation Create Bipartite Graph and metanodes of
diseases are discarded in the metanetwork example. An edge between a drug and a therapy
indicates that the drug is known to be part of the therapy.
Co-disease gene network, where metanodes of diseases are transformed through the menu
MetaGraph Network Transformation Create Co-Metanode Network and metanodes
of therapies are discarded in the metanetwork example. An edge between two genes
indicates that both are known to be associated with the same disease.
Co-therapy drug network, where metanodes of therapies are transformed through the menu
MetaGraph Network Transformation Create Co-Metanode Network and metanodes
of diseases are discarded in the metanetwork example. An edge between two drugs
indicates that both are known to be associated with the same therapy.
Disease-gene-drug network, where genes in the disease-gene network are queried for the
potential drugs targeting them
Therapy-drug-gene network, where drugs in the therapy-drug network are queried for their
targets.
Disease-gene-drug-therapy network, where metanodes of both diseases and therapies are
transformed through the menu MetaGraph Network Transformation Create Bipartite
Graph. Drugs are queried for their targets and genes are queried for the drugs.
Enhanced Network Filtering
Filtering Network Using Biomedical Knowledge
This approach is to filter the nodes based on their annotation: GO annotations and disease
classifications for genes/proteins, and therapy classifications for drugs. For a given network, this
filtering is carried out through the drag&drop operation with the option ‘Metanode of existing
components only’, as shown in the following figure:
As an example, the figure below shows how to find out the genes that are associated with breast
cancer in the drug-target network. The association of genes with breast cancer is predicted by the
GAD database, the filtering starts with the drag&drop of the term ‘breast cancer’ in the GAD
hierarchy to the drug-target network, as shown below:.
Color the node associated with breast cancer in blue, and ungroup the metanode of breast cancer,
the network shown above will becomes the one shown in following figure:
Note: There are also menus to allow users to select genes/proteins which have no disease/GO
annotations, or drugs have no ATC classifications.
Filtering Nodes in a Network Based on Their Properties
This approach is to filter the nodes based on the data type (e.g., protein/gene, drug, disease etc.)
or visual customization (e.g., color, size, shape etc.). Two menus have been added
(NodesSelect/Deselect Nodes of The Same Properties) to allow the user to select/deselect
nodes with the same data or visual properties based on the current node selection. If the current
selected node has a particular visual customization (node shape, size, and color), the menu will
select/deselect other nodes with the same data type and visual customization. Following figures
shows how drugs can be selected from a drug-target network.
Enhanced Topological Analysis
It is important for many topological analyses to be performed on a specific type of node in a
network with multiple node types. From this perspective, the functions of these analyses have
been enhanced to allow them to be applied on a select subset of the nodes. In this way, we will be
able to, for example, easily find out which drugs have most targets and which genes are being
targeted by the most drugs through the degree distribution in the drug-target network.
The global statistics of the network, including degree distribution and clustering coefficient
distribution, has been upgraded to work on selected nodes only if there are select nodes,
otherwise, they will work as before. Following example show how to create a degree distribution
for the drug nodes only in combination with the new filtering functions.
Note that when dragging a rectangle over the distribution plot, for node degree one, only drug
nodes with degree=1 are selected, indicating that the degree distribution is for drug nodes only.
This achieved in tow steps:
1. select a drug node and applying menu NodesSelect/Deselect Nodes of The Same
Properties. All drug nodes will be selected
2. Applying menu TopologyGlobal StatisticsDegree Distribution, the degree distribution
will pop out.
As shown in above figure, there are only four type of degree for drugs: 1, 2, 3 and 5. The network
shown in above figure can be downloaded at:
http://visant.bu.edu/sample/visml_files/Breast_cancer_gene_drug_no_legend.xml and can be
loaded into VisANT directly using the menu FilesOpen URL. It can also be loaded into VisANT
through Java Web Start by clicking on the following URL:
http://visant.bu.edu:8080/vserver/DAI?command=link&location=http://visant.bu.edu/sample/visml_
files/Breast_cancer_gene_drug_no_legend.xml
Network Legend
It is necessary to distinguish the types of nodes in a network comprised of mixed data types and
various visual customizations, such as the drug-target network shown above. VisANT 4.0
automatically creates the network legend node such as the one shown in both Fig. 2 and 3 using
the menu ViewNetwork Legend. The legend node is a metanode and can therefore be
collapsed/expanded. The appearance of the legend node, as well as its embedded node, can also
be customized like any general node.
Following figure shows an example:
Here is another example where drug nodes are sized based on the number of targets
Enhanced Graphic User Interface (UI)
Docking windows:
There are two docking windows in this new release: ToolBox/Hierarchy Explorer, by default is visible;
property window---a window that is used to customize the node/edge, as well as global properties, as shown
below:
To hide the docking window, click the small button outlined in the small red circle (upper right corner) as
shown in above figure. One advantage of the docking windows is that they can provide increased working
space when necessary, as shown below:
To make docking window, either mouse over or click the button on the side bar, as shown below:
Docking window will become invisible when you leave the window for several seconds, or click on some
other components, such as the empty place in the network. You can however the fix the docking window by
clicking the small button (red circle) shown in above figure.
Node/edge customization
One key purpose to implement the docking window in VisANT is to make the properties customization easier
and extensible. As shown in the above figure, the properties window is in the style of spread sheet, with
common user convention to make it easier to use. When node(s)/edge(s) are selected, all corresponding
properties are editable except those that are grayed. Properties are grouped and these groups can be
collapsed/expanded. As shown in the figure below, Edge properties and global properties are collapsed
while node properties are expanded in which properties of node label are however collapsed. As also shown
in the figure below, the column width can be changed in case the name of property is too long. Clicking on
each property row will also display the detailed explanation as shown for node shape in the figure below.
Network annotation.
Annotate Genes Using Disease Information
Apply menu NodesDisease Annotation Use Most Specific Disease Terms to annotate the
genes for their associated diseases, as the figure shown below:
Annotate Drugs Using Therapy Information
Similar to the gene annotation, using the menu NodesDisease Annotation Use Most Specific
Disease Terms. The annotation will be part of drug description available in tooltipwhen
mouse-over the node
Prediction Functions Using Enrichment Analysis
Prediction Associated Diseases for A Set of Genes
With the latest release of the VisANT 4.0, users can easily perform a disease enrichment analysis
on any input gene sets. In the following tutorial, we will use the breast cancer driver genes
published by Gray, Joe and Brian# as an example to demonstrate how to determine the
overrepresentative diseases in VisANT.
1. First, load gene set/network into VisANT. Here, total 40 driver genes are imported and formed a
signal metanode in VisANT. Multiple gene sets can be imported into VisANT at the same time. In
this case, each gene set must be presented as an individual metanode in
VisANT.
2. If the imported genes do not contain any disease information, then we will have to annotate
those genes using VisANT platform. First, select all genes and then select Node(s) Disease
Annotation Using Most Specific Disease Terms from the right click menu to perform the
disease annotation function for all genes. VisANT will automatically annotate genes by using the
disease-gene associations available in the public databases such as KEGG, GAD, OMIM and
PharmGKB.
3. The default FDR cut-off value of the enrichment analysis is 0.01. Before starting the analysis, we
can adjust this value from the property-sheet.
4. The disease enrichment analysis can be started by clicking on MetaGraph Predict
Associated Disease of Metanodes Using Hypergeometric Test over All Diseases
Databases from the menu. When there are more than one metanode (gene set) available and
none of them are selected by the user, VisANT will perform the enrichment analysis over all
possible metanodes. The analysis of each metanode is independent to each other and the result
will be listed separately in the final report. In contrast, if one or more metanodes are selected by
the user, then VisANT will only perform the enrichment analysis on the selected metanode(s).
5. The analysis will take a couple minutes depending on the size of the gene set. After finishing,
the result will be shown in the browser. Only the over-presentative diseases will be listed in the
report and the diseases will be grouped by the database. In this example, not only breast cancer
but also other types of cancers are enriched in this gene set. It is because many of genes in this
genes set may also contribute to other cancers.
6. In some cases, a user may only want to test certain diseases. Those diseases need to be
specified by selecting the disease(s) from the ‘Hierarchy Explorer’. Then select MetaGraph
Predict Associated Disease of Metanodes Using Hypergeometric Test over selected
Diseases Databases to perform the enrichment analysis. In this example, we will test if any GAD
Cancer is enriched in our gene sets.
The enriched diseases will be listed in the browsers. Similar to the previous result, breast cancer
and some of other cancers are also overrepresented.
Prediction Associated Therapies for A Set of Drugs
With VisANT 4.0, users can perform a therapy enrichment analysis on any input drugs. The procedure is
similar to the disease enrichment analysis describing in the previous section
1. First, users can load drug sets/network into VisANT or add new drugs into the network directly by
drag-and-drop drugs from the Hierarchy Explorer. All available drugs are organized by the Anatomical
Therapeutic Chemical (ATC) classification in the system. Drugs in the same drug set must be grouped into
the same metanode. Multiple drug sets are allowed. In this case, each drug set must be presented as an
individual metanode in the network..
2. If the imported drugs do not contain any disease information, then we will have to annotate those drugs
using VisANT platform. First, select all drugs and then use the annotation function from the right click menu
Node(s) Therapy Annotation Using Most Specific Therapy Terms to add the therapy annotations for
all drugs.
3. The default FDR cut-off value of the enrichment analysis is 0.01. Before starting the analysis, we can
adjust this value from the property-sheet to any desired value.
4. The therapy enrichment analysis can be started by clicking on MetaGraph Predict Associated
Therapy of Metanodes Using Hypergeometric Test over All Therapies from the menu.
When there are more than one metanode (gene set) available and none of them are selected by the user,
VisANT will perform the enrichment analysis over all possible metanodes. The analysis of each metanode is
independent to each other and the result will be listed separately in the final report. In contrast, if one or
more metanodes are selected by the user, then VisANT will only perform the enrichment analysis on the
selected metanode(s).
5. The analysis will take a couple minutes depending on the size of the drug set. After finishing, the result will
be shown in the browser. Only the overrepresentative therapies will be listed in the report.
6. In some cases, a user may only want to test certain therapies. This can be done by re-selecting those
therapies from the ‘Hierarchy Explorer’. After selection, then select [ MetaGraph ] -> [ Predict Associated
Therpay of Metanodes ] -> [ Using Hypergeometric Test over selected Therapies] to perform the enrichment
analysis. Only the enriched therapies will be listed in final report.