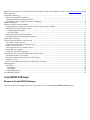
1
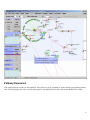
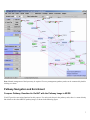
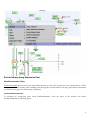
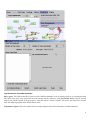
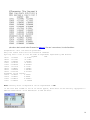
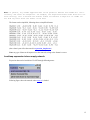
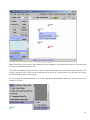
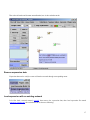
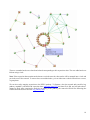
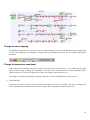
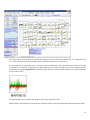
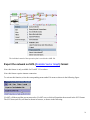
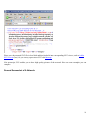
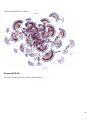
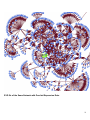
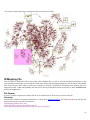
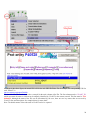
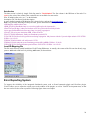
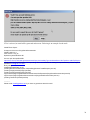
Note: This is just partial of VisANT manual related with the NAR 2007 submission. Please visit http://visant.bu.edu for the
full user manual.
Load KEGG Pathways...................................................................................................................................................................1
Browse and Load KEGG Pathways...........................................................................................................................................1
Load Network/Pathway through Web URL ..............................................................................................................................3
Load Pathway when A Node Is Involved in A Pathway ...........................................................................................................4
Pathway Expansion........................................................................................................................................................................6
Pathway Navigation and Enrichment ............................................................................................................................................7
Compare Pathway Visualized in VisANT with the Pathway Image in KEGG .........................................................................7
Enrich Pathway Using Expression Data ....................................................................................................................................8
GeneRecommender Plugin ....................................................................................................................................................8
ClueGene Plugin..................................................................................................................................................................11
Enrich Pathway Using Interaction Data ..................................................................................................................................12
Add Nodes to the Existing Metanode (Pathway).....................................................................................................................12
Update KEGG Pathway...............................................................................................................................................................13
Overlay Expression Data over the Network ................................................................................................................................13
The format of expression data .................................................................................................................................................13
Load/map expression into an empty network. .........................................................................................................................15
Remove expression data ..........................................................................................................................................................17
Load expression with an existing network ..............................................................................................................................17
Change the color mapping .......................................................................................................................................................19
Change the expression experiment ..........................................................................................................................................19
Export the network as SVG (Scalable Vector Graph) format .....................................................................................................21
General Screenshot of A Network:..........................................................................................................................................22
Screenshot of the Same Network in the SVG format ..............................................................................................................23
Zoomed SVG file.....................................................................................................................................................................24
SVG file of the Same Network with Overlaid Expression Data..............................................................................................25
ID Mapping File ..........................................................................................................................................................................26
File Format ..............................................................................................................................................................................26
File Header ..........................................................................................................................................................................26
Data Section.........................................................................................................................................................................29
Load ID-Mapping file..............................................................................................................................................................29
Error Reporting System ...............................................................................................................................................................29
Load KEGG Pathways
Browse and Load KEGG Pathways
From the VisANT’s home page shown below, select the species, click the Browse KEGG Pathways button:
1
and corresponding KEGG pathways will be listed as following, click the Graphics link of interested pathway, as shown
below:
Corresponding pathway will be loaded into VisANT:
2
Note: Multiple pathways can be loaded.
Note: It is possible that some pathway’s default location is out of the visible draw region in VisANT. In such case, clicking on
the FitToPage button at left control panel will easily make it visible.
Load Network/Pathway through Web URL
VisANT can load any supported data (such as VisML, KGML, Edge-List etc) from a Web resource. To load KEGG pathway
from the Web resource, simply select the menu Open URL menu and copy/paste the URL into the input box, as shown below:
3
Note: for VisANT 3.0 or below, URL must be typed in when VisANT is run as an online Applet.
Load Pathway by Searching It’s ID
If the KEGG ID is known, then it can be loaded by type in the MAP+ID in the searching box. For example, for the pathway
shown above, its ID is 04330 and can be searched using name MAP04330:
Note: multiple pathway IDs can be typed in the search box
Load Pathway when A Node Is Involved in A Pathway
When a protein/gene is searched in VisANT, or its IDs is resolved through Name Normalization service, VisANT will tell
whether this protein/gene is involved in one or more KEGG pathways. In such case, VisANT can loaded pathway directly as
shown below (ARG8 is searched for interaction in this example):
4
by select the menu for pathway 00220, it will be loaded into VisANT:
5
Pathway Expansion
If the loaded pathway has links to other pathways, these pathways can be expanded by double clicking corresponding pathway
node. Following figure shows the result when the pathway node MAP00910 is double-clicked after MAP00220 is loaded:
6
Note: Manual arrangement of the layout may be required. For easy management, pathway nodes can be contracted by doubleclicking over them.
Pathway Navigation and Enrichment
Compare Pathway Visualized in VisANT with the Pathway Image in KEGG
VisANT provides convenient functions for this purpose. For each node shown in the pathway node, there is a menu directly
link it back to the colored KEGG pathway image, as shown in the following figure:
7
Enrich Pathway Using Expression Data
GeneRecommender Plugin
GeneRecommender discovers new genes with similar function to a given list of genes (the query) already known to have
closely related function. It ranks genes according to how strongly they correlate with a set of query genes in those experiments
for which the query genes are most strongly coregulated.
Invoke GeneRecommender
To searching for coexpressed genes using GeneRecommender, select the nodes in the network, and invoke
GeneRecommdender as following figures:
8
Input Parameters of GeneRecommender
Query genes: This field list the IDs of genes used for GeneRecommender. It can be directly typed in, or copied/pasted from
other place if the genes to be queried are not in the current network. Otherwise, click Get Selected Nodes to get the selected
nodes in the current network as the query genes. After this button is clicked, VisANT will resolve the name of the selected
node first and then put them in the field as shown below.
Top number of genes: This is the number of best-coexpressed genes that will be returned by GeneRecommender.
9
Top number of experiment: GeneRecommender will return the expression values of the number of experiments specified by
this parameter. In addition, the coexpression scores are also calculated based the expression values of these experiments.
Group the coexpressed genes: This option is useful when selected genes are in a large interaction network as it will group
the returned top number of coexpressed genes. It is not useful in the case of pathway enrichment because these nodes are
already grouped in the pathway.
Searching and resultsnavigation
Click the Search button will start the searching process in the background and all buttons will be disabled until the searching
is finished. Once finished, the score plot of top number of coexpressed genes will be plotted and new genes in the returned top
coexpressed genes will be arranged into a circle as shown below. Nodes of these returned genes will be colored according to
the expression value of the first experiment.
To link the score in the plotter to the corresponding genes, select the spots in the plotter and the corresponding nodes will be
selected, as shown below.
10
ClueGene Plugin
ClueGene uses the pattern of how genes cluster together in different experiments to recommend new genes in a pathway.
ClueGene bases its recommendations on the query set and on a cluster compendium. Each experiment series is clustered
independently. The collection of clusters from all the experiment series constitutes the cluster compendium. Each gene g in
the genome is given a co-clustering score C(g). A cluster c in the cluster compendium contributes to the score of g if g is a
member of c. The contribution of c to the score of g is proportional to the number of query genes found in the cluster c, and
inversely proportional to the size of the union of the cluster c and the query set (to down-weight co-occurrence of g and the
query in the same cluster by chance). A gene with a higher co-clustering score is more likely to participate in the pathway of
the query genes than a lower-scoring gene. Note that scores can only be compared for the same species, cluster compendium,
and query set. In other words, a gene has a higher score, and thus is more highly recommended, if it is found in small clusters
along with query genes
11
The interface, as well as the operation of the ClueGene plugin is similar to the GeneRecommender plugin, please reference
corresponding sections for detail.
Enrich Pathway Using Interaction Data
Interaction data, either computational or experimental, can be easily queried against Predictome. Following figure shows an
example to query the intra connectivity between top 10 coexpressed genes returned by GeneCommender:
Literature evidences of the detected interactions can be easily launched into browser as shown above.
Add Nodes to the Existing Metanode (Pathway)
To add nodes to an existing metanode, simply select the nodes and drag then over the metanode, as shown in the
following figure.
12
A confirmation window will be popped out, select "Y" will add selected nodes to the metanode, as shown above.
Note: if one of the selected nodes belongs to a metanode which is not selected, VisANT will ignore this functionality.
Note: to add a node already belongs to a metanode to another metanode, duplicate the node first, and then drag the
duplicated instance to the target metanode.
Update KEGG Pathway
KEGG pathways saved before in VisANT can be updated as shown below, which will load the latest KGML of corresponding
from KEGG and all user customization will be retained.
Overlay Expression Data over the Network
Note: this feature is only available for VisANT2.5 and above
The format of expression data
The full format of the expression is shown as following:
13
(the above data is stored in the file named as mmu.txt). For user’s convenience, it is also listed here:
#!Expression. This line must be presented
#any line starts with # will be treated as comments
#you may have a line to list the name of experiment separated by TAB delimit.
log2RAT
mmm
18751
-0.87992
-0.87992
19055
-0.17281
-0.17281
19055
1.493562
1.493562
11651
-0.05703
-0.05703
11652
0.634509
0.634509
12914
-0.17516
0.17516
19055
1.596697
1.596697
19055
1.681656
1.681656
19353
0.013109
0.013109
#comments can be anyhere
12914
-0.00423
0.00423
12914
-0.86621
0.86621
11652
0.638012
0.638012
11651
0.392922
-0.392922
Note: missing value of expression can be represented as NA
In the case that VisANT is run as an online applet, above data can be directly copy/paste to
Add box shown below. Click Add button to add the data.
14
Note: In general, any VisANT supported data can be pasted to Add box and VisANT will lod it
correctly. But there are exceptions. For example, the simplified format shown below will not
work correctly, this is because the default format for Add box is edge-list if VisANT can
not find any hints about the format of the data.
The format can be simplified, following shows a simplified format:
(above data is part of the data stored in expression_simplest.txt)
Note: any type of data can be imposed over the network, as long as the format is correct.
Load/map expression into an empty network.
Expression data can be loaded into VisANT through following menu:
following figure shows the network when mmu.txt is loaded:
15
Note: Please select correct species (Mus Musculus) before loading the expression data because the expression data
itself have no information of the species.
The nodes are identified as Entrez Gene ID in above example and the node color represents the expression value. The
actually expression value of the current experiment can be known by moving mouse over the node. The current
experiment name is shown in the status bar.
We can pull the detailed information of the nodes using Name Normalization. Make sure that you select caseinsensitive for mmu:
16
Then select all nodes and do name normalization, here is the resulted network
Remove expression data
Expression data can be easily be removed from the network through corresponding menu:
Load expression with an existing network
Let’s first load a network named exp.xml, then remove the expression data, then load expression file named
expression_simplest.txt, the resulted network is shown as following:
17
The new or matched nodes are selected and colored corresponding to their expression value. The new-added nodes are
laid out using a circle.
Note: If the expression data contains nodes that are not in the network, these nodes will be arranged into a circle and
put in the cent of the network. To remove these new-added nodes, you can either move whole network into a corner,
or group them.
We can also easily mapping expression to the KEGG pathway. To illustrate, clear the network and search for keg
pathway map04010, and then load expression data expression_data.TXT, this data file is 8M, and will take about 3
minutes to load. After removing the nodes do not belong to the pathway, the network will look like following (the
resulted network has been saved as exp_pathway.xml):
18
Change the color mapping
By default the maximum of the expression value is mapped with green color and and minimum value is mapped with
red color. The mapping can be changed by clicking on the color button shown below: left for minimum and right for
maximum.
Change the expression experiment
If the expression has multiple experiments (which is the case for all expression files), we can simply drag the slider
shown in above figure to change the experiments. The name (or the sequential number) of the experiment will be
shown at status bar. Click on the empty place of slider will change experiments one by one.
The change of expression experiments can also be animated by click on the Play button as shown above.
•
Expression Plot
So what we can do if we want to view all expression experiments of a given set of nodes? The answer is simply: turn
on the Expression Plot checkbox as shown in above figure. Here is the pathway with this option is on:
19
The cursor and the value in the node represent the expression value of the current experiment (107th experiment). The
size of the expression node can be changed, either by define the node size, or zoom in/out.
For the metanode, the expression plot is a recursive sum of its child nodes. The expression plot will only be shown if
the metanode is contracted. If more than one child nodes have the expression profile, the average expression profile
will be shown using the black-thick line. Following figure shows the expression plot of the above mentioned pathway
(in the zoom-in state):
For the metanode, the cursor and value points to the average expression value.
Note: Similar to node label, the expression plot can also be turned on/off using individual control in the nodes menu:
20
The individual control of the expression plot is saved in the visML file.
Export the network as SVG (Scalable Vector Graph) format
Note: this feature is only available for VisANT 2.51 or above.
Note: this feature requires internet connection.
To activate this function, select the corresponding menu under File menu as shown in the following figure:
VisANT will then send the current network to VisANT server which will translate the network in the SVG format.
The SVG data (xml file) will then be shown in browser, as shown in the following:
21
Please save the returned SVG file in local disk and then loaded it into corresponding SVG viewer, such as Adobe
SVG Viewer (free). Or you can try open-source SVG edit Inkscape
Like postscript, SVG enables you to have high quality pictures of the network. Here are some examples you can
compare:
General Screenshot of A Network:
22
Screenshot of the Same Network in the SVG format
23
(shown using Adobe SVG viewer)
Zoomed SVG file
(SVG allows graph to be freely zoomed with same quality)
24
SVG file of the Same Network with Overlaid Expression Data.
25
(new feature in this release allows expression profile to be shown as a node)
ID Mapping File
This file format is designed to allow user to add various database IDs, as well as alias and functional descriptions, to the
corresponding proteins/genes of a network in a batch mode. Aliases and functional descriptions, will be shown in the tooltip
when mouse-over the node; aliases and IDs are searchable in VisANT. In addition, it also allows each database IDs to be
mapped to an URL so that corresponding web links can be directly loaded into browser from VisANT, under Available Links
menu of the Nodes menu.
File Format
As usual, VisANT recognize the format of the file by its internal context. There are two section of the file:
File Header
All lines starts with the # are named as file header, as shown in the following example. The header must have the first line and
last lines shown below, all others are optional.
#!ID Mapping AddNewNode=false
#following URL is for swiss-prot database linkout
#swiss-prot:UniProtKB/Swiss-Prot entry=http://ca.expasy.org/uniprot/
26
#VisANT_ID swiss-prot
YIL047C P40528
YCL032W P25344
YLR286C P29028
YDR264C P39010
YLR362W P23561
The file must start with the #!ID Mapping line so that VisANT can load correct parser. There is one parameter AddNewNode
for this line. If this parameter is true, then those nodes that do not match any nodes in the network using the the first column of
the data section will be added to the network; otherwise, they will be ignored. This parameter is optional, the default value is
false.
The 2nd line in the above example is comment line, you can have as many comment lines as you want.
The 3rd line tells VisANT to have an link-out menu for those nodes that has the swiss-prot IDs. It must follow the format:
ID-Name:Menu Name=web URL
Where ID-Name is the database id listed in the ID-List line, once matched, a menu will be created under Nodes/Available
Links, using the name specified by Menu Name, as shown in the following figure:
27
As shown in the above figure, the actual URL will be the web URL+ID-Name. For an example, the corresponding URL for
node YIL047C is
http://ca.expasy.org/uniprot/P40528.
The last line of the file header in the above example list the total columns of the IDs. The first column must be #VisANT_ID,
which represents the name or ids that can be uniquely identified by VisANT in the current network. This line must be Tabdelimited. Although the name of the IDs can be determined by the user, there are two key names that are reserved by
VisANT: alias and description. See example below for more detail.
Note: The default names of the node used in VisANT can be be exported.
28
Data Section
The data section is relatively simple. Each line must be Tab-delimited. The first column is the ID/Name of the node. Use
space as the value of the column if the certain IDs are not available for some nodes.
alias: If multiple alias exist, use "," as the delimiter.
description: No Tab allowed in the description.
A more detailed example of ID-Mapping file is shown below, and can be downloaded here.
Note: Copy & Paste following text may not work, please download file directly from above link.
#!ID Mapping AddNewNode=true
#PDB_id:Protein Data Bank=http://www.rcsb.org/pdb/explore.do?structureId=
#Gene3D:Gene3D=http://cathwww.biochem.ucl.ac.uk/cgi-bin/cath/GotoCath.pl?cath=
#swiss-prot:UniProtKB/Swiss-Prot entry=http://ca.expasy.org/uniprot/
#VisANT_ID swiss-prot description PDB_id alias Gene3D
YIL047C P40528 Membrane; multi-pass membrane protein SYG1
YCL032W P25344 Involved in growth arrest during conjugation. May interact with the G protein alpha subunit 1Z1V STE50
G3DSA:1.10.150.50
YLR286C P29028 Soluble cell wall protein 2 CTS1
YDR264C P39010 Ankyrin repeat-containing protein AKR1,AKRR G3DSA:1.25.40.20
YLR362W P23561 Serine/threonine-protein kinase 1X9X STE11 G3DSA:1.10.150.50
Load ID-Mapping file
The file can be directly loaded loaded into VisANT using File menu. As usually, the context of the file can also directly copy
paste to Add textbox and load it by clicking Add button, as shown below:
Error Reporting System
To improve the reliability of the integrated distributed system, such as GeneCommender plugin and ClueGene plugin,
VisANT allows user to report the critical errors to the authors of the plugins, as well as VisANT development team, so that
the error can be fixed as soon as possible. Following figure shows an example:
29
If Yes is selected, an email will be generated and sent out. Following is an example of such email:
VisANT Error Report:
Component of the error=PluginGeneRecommender
VisANT version=2.7
Java version=1.4.2_05
Operation system=Windows XP
Can not open the specified URL
http://disco.cse.ucsc.edu:8001/grforvisant/search?species=hsa&keyType=loc&showScore=Y&nTopGene=10&nTopExp=50
java.lang.NumberFormatException: For input string: "Error encoutered while creating the request directory. Please report the
problem to [email protected]."
Query string:
23385,5664,5663,55851,51107,
java.lang.NumberFormatException.forInputString(NumberFormatException.java:48)
java.lang.Integer.parseInt(Integer.java:468)
java.lang.Integer.parseInt(Integer.java:518)
cagt.bu.visant.plugin.PluginGeneRecommender.searchCoExpression(PluginGeneRecommender.java:278)
cagt.bu.visant.plugin.PluginGeneRecommender.run(PluginGeneRecommender.java:161)
java.lang.Thread.run(Thread.java:534)
------------Please email [email protected] if you have any questions about this email.
30