1
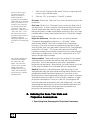
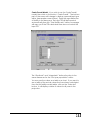
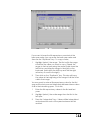
To see the values as a graph,
1.
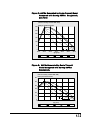
Click on the “Chart” button. This will show a graph of
first year and last year values (not shown).
2.
To close the graph, click on the “X” icon in the upper
right part of the graph window (Windows 95) or the “-“
icon (Windows 3.1).
3.
Click the “Close” button to return to the editor.
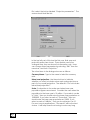
To compare the age-specific fertility distribution that would
result from selecting any of the UN or Coale-Trussell model
tables,
54
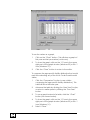
1.
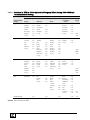
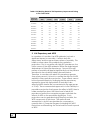
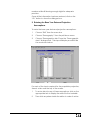
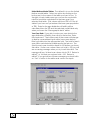
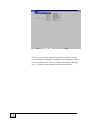
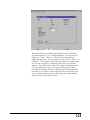
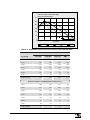
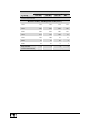
Click the “Comparison” button to see a table
comparing the age specific fertility distribution). This
table will show the base year.
2.
Advance the table by clicking the “Next Year” button,
or return to earlier years by clicking the “Prev Year”
button.
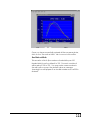
3.
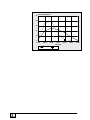
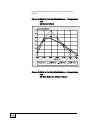
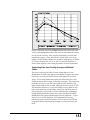
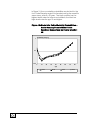
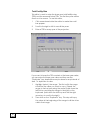
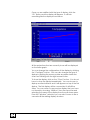
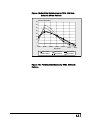
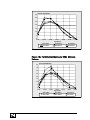
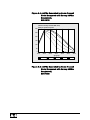
To see a graph instead of a table, click the “Chart”
button (see screen below).
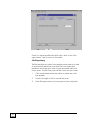
4.
To close the graph, click on the “X” icon in the upper
right part of the graph window (Windows 95) or the “-“
icon (Windows 3.1).
5.
Select “Close.”