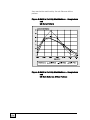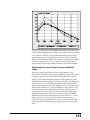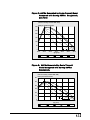
1
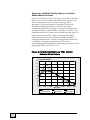
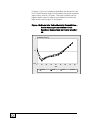
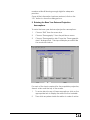
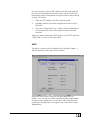
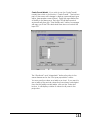
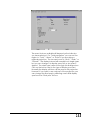
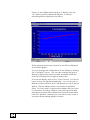
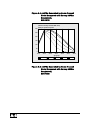
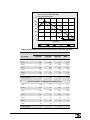
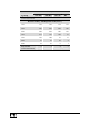
The exact choices available will depend on the indicator
you have selected. For “Total population” you can set the
region to “Total,” “Urban,” or “Rural” if you are doing a
regional projection. The sex can be set to “Both,” “Male,” or
“Female.” The display interval will normally be in single years
but you can change it to display every five or ten years if
desired. The chart type is also set through this dialogue box.
Click on the button next to the type of display you want.
Normally the display will show all the years in the projection.
However, if you want to see only part of the projection, you
can change the final year by selecting a new final display
year from the “Final year” list box.
63