1
ISSN (Online) 2321 – 2004
ISSN (Print) 2321 – 5526
INTERNATIONAL JOURNAL OF INNOVATIVE RESEARCH IN ELECTRICAL, ELECTRONICS, INSTRUMENTATION AND CONTROL ENGINEERING
Vol. 3, Issue 11, November 2015
―Tampering Detection of Domestic Load by
GSM‖
M.V. Bhatkar1, S.A .Thete2
Professor, Electrical Engg, Dept. J.E.S.I.T.M.R, Nashik1
Asst. Prof. Electrical Engg, Dept J.E.S.I.T.M.R, Nashik2
Abstract: This paper presents a single phase digital energy meter based on a microcontroller. This digital meter does
not have any rotating parts, and the energy consumption can be easily read from a digital display also at remote place it
is easily possible to check energy consumption and tampering detection by using GSM technology. When supply wills
cut-off, the meter will restart with the stored value. Today energy theft is a worldwide problem that contributes heavily
to revenue losses. Consumers have been found manipulating their electric meters; try to make them stop, or even
bypassing the meter, effectively using power without paying for it. This energy meter can detect tampering in an energy
meter by using microcontroller and provide there details at remote location.
Keywords: Tampering Detection, GSM Technology, microcontroller, RMR (Remote Meter Reading).
I. INTRODUCTION
The Power Sector in the country sustains a loss of over 2530%. The main reason is the human element involved in
the reading of the meters and also the easy accessibility of
the meters to the customers, a large number of whom
tamper with it. A solution to this ever problem would be to
eliminate the human element involved on the part of meter
reading. This can be done with a set of technologies called
RMR (Remote Meter Reading).
The GSM based Remote meter reading system provides a
cost effective, reliable & interference free data transfer
between remote meter reading units & the utility control
center. The meter reading & management processes are
free from human involvement. Based on existing
telephone networks, it is very flexible for the utility
companies to access, service & maintain this meter
reading system. A user friendly & window based is
designed which fully utilizes the personal computer’s
terminate & stay resident programming technique to
achieve communications between the remote meter
reading units & personal computer in control center.
Power utility companies have suffered revenue losses due
to illegal electrical usage & uncollected bills for several
years. Remote meter reading system along with GSM
communication has been identified as a solution. If RMR
system via GSM is set in a power delivery system, a
detection system for illegal usage may be easily captured.
P89LPC938 is the microcontroller used to perform all the
measurements in the meter. As the P89LPC938 is 8-bit
microcontroller with accelerated two-clock 80c51 core
8KB, 3V byte-erasable flash with 10-bit A/D converter.
The active energy consumed is available on an LCD
display module as well as from remote location at control
room it is possible to check energy consumption and also
getting the signals related to tampering [1].
If repeated measurements of both instantaneous voltage
(Vi) and current (Ii) are made then it is possible to
calculate sum of their product over time. By dividing the
total accumulated energy over the number of samples, the
average power (the first expression in Equation
1).Multiplying the average power by time gives the total
energy consumed. [2]
N
Average Power (watts) = ∑ Vik *Iik
k = 1 ---------N
N
Energy Consumed (watt-sec) = ∑ Vik *Iik
k = 1 -----------Fs
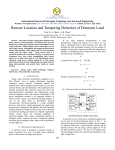
III. DESIGNED WIRELESS ENERGY METER
Microcontroller
Section
Analog Front End
P89LPC938
Power Supply
Voltage
Measurement
Phase Current
Interface Section
LCD
Relay
ADC
Neutral
Current
Tamper Detector
(Opto sensor,
Magnetic switch)
GSM
Modem
Fig: 1 Block Diagram of Digital Energy Meter
A general overview of the micro controlled energy meter
can be seen in the block diagram shown in Fig. 1. As
shown the energy meter hardware includes a power
supply, an analogue front end, a microcontroller section,
and an interface section. Microcontroller section requires
3v power supply, +/-5v for analog front-end the analogue
II. PRINCIPLES OF MEASUREMENT
front end is the part that interfaces to the high voltage
A watt-hour meter is designed to measure energy or power lines. It converts high voltages and high currents to
consumed over time. In simple terms, electrical power is voltages sufficiently small to be measured directly by the
analogue/digital converter (ADC) of the microcontroller.
the product of voltage and current.
Copyright to IJIREEICE
DOI 10.17148/IJIREEICE.2015.31112
59
ISSN (Online) 2321 – 2004
ISSN (Print) 2321 – 5526
INTERNATIONAL JOURNAL OF INNOVATIVE RESEARCH IN ELECTRICAL, ELECTRONICS, INSTRUMENTATION AND CONTROL ENGINEERING
Vol. 3, Issue 11, November 2015
Voltage measurement is done with a potential transformer
(PT), while the current measurements require more
accurate measurement and it is done by current
transformer (CT) on phase along with current
measurement on neutral to identify tampering which is
basically depends upon phase and neutral current. Energy
calculation is done by P89LPC938 microcontroller [8]. 8bit microcontroller with accelerated two-clock 80C51 core
8 KB 3 V byte-erasable Flash with 10-bit A/D converter
The P89LPC938 is a single-chip microcontroller, available
in low cost packages, based on a high performance
processor architecture that executes instructions in two to
four clocks, six times the rate of standard 80C51 devices.
Many system-level functions have been incorporated into
the P89LPC938 in order to reduce number of components,
board space, and system cost [8]. In interface section LCD
is used to display readings of unit’s consumption. Relay is
used to connect or disconnect power supply of consumer.
Also sensors are used to detect is it any one touch the door
as well as incoming terminals of meter. Magnetic sensor is
used to detect magnetic interference tampering. GSM
modem is used to transmit data of tampering events and
KWH consumption at remote place [11].
IV. HACKING IN ENERGY METERS
Due to the increasing cost of electricity, Energy theft is
becoming a major concern for government agencies across
the world. A large portion of these revenue losses can be
recovered by installing electronic energy meters because
they can detect tampering conditions and assure proper
billing, unlike electromechanical meters. This section
describes several tampering techniques used by thieves
along with solutions for avoiding tampering.[3] The
Analysis Of Electricity-Stealing Method is done in
following four classifications:-
for one of the phases is made zero by removing one of the
phase wires from the meter terminal. This results in
recording less energy consumption as consumption from
one of the phases becomes zero. During this condition
since the voltage is absent and current is present, the logic
is easily able to sense this and record as tamper event [4].
2. Bypassing meter:- There are many ways to bypass an
energy meter. The most common way is by putting a
jumper in meter terminal such that connection is bypassed
and the energy consumption is not registered. This can be
avoided by connecting sensor at incoming terminals P & N
[4].
3. Powering off meter: - Meter can be powered off by
removing all the voltage connections [4].
B. Stealing electricity by undercurrent technology
1. Partial earth fault condition:
An earth fault means some of the load has been connected
to another ground potential and not the neutral wire. Thus
the current in the neutral wire IN, is less than that in the
Phase or live wire (IP). To detect this condition, firmware
monitors the currents on both Phase and Neutral, and
compares them. If it differ significantly, tampering is
detected ant notify to remote location [4].
2. Phase and neutral wire swapped:- In this method live
and neutral wires are swapped, which makes the current in
the live wire less than that in the neutral.[4]
3. Missing neutral: - The missing neutral tampering
condition occurs when the neutral is disconnected from the
power meter [4].
4. Double feeding the meter:- Double Feeding‖ to bypass
the meter where additional feeding is connected directly to
the line so that the consumption for additional feeding is
not registered. This can be identifying by comparing phase
and neutral current. In this Ip is less than In.[4]
C. Stealing electricity by phase-shifted technology
A. Stealing electricity by under Voltage technology
1. Reverse current
B. Stealing electricity by undercurrent Technology
Reverse current occurs when the phase and neutral are
C. Stealing electricity by phase-shifted Technology
D. Stealing electricity by difference Expansion (DE) wired to the wrong inputs, causing current to flow in the
direction opposite to normal. When neutral wire
technology
connection is swapped then causing current IN to flow in
Figure 2 shows normal Phase and Neutral wire Connection
the reverse direction. Due to the reverse current flow
to the meter. Current of the Phase wire is the same as of
through Neutral, metering firmware will show wrong signs
the neutral wire (IP = IN). [4]
in active power readings [4].
2. Neutral disturbance: - Tampering with the neutral at the
source, high-frequency signals are superimposed on
neutral causing inaccurate current measurement and thus
reducing the energy recorded by the meter. Meter current
is also reverse by using inverted supply at source [4].
D. Stealing electricity by difference expansion (DE)
technology
1. High voltage tamper: - A meter can be tampered with
by an electrostatic device that generates spikes or voltages
in the range of 35 kV. This may induce errors in
consumption recording or may even damage the meter.
The accuracy of the meter should not be affected by the
Fig:-2 Normal P & N connection
application of abnormal voltage/ frequency generating
device. [4]
A. Stealing electricity by under Voltage technology
1. Missing potential: - This is a common connection fraud 2. Magnetic interference: - Consumers use heavy magnetic
usually deployed in meters where the voltage component material in voltage and current measurement circuits and
Copyright to IJIREEICE
DOI 10.17148/IJIREEICE.2015.31112
60
ISSN (Online) 2321 – 2004
ISSN (Print) 2321 – 5526
INTERNATIONAL JOURNAL OF INNOVATIVE RESEARCH IN ELECTRICAL, ELECTRONICS, INSTRUMENTATION AND CONTROL ENGINEERING
Vol. 3, Issue 11, November 2015
this are affected by abnormal external magnetic influences
that in turn affect proper functioning of the meter. For
example, the use of a strong magnet to change the
magnitude of current—this in turn introduces large errors
in measurement. One way to avoid this is by having
magnet sensors to detect the presence of abnormal
magnetic fields and provide evidence by logging it as a
tamper [5].
3. External crystal connection: - Electronic energy meter
having crystals to generate clock pulses. Tampering is
done by connecting external crystal which slows down
energy meter. To avoid this tamper select a
microcontroller such as having inbuilt clock oscillator.
4. External tampers
External tampering may include breaking the meter case,
chemical injection or even burning the meter. All these
result in changing the electrical characteristics of the
components thereby recording less or no energy usage.
One may want to open the meter to change the settings or
even remove the backup battery so that the meter will reset
when the main power goes off. Anti-tamper switches can
be placed on the casing of the meter to trigger a tamper
when the casing is opened [4].
V. FLOWCHART FOR ELECTRICAL ENERGY
MEASUREMENT
VI. RESULTS
To validate the proposed energy meter, several
experimental tests were carried out. The single-phase
prototype was initially calibrated using a 1kW standard
load of unity power factor. Designed energy meter is
shown. Some experimental results were obtained to verify
the meter precision.
Fig:-5 Designed energy meter
A.1] Load test at different resistive load and inductive
load.
Bar chart of Kwh consumption at various Resistive load.
Software is implemented into two major areas, the
foreground process and the background process. The
background functions use a timer interrupt to trigger the
ADC and to collect the voltage and current samples. These
samples are further processed and accumulated into
buffers [7,9,and10]. The background function deals mainly
with the timing-critical elements of the software. Once
sufficient samples have been accumulated, the foreground
functions are used to calculate the final values of kWh.
The program then enters the main foreground process loop
and waits for the timer interrupt routine to gather data.
1.6
1.4
1.2
Kwh
consumption
(Units)
1
0.8
0.6
Calculated Measured
0.4
0.2
0
200
600
1000
1500
Load (Watt)
Fig:-6 Bar chart for resistive Load
Graph of Error Vs various Resistive load.
Start
Initialize Timers, Serial Ports, ADC,
RAM, display and Modem
1600
1400
1200
Read Voltage and current
1000
Load (watts)
Yes
Error
800
600
Calculate New Energy KWh =
watt/1000 × 3600 + KWh
400
200
No
0
Stored Energy in EEPROM, and
Display on LCD
0.04
Yes
Display tampering name and on
Buzzer.
Send tampering code at central
room.
Yes
Communicate with modem for
requested data.
Fig: 4. Flowchart
Copyright to IJIREEICE
0.08
0.16
0
0.04
0.22
Error (Units)
No
Is any
tampering?
0.12
Fig:-7 Line Graph1for Resistive load
Bar chart of Kwh consumption at various Inductive load.
1.2
1
0.8
Kwh
consumption0.6
(Units)
0.4
Calculated
Measured
0.2
0
45
235
370
Load (Watt)
1000
Fig:-8 Bar chart for inductive load
DOI 10.17148/IJIREEICE.2015.31112
61
ISSN (Online) 2321 – 2004
ISSN (Print) 2321 – 5526
INTERNATIONAL JOURNAL OF INNOVATIVE RESEARCH IN ELECTRICAL, ELECTRONICS, INSTRUMENTATION AND CONTROL ENGINEERING
Vol. 3, Issue 11, November 2015
Loosed units in month = 30 days × Loosed units in one
day.
Graph of various Inductive load Vs Error.
1200
Bar chart of Total loss(Rs/Units) in month for each tampering events.
1000
Load (Watts)
800
Error
600
70
400
60
200
50
0
0.075
0.055
0.14
Total Loss
(Rs/Units)
0.16
Error (Units)
40
30
20
Total loss (Rs/Units)
10
0
Fig:-9 Line graph for inductive load
ET
DF
RP
MP
PO
Tampering Events
Figure 6 and 8 shows bar chart for resistive and inductive
Fig:-11 Bar chart for monthly loss calculation.
load which shows difference between measured and
calculated values. Whereas figure 7, 9 shows line graph
for resistive and inductive load which shows that if load Figure 10 and 11 shows the bar chart of total loss in
Rs/unit for individual tampering events on one day and for
increases then error is also increased.
one month respectively which shows that for P & N
A.2] Tampering test on different day at 1000 watt resistive swapped tampering loss is very less where as its maximum
load.
for missing potential, powering off and by passing meter.
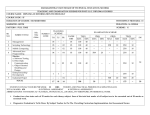
Table 1: Average Result Table for daily loss calculation.
S.
No
Loa
d
(wa
tt)
Ti
me
(Hr
s)
100
0
100
0
1
1
0.8
0.26
0.54
3
100
0
1
0.8
0.31
0.49
4
100
0
1
1
0.28
0.
72
100
0
100
0
100
0
100
0
1
1
0.33
0.67
1
1
0.88
0.12
1
1
0
1
1
1
0
1
100
0
1
1
0
1
1
2
5
6
7
8
9
Kwh Consump
ption
With
With
out
Tamp
Tampe
ering
ring
(Units
(Units)
)
1
0.32
Tota
l
Loss
(unit
s)
Tamperin
g Method
0.68
External
Tamper
Partial
Earth
(200watt)
Double
Feeding
(200watt)
Magnetic
Interferen
ce
Reverse
Polarity
P&
N
swapped
Missing
Potential
Bypassing
Meter{IT
T)
Powering
Off
Total
Loss
(Rs2.
17
/Unit
s)
1.475
6
1.171
8
1.063
3
1.562
4
1.153
9
0.260
4
2.17
2.17
2.17
2.5
2
1.5
1
0.5
Total loss (Rs/Units)
0
ET
DF
RP
MP
VII.1.Limitations:
This electricity meter is also more expensive to
manufacture. From remote place theft detection is possible
at central room and consumers supply can be cut off-on by
relay from central room by manually. Coverage Area and
Location Density of current GSM base stations is
important for data transmission. This meter cannot be used
for three phase system. This meter is sensitive with respect
to tampering events, so while tampering continuously
indicating tampering which reduced speed of energy
calculation which introduced large error. By this meter P
& N swapping tampering method is not detected.
VII.2. Future Scope:
Future work also includes interfacing a General Packet
Radio Service (GPRS) modem with the remote meter [11].
Energy meter can be made as a prepayment. Billing can
be done at home by implementing swap card reader. This
meter can be modified as a three phase meter for
commercial and industrial load system. Visual inspection
can be possible to catch person who theft electricity, by
connecting camera. The meter can be designed for multiuser, so it will be cost effective.
VIII. CONCLUSION
Bar chart of Total loss(Rs/Units) in one day for each tampering events.
Total Loss
(Rs/Units)
VII. LIMITATIONS AND FUTURE SCOPE
By using GSM technology it is possible to collect energy
consumption of consumer without knocking the door of
consumer. It turns out that, the system can accurate
monitors the behavior of electricity-stealing, giving
prompt in time, reduces losses of electricity-stealing to the
minimum, decreases country property loss.
PO
Tampering Events
REFERENCES
Fig:- 10. Bar chart of Total loss (Rs/Units) at 1000watt
load for one day with tampering
From the daily calculation table:1, monthly loss by each
tampering events is calculate by using following formula.
i.e.
Copyright to IJIREEICE
[1] MD. Wasi-ur-Rahman, MD. Tanvir Ahmed, Tareq Hasan Khan, and
S.M. Lutful Kabir, ―Design of an Intelligent SMS based Remote
Metering System‖ Institute of Information and Communication
Technology (IICT) Bangladesh University of Engineering and
Technology (BUET) Dhaka-1000, Bangladesh.
[2] Paul Daigle,(April 2000) ―Digital Energy Meters by the Millions‖,
edition of utility automation.
DOI 10.17148/IJIREEICE.2015.31112
62
ISSN (Online) 2321 – 2004
ISSN (Print) 2321 – 5526
INTERNATIONAL JOURNAL OF INNOVATIVE RESEARCH IN ELECTRICAL, ELECTRONICS, INSTRUMENTATION AND CONTROL ENGINEERING
Vol. 3, Issue 11, November 2015
[3] Zheng Dezhi, Wang Shuai, ―Research on Measuring Equipment of
Single-phase Electricity-Stealing with Long-distance Monitoring
Function‖ Electronic measurement technology, 978-1-4244-24870/09/2009 IEEE.
[4] Mohit Arora, (feb. 2009) ―Prevent hacking, tampering in energy
metres‖, Freescale Semiconductor, EE Times-India, eetindia.com.
[5] Margery Conner , ―Tamper-resistant smart power meters rely on
isolated sensors‖, march 19, 2009.
[6] Gaykwad Ramakant A.(2008) ―Op-Amps and Linear Integrated
Circuits‖ 4th edition. Published by PHI Pvt.ltd, New Delhi.
[7] P. A. V. Loss, M.M. Lamego, G.C.D. Soma and J.L.F. Vieira ―A
Single Phase Microcontroller Based Energy Meter‖ (0-7803-47978/98/ 1998 IEEE)
[8] ―UM10119 P89LPC938 User manual‖ Rev. 02 — 4 March 2005 User
manual.
[9] Muhammad Ali Mazidi, J.G. Mazidi, R. D. Mckinly,(2008) ― The
8051 Microcontroller And Embedded System‖.4th edition
published by Dorling Kindersley(India) pvt. Ltd, licensees of
Pearson education in south Asia.
[10] Stephen Underwood, Frangline Jose, Vincent Chan, Application
Report SLAA391–March 2008 ―Three-Phase Electronic Watt-Hour
Meter Design Using Sp430 .
[11] Asoke K. Talukder, Roopa R. Yavagal,(2005), ―Mobile Computing
technology- Application and service creation.‖,Edition-1.EditorProf.H.N. Mahabala, Tata McGRAW Hill Publishing Company
Limited, New Delhi.
BIOGRAPHIES
Dr. M.V. Bhatkar, Professor & Principal J.E.S.I.T.M.R,
Nashik Maharashtra, India. Teaching Experience: - 25
Prof. Mrs. S.A. Thete, Assistant Professor& Head,
Electrical Engg, Dept. J.E.S.I.T.M.R, Nashik, Maharashtra
India. Teaching Experience: - 13
Copyright to IJIREEICE
DOI 10.17148/IJIREEICE.2015.31112
63