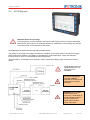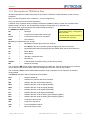
1
IPEmotion 3.03 Logger PlugIn/TESTdrive 3.51
Data Logger M-/S-LOG, FLEETlog, IPElog
August 2013
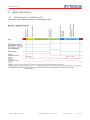
Table of contents
Table of contents
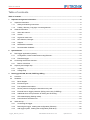
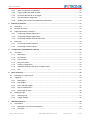
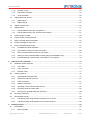
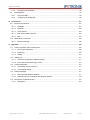
Table of contents ............................................................................................................................................. 2
1
Important and general information......................................................................................................... 6
1.1
1.1.1
Safety and Warning instructions .................................................................................................. 6
1.1.2
Liability, Warranty, Copyright, License agreement ...................................................................... 6
1.2
2
Important information .......................................................................................................................... 6
General information........................................................................................................................... 10
1.2.1
About this manual ...................................................................................................................... 10
1.2.2
Version ....................................................................................................................................... 10
1.2.3
Legend of used icons................................................................................................................. 10
1.2.4
New features, Changes ............................................................................................................. 11
1.2.5
Support....................................................................................................................................... 12
1.2.6
Related documentation .............................................................................................................. 12
1.2.7
Documentation feedback ........................................................................................................... 12
System basics ........................................................................................................................................ 13
2.1
Data logger applications (extract) ..................................................................................................... 13
2.1.1
Configuration, Online measurement using Ethernet.................................................................. 13
2.1.2
Fleet data logger ........................................................................................................................ 13
2.2
Connecting devices via CAN bus...................................................................................................... 14
2.2.1
2.3
3
Basics of CAN bus ..................................................................................................................... 14
Ampacity and voltage drop................................................................................................................ 16
2.3.1
Ampacity .................................................................................................................................... 16
2.3.2
Voltage drop............................................................................................................................... 16
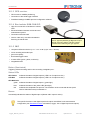
Data logger M-LOG, S-LOG, FLEETlog, IPElog ................................................................................... 17
3.1
Overview ........................................................................................................................................... 17
3.2
Hardware........................................................................................................................................... 19
3.2.1
Block diagram ............................................................................................................................ 19
3.2.2
Enclosure types ......................................................................................................................... 19
3.2.3
Port replicators and cables ........................................................................................................ 19
3.2.4
Device panel for changing the internal memory card ................................................................ 22
3.2.5
External fuse for logger protection (IPElog, M-/S-LOG, FLEETlog) .......................................... 22
3.2.6
Additional short-circuit protection for IPElog and FLEETlog...................................................... 23
3.2.7
LED status display (flashing codes)........................................................................................... 23
3.2.8
Power-down at excitation loss ................................................................................................... 23
3.3
Initial start-up..................................................................................................................................... 24
3.3.1
Connecting the logger................................................................................................................ 24
3.3.2
Detecting the logger, creating test configuration (Ethernet) ...................................................... 25
3.3.3
Add logger system, creating test configuration (USB stick)....................................................... 26
Logger_Manual_V03.51
IPETRONIK GmbH & Co. KG
ipetronik.com
2/ 123
Table of contents
4
3.3.4
Static and dynamic IP addresses .............................................................................................. 27
3.3.5
Logger system with CAN modules............................................................................................. 28
3.3.6
Access to data stored on the logger .......................................................................................... 29
3.3.7
Synchronizing the logger time ................................................................................................... 30
3.3.8
Updating the measurement application (TESTdrive)................................................................. 30
External connection ............................................................................................................................... 31
4.1
Grounding.......................................................................................................................................... 31
4.2
Remote connection ........................................................................................................................... 31
4.3
Digital input/output connection .......................................................................................................... 32
4.3.1
Connecting example digital input............................................................................................... 32
4.3.2
Connecting example digital output............................................................................................. 32
4.3.3
Connecting example external status LED.................................................................................. 33
4.4
5
4.4.1
Connecting example CAN bus................................................................................................... 33
4.4.2
Connecting example LIN bus..................................................................................................... 33
Configuration with IPEmotion (extract) ............................................................................................... 34
5.1
6
First steps.......................................................................................................................................... 34
5.1.1
Main dialog................................................................................................................................. 34
5.1.2
Die Title Bar ............................................................................................................................... 35
5.1.3
The file menu ............................................................................................................................. 35
5.1.4
Using the options ....................................................................................................................... 35
5.1.5
Creating a support file................................................................................................................ 39
5.1.6
IPEmotion working areas (main navigation tabs) ...................................................................... 40
5.1.7
Info ............................................................................................................................................. 41
Basic functions....................................................................................................................................... 42
6.1
Switching-on / switching-off............................................................................................................... 42
6.2
Triggering .......................................................................................................................................... 44
6.2.1
Start-trigger ................................................................................................................................ 44
6.2.2
Stop-trigger ................................................................................................................................ 44
6.2.3
Start- and Stop-trigger ............................................................................................................... 45
6.2.4
Stop is inverted start .................................................................................................................. 45
6.2.5
Save trigger channel .................................................................................................................. 46
6.3
7
Bus inputs.......................................................................................................................................... 33
Storage groups.................................................................................................................................. 46
6.3.1
Storage group ............................................................................................................................ 47
6.3.2
Trigger settings .......................................................................................................................... 48
Standard functions................................................................................................................................. 49
7.1
Calculations....................................................................................................................................... 49
7.1.1
Mathematic functions and operations ........................................................................................ 49
7.1.2
Constants ................................................................................................................................... 53
Logger_Manual_V03.51
IPETRONIK GmbH & Co. KG
ipetronik.com
3/ 123
Table of contents
7.1.3
NoValue control ......................................................................................................................... 53
7.1.4
Calculation examples................................................................................................................. 54
7.1.5
Local calculation ........................................................................................................................ 58
7.2
8
7.2.1
Digital inputs .............................................................................................................................. 59
7.2.2
Digital outputs ............................................................................................................................ 59
7.3
OBD-2 measurement ........................................................................................................................ 60
7.4
WakeOnCAN..................................................................................................................................... 61
7.4.1
ON via WakeOnCAN, OFF via Ignition 15................................................................................. 61
7.4.2
ON via WakeOnCAN, OFF via Switch-off condition .................................................................. 61
7.5
Output signals via CAN ..................................................................................................................... 62
7.6
Log file output via Hyperterminal....................................................................................................... 63
7.7
Send e-mail with status information .................................................................................................. 64
7.8
Output messages to CAN / LIN......................................................................................................... 65
7.9
Event controlled measurement ......................................................................................................... 67
7.9.1
Possibilities for data acquisition................................................................................................. 67
7.9.2
Cyclic data recording of continuous signals............................................................................... 68
7.9.3
Event-controlled data recording of bus signals.......................................................................... 69
7.9.4
Setting up event-controlled data recording (PlugIn IPETRONIK-LOG)..................................... 70
7.9.5
Practical example: Determination of the latency of two signals................................................. 73
Options (license required)..................................................................................................................... 74
8.1
Hardware options (internal)............................................................................................................... 74
8.1.1
CAN cards.................................................................................................................................. 74
8.1.2
CAN / LIN cards ......................................................................................................................... 74
8.1.3
Ethernet cards............................................................................................................................ 74
8.2
9
Digital inputs and outputs.................................................................................................................. 59
Software options ............................................................................................................................... 75
8.2.1
Import signal description files..................................................................................................... 75
8.2.2
Detection mode and cycle rate .................................................................................................. 81
8.2.3
Traffic acquisition ....................................................................................................................... 81
8.2.4
Statistics calculation................................................................................................................... 83
8.2.5
Operating in FTP mode (terminal server) .................................................................................. 85
8.2.6
Recording audio and video data ................................................................................................ 85
8.2.7
UDS protocol (Unified Diagnostic Services) .............................................................................. 86
8.3
Recording GPS-Data ........................................................................................................................ 87
8.4
Remote data transfer ........................................................................................................................ 88
8.4.1
Transferring data using GPRS and Internet to FTP server ....................................................... 88
8.4.2
Transferring data using Wireless LAN to netzwork server ........................................................ 89
Display modules..................................................................................................................................... 90
9.1
M-VIEWfleet ...................................................................................................................................... 90
9.1.1
Keys and LEDs .......................................................................................................................... 91
Logger_Manual_V03.51
IPETRONIK GmbH & Co. KG
ipetronik.com
4/ 123
Table of contents
9.1.2
9.2
Configuring M-VIEWfleet ........................................................................................................... 92
M-VIEWgraph.................................................................................................................................... 95
9.2.1
Keys and LEDs .......................................................................................................................... 96
9.2.2
Configuring M-VIEWgraph ......................................................................................................... 96
10 Accessories .......................................................................................................................................... 101
10.1
Electrical accessories...................................................................................................................... 101
10.1.1
COMgate.................................................................................................................................. 101
10.1.2
Extender................................................................................................................................... 102
10.1.3
GPS receiver............................................................................................................................ 103
10.1.4
Bus isolator SAM-CAN-ISO ..................................................................................................... 103
10.1.5
iMIC.......................................................................................................................................... 103
10.2
Mechanical accessories .................................................................................................................. 105
10.2.1
Module mounting ..................................................................................................................... 105
11 Appendix ............................................................................................................................................... 106
11.1
Cable connection and Pin assignment............................................................................................ 106
11.1.1
M-LOG port replicators ............................................................................................................ 106
11.1.2
FLEETlog ................................................................................................................................. 109
11.1.3
IPElog....................................................................................................................................... 110
11.2
Starting up ....................................................................................................................................... 111
11.2.1
Overview Configuration & Measurement ................................................................................. 111
11.2.2
Flow chart of the measuring process....................................................................................... 112
11.3
Practical examples .......................................................................................................................... 113
11.3.1
Calculating memory footprint ................................................................................................... 113
11.3.2
Linear signal scaling ................................................................................................................ 114
11.4
Status messages............................................................................................................................. 117
11.4.1
Most important status messages ............................................................................................. 117
11.4.2
Warning and error messages after program update................................................................ 118
11.5
Description of TESTdrive files......................................................................................................... 119
11.5.1
Data types ................................................................................................................................ 120
Logger_Manual_V03.51
IPETRONIK GmbH & Co. KG
ipetronik.com
5/ 123
Important and general information
1
Important and general information
1.1
Important information
Please follow these instructions before and during the use and application on any IPETRONIK
product!
1.1.1
Safety and Warning instructions
Please follow the instructions and information as contained in the user manual!
1. The user can influence an electronic system by applying the IPETRONIK product. This might
cause risk of personal injury or property damages.
2. The use and application of the IPETRONIK product is permitted only to qualified professional
staff, as well as, only in appropriate manner and in the designated use.
3. Before using an IPETRONIK measurement system in the vehicle it has to be verified that no
function of the vehicle, which is relevant for secure operation, might be influenced:
- by the installation of the IPETRONIK measurement system in the vehicle,
- by an potential malfunction of the IPETRONIK system during the test drive.
In order to avoid possible danger or personal injury and property damages, appropriate actions are
to be taken; such actions have to bring the entire system into a secured condition (e.g. by using a
system for emergency stop, an emergency operation, monitoring of critical values).
Please check the following points to avoid errors:
-
Adaption of sensors to components of the electrical system / electronics, brake system, engine
and transmission control, chassis, body.
-
Tap of one or several bus systems (CAN, LIN, ETHERNET) including the required electrical
connection(s) for data acquisition.
-
Communication with the vehicle’s control units (ECUs), especially with such of the brake system
and/or of the engine and transmission control (power train control system).
-
Installation of components for remote data transmission (mobiles, GSM/GPRS modems, WiFi
and Bluetooth components).
4. Before directly or indirectly using the data acquired by an IPETRONIK measurement system to
calibrate control units, please review the data regarding to plausibility.
5. With regard to the application of IPETRONIK products in vehicles during use on public roads the
manufacturer and/or registered user of the vehicle has to ensure that all changes/modifications
have no influence concerning the license of the vehicle or its license of operation.
6. User does agree to the instructions and regulations as mentioned above. In case the user does
not agree with the instructions and regulations as mentioned above, he has to notify this expressly
and immediately in writing to IPETRONIK before confirming the sales contract.
1.1.2
Liability, Warranty, Copyright, License agreement
Limitation of liability
Any liability of IPETRONIK, its representatives, agents and the like, especially with regard to personal injury
or damage to property of any kind, shall be excluded (within the legally admissible framework), as far as, the
instructions and warnings, as mentioned below, have not been followed.
Warranty
Products, accessories and services have a 24 months warranty.
All product data, specifications, drawings, etc., correspond to the current condition of the indicated creation
date. For the purpose of optimizing technical processes and production, some details of our modules and
accessory components may be modified at any time without prior notification.
Although the present document has been prepared with the utmost attention to detail, it may not be exempt
of misprints, typing or transcription errors. These errors are not covered by any warranty.
Logger_Manual_V03.51
IPETRONIK GmbH & Co. KG
ipetronik.com
6/ 123
Important and general information
Copyright and Duplication
All rights reserved to IPETRONIK GmbH & Co. KG, in particular those of property, copyright and trademarks.
The rights related to any third party trademarks mentioned in the present document remain unaffected.
This document may not be duplicated, partially or entirely without the prior approval from IPETRONIK GmbH
& Co. KG. All graphics and explanations are copyright protected. Any use beyond the scope of the document
is prohibited.
Software license agreement
This software is property of IPETRONIK GmbH & Co. KG, and is protected by copyright laws. Its total or
partial reproduction is strictly forbidden.
A valid software license is required to use the software.
IMPORTANT - READ CAREFULLY! THIS IS A LEGAL AGREEMENT BETWEEN YOU, LICENSEE, AND
IPETRONIK GMBH & CO. KG/IPETRONIK INC. ("IPETRONIK"). BY CHECKING “I ACCEPT ALL OF THE
TERMS CONTAINED IN THE ABOVE AGREEMENT” DURING INSTALLATION, COPYING OR USING
THIS PRODUCT IN ANY WAY YOU ACKNOWLEDGE THAT YOU HAVE READ THIS LICENSE AND THAT
YOU UNDERSTAND AND EXPRESSLY AGREE TO BE BOUND BY THE TERMS AND CONDITIONS SET
FORTH BELOW.
1. Definitions
a.
SOFTWARE is defined as computer program in object code or machine-readable format,
together with any and all modifications, enhancements, updates, and improvements provided
by IPETRONIK as well as any subsequent versions, corrections, bug fixes, enhancements,
updates or other modifications, regardless of the source. The term “Licensed Software” shall
not include the source code version of the Licensed Software.
b.
EQUIPMENT is defined as automotive measuring equipment produced by IPETRONIK as well
as other parties.
c.
LICENSEE is defined as the recipient of this SOFTWARE and any of its employees, agents or
representatives.
d.
MODIFY or MODIFICATION is defined as change to the SOFTWARE by LICENSEE in order
to customize the SOFTWARE for use solely by LICENSEE.
2. License Terms
a.
As long as LICENSEE complies with all terms in this Software License Agreement
IPETRONIK grants LICENSEE a non-exclusive, non-transferable license to load and use the
SOFTWARE upon the terms and conditions set forth below.
b.
LICENSEE has the right to load the SOFTWARE for use on any internal computer or piece of
EQUIPMENT, as long as it is only on one computer or piece of EQUIPMENT at any given
time.
c.
LICENSEE will notify all of its employees, agents or representatives permitted access to the
SOFTWARE of the duties and obligations under this Software License Agreement.
d.
LICENSEE has the right to MODIFY the SOFTWARE for use on any internal computer or of
EQUIPMENT, as long as it is only on one computer or piece of EQUIPMENT at any given
time.
e.
Any MODIFICATION(S) to the SOFTWARE are subject to the terms and conditions of this
Agreement.
f.
LICENSEE may not:
i.
Loan, rent, lease, give, sublicense, distribute, transmit or otherwise transfer the
SOFTWARE, or otherwise exercise any of IPETRONIK's legal rights in and to the
SOFTWARE, or any derivative works of the SOFTWARE, in whole or in part, except with
the prior written agreement of IPETRONIK.
ii.
Copy, translate, reverse engineer, decompile, disassemble the SOFTWARE, in whole or
in part.
iii.
Except as provided is Section 2(d), create derivative works based on the SOFTWARE, in
whole or in part.
Logger_Manual_V03.51
IPETRONIK GmbH & Co. KG
ipetronik.com
7/ 123
Important and general information
iv. Remove, modify or cause not to be displayed any copyright or trademark notices, license
agreements, or startup messages contained in the programs or documentation.
v.
Transmit or otherwise export outside of the Unites States any of the SOFTWARE or
technology in violation of United States or other applicable laws or regulations.
3. Ownership of Intellectual Property
LICENSEE agrees and acknowledges that the SOFTWARE is being provided to it only for use in
EQUIPMENT in the ordinary course of business and that LICENSEE agrees and acknowledges
that IPETRONIK is the owner of all title and proprietary rights in the SOFTWARE, including, without
limitation, any and all patents, copyrights, trademarks or any other intellectual property rights
associated with it under the laws of the United States or any jurisdiction throughout the world. No
right, title or interest in the SOFTWARE or any IPETRONIK patent, copyright, trademark, or any
other intellectual property right is transferred to LICENSEE or any other party through this Software
License Agreement.
4. Disclaimer of Warranties; Liability Limitations
a.
THE SOFTWARE IS PROVIDED TO YOU "AS IS". THERE ARE NO WARRANTIES OF ANY
KIND, WHETHER EXPRESS OR IMPLIED, INCLUDING BUT NOT LIMITED TO THE
WARRANTIES OF MERCHANTABILITY, FITNESS FOR A PARTICULAR PURPOSE AND
COMPATIBILITY, AND TITLE.
b.
LICENSEE ASSUMES ALL RISK AS TO THE SELECTION, USE, PERFORMANCE AND
QUALITY OF THE SOFTWARE. IN NO EVENT WILL IPETRONIK OR ANY OTHER PARTY
WHO HAS BEEN INVOLVED IN THE CREATION, PRODUCTION OR DELIVERY OF THE
SOFTWARE BE LIABLE FOR SPECIAL, DIRECT, INDIRECT, INCIDENTAL OR
CONSEQUENTIAL DAMAGES, INCLUDING LOSS OF PROFITS OR INABILITY TO USE
THE LICENSED MATERIAL. IN NO EVENT SHALL IPETRONIK'S LIABILITY FOR ANY
DAMAGES OR LOSS TO LICENSEE OR TO ANY THIRD PARTY EXCEED ANY LICENSE
FEE ACTUALLY PAID BY THE LICENSEE TO IPETRONIK FOR THE SOFTWARE.
c.
Since some states or jurisdictions do not permit the exclusion of implied warranties or
limitation of liability for consequential damages, in such states or jurisdictions, the liability is
limited to the fullest extent permitted by law.
5. Intellectual Property Infringement Indemnification
a.
b.
IPETRONIK shall defend, indemnify, and hold LICENSEE harmless from and against any
claims and fees (including attorneys’ fees), damage awards arising in connection with a claim
that the licensed SOFTWARE or documentation, when properly used, infringes upon any
presently existing, valid and enforceable United States patent, trademark, or other intellectual
property right, provided that:
i.
such claim of infringement is not based on any Modification or action taken or suffered by
LICENSEE other than the use of the licensed SOFTWARE and documentation in
accordance with the terms and conditions of this agreement;
ii.
such claim of infringement is not based on any action by LICENSEE in modifying the
SOFTWARE pursuant to the terms of Section 2(d).
iii.
LICENSEE promptly notifies IPETRONIK of such claim in writing at
[email protected], and gives IPETRONIK exclusive control over the defense and
settlement of such claim;
iv.
LICENSEE provides such cooperation and assistance, at IPETRONIK’S expense, as
IPETRONIK may reasonably request to settle or oppose any such claim; and
v.
such claim of infringement is based only on the licensed SOFTWARE and documentation
as provided to LICENSEE.
In the event of any infringement claim for which IPETRONIK is liable pursuant to section 5 (a),
IPETRONIK may, at its sole option and expense:
i.
procure for LICENSEE the right to continue using the licensed SOFTWARE or
documentation;
ii.
modify or amend the licensed SOFTWARE or documentation so that it becomes noninfringing;
iii.
replace the licensed SOFTWARE or documentation with a non-infringing substitute; or
Logger_Manual_V03.51
IPETRONIK GmbH & Co. KG
ipetronik.com
8/ 123
Important and general information
iv.
c.
recover the infringing licensed software and documentation from LICENSEE and repay to
LICENSEE all license fees paid to IPETRONIK in connection therewith, less a reasonable
amount based on LICENSEE’s use prior to such recovery and refund.
This Article 5 sets forth IPETRONIK’s sole obligations and liability for intellectual property
infringement. These indemnity provisions only apply to the SOFTWARE as originally licensed
to LICENSEE and do not cover any MODIFICATIONS made by LICENSEE or any other third
party.
6. Limitation of Liability
a.
EXCEPT WITH RESPECT TO ITS INTELLECTUAL PROPERTY INDEMNIFICATION
OBLIGATIONS, AS SET FORTH IN ARTICLE 5, IN NO EVENT SHALL IPETRONIK BE
LIABLE FOR SPECIAL, INDIRECT OR CONSEQUENTIAL DAMAGES (INCLUDING,
WITHOUT LIMITATION, LOST PROFITS, LOST DATA, OR LOST SAVINGS), EVEN IF
IPETRONIK WAS ADVISED OF THE POSSIBILITY OF SUCH DAMAGES. FURTHERMORE,
IPETRONIK’S LIABILITY (WHETHER IN CONTRACT, TORT, OR OTHERWISE) ARISING
OUT OF, OR CONNECTED WITH, THIS AGREEMENT OR THE LICENSED SOFTWARE OR
DOCUMENTATION SHALL IN NO CASE EXCEED THE PAYMENTS RECEIVED BY
IPETRONIK FROM LICENSEE FOR THE LICENSED SOFTWARE AND DOCUMENTATION.
b.
EXCEPT IN CONNECTION WITH ITS OBLIGATIONS UNDER ARTICLE 5:
i.
IN NO EVENT SHALL LICENSEE BE LIABLE FOR SPECIAL, INDIRECT OR
CONSEQUENTIAL DAMAGES (INCLUDING, WITHOUT LIMITATION, LOST PROFITS,
LOST DATA, OR LOST SAVINGS), EVEN IF LICENSEE WAS ADVISED OF THE
POSSIBILITY OF SUCH DAMAGES; AND
ii.
LICENSEE’S LIABILITY (WHETHER IN CONTRACT, TORT, OR OTHERWISE)
ARISING OUT OF, OR CONNECTED WITH, THIS AGREEMENT OR THE LICENSED
SOFTWARE OR DOCUMENTATION SHALL IN NO CASE EXCEED THE PAYMENTS
OWED TO LICENSOR FOR THE LICENSED SOFTWARE AND DOCUMENTATION.
7. Indemnification Obligations of LICENSEE
a.
LICENSEE shall defend, indemnify, and hold IPETRONIK harmless from any claims, losses,
expenses, fees (including attorneys’ fees), costs or damages arising in connection with a
MODIFICATION or LICENSEE’S unauthorized use of the Licensed Software or
Documentation.
8. Merger Clause
a.
LICENSEE agrees that this Software License Agreement is the complete and exclusive
agreement between LICENSEE and IPETRONIK governing the SOFTWARE. This Software
License Agreement supersedes and merges all prior agreements with IPETRONIK concerning
the SOFTWARE and can only be modified by a subsequent written agreement signed by
IPETRONIK. To the extent that there is any conflict between this Software License Agreement
and any IPETRONIK purchase order or other written agreement for the purchase of
IPETRONIK parts or products, the terms of the purchase order or written agreement control.
9. General
a.
If any provision or portion of a provision of this Software License Agreement is determined to
be invalid or unenforceable, it shall be deemed omitted and the remaining provisions of this
Software License Agreement shall remain in full force and effect to the fullest extent permitted
by law.
b.
LICENSEE may not assign or transfer all or part of this Software License Agreement to any
third party without the express written approval of IPETRONIK.
c.
This Software License Agreement will be governed by the laws of the State of Michigan
without regard to its conflict of laws provisions.
d.
All disputes arising out of, or in connection with, the present contract shall be finally settled
under the Rules of Arbitration of the International Chamber of Commerce by one or more
arbitrators appointed in accordance with the said Rules.
Logger_Manual_V03.51
IPETRONIK GmbH & Co. KG
ipetronik.com
9/ 123
Important and general information
1.2
1.2.1
General information
About this manual
The manual describes the structure of the IPEmeasue data logger devices M-LOG, S-LOG, FLEETlog, and
IPElog, as well as, peripheral devices and accessories components.
1.2.2
Version
This manual has the version number 03.51.01, released August 2013
© All rights reserved !
IPEmotion PlugIn IPETRONIK-LOG
Contents described in this document relates to the current release version 03.51.01.
To run this PlugIn an IPEmotion release ≥ V02.00 has to be installed on your computer.
IPEmotion
Contents described in this document relates to the release versions 01.09. to 3.03
1.2.3
Legend of used icons
Tip
This icon indicates a useful tip that facilitates the application of the software.
Information
This icon indicates additional information for a better understanding.
Attention!
This icon indicates important information to avoid potential error messages.
Logger_Manual_V03.51
IPETRONIK GmbH & Co. KG
ipetronik.com
10/ 123
Important and general information
1.2.4
New features, Changes
Please also refer to the latest release notes at:
c:\Program Files (x86)\IPETRONIK\IPEmotion PlugIn IPETRONIK LOG V03.5x.xx\Help\
PlugIn IPETRONIK-LOG V03.51
Release July 2013
No.
Feature
Description
1
PIN assignment
FLEETlog and IPElog added
2
Traffic storage groups
Traffic measurement now support different storage groups
3
Extension for IPElog
(requires PIC ≥ V01.01.07,
FPGA ≥ V01.02.08
NoMessageLost function (NML)
WakeOnCAN can be activated for each channel
up to 6 ID triggers
Logger restart using WakeOnCAN or remote signal
CAN-ID trigger now StartNotStopTrigger (instead StartOnly)
PIC update per job executable
Status indication of the flap for the storage medium with
M-VIEWfleet
4
CCP
Command CCP_DISCONNECT implemented
5
Upload and download
Supported with different transfer media (Modem, WiFi)
6
Event controlled measurement
CAN data acquisition based on traffic measurement but
handled as signal measurement (DAT format)
7
Masks
for CAN identifiers are supported now
8
File name length
Up to 260 characters are allowed for file names of the external
library and configuration files.
9
Stop date, Stop time
Stored as project property with the traffic file
10
PreTriggerTime, PostTriggerTime
Supported as project property
PlugIn IPETRONIK-LOG V03.50
Release October 2012
No.
Feature
Description
1
Notes
Version reference
SC1200
IPElog
Logger PlugIn ≥ 3.5x requires IPEmotion ≥ 2.xx
M-LOG with SC1200 is no longer supported
Requires TESTdrive / PlugIn IPETRONIK-LOG ≥ 3.5x
2
Status signal "FIFO overrun"
Indicates the data processing status.
Output 0 = OK, Ouput 1 = processor overloaded
3
Debounce time of the remote
signal
Configurable delay time within a range of 0 ... 5 seconds. The
signal status ist valid if the remote signal lasts for this time
without interruption.
4
Extensions TESTdriveCmd.xml
New jobs "OnOK" and "OnError" used for audible alarm of the
job "OnConnect"
5
Differnt init modes for module
initialization
Connected IPETRONIK modules will be initialized on
command: Never, Once-only, Always.
6
Status e-mail with snap shot report Each time the trigger condition is fulfilled, the current signal
values (configured in the mail group) will be sent per mail.
7
Limit display with M-VIEWvga
Indication of limit violation has been revised.
8
V-TABs enable clear text display
Individual text can be assigned to different signal values (or
ranges) which is respectively displayed (instead of digits).
Logger_Manual_V03.51
IPETRONIK GmbH & Co. KG
ipetronik.com
11/ 123
Important and general information
1.2.5 Support
Headquarter:
IPETRONIK GmbH & Co. KG
Im Rollfeld 28
76532 Baden-Baden, Germany
Phone +49 7221 9922 0
Fax +49 7221 9922 100
[email protected]
www.ipetronik.com
Limited commercial partnership with its head office in Baden-Baden, registry court HRA No. 201313
IPETRONIK Verwaltungs-GmbH Baden-Baden is an individually liable society, registry court Mannheim HRB
No. 202089
CEOs: Erich Rudolf, Andreas Wocke
Technical support and product information
www.ipetronik.com
1.2.6
e-mail: [email protected]
Related documentation
IPEmotion
The documentation IPEmotion.pdf provides you with a description and useful information related to
IPEmotion. This documentation is stored in the following standard language dependent directory:
C:\Programs\IPETRONIK\IPEmotion Vxx.xx.xx\Help
1.2.7
Documentation feedback
At IPETRONIK, the technical publications team strives to produce documentations of the highest quality and
values your feedback as a reader and user. If you have any comments or suggestions regarding our product
manuals, contact us under [email protected] .
When commenting on our products, please include the following information:
Version number
Name of the guide
Page number or section title
Brief description of the content (e.g. inaccurate instructions, grammatical errors, or information that
require clarification)
Any suggestions for a general documentation improvement
Logger_Manual_V03.51
IPETRONIK GmbH & Co. KG
ipetronik.com
12/ 123
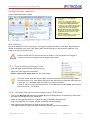
System basics
2
2.1
System basics
Data logger applications (extract)
2.1.1
Configuration, Online measurement using Ethernet
2.1.2
Fleet data logger
Logger_Manual_V03.51
IPETRONIK GmbH & Co. KG
ipetronik.com
13/ 123
System basics
2.2
2.2.1
Connecting devices via CAN bus
Basics of CAN bus
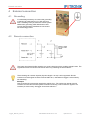
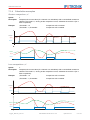
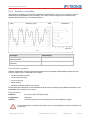
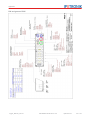
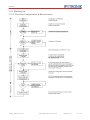
CAN-Standard
The communication of the IPETRONIK SIM and M devices takes place by using the CAN bus according to
the CAN 2.0 A (11 Bit Identifier) and CAN 2.0 B (29 Bit Identifier) specification. Each software application,
which is able to detect CAN data via a suitable interface, can detect the device data and process. Examples:
CANalyzer, INCA, DIAdem, LabVIEW. The device configuration takes place by using the CAN bus and the
IPETRONIK configuration software.
Structure of a CAN message
User data within the CAN
message.
Maximum 8 values in the byte
format or 4 values (4 channels)
in the Word format can be
transferred depending on the
CAN message.
recessive
Remoteframe CAN 2.0A (11 Bit Identifier)
Start
1 Bit
Identifier
11 Bits
RTR IDE r0
1 Bit 1 Bit 1 Bit
DLC
4 Bit
CRC
15 Bit
Data
0..8 *8 Bit
ACK
2 Bit
EOF + IFS
10 Bit
Data
0..8 *8 Bit
CRC
15 Bit
recessive
Remoteframe CAN 2.0B (29 Bit Identifier)
Start
1 Bit
Identifier
11 Bits
SRR IDE
1 Bit 1 Bit
Identifier
18 Bits
RTR r1 r0
1 Bits 1 Bit 1 Bit
DLC
4 Bit
ACK
2 Bit
EOF + IFS
10 Bit
CAN 2.0A (11 Bit Identifier)
CAN 2.0A (11 Bit Identifier)
Bits
Description
Bits
Description
1
SOF
Start of Frame
1
SOF
Start of Frame
11
ID
Identifier
11
ID
Identifier
1
SRR
1
IDE
Identifier Extension (1)
18
ID
Identifier (extended)
1
RTR
Remote Transmission Request
1
r1
1
r0
1
1
IDE
Identifier Extension (0)
RTR
Remote Transmission Request
1
r0
4
DLC
Number of following data bytes
4
DLC
Number of following data bytes
64
Data
Data bytes
64
Data
Data bytes
15
CRC
Error Identification Code
15
CRC
Error Identification Code
2
ACK
Acknowledge
2
ACK
Acknowledge
10
EOF
End of Frame
10
EOFS
End of Frame
Sum
130
110
Word
0
1
2
3
Byte
Sum
Bit (Message layout in the displaying format „Intel Standard“)
0
1
2
3
7
15
23
31
6
14
22
30
5
13
21
29
4
12
20
28
3
11
19
27
2
10
18
26
1
9
17
25
0
8
16
24
4
5
6
7
39
47
55
63
38
46
54
62
37
45
53
61
36
44
52
60
35
43
51
59
34
42
50
58
33
41
49
57
32
40
48
56
Logger_Manual_V03.51
IPETRONIK GmbH & Co. KG
ipetronik.com
14/ 123
System basics
Access to the CAN bus, Transferring properties
The CAN bus allows a safe and effective data transfer of the connected devices (non-destructive bitwise
arbitration = resource distribution to different devices). The CAN bus is therefore used as a standard
communication medium in the automotive area and the industrial automation.
The most important characteristic CAN bus properties are:
►
Every bus participant (node) can send, as well as, receive.
►
First of all, the node, which wants to send, needs the authorization. All participants become
automatically a recipient (There is no abortion of the data sending process > non-destructive
collision).
►
No stations are addressed but messages.
►
Every message is characterized by its name (Identifier).
►
The less the identifier, the higher the message priority.
►
A message can transport up to 8 * 8 Bit = 64 Bit (8 Byte) user data, whereas each message
requires 110 Bit or 130 Bit (Extended ID).
►
Depending on the hardware and the bus line length, up to 1 MBit/ s can be transferred.
The following important conclusions result from the properties above:
►
The less the bus load, the less the probability of a “Bus access conflict” (you can call this a real- time
capable area).
►
A high bus load forces stations to loose messages with a high identifier or to send them more
slowly. Messages with a high identifier can “get lost”.
►
Not sent messages are only registered by the “Recipient node” because data are missing. If no
timeout has been defined, the last valid value is generally sent, i.e. a mistakenly constant value.
Transfer rate, Bus line length
The CAN bus supports a max. transfer rate of 1 MBit/s according to Norm ISO 11898-2.
This value is limited in practice by the following points:
►
the bus line length
►
the branch line length to the CAN stations
►
the bus lines quality and the plug contacts
►
the bus line design (twisted, single or two-wire bus)
►
bus connection structure and
►
type and strength of external perturbations
Example
Data rate on the bus
Data length of a CAN message
User data in a message
Time for a CAN message
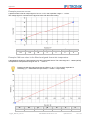
Calculating the total sampling rate
Converted to one channel
Theoretical transfer rate
Practical experiences
1 MBit/s = 1 µs/Bit
130 Bits gesamt
64 Bit = 4 values with 16 Bit resolution each
130 Bit x 1 µs/Bit = 130 µs/message
i.e. 4 values require 130 µs
130 µs match 7.69 kHz
4 x 7.69 kHz = 30.76 kHz
30 channels with 1 kHz = 30 kHz
26 channels with1 kHz = 26 kHz
The value is lower at guaranteed synchronity.
If CAN messages are not completely used (e.g. only three 16 bit values instead of four per message), less
data can be transferred although the sum sampling rate has not yet reached the maximum. This also applies
if different sampling rates are defined in one system, because the data division to the CAN messages is not
time-optimized (minimum time required).
Logger_Manual_V03.51
IPETRONIK GmbH & Co. KG
ipetronik.com
15/ 123
System basics
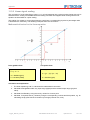
2.3
Ampacity and voltage drop
Besides the fact that the max. bus line length is defined by the desired data transfer rate, the ampacity and
the voltage drop in the system have primarily to be checked. This is especially important for systems with a
high number of devices and/or long connections lines of the devices (e.g. distributed systems with
connection lines of 3 m (9.84 ft) and more between the device groups). Additional actions should be taken
accordingly to the situation.
2.3.1
Ampacity
The maximum current via the M-CAN system cables (e.g. 620-560.xxx) is 4 A (heat generation by transition
resistances of the plug contacts).
The system capacity and therefore the power consumption can approximately be calculated by using the
number of devices (including the sensor supply). A direct power acquisition in the real system provides exact
values.
We recommend one or several of the following actions if the limit value is exceeded:
►
Increasing the supply voltage of the devices (e.g. 24 V DC power supply or 42 V DC
instead of 12 V)
►
Centered voltage supply via T connection or as close as possible to the devices with high
power requirements (rather than at the beginning or end of the system chain)
►
Additional system supply via a T connection at a suitable position
2.3.2
Voltage drop
Even if the limit value for the ampacity is not reached, long lines in an extensive system can cause
perturbations in the acquisition process. This mainly applies to devices at the end of the system chain,
because the voltage of the last devices does not exceed the input threshold of 9 V (due to a high voltage
drop in the system).
We recommend one or several of the actions mentioned above.
The voltage drop can be calculated by using the following formula:
U=RxI
R = 2 x RCable [Ω/m] x LengthCable [m]
I = PDevices [W] / UDevices [V]
For estimating the voltage drop, a resistance of
> 50 mΩ/m for the M-CAN cables and
> 35 mΩ/m for the SIM-CAN cables
can be used including the transition resistances of the plug contacts. Systems, which are in the limit range of
the voltage drop, should be controlled in individual cases. To do so, our support will be pleased to assist you.
As the power consumption of a device depends on the supply voltage, it is useful to calculate the voltage
drop from the chain end to the feeding point. In this case, a minimum voltage of 9 V is set to the last device
and the required excitation is calculated. The calculated value should be generously rounded upwards for
guaranteeing a safe operation.
Another fact is the variable internal resistance of the input power supplies (low excitation = lower internal
resistance).
In practice, this means: If the net excitation decreases (e.g. because of a weak power supply or a high
resistivity with long cables), the devices have to readjust to cover the current power requirements. This
causes a higher power consumption, which additionally increases the voltage drop.
Logger_Manual_V03.51
IPETRONIK GmbH & Co. KG
ipetronik.com
16/ 123
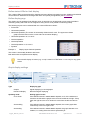
Data logger M-LOG, S-LOG, FLEETlog, IPElog
3
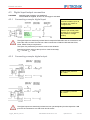
3.1
Data logger M-LOG, S-LOG, FLEETlog, IPElog
Overview
Overview properties and options
M-LOG LX
S-LOG
FLEETlog
IPElog
LX800, 256
LX800, 256
LX800, 256
Atom, 1024
Real-time operating system
IPETRONIK TESTdrive software
Compact flash data storage medium (removable)
▬
1.8'' SSD data storage medium (removable)
▬
▬
▬
Intelligent power management
COM1, COM2
▬
▬
ETH (Ethernet as IPETRONIK system interface)
USB 2.0
2
2
2
3
4/4
4/4
2/2
4/4
2x CAN High Speed acc. to 11898-2
Option
Option
▬
4x CAN High Speed acc. to 11898-2
Option
Option
2x CAN High Speed acc. to 11898-2 + 2x LIN
Option
Option
▬
1x CAN High Speed acc. to 11898-2 +
1x CAN Single Wire + 2x LIN
Option
Option
▬
2x ETH (Ethernet as measurement input)
Option
Option
▬
Option
External
External
▬
External
PC
CPU, RAM on-board (MB)
(>= V3.19) (>= V3.50
Interfaces (Hardware)
DIG IN / DIG OUT
Acquire FlexRay data via FlexRay-Ethernet converter
(requires Ethernet input option)
3
WiFi acc. to 802.11b/g
External
1)
External
1)
FLEETlog
WAN
GPRS/UMTS
External
2)
External
2)
FLEETlog
WAN
Positioning via GPS and NMEA0183
External
External
FLEETlog
WAN
Audio input (standard micro or iMIC)
External
External
▬
▬
Video input (USB camera)
External
External
▬
External
CCP
Option
Option
Option
Option
KWPonCAN, XCPonCAN
Option
Option
Option
Option
XCPonEthernet
Option
Option
▬
Option
GMLAN
Option
Option
▬
▬
Seed & Key
Option
Option
Option
Option
UDS
Option
Option
Option
Option
Protocols, processes
Logger_Manual_V03.51
IPETRONIK GmbH & Co. KG
ipetronik.com
17/ 123
Data logger M-LOG, S-LOG, FLEETlog, IPElog
Data acquisition / processing / transferring
Option
Option
Option
Option
Packing, splitting, encoding data
CANsend: Data and status signal output via CAN
WakeOnCAN
Option
Option
Option
Option
LOG2PC
XCP-Service
Online calculations, different storage groupes
Statistics, also parallel to time related data
Traffic measurement
1)
2)
COMgate or COMgate WAN
COMgate WAN
Overview properties and options
M-LOG LX
S-LOG
FLEETlog
IPElog
Device in general
Excitation all 12/24/42 VDC power supplies
▬
▬
Excitation 9 to 36 VDC
Ambient temperature -40 °C to +85 °C
(-40 °F to +185 °F)
▬
Ambient temperature -20 °C to +70 °C
(-4 °F to +158 °F)
Enclosure protection class IP54
▬
Enclosure protection class IP30
Port replicator selectable
▬
▬
▬
Removable data storage media
Configuration with IPEconf 4
▬
▬
Configuration with IPEmotion
Data transfer range of built-in modems (FLEETlog, IPElog)
Frequency range
Quad-Band EGSM 850 / 900 / 1800 / 1900
Download rate
HSDPA 7,2 Mbps
UMTS/HSDPA (WCDMA/FDD) 2100 MHz
GPRS multi-slot class 12
Edge multi-slot class 12
Logger_Manual_V03.51
IPETRONIK GmbH & Co. KG
ipetronik.com
18/ 123
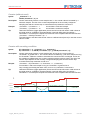
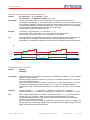
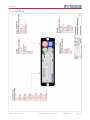
Data logger M-LOG, S-LOG, FLEETlog, IPElog
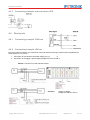
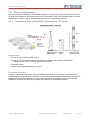
3.2
3.2.1
Hardware
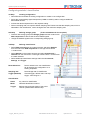
Block diagram
The block diagram shows the basic structure of the logger board.
3.2.2
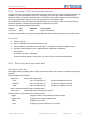
Enclosure types
M-LOG with port replicator PR05
S-LOG front view
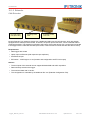
FLEETlog front and rear view
The M-LOG enclosure is compatible to all M devices. The devices can be easily connected with each other
with a dovetail adapter. M-LOG is available with 6 different port replicators (cable connecting adapter). User
specific port replicators are available on request.
S-LOG uses a SIM standard enclosure and can easily be integrated into a SIM devices system. Both loggers
can be connected to M devices, as well as, to SIM devices (also mixed) with suitable mechanical adapters.
The FLEETlog hardware concept was designed for using the data logger in vehicle fleets, whereas
FLEETlog WAN is already equipped with modem, WiFi client, and GPS receiver.
3.2.3
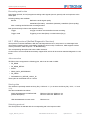
Port replicators and cables
Various cables are available for every port replicator. The complete
PIN configuration, as well as, the appropriate cables of the PR05
and PR08 port replicators are shown in the appendix.
Logger_Manual_V03.51
IPETRONIK GmbH & Co. KG
ipetronik.com
19/ 123
Data logger M-LOG, S-LOG, FLEETlog, IPElog
Cable overview M-LOG PR05 and S-LOG
1
1
5
4
7
8
6
1
600-580.xxx
D-Sub/ S 9 ▬ CAN, open
620-537.xxx
D-Sub/ S 9 ▬ CAN, Banana
620-593.xxx
D-Sub/ S 9 ▬ 2x CAN, D-Sub open
2
2
3
Bus input
M-CAN
620-560.xxx
Lemo 0B 9 ▬ M-CAN
620-562.xxx
Lemo 0B 9 ▬ SIM-CAN
2
7
4
8
5
SIM-CAN
600-830.xxx
Lemo 1B 10 ▬ SIM-CAN
600-893.xxx
Lemo 1B 10 angled
▬ SIM-CAN angled
620-562.xxx
Lemo 0B 9 ▬ SIM-CAN
2
3
Display
620-578.xxx
Lemo 1B 10 ▬ M-VIEWfleet
620-595.xxx
Lemo 1B 10 ▬ M-VIEWgraph
6
4
620-324.xxx
5
D-Sub HD/ P 15 ▬ open
COM
620-576.xxx
Sub HD/ S 15 ▬ Modem
620-596.xxx
Sub HD/ S 15 ▬ Modem + GPS
6
Power/Remote
620-574.xxx
7
Lemo 1B 6 ▬ Banana
LAN
620-591.xxx
8
3
Digital input / output
Lemo 0B 6 ▬ Ethernet RJ45
Audio
620-550.xxx
Lemo 0B 5 ▬ Audio In/Out 3.5mm
620-551.xxx
Lemo 0B 5 ▬ Audio In/Out 2.5mm
System and input cables are also available in different lengths and socket configurations.
Logger_Manual_V03.51
IPETRONIK GmbH & Co. KG
ipetronik.com
20/ 123
Data logger M-LOG, S-LOG, FLEETlog, IPElog
PIN configuration PR05 and S-LOG
1
BUS INPUTt
PIN
1
2
3
4
5
6
7
8
9
2
CAN 1
CAN 5
CAN5 – L
CAN 2
CAN 6
CAN6 – L
CAN 3
CAN 7 (LIN 1)
CAN7 – L
(LIN1-VBAT)
CAN1 – L
CAN2 – L
CAN3 – L
CAN1/5 – GND
CAN2/6 – GND
CAN3/7 – GND
(LIN1-GND)
CAN6 – H
CAN7 – H
CAN5 – H
(LIN1 – H)
Option (VBATT-IN,
Option (VBATT-IN,
Option (VBATT-IN,
CAN5 WakeOnCAN CAN6 WakeOnCAN CAN7 WakeOnCAN
PWR-GND
PWR-GND
PWR-GND
CAN1 – H
CAN2 – H
CAN3 – H
Option (VBATT-IN,
Option (VBATT-IN,
Option (VBATT-IN,
CAN5 WakeOnCAN CAN2 WakeOnCAN CAN3 WakeOnCAN
UB-OUT+
UB-OUT+
UB-OUT+
M-CAN / SIM-CAN
PIN
1
2
3
4
5
6
7
8
9
10
4
SIM-CAN
CAN – H
CAN – L
CAN – GND
Status IN
SYNC+
SYNC–
SIM-PWR+
SIM-PWR+
PWR-GND
PWR-GND
DIN / DOUT / LED
PIN
1
2
3
4
5
6
7
8
9
10
11
12
13
14
15
DIGITAL IN / OUT
DIN – 1
DIN – 2
DIN – 3
DIN – 4
DIN-GND
LOG-PWR
LED – 1 (green)
LED – 2 (yellow)
LED – 3 (redt)
DIN-GND
DOUT – 1
DOUT – 2
DOUT – 3
DOUT – 4
DOUT-COM
Logger_Manual_V03.51
3
CAN 4
CAN 8 (LIN 2)
CAN8 – L
(LIN2-VBAT)
CAN4 – L
CAN4/8 – GND
(LIN2-GND)
CAN8 – H
(LIN2 – H)
Option (VBATT-IN,
CAN8 WakeOnCAN
PWR-GND
CAN4 – H
Option (VBATT-IN,
CAN4 WakeOnCAN
UB-OUT+
DISPLAY
M-CAN
M-PWR+
M-PWR+
SYNC+
SYNC–
PIN
1
2
3
4
M-VIEW
GPS-PWR
Remote-2
PWR-GND
USB2-DATA– (HOST)
CAN-GND
PWR-GND
PWR-GND
CAN – H
CAN – L
–––
5
6
7
8
9
10
USB2-DATA+ (HOST)
USB3-DATA– (CLIENT)
USB3-DATA+ (CLIENT)
USB1-DET
USB-GND
USB2-PWR (5 V)
5
COM / MODEM / GPS
PIN
1
2
3
4
Serial
COM1 – DCD
COM1 – RXD
COM1 – TXD
COM1 – DTR
5
6
7
8
9
10
11
12
13
14
15
D-GND
COM1 – DSR
COM1 – DTS
COM1 – CTS
COM2 – RXD
COM2 – TXD
DGND
GPS-PWR
MODEM-PWR
PWR-GND
IPETRONIK GmbH & Co. KG
ipetronik.com
21/ 123
Data logger M-LOG, S-LOG, FLEETlog, IPElog
6
PWR / REMOTE
PIN
1
2
3
4
5
6
3.2.4
PWR-IN+
PWR-IN+
PWR-IN-GND
PWR-IN-GND
IGN. Line 15
REMOTE2
7
PIN
1
2
3
4
5
6
7
LAN
8
Ethernet
ETH-TX+
ETH-TX–
ETH-RX+
ETH-RX–
ETH-GND
PWR-GND
MODEM-PWR
PIN
1
2
3
4
5
AUDIO
Micro/Headphone
MICR-REF
MICR-SIG
HEADPHONE-GND
MICR-GND
HEADPHONE
Device panel for changing the internal memory card
S-LOG and M-LOG (M-LOG with Upgrade Kit 300) offer a screwed panel for exchanging the cF memory
card if required.
The FLEETlog is equipped with a cF card slot behind the folding front panel.
IPElog has a screwless fixed front panel with open/close contact for exchanging the SSD memory card.
Please note the advice to only change the memory card in exceptional cases because of a
possible intrusion of foreign material, dirt or water into the device and the logger could be
damaged at removing the cF card. The regular data transfer should be done with the USB stick
or the wireless connection (modem or WiFi option).
3.2.5
External fuse for logger protection (IPElog, M-/S-LOG, FLEETlog)
Depending on the number of inputs, capacitor charge, and connected devices (M or SIM
devices, Modem, GPS receiver), the total power consumption (especially at temperatures of –
40 °C / -40 °F) can reach up to approx. 150 Watt. To protect the total system, we recommend
an external overload protection with the following tasks:
Protection of the supply line in error case
Overload protection of the current source
Logger protection.
We recommend using a LittleFuse ATO Fuse Fast Acting Type with a nominal current of 10 A. At using
the maximum charge in ambient temperatures under –40 °C / -40 °F, it can be required to increase the
nominal current to 15 A.
The individual electric circuits (also see M-LOG Port replicators, S-LOG = PR05) are internally
protected. The internal resistance of multifuse types increases exponentially and limits the
current to a minimum. After clearing the cause of error, the resistance decreases to the normal
value (automatic resetting).
The motherboard fuse does not work reversibly and must be replaced in the case of a required
repair.
Logger_Manual_V03.51
IPETRONIK GmbH & Co. KG
ipetronik.com
22/ 123
Data logger M-LOG, S-LOG, FLEETlog, IPElog
3.2.6
Additional short-circuit protection for IPElog and FLEETlog
As the M-CAN connection is not fused by the logger, we recommend to use the cable M-CAN Cable
M-CAN/PWR-Fuse (No. 620-677.xxx) in order to prevent the logger from damage caused by a short circuit.
5 A regular ATO fuse
3.2.7
LED status display (flashing codes)
LED display
GREEN
YELLOW
RED
3.2.8
Mode
Meaning
Ready or
operating
Device is ready
(Operation: see yellow LED)
Warning I
Low voltage
The excitation is between 6 V and 9 V. MLOG shuts down after 2 minutes at
unchanged status.
Warning II
Low voltage
The excitation is under 6 V. M-LOG is
buffered by the internal supply and normally
shuts down.
Measurement
running
The logger writes the data to the internal
memory.
Data medium
access
(post processing)
Prepare file transfer (zip, split)
Data transfer
Transfer files via USB, modem, or WiFi
Error,
Emergency
operation
e.g. at invalid configuration, at less memory
capacity, at emergency shut-down due to
less excitation
A restart is required..
Power-down at excitation loss
M-LOG, S-LOG, FLEETlog and IPElog are equipped with high-powered capacitors, which guarantee a short
excitation in the case of an excitation loss for regularly shutting the system down without data loss. The
storage capacity of the capacitors depends on several points (e.g. ambient temperature, aging, charge
condition). A data loss can therefore not completely be excluded in the case of a total excitation loss.
M or SIM devices, which are supplied by M-/S-LOG, FLEETlog C2 or IPElog, are immediately switched-off at
excitation loss.
We recommend to revise the switching and the buffer capacitors every 2 years for guaranteeing
a clean functionality. The device calibration every 2 years includes this revision.
Logger_Manual_V03.51
IPETRONIK GmbH & Co. KG
ipetronik.com
23/ 123
Data logger M-LOG, S-LOG, FLEETlog, IPElog
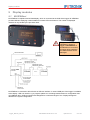
3.3
3.3.1
Initial start-up
Connecting the logger
Connect the red socket using the
Power/Remote cable (e.g. 620-574.xxx)
with an appropriate power supply
(9 VDC ... 36 VDC)
PWR+
= Voltage supply Plus
GND
= Voltage supply Minus
Shield
= Shield or voltage supply Minus
Connect the white socket using the
LAN cable (e.g. 620-591.xxx) with the
Ethernet interface of a PCs/Notebook,
resp. using the LAN cable
(e.g. 620-355.xx) for connection to
a network.
Switch on the logger
REM
= Ignition line 15 or power supply Plus via switch
→ green status LED lights continuously
Logger starts up and will enter the measurement mode after a short time.
→ yellow status LED lights continuously
Refer to the Flow chart of the measuring
process in the appendix for more details.
Useful notes
!
If the Ethernet connection to the logger will not work properly, at first transfer the correct IP settings to
the logger using an USB stick. Refer to Add logger system, creating test configuration (USB stick).
!
Using the cable 620-591.xxx LOG Cable ETHERNET (crosslink) is a point-to-point connection
between logger and PC. A fixed IP address is required for both. Refer to Static and dynamic IP
addresses.
!
When connecting the logger and the PC used for configuration and data acquisition to a network with
DHCP server, both have to be set to dynamic IP address, in order to receive the individual IP address by
the DHCP server automatically.
In this case use cable 620-355.xxx M-LOG PR05 ETH Cable RJ45.
Please consider the risk of IP conflicts (same IP address may exist twice), if you use static IP address
settings when connected to a network with DHCP support.
Logger_Manual_V03.51
IPETRONIK GmbH & Co. KG
ipetronik.com
24/ 123
Data logger M-LOG, S-LOG, FLEETlog, IPElog
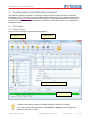
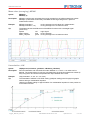
3.3.2
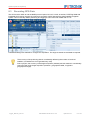
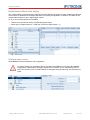
Detecting the logger, creating test configuration (Ethernet)
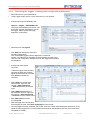
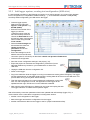
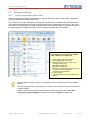
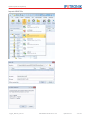
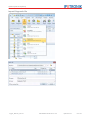
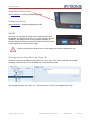
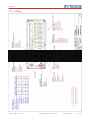
Start IPEmotion at your PC/Notebook.
!
Using Logger PlugIn version ≥ 3.50, IPEmotion ≥ 2.0 is required.
Activate the PlugIn IPETRONIK-LOG.
Options > PlugIns > IPETRONIK LOG
!
The PlugIn IPETRONIK-LOG version 3.50
and higher requires TESTdrive ≥ 3.50 on
the logger. Please update the logger
application if necessary!
Select the main tab Signals .
Click Detect to identify the connected
hardware components.
The / all available logger(s) will be displayed in a select list.
Confirm your selection by activating the corresponding checkbox and
click OK. The configuration settings stored on the logger will be readout
and displayed.
Activate the status signal
CPU load.
> Mark the logger at the left hand
structure top area and scroll the
signal list downwards to CPU load,
hook Active to enable the
checkbox.
Select ETH from the left hand
tree structure, right click and
choose > Add components
> XCP service from the context
menu
Select DAQ list slow from the
left hand tree structure, right click
and choose > Add components
> Channels from the context menu
Mark CPU load and confirm
by clicking OK.
Mark the logger from the left hand
tree structure top area. Click Start displaying from the tool bar.
Once the logger has been initialized, the current value of the CPU load is displayed continuously in the
signal list. Now logger's ETH communication test and online data streaming via XCP service has been
completed succesfully.
Logger_Manual_V03.51
IPETRONIK GmbH & Co. KG
ipetronik.com
25/ 123
Data logger M-LOG, S-LOG, FLEETlog, IPElog
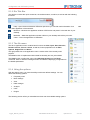
3.3.3
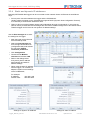
Add logger system, creating test configuration (USB stick)
In case the data acquisition or the Ethernet connection is not working properly (e.g. when using obsolete /
former configurations, incompatible IP address settings, ...), we recommend to transfer a valid (already
succefully tested configuration) per USB stick to the logger.
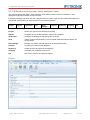
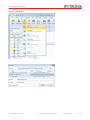
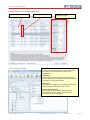
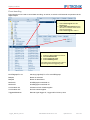
Create a logger system:
Select from the main tabs
Signals > Add system > e.g.
M-LOG (4CAN)
Enter the front number of the
logger you will use:
> Mark the logger at the left
hand structure top area and
choose the Extended tab to set
the last four digits of the logger's
serial number using the field
Front number.
Select the Data manager tab
and activate the check box
Update connection
parameters and click to
Configuration
Enter valid settings for the IP
address used for the Ethernet
connection (auto IP or fixed IP) as described at Static and dynamic IP addresses.
Create a test configuration.
Save the current configuration settings in the project (*.icf).
Export the project as measurement configuration (TSTdrive.mcf) to an
individual subdirectory located on your Notebook/PC or direct to an
USB stick.
Unplug the USB stick from the configuration PC.
Switch on the logger.
Plug in the USB stick while the logger is running in measurement mode (yellow LED lights). The logger
will stop measurement an start data postprocessing, existing data will be moved to the USB stick. This
process lasts as long as the yellow LED is flashing.
Then the logger will search for a new measurement configuration on the USB
stick. If a new configruation is found, the application on the logger will be
updated and the origin TSTdrive.mcf on the USB stick is deleted.
Wait until the yellow LED lights nor flashes not any longer and unplug the stick.
The logger will switch to measurement operation again.
After all necessary connection parameters have been updated with valid settings (logger, PC), a
communication via the LAN cable is supported, including these actions:
transfer a new configuration to the logger,
detect the logger and read the configuration from the logger,
transfer measurement data from the logger to the PC (import measurement files).
Logger_Manual_V03.51
IPETRONIK GmbH & Co. KG
ipetronik.com
26/ 123
Data logger M-LOG, S-LOG, FLEETlog, IPElog
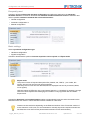
3.3.4
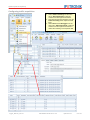
Static and dynamic IP addresses
Basically IPETRONIK data loggers can be connected to other network clients via Ethernet in two different
ways:
Point to point connection between the logger and the PC/Notebook.
Usually neither the logger nor the PC/Notebook supports DHCP (Dynamic Host Configuration Protocol),
it is necessary to set a fixed IP address for both.
Client to client connection between logger and PC/Notebook through a local network. In this case the
network server provides DHCP and manages the automatic IP address assignment to all network clients.
Therefore logger and PC have to use dynamic IP address settings.
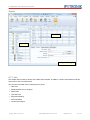
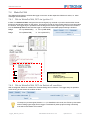
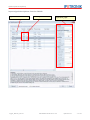
Use the Data manager tab to enter
the settings for the logger:
Mark the logger at the left hand
tree structure top area.
Select the Data manager tab
from the right hand down area
(configuration tabs).and activate
the check box Update
connection parameters.
Click Configuration.
Choose the tab Medium
selection and activate LAN.
Refer to the dialogs below
for dynamic (Get IP address
automatically) and static IP
address settings.
When using the static IP address
with the logger, it is necessary to
adapt the system control settings
of the PC/Notebook,
For example:
IP address:
Subnet mask:
192.168.0.100
255.255.255.0
Settings for dynamic IP adddress
Logger_Manual_V03.51
Settings for static IP address
IPETRONIK GmbH & Co. KG
ipetronik.com
27/ 123
Data logger M-LOG, S-LOG, FLEETlog, IPElog
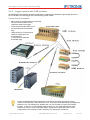
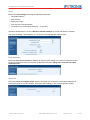
3.3.5
Logger system with CAN modules
All IPETRONIK CAN modules (M-Series, SIM-Series, CANpressure, MultiDAQ, High Voltage Iso DAQ ...)
are connected to the data logger with corresponding system cables.
Connecting the modules
Daisy-chain the modules among one another
and connect the system with its
respective cable to the logger.
The end of the module chain has to
be terminated with a termination
plug.
Using M-LOG or S-LOG the 2nd
CAN bus socket has to be
terminated also
> use M-CAN or SIM-CAN
termination plug.
Usually all IPETRONIK CAN modules are connected to the logger through the system
connectors M-CAN resp. SIM-CAN with S-LOG. Thus they can be detected and configured by
IPEmotion in a user-friendly way. Besides this, it is also possible to connect IPETRONK
modules, as well as, non-IPETRONIK CAN modules to a free CAN measurement input.
Please note, that you need a separate cable to supply the modules with power for this.
Configuration of the modules is done manually or by importing a CANdb file.
Logger_Manual_V03.51
IPETRONIK GmbH & Co. KG
ipetronik.com
28/ 123
Data logger M-LOG, S-LOG, FLEETlog, IPElog
Detecting modules, creating test configuration
1. Select the CAN input to which the devices are
connected to (CAN 01 is recommended because
it is connected with the M-CAN or SIM-CAN
socket at the logger).
2. Select Extras from the context menu (right
mouse button).
3. Select Detection to detect the connected
devices and to transfer the current settings to the
configuration.
MultiDAQ is detected as IPETRONIK CAN device
Execute Detection of connected modules as described.
Configure the modules and the logger (activate channels, set signal
scaling, select sample rates, create storage groups, ...)
Save the current project.
Initialize the Logger (working Ethernet connection required) or transfer
the configuration per USB stick to the logger.
To display measurement data acquired by the logger using the Ethernet connection, you have
to add an XCP service at first. Assign all signals to the DAQ lists of the XCP service which you
want to be displayed.
The Options setting Automatic service administration will automatically create an XCP
service and assign all active signals to the DAQ lists.
3.3.6
Access to data stored on the logger
The logger stores all data in a Zip archive on internal storage medium (cF card, resp. SD card with IPElog).
MEA_xxxx.zip
measurement data + header file + current configuration
LOG_xxxx.zip
logfile with status reports of the data acquisition
A measurement file (archiv file) is empty, if the sum of the file contents calculated from the files
listed below is 0. In this case, the respecitve zip archive will be deleted.
- all files containing storage groups except the DAT files
- all trace files (BD...)
- all statistic files except the DAT files
- Min/Max statistic file (STG)
- Audio/Video files except the DAT files (AVI,WAV,IMG)
- Traffic files (BIN, Quickstart)
- LOG file
- Measurement status file
- PPP debug file (PPP...)
Access (= data transfer to a PC or FTP server) to data stored on the logger is supported:
per USB stick
through an Ethernet cable connection
using COMgate or an internal/external WiFi client
using COMgate WAN or an internal/external modem
Logger_Manual_V03.51
IPETRONIK GmbH & Co. KG
ipetronik.com
29/ 123
Data logger M-LOG, S-LOG, FLEETlog, IPElog
Using a LAN cable connection
Import measurement files / log files
1. Select Signals navigation tab.
2. Select logger in the left Systems
overview.
3. Transfer the current data (internal
memory) in the Signals navigation tab to
PC with Import > Measurement files.
4. Transfer the current data (internal memory
+ pre-/post-trigger data)) in the Signals
navigation tab to PC with Import >
Measurement files (incl. ring buffer).
5. Transfer the current TESTdrive log files in
the Signals navigation tab to PC with
Import > Log files.
6. Select the target directory or crate a new
folder to save the respective data.
With USB stick
Plug in the USB stick to the running logger. The logger stops data acquisition, saves data, log files and the
related configuration to the stick. If the yellow LED is not permanently on, disconnect the USB stick. The
logger runs now in acquisition mode..
Please note that data can only be imported via USB if no LAN connection to the logger is
activated. Disconnect the logger with the logger context menu.
3.3.7
Synchronizing the logger time
Mark the logger at the left hand structure top area.
Right click to the logger entry and select
Extras > Synchronize logger time from the context menu.
Time data of time stamp and log messages have been normalized. Now time stamp output is
local time (former UTC). Time stamps reported in XML files always indicate the offset (time lag)
to UTC time, e.g. <startdate>2012-04-25T09:30:10+01:00</startdate>
In order to ensure a correct time interpretation of recorded data, the IPETRONIK data converter
IPEconverter V02.13 is required.
3.3.8
Updating the measurement application (TESTdrive)
Copy the file MLogger.rtb (standard) or Logger.prg (for M-VIEWgraph) to the subdirectory named with
the logger's serial number on the USB stick.
Power up the logger and wait for the yellow LED which indidcates data acqusition.
Plug in the USB stick to the logger, program update will start automatically.
Wait until the yellow LED lights no longer and unplug the USB.
The logger executes a reboot and starts measuring operation with the new application.
Logger_Manual_V03.51
IPETRONIK GmbH & Co. KG
ipetronik.com
30/ 123
External connection
4
4.1
External connection
Grounding
It is absolutely necessary to connect the grounding
of the M-LOG case bottom or S-LOG case rear
with a suitable ground pin within the overall system.
Without this grounding, EMV disturbances and
uncontrolled excitation interferences can restrict
the measuring process.
4.2
Remote connection
The logger has internal buffer capacitors to avoid a data loss due to sudden voltage losses. The
regular shut-down is executed via remote and not by switching-off the excitation!
The activating via a remote impulse (impulse length > 20 ms) is also supported. But the
continuous remote signal must be received within 60 s, otherwise the logger is shut down by
the watchdog.
Example:
Start of measuring system with opening the vehicle door. The continuous remote signal is
received at motor start and the system continues measuring. If the continuous signal is not
received (no motor start), the logger shuts down after 60 s.
Logger_Manual_V03.51
IPETRONIK GmbH & Co. KG
ipetronik.com
31/ 123
External connection
4.3
Digital input/output connection
LOG-PWR
4.3.1
switched logger excitation (not stabilized)
The excitation is supplied, as soon as, the logger is activated.
Connecting example digital input
potential free contact with
external excitation up to 42
V without any resistor or
voltage divider
Terminal 15 of the board
electrics (all vehicle power
supplies up to 42 V without
any resistor or voltage
divider)
Additional
bridge from
DIN-GND to
PWR-GND at
PR00 PR01!
The digital inputs are electrically isolated but the respective DIN-GNDs are all connected to one
PIN of the Sub D socket! This PIN has a direct connection to PWR-IN GND with the PR03,
PR04, PR05, PR06 port replicators!
The inputs are protected by an internal 5 mA current limitation.
Required minimum values at the input for a clean functionality:
Umin = 3 V bzw. Imin = 2 mA
4.3.2
Connecting example digital output
GND (ground) switched
Ri = 20 Ω
V+ (excitation) switched
Ri = 20 Ω
The digital outputs are electrically isolated and can operate bipolarly but the respective COM
ports are all connected to one PIN of the Sub D socket!
Logger_Manual_V03.51
IPETRONIK GmbH & Co. KG
ipetronik.com
32/ 123
External connection
4.3.3
4.4
Connecting example external status LED
Bus inputs
4.4.1
Connecting example CAN bus
4.4.2
Connecting example LIN bus
Due to the galvanic isolation, the transceiver of the LIN measurement input must be power supplied by an
external source. This can be:
1. Connection of the vehicle’s bus power supply (VBsupply)
or
2. Connection of the logger’s power supply (bridge from PIN 5 to PIN 1)
Variant 1: Connect VB of the external LIN bus
Variant 2:
Logger_Manual_V03.51
IPETRONIK GmbH & Co. KG
Supply via logger
(bridge from PIN 5 to PIN 1)
ipetronik.com
33/ 123
Configuration with IPEmotion (extract)
5
Configuration with IPEmotion (extract)
The IPEmotion software is required for configuring a logger measuring system and the corresponding
IPETRONIK devices. The software must be installed on the notebook/PC, which is used to configure. (See
the instructions in Commissioning). IPEmotion also supports the online data measurement with using the
XCP service. You can find a detailed description of IPEmotion in the manual, which can be opened in the
software as a PDF.
5.1 First steps
5.1.1 Main dialog
After the start of IPEmotion, the following screen appears.
Main Navigation Tabs
Quick Access Bar
Main window at selected tab “Signals”
Message window
IPEmotion automatically detects all available hardware connections at starting.
If you want to reduce the required time, select Options > PlugIns for deactivating those
interfaces, which are not used.
Logger_Manual_V03.51
IPETRONIK GmbH & Co. KG
ipetronik.com
34/ 123
Configuration with IPEmotion (extract)
5.1.2 Die Title Bar
The title bar contains the quick access bar, the software name, as well as, a tool bar with the following
functions:
Help – Open the documentation IPEmotion.pdf where you can find useful information for a
and clean application of the software.
safe
Minimize – Minimize the application window of IPEmotion and place it in the task bar of your
desktop.
Maximize – Make the application window visible on your desktop and refit the prior size.
Close – Close the application of IPEmotion.
5.1.3 The file menu
The file or application menu contains basic functions as: New, Open, Save, Save As,
Runtime version, Print and Close, as well as, further properties such as View,
Options, Support file and About.
The right partial view of the application menu contains a list of the recently used
projects.
The Print function is implemented with limited functionality and not yet localized.
The View function contains the menu points Message window and the Reset
command. Show or hide the message window and reset the displaying configuration to
the default parameters.
5.1.4 Using the options
With the Options entry, you have the ability to edit user defined settings. You can
define the following options:
►
Frequently used
►
Basic settings
►
View
►
Data manager
►
Analysis
►
Units
►
PlugIns
The following section offers you a detailed overview over the available setting options.
Logger_Manual_V03.51
IPETRONIK GmbH & Co. KG
ipetronik.com
35/ 123
Configuration with IPEmotion (extract)
Frequently used
Activate or deactivate Start with the latest configuration and define the settings for the automatic
hardware detection. Activate or deactivate the automatic hardware detection at start of IPEmotion and
select a possible standard command after successful detection:
Guided configuration
Automatic configuration or
Manual configuration
Basic settings
Select a preferred configuration type:
Hardware configuration
Signals configuration
Activate or deactivate the options: Accurate acquisition chain required and Expert mode.
Expert mode
The protocol nodes of imported description files (CANdb, A2L, FIBEX,...) are visible, this
means, the user has access to the signal properties.
With the protocols CCP and XCP the DAQ lists are displayed and can be processed (delete,
move signals).
With the release of IPEmotion V01.07.00 internal channels (-> Variables) for temporary storage
tasks have been implemented. Managing this variables is only supported with an enabled
Expert mode.
Activate the Automatic service administration option to automatically import the active channels into the
DAQ lists of the XCP service. These channels are then available in online view.
Please note the restrictions depending on the Ethernet interface of the PC and the number of
active channels. In this case, it is recommended to manually import the required channels into
the DAQ lists of the XCP service (deactivated Automatic service administration)
Logger_Manual_V03.51
IPETRONIK GmbH & Co. KG
ipetronik.com
36/ 123
Configuration with IPEmotion (extract)
View
Define your view settings according the following listed points:
Language selection
Skin selection
Displaying tooltips
Font size of the visual elements
Transparency of configuration dialogs (0 – 30 percent)
Activate or deactivate the use of the Windows standard dialogs for the file and directory selection.
The Open file dialog is skin-enabled, i.e. it is shown in the selected user interface type.
Data manager
Define the Time channel format as Relative or Absolute (This setting is currently not supported for the
export into external formats!) and activate or deactivate the option: Merge time channels with equal
acquisition rate.
Analysis
Select the points per diagram graph. Define if all signals are considered in the analysis diagrams at
drawing the graph or only the samples. Move the bar accordingly to the preferred speed or quality.
Logger_Manual_V03.51
IPETRONIK GmbH & Co. KG
ipetronik.com
37/ 123
Configuration with IPEmotion (extract)
Units
Get an overview according the common physical values and their respective unit and edit them.
Activate this PlugIn for all logger
applications.
PlugIns
Activate or deactivate the hardware systems to be used.
The corresponding TESTdrive
version must be available at the
logger!
With the Settings button, you have the ability to define the components (module type and priority, e.g. for
the type selection of the Dry configuration) of the respective hardware system and to edit additional options
settings.
The selection of the hardware components for the configuration by using a signal library is based on the
Priority. This preselection with a priority assignation of the system components facilitates the device
selection and improves the system speed.
The High priority defines a preferred use of the corresponding hardware component at configuring with a
signal library. The hardware components, which are defined with the Not used priority, cannot be selected
for an acquisition.
Logger_Manual_V03.51
IPETRONIK GmbH & Co. KG
ipetronik.com
38/ 123
Configuration with IPEmotion (extract)
5.1.5
Creating a support file
With the Support file entry of the application menu, you
have the ability to create a support file and add and/or edit
own comments and error descriptions.
Enter in the appearing Create support file screen an error
description. Accept the default location for the file. To
select another location click on the
symbol.
After you have specified the location and a user defined
file name, click Save to return to the Create support file
screen.
After clicking on OK a zip file is generated that contains the error description, as well as, the following
information:
System information (Windows version, computer name, free memory on the local drives, …)
Current configurations (acquisition, online view, script configurations)
Trace files (.NET, C++)
If you have any problems while working with IPEmotion, send us this support file at
[email protected].
Logger_Manual_V03.51
IPETRONIK GmbH & Co. KG
ipetronik.com
39/ 123
Configuration with IPEmotion (extract)
5.1.6 IPEmotion working areas (main navigation tabs)
The main navigation tabs allow a quick activation of the different main functions of IPEmotion. A tab
displayed in light blue indicates an active function.
IPEmotion is designed to follow the main navigation tabs from left to right. Use this reasonable order like a
read thread, which guides you step-by-step to a successful acquisition.
Project
Signals
Acquisition
View
Data
manger
Analysis
Reporting
Scripting
Info
Project
Define your general user defined project data.
Signals
Configure the connected acquisition systems and modules.
Acquisition
Configure the desired storage groups and channels.
View
Take a measurement defined by the connected hardware modules and the set
configurations.
Data manager
Manage your stored acquired data in all the supported formats.
Analysis
Visualize your channels with diagrams.
Reporting
Create reports and project documentations.
Scripting
Automate your acquisition sequences.
Info
Get a basic overview and general support.
Project
Logger_Manual_V03.51
IPETRONIK GmbH & Co. KG
ipetronik.com
40/ 123
Configuration with IPEmotion (extract)
Signals
Channels
Systems
Configuration dialogs
5.1.7 Info
The chapter offers a basic overview of the IPEmotion software. In addition, it shows useful advices and tips
and tricks on how to use IPEmotion.
The view Info is divided into the following menu points:
Welcome
Release Notes (only in English)
Red thread
Tips and tricks
Keyboard handling
Documentations
Contact and support
Logger_Manual_V03.51
IPETRONIK GmbH & Co. KG
ipetronik.com
41/ 123
Basic functions
6
6.1
Basic functions
Switching-on / switching-off
Description of the supported switching-on / switchting-off modes
Logger_Manual_V03.51
IPETRONIK GmbH & Co. KG
ipetronik.com
42/ 123
Basic functions
Logger_Manual_V03.51
IPETRONIK GmbH & Co. KG
ipetronik.com
43/ 123
Basic functions
6.2
Triggering
The logger acquisition program offers 4 trigger conditions for every storage group to control the data
acquisition. The trigger conditions can be deduced from acquired signals, as well as, from calculated
channels. All data is written into the memory (RAM). If a storage condition is met, the data is asynchronously
written from the cache into the open measuring file on the flash card.
6.2.1
Start-trigger
Start of data storage if trigger condition (impulse) is met. Stop of storage with (correct) logger shut-down
(Power down). A defined follow-up time extends the data acquisition for x seconds.
6.2.2
Stop-trigger
Begin of data storage with logger switch-on (Power up). Stop of data storage if trigger condition (impulse) is
met. A defined follow-up time extends the data acquisition for x seconds. If no trigger event is set, data is
recorded until “Remote OFF” or end of the follow-up time.
We recommend to use the function VALID(x ; y) in order to avoid irregular NoValues which
may influence a correct triggering.
Example:
Start-trigger: VALID(„Channel01“ > 15; 0)
Storage as soon as Channel01 > 15
Stop-trigger: VALID(„Channel01“ > 15, 1)
Storage as long as Channel01 > 15
Logger_Manual_V03.51
IPETRONIK GmbH & Co. KG
ipetronik.com
44/ 123
Basic functions
6.2.3
Start- and Stop-trigger
Begin of data storage if start-trigger condition (impulse) is met. Stop of data storage if stop-trigger condition
(impulse) is met.
A defined follow-up time extends the data acquisition for x seconds. If no stop-trigger event is set, data is
recorded until “Remote OFF” or end of the follow-up time.
6.2.4
Stop is inverted start
Data storage for the time of meeting trigger condition (status).
A defined follow-up time extends the data acquisition for x seconds. If trigger status does not change after
successful trigger condition, data is recorded until “Remote OFF” or end of the follow-up time.
The Follow-up time may not be mistaken for the Post-processing time. Both settings must be
coordinated. The maximum post-processing time is set with Logger > Settings > Data transfer
timeout. This setting limites the switch-on duration after successful “Remote OFF” signal. The
logger is regularly shut down after this time even if the data post-processing (zipping, splitting,
sending) is not yet completed. The post-processing value must be at least 5 min greater than
the currently set follow-up time!
Logger_Manual_V03.51
IPETRONIK GmbH & Co. KG
ipetronik.com
45/ 123
Basic functions
6.2.5
Save trigger channel
If Save trigger channel is activated, trigger status and some additional information are stored in an implicit
channel (Word data format) in every storage group.
Bit coded information in trigger status channel
Bit No. Description
Pre-Trigger
0
Between start and stop
1
2
3
Post-trigger
Trigger Event
4
5
6
7
8
9
10
11
12
13
14
15
Maneuver
Res
Res
Res
Res
Res
Res
Res
WakeOnCAN
Power Bad
Power Good
KL. 15
6.3
Description (if bit value = 1)
Pre-trigger time running
Trigger signal status
This bit is set during the whole acquisition in Continuous
acquisition mode.
Post-trigger time running
This bit is set for the time of one signal at every Low > High of the
trigger signal. It is set once at acquisition start in Continuous
acquisition mode.
Maneuver recording running (No NoValues available anymore)
Currently not used!!
Currently not used!
Currently not used!
Currently not used!
Currently not used!
Currently not used!
Currently not used!
WakeOnCAN ist active
The logger is disconnected from the power supply.
Buffer capacitors loaded
Debounced remote signall (terminal 15)
Storage groups
TESTdrive supports various storage groups to merge signals (direct signals, as well as, calculated channels)
in so-called storage groups. Every storage group can has an own storage rate – independent from the signal
rate. This storage rate is valid for all signals in the group, i.e. the signal is detected with the set sampling rate
and recorded with the storage rate.
The maximum storage rate of a group is defined by the signal with the highest sampling rate.
The frequency for online calculations corresponds to the highest sampling rate in the calculation.
Every storage group can has own trigger conditions (see Triggering). Selected signals can be detected with
a high storage rate if required, e.g. in case of a specific event.
Logger_Manual_V03.51
IPETRONIK GmbH & Co. KG
ipetronik.com
46/ 123
Basic functions
6.3.1
Storage group
1.
2.
3.
4.
5.
6.
7.
8.
Storage group
Select Signals navigation tab.
Select Storage groups.
Select Add component > Storage
group from the tab menu or the context
menu (right mouse button).
Enter a name and a description in the
General tab.
Activate the storage group
Select Add component > Channels
from the tab menu or the context menu
(right mouse button).
Select the signals and confirm with OK.
Define additional parameters with
Settings und Triggering.
Ring buffer group
Storage rate
Selection of a fixed storage rate or a channel related storage rate (From channel).
Using the setting From channel means, .the channel with the highest sample rate
within the storage group will determine the storage rate.
Time stamp channel
The measuring data contain the absolute time channel (logger time).
Logger_Manual_V03.51
IPETRONIK GmbH & Co. KG
ipetronik.com
47/ 123
Basic functions
NoValue
The NoValue between the trigger events, which is defined in the respective channel, is added with Format.
Save trigger channel The trigger status channel is added to the storage group and recorded. This
channel contains additional information, which is saved with the single bits in the
data set.
Ring buffer size
Defines the size of the ring buffer for measuring. If the max ring buffer size is
reached, the memory is overwritten beginning with the oldest data.
Use the ring buffer group to record data, which is only required in case of a specific event, e.g.
error case. Define how many data is recorded before and after the event with the pre-trigger
and post-trigger. Please note that relevant data can also be overwritten depending on data rate
and storage duration!
6.3.2
Trigger settings
Mode
Select the trigger mode from Continuous acquisition (no trigger), Start-trigger,
Stop-trigger, Start- and Stop-trigger, Stop as inverted start (see Triggering)
Pre-trigger duration
Data recorded before the trigger event
Post-trigger duration Data recorded after the trigger event
Start-trigger
Value, which starts the data storage of the respective group.
Stop-trigger
Value, which stops the data storage of the respective group.
Scaling
Triggering the physical value or the raw value of the numerical value calculated
with the formula.
Define the triggering conditions as formula from the system signals and calculated signals. You
can optimize your data recording with a clever configuration of storage groups and triggering
conditions to record signals at a high storage rate only if required. This method reduces the
data volume, saves memory, and facilitates the final analysis!
Logger_Manual_V03.51
IPETRONIK GmbH & Co. KG
ipetronik.com
48/ 123
Standard functions
7
Standard functions
7.1
Calculations
TESTdrive supports the online calculation of the signals acquired in the system. The desired calculation is
defined with the corresponding software dialog – manually or with the formula editor.
IPEmotion Version 1.03 and PlugIn IPETRONIK-LOG ≥ V03.20 offer a shared formula editor, i.e. the
following calculation functions are available in IPEmotion, as well as, in TESTdrive.
Calculations, which are based on each other, must be run in the same cycle rate to get a
correct result! If, e.g., the result of a calculation with low cycle rate is used in a calculation with
higher cycle rate, a time offset results, which can influence the result according to a signal
change (amplitude). In that case, the signal sampling rate of the first calculation must be raised.
The formula editor requires the use of the semicolon “;” instead of the comma “,” as variable
separator.
If a value within a calculation is “NoValue“, the calculation result is “Novalue“, too.
7.1.1
1
Mathematic functions and operations
Basic operation
Operator
+
–
*
/
MOD
ABS( )
SIGN( )
NEG( )
(
)
2
Name
Addition
Subtraction
Multiplication
Division
Modulo, Division rest
Absolute value of a number
Sign of a number
Syntax
“Temp01“ + “Temp02“
“Temp01“ - “Temp02“
“Temp01“ * “Temp02“
“Temp01“ / “Temp02“
“Temp01“ MOD “Temp02“
ABS(“Temp01“)
SIGN(“Temp01“)
Negation of a number
NEG(“Temp01“)
Begin bracket term
End bracket term
(“Temp01“ + “Temp02“) * 2
(“Temp01“ - “Temp02“) * 2
Example
15 + 10
15 - 10
15 * 10
15 / 10
15 MOD 10
ABS(-15)
SIGN(15)
SIGN(0)
SIGN(-15)
NEG(15)
NEG(-15)
(15 + 10) * 2
(15 - 10) * 2
Result
25
5
150
1.5
5
15
1
0
-1
-15
15
50
10
Example
15 ^ 2
SQRT(25)
EXP(5)
LOG(5)
LN(5)
Result
225
5
148.41
0,4771
1.0986
Power, Square root, Exponential and Logarithm functions
Function
^
SQRT( )
EXP( )
LOG( )
LN( )
Name
Power
Square root
Exponential function of basis e
Logarithm of basis 10
Logarithm of basis e
Logger_Manual_V03.51
Syntax
“Temp01“ ^ 2
SQRT(“Temp01“)
EXP(“Temp01“)
LOG(“Temp01“)
LN(“Temp01“)
IPETRONIK GmbH & Co. KG
ipetronik.com
49/ 123
Standard functions
3
Trigonometric functions, Hyperbola functions
Function
SIN( )
COS( )
TAN( )
ASIN( )
ACOS( )
ATAN( )
SINH( )
COSH( )
TANH( )
4
Name
Sine
Cosine
Tangent
Arc sine
Arc cosine
Arc tangent
Sine Hyperbolicus
Cosine Hyperbolicus
Tangent Hyperbolicus
Range of values in radiant
+/-3.99 rad
+/-3.99 rad
+/-3.99 rad
+/-1.0 rad
+/-1.0 rad
+/-1.0 rad
+/-1.99 rad
+/-1.99 rad
+/-1.99 rad
Comparative operations (comparison of variable values)
Function Name
Equal
=
Syntax
“Temp01“ = “Temp02“
<>
Unequal
“Temp01“ <> “Temp02“
<
Less than
“Temp01“ < “Temp02“
>
Greater than
“Temp01“ > “Temp02“
<=
Less than or
equal
“Temp01“ <= “Temp02“
>=
Greater than or
equal
“Temp01“ >= “Temp02“
If function
IF(“Temp01“ >= “Temp02“; x; y)
IF( ; ; )
Query to a specific status.
If Occurrence > action 1, otherwise action 2
Example: IF(“Thermo_channel3“ > 30; 1; 0)
If Temperature > 30, Result: 1 otherwise 0
Action 1 and 2 can also be calculations.
5
Example
15 = 10
15 = 15
15 <> 10
15 <> 15
10 < 15
15 < 15
15 > 10
15 > 16
10 <= 15
15 <= 15
20 <= 15
15 >= 10
15 >= 15
15 >= 20
x = 1; y = 0
“Temp01“ = 15
“Temp02“ = 10
“Temp01“ = 10
“Temp02“ = 15
Result
Example
15 > 5
15 > 10
10 > 5
15 > 5
10 > 5
10 > 10
15 > 5
10 > 5
15 > 15
10 > 10
15 > 5
15 > 15
5 > 15
Result
0
1
1
0
1
0
1
0
1
1
0
1
1
0
1
0
Logic operations (comparison of signal states)
Function Name
And
AND
OR
XOR
NOT( )
Syntax
“Temp01“ > “Temp02“ AND “Temp01“ > 10
Or
“Temp01“ > “Temp02“ OR “Temp01“ > 10
Exclusiv or
“Temp01“ > “Temp02“ XOR “Temp01“ > 10
Not
NOT(“Temp01“ > “Temp02“)
(inverse state)
Logger_Manual_V03.51
IPETRONIK GmbH & Co. KG
ipetronik.com
1
1
0
1
1
0
0
1
1
0
0
1
1
50/ 123
Standard functions
6
Boolean operations (bitwise comparison of signal states)
Function Name
And bitwise
ANDB
Or bitwise
ORB
7
XORB
Exclusive or
bitwise
NOTB
Not bitwise
Description
Bits which are set in operand1 and in
operand2 will be set in the result
(bit = 1), all others will be not set (bit = 0)
Bits which are set in operand1 or in
operand2 will be set in the result
(bit = 1), all others will be not set (bit = 0)
Example
27 ANB 12
11011 ANDB 01100
Result
8
01000
26 ORB 8
11010 ORB 01000
27 ORB 13
11011 ORB 01101
Bits which are set only in operand1 or only 26 XORB 8
in operand2 will be set in the result
11010 XORB 01000
(bit = 1), all others will be not set (bit = 0)
27 XORB 13
11011 XORB 01101
Bits which are set in operand1 will be not
NOTB 27
set in the result (bit = 0), all others will be
NOTB 11011
set (bit = 1)
26
11010
31
11111
18
10010
22
10110
4
00100
Statistic functions
Function
MIN( )
MAX( )
MEAN( )
Name
Minimum
Maximum
Average
Average from
n values
MINOR( ; ) Less value
MAJOR( ; ) Greater value
FLOOR( ) Round integer
off
Round integer
CEIL( )
up
ROUND( ) Round integer
MEAN( ; )
LIN( ; ; ; )
8
Linearization
Syntax , Description
MIN(“Temp01“)
MAX(“Temp01“)
Average from all valid values
Example
4 | 12 | 3 | 25 | 17
4 | 12 | 3 | 25 | 17
Result
3
25
Average from n valid values
MINOR(“Temp01“; “Temp02)
MAJOR(“Temp01“; “Temp02)
FLOOR(“Temp01“)
4 | 12
4 | 12
13,72
4
12
13
CEIL(“Temp01“)
13,41
14
ROUND(“Temp01“)
13,41
13,72
13
14
LIN(“Temp01“;
x node-1;y node-1;
x node-n; y node-n)
Runs a linearization with the defined
nodes. Between n = 2 and n = 16
nodes can be defined.
Other functions
Function
EDGE_POS( )
EDGE_NEG( )
Logger_Manual_V03.51
Description
Detect positive edge
1 if current value is > 0 and the previous one <= 0
Detect negative edge
1 if current value is <= 0 and the previous one > 0
IPETRONIK GmbH & Co. KG
ipetronik.com
51/ 123
Standard functions
Function
DIFF( )
INT( )
INT_UP( )
PREV( )
Description
Runs a differentiation of an operand acc.to:
(Opr1(t) – Op1(t-1)) * DeltaT
Calculates the integral of an operand acc. to:
"((Op1(t) + Op1(t-1))/2) * DeltaT"
Calculates the upper integral of an operand acc.
to: "Op1(t) * DeltaT"
Outputs the previous value.
Floating average from the current value and both
(„Temp1“ +
(PREV („Temp1“)) previous values
+ (PREV
(PREV(„Temp1“)))
)/3
Shift value bitwise to the left.
SHL( ; )
SHR( ; )
TESTBIT( ; )
TESTMASKS( ; )
TIME( )
TIMER( ; )
VALID( )
VALID(x; y)
Shift value bitwise to the right.
Example
Result
PREV(“Temp01“) 4 |
12 | 3 | 25 |
1 SHL 2
001 SHL 2
12 SHR 1
1100 SHR 2
TESTBIT(1101; 3)
TESTBIT(1101; 1)
Checks the value (0, 1) of the defined bit. If the
bit described by operand 2 is set, result = 1,
otherwise result = 0
(Counting order starting left hand with 0)
Makes a comparison with a user definable
TESTMASKS(27, 6)
bitmask. If at least one bit is set in operand 1 and TESTMASKS(27, 4)
also in operand 2, result = 1, otherwise result = 0
TIME(“Temp01“)
A counter that adds the time intervalls of the
corresponding sample rate continuously and
outputs the sum as long as the operator's value
is >= 0.5
In case the operator's value is < 0.5, the counter
is reseted and 0 is output.
If no new value is received from the channel
defined as Parameter1 within the timeout
(Parameter2 in seconds), the output value is '1'.
Check for validity
1 if value is unequal to NoValue, 0 if value is NoValue
Avoid Novalues
x if value is unequal to NoValue, y if value is NoValue
Logger_Manual_V03.51
IPETRONIK GmbH & Co. KG
ipetronik.com
NV | 12 | 3
4
100
6
0110
1
0
1
0
52/ 123
Standard functions
7.1.2
9
Constants
Constants
Constant
PI
SYSTEMRATE
SYSTEMTIME
SAMPLERATE
SAMPLETIME
7.1.3
Description
Pi > π = 3.141592654 ...
TESTdrive internally works with a fix system rate. This rate depends on
the configuration (Channel with highest sampling rate) and can be used
for calculations. The system rate can be compared with the timer ticks of
a PC clock and is set in Hz.
The system rate relates to the working frequency of the PC/Notebook (=
Frequency of the High-Performance-Counter).
Reciprocal value of the system rate (=1/SYSTEMRATE) and is set in
seconds.
Please note at using a system rate in the MHz range that the system time
can only be correctly displayed if sufficient decimals have been defined
and Automatic has been selected in Display > Formatting.
Channel sample rate in Hz
Channel acquisition intervall in 1/s
NoValue control
A NoValue alarm can be activated for every signal
within the Format tab.
Example:
Signal scaling 8 Bit integer signed
Range -128 ... 0 ... 127
NoValue setting = -FullScale
With a signal value of -128 the expression
NoValue will be written to the data record.
With an activated check box, the
expression -FullScale will be written to the
data record
The timeout setting is defined at:
IPEmotion Options > Basic settings > Expert mode >
Expert settings
If the timeout expires without any signal value, the entry
NoValue resp. the selected standard value ist output for
display and data record. A status message is written to
the log file.
If a M-VIEWvga is used, this message must be confirmed.
Logger_Manual_V03.51
IPETRONIK GmbH & Co. KG
ipetronik.com
53/ 123
Standard functions
7.1.4
Calculation examples
Greater comparison „>“
Syntax
>
Description
Compares the current value (of a channel or a calculation) with a user defined constant or
variable. The result is 1, as long as the comparison is true, otherwise the result is 0 (for a
false comparison).
Example
„Channel01“ > 2
Comparison with a constant
„Channel01“ > „Channel02“
Comparison with a variable
Constant
Signal
Results
Time
Variable
Signal
Result
Time
Less comparison „<“
Syntax
<
Description
Compares the current value (of a channel or a calculation) with a user defined constant or
variable. The result is 1, as long as the comparison is true, otherwise the result is 0 (for a
false comparison).
Example
„Channel01“ < 2
Comparison with a constant
„Channel01“ < „Channel02“
Comparison with a variable
Constant
Signal
Result
Time
Variable
Signal
Result
Time
Logger_Manual_V03.51
IPETRONIK GmbH & Co. KG
ipetronik.com
54/ 123
Standard functions
Counter (without reset)
Syntax
„Counter01“ + x
VALID(“Counter01”; 0) + x
Description
Counts continuously with the current sample rate, i.e. the counter value is increased by x
with each sample. The rise of the counter slope depends on the currently configured
sampling rate and the counter step. A measurement stop resets the counter to 0.
Example
„Counter01“ = „Counter01“ + 1
„Counter01“ = „Counter01“ + 10
Tip
Used with TESTdrive (logger application) this recursive formula will result in valid values as
the initial value for variables is set automatically. Used with IPEmotion (Acquisition >
Calculations > Formulas) the respective formula has to be completed with the Valid function:
„Counter01“ = VALID(„Counter01“; 0) + 1
The Valid function sets the initial counter value to a defined value (here 0) in case the current
value is invalid.
Accumulates 1 with each sample
Accumulates 10 with each sample
Counter with counting condition
Syntax
IF(“Channel01” > x; „Counter01“ + y; „Counter01“)
IF(“Channel01” > x; VALID(“Counter01”; 0) + y; VALID(“Counter01”; 0))
Description
Counts continuously with the current sample rate, as long as, the current value of
"Channel01" is greater than x. The counter value is increased by y with each sample, as long
as "Channel01" fulfills the condition. Otherwise the counter remains unchanged. As son as
the condition is fulfilled again, the counter continues with the previous value. The rise of the
counter slope depends on the currently configured sampling rate and the counter step.
A measurement stop resets the counter to 0.
Beispiel
„Counter01“ = IF(“Channel01” > 5; "Counter01“ + 1; „Counter01“)
Accumulates 1 with each sample as long as "Channel01“ is greater than 5.
Stop counting and holding the latest value, as soon as „Channel01“ is less than 5.
Tip
Used with TESTdrive (logger application) this recursive formula will result in valid values as
the initial value for variables is set automatically. Used with IPEmotion (Acquisition >
Calculations > Formulas) the respective formula has to be completed with the Valid function.
36
17
Counter
17
0
Constant
Signal
Trigger
10
Logger_Manual_V03.51
20
30
40
IPETRONIK GmbH & Co. KG
50
60
ipetronik.com
Sampling time
55/ 123
Standard functions
Counter with counting condition and reset
Syntax
IF(“Channel01” > x; „Counter01“ + y; 0)
IF(“Channel01” > x; VALID(“Counter01”; 0) + y; 0)
Description
Counts continuously with the current sample rate, as long as, the current value of
"Channel01" is greater than x. The counter value is increased by y with each sample, as long
as "Channel01" fulfills the condition. Otherwise the counter will be reset to 0. As son as the
condition is fulfilled again, the counter restarts with 0. The rise of the counter slope depends
on the currently configured sampling rate and the counter step.
A measurement stop resets the counter to 0.
Beispiel
„Counter01“ = IF(“Channel01” > 5; „Counter01“ + 1; 0)
Accumulates 1 with each sample as long as "Channel01“ is greater than 5.
Stop counting and reset to 0, as soon as „Channel01“ is less than 5.
Tip
Used with TESTdrive (logger application) this recursive formula will result in valid values as
the initial value for variables is set automatically. Used with IPEmotion (Acquisition >
Calculations > Formulas) the respective formula has to be completed with the Valid function.
19
17
Counter
0
0
Constant
Signal
Trigger
10
20
30
40
50
60
Sampling time
Validation check „VALID“
Syntax
VALID(x)
VALID(x;y)
Description
VALID checks the current value (of a channel or a calculation) for validity, i.e. if the variable's
status is „invalid“ (NoValue).
With the VALID(x) function the result is1, as long as x is valid and changes to 0, as soon as
the x has the status NoValue.
With the VALID(x;y) function the result is x as long as x is a valid value. As soon as x will be
an invalid value (NoValue) the result changes to y. In case y is a variable (instead of a
constant) the result of VALID(x,y) will be NoValue, as soon as x, as well as, y are an invalid
value.
Example
VALID(„Channel01“)
1 if „Channel01“ ╪ NoValue, 0 if „Channel01“ = NoValue
VALID(„Channel01“;4) „Channel01“ if „Channel01“ ╪ NoValue, 4 if „Channel01“ = NoValue
Tip
When using a measurement value within a recursive formula (x = x + y) we recommend to
use the VALID(x; y) function in order to avoid invalid values (NoValue). Even if the
measurement signal becomes valid values, the recursive formula will not be calculated
correctly, once a NoValue occurred.
We recommend to use the VALID(x; y) function for any signal which serves as a trigger for a
storage group. An invalid trigger signal could prevent the start of the data storage even if the
trigger signal will become temporarily valid.
Logger_Manual_V03.51
IPETRONIK GmbH & Co. KG
ipetronik.com
56/ 123
Standard functions
Mean value (averaging) „MEAN“
Syntax
MEAN(x)
MEAN(x; n)
Description
MEAN(x) continuously calculates the moving average from all valid measurement values.
MEAN(x; n) berechnet continuously calculates the moving average from n previous
measurement values.
Example
MEAN(„Channel01“)
MEAN(„Channel01“; 10)
Tip
The diagram shows the differences of the MEAN functions with a rectangle signal
(clock 5 Hz)
Square
red
origin signal
Mean Square
blue
moving average
Mean_5 Square
green moving average from 10 values at a time
moving average from all values of a measurement
moving average from 10 values at a time
Linearization „LIN“
Syntax
LIN(Operand; x-Node01; y-Node01; x-Node02; y-Node02)
Description
Runs a linearization with user defined nodes. Between n = 2 and n = 16 nodes can be
defined. The scaled values (Y-axis) are calculated from the original measurement values (Xaxis) using factor and offset of the partial linear slope between two nodes.
Example
LIN(„Channel01“; 0;-0,5; 2;1; 4;2; 8;2,5)
Tip
The linearization enables a non-linear scaling (multipart scaling) used for physical graphs
without having a mathematical equation.
Using this multipart scaling an approximation of a mathematical equation is more precise as
more nodes are used.
Logger_Manual_V03.51
IPETRONIK GmbH & Co. KG
ipetronik.com
57/ 123
Standard functions
7.1.5
Local calculation
1. Select Signals navigation tab.
2. Select Local calculations.
3. Select Add component >
Calculation from the tab menu or the
context menu (right mouse button).
4. Activate the calculation.
5. Enter a name and a description in the
General tab.
6. Enter the calculation in the Formula
tab.
7. Enter the calculation formula
manually or use the Formula editor
f(x).
8. Move signals and operators in the
entry field by using Drag&Drop.
9. Confirm with OK.
10. Enter the value range and the
decimals in the Display tab.
11. Define additional limit values and/or a
NoValue.
Logger_Manual_V03.51
IPETRONIK GmbH & Co. KG
ipetronik.com
58/ 123
Standard functions
7.2
7.2.1
Digital inputs and outputs
Digital inputs
1.
2.
3.
4.
5.
6.
7.
8.
7.2.2
Digital outputs
1.
2.
3.
4.
5.
6.
7.
8.
9.
Logger_Manual_V03.51
Activate the Signals tab.
Select DIN in the system overview.
Activate the desired digital inputs.
Enter a name and a description in the
General tab.
Enter the value to be interpreted as NoValue
in the Format tab. (Value out of the valid
range)
Enter the value range and the decimals in
the Display tab.
Define the lower and upper limit value with
Limit value.
Enter the output/display of invalid value with
NoValue.
Activate the Signals tab.
Select DOUT in the system overview.
Activate the desired digital outputs.
Enter a name and a description in the
General tab.
Enter the value to be interpreted as NoValue
in the Format tab. (Value out of the valid
range)
Enter the upper and lower acquisition range
with Scaling.
Enter the value range and the decimals in
the Display tab.
Define a formula to control the output with
Calculation.
Define the lower and upper limit value with
Limit value.
IPETRONIK GmbH & Co. KG
ipetronik.com
59/ 123
Standard functions
Sampling rate DOUT
The logger's digital outputs (DOUT) support
a definable sampling rate (cycle rate) of up
to 100 Hz.
Frequency output DOUT
If the frequency output is activated, a square
wave voltage is sent. The signal frequency
can be configured.
7.3
OBD-2 measurement
With releases of the PlugIn IPETRONIK-LOG / TESTdrive ≥ V03.22 data acquisition using the OBD2
standard (CAN bus) supported.
The OBD-II international standard details a list of 96 predefined signals and measurement parameters which
makes it easy to acquire provided operating data by a data acquisition system. This standard is mandatory
for petrol engine cars since 2001 respective diesel engine cars since 2003 and trucks since 2005.
Logger_Manual_V03.51
IPETRONIK GmbH & Co. KG
ipetronik.com
60/ 123
Standard functions
7.4
WakeOnCAN
The WakeOnCAN function switches the logger on as soon as the respective CAN bus is active, i.e. when
messages are transferred.
7.4.1
ON via WakeOnCAN, OFF via Ignition 15
If there is no Switch-off time configured, the remote signal (e.g. terminal 15) must be active within the set
timeout to permanently switch-on the logger. The logger is turned off if the remote signal is not received after
the timeout. The logger stays in operation mode as long as the remote signal is high. As soon as remote is
low, the Follow-up time will start and the logger is switched-off when datat postprocessing is finished.
Bridge
Pin 3 (CAN2/6-GND)
Pin 6 (PWR-GND)
Bridge
Pin 8 (WaOnCAN)
Pin 9 (UB-OUT+)
Depending on the CAN card/Port replicator, the
WakeOnCAN function supports
only at CAN 2,
at CAN 2 and CAN 3
at all CAN inputs (special version)!
7.4.2
ON via WakeOnCAN, OFF via Switch-off condition
With a configured Switch-off condition the Timeout setting has no influence. The logger stays in operation
mode as long as the Switch-off condition is false.
If a temporary remote signal (duration > 1 s) is identified in this mode, the Follow-up time starts
with the falling signal edge and the logger is switched off (when postprocessing is finished),
even with a false Switch-off condition.
Logger_Manual_V03.51
IPETRONIK GmbH & Co. KG
ipetronik.com
61/ 123
Standard functions
7.5
Output signals via CAN
Status signals
Status signals can be used in one configuration in the same way
as measuring channels. Status signals can be added, e.g., into
calculations, triggers or storage groups.
Requirement: CAN board with FPGA version > 1.04.00
CAN Send
A CAN input in a logger configuration can be used to send CAN
data.
Any data can be sent (also values from calculations or status
signals). The information about the signals to be sent can be
exported with CANdb.
At least one CAN participant must be connected to the CAN
interface to transfer data to the CAN. If this is not the case,
TESTdrive sends the following error:
E Error sending CAN message in CANSendWorkStation. Counter = 1
Options
Start CAN ID:
Enter a start ID. The first signal uses this CAN ID, any further signal gets an ID raised by one. If the sending
counter is activated, it is ouput at the start ID.
TESTdrive 3.11 supports maximum one channel (=signal) per ID.
With TESTdrive 3.13 several channels can be assigned to one ID.
It won’t be possible to define one ID for a specific channel.
It is possible to use Extended ID.
Send rate:
It is possible to define the send rate.
The following settings are permitted: 0.5/ 1/ 2/ 5/ 10/ 20/ 50/ 100 Hz
If the send rate is greater than or equal to the source channel rate, the following message is written into the
TESTdrive3 log file:
D ERROR in CCANSendWorkStation::Put() Fifo full!
Send counter:
If the send counter is activated, a 32 bit value beginning from 0 is incremented for every send cycle and
output at the start ID. All channels are moved for one ID.
Example:
Start ID = 256
Name
-- ID --
Value
1 cycle:
Send counter
Channel_1
Channel_2
-- 256 --- 257 --- 258 --
0
0.01
0.08
2nd cycle:
Send counter
Channel_1
Channel_2
-- 256 --- 257 --- 258 --
1
0.12
0.23
st
Logger_Manual_V03.51
IPETRONIK GmbH & Co. KG
ipetronik.com
62/ 123
Standard functions
7.6
Log file output via Hyperterminal
The logger status messages can be displayed online with a RS232 PC or notebook connection. The
MLOG.ht file is copied into the following directory:
C:\Documents and Settings\[user]\Startmenu\Programs\Accessories\Communikation\
HyperTerminal\....
Prior to this, a hyperterminal connection must be created.
Or create a new hyperterminal connection:
1
2
The following components are required for the
connection of M-LOG and PC:
for PCs with serial interface:
3
Apply these settings!
1 x USB to RS232 converter
1 x Null modem cable
1 x Gender Changer
for PCs without serial interface:
2 x USB to RS232 converter
1 x Null modem cable
1 x Gender Changer
The components for PCs without serial interface are
available as an optional package (M-LOG-OPT-086).
Logger_Manual_V03.51
IPETRONIK GmbH & Co. KG
ipetronik.com
63/ 123
Standard functions
7.7
Send e-mail with status information
If this function is activated and the logger has an internet connection (LAN, WiFi, modem), it sends a status
e-mail after acquisition stop with the following content:
- serial number and number of the current acquisition in subject line
- attached log file
- attached measurement status file if activated
- attached STG file (Min-Max list) if activated
1. Select the logger in system overview.
2. Activate the Data management tab.
3. Activate the Update connection
parameters > Configuration to change
the settings for data transfer configuration.
4. Select Activate e-mail delivery.
5. Define the corresponding setting in the EMail tab.
To
E-mail address of recipient
Subject
Subject line for serial number and mesaurement number file
From
E-mail address of sender (any text)
Description field
Description of serial number, measurement file number and attachement
Server IP address
IPE address of outgoing mail server (to e-mail account,
e.g. smtp.mail.proivder.com) for sending
Server name
Alternative input of server name of outgoing mail server
Authentication
User
Password
Access authorization to user e-mail account
User name
Password
Logger_Manual_V03.51
IPETRONIK GmbH & Co. KG
ipetronik.com
64/ 123
Standard functions
7.8
Output messages to CAN / LIN
With the Logger PlugIn V03.21.00 / TESTdrive 3.21 and higher an output of user defined messages to CAN
bus or LIN bus is supported.
The output timing can be selected from:
one-time, at start measurement,
one-time, at stop measurement,
cyclical every x ms.
An external file with the *.DAT extension is used to configure the settings for the messages.
A sample file is available from:
c:\Programs\IPETRONIK\IPEmotion PlugIn IPETRONIK LOG V03.xx.xx\Data\Channel.dat
The header of this files contains detailed information regarding to the usage of the parameters.
The screenshots below show the implementation of the external file in IPEmotion configuration.
1. Select Data processing in the left
Systems overview.
2. Select Add components > External
programs from the tab menu or from the
context menu.
3. The new entry External programs has
been added to Data processing.
4. Select External programs in the left
Systems overview.
5. Select Add components > External
programs from the tab menu or from the
context menu.
6. Chose additional settings in the tab
Extended.
Logger_Manual_V03.51
IPETRONIK GmbH & Co. KG
ipetronik.com
65/ 123
Standard functions
Extended (Runtime library)
External library
File location of the external application (DLM)
Configuration file
File location of the configuration (DAT)
Message cycle time
Ouput rate of the message (repetition rate)
Example Offset adjust for IPETRONIK modules connected to the logger’s CAN input
The message output feature offers the possibility to broadcast an offset adjust command to IPETRONIK
CAN modules with adjust function.
The sample file OffAddStart.dat contains the adjust commands for task Manual and Group 1-4.
The sample shows a manual adjust on CAN 01 with a baud rate of 500 kBit/s, executed with a time delay of
2.5 seconds from start measurement.
Brief description of the parameters (see header of the sample Channel.dat for detailed settings):
// Hardware initialization <---Basic setting of CAN/LIN input
[Init]
// Channel,
ChnType,
ChnIndex,
ChnMode,
Baudrate
CAN0,
1,
0,
1,
500000
<------ChnType LIN=2 /CAN=1, ChnIndex Nr 0...11=Input , ChnMode 29Bit=2 11Bit=1 / Baud rate
// List of messages (send/receive)
[Messages]
// Name, ID, Length Bytes <------ ID CAN/LIN -ID; Length= Number of bytes; Bytes = Message
//
Manuell_1,
Manuell_2,
Manuell_3,
Manuell_4,
Manuell_5,
Group1_1,
Group1_2,
Group1_3,
Group1_4,
Group1_5,
Group2_1,
Group2_2,
Group2_3,
Group2_4,
Group2_5,
Group3_1,
Group3_2,
Group3_3,
Group3_4,
Group3_5,
Group4_1,
Group4_2,
Group4_3,
Group4_4,
Group4_5,
0x0, 8,
0x0, 8,
0x0, 8,
0x0, 8,
0x0, 8,
0x0, 8,
0x0, 8,
0x0, 8,
0x0, 8,
0x0, 8,
0x0, 8,
0x0, 8,
0x0, 8,
0x0, 8,
0x0, 8,
0x0, 8,
0x0, 8,
0x0, 8,
0x0, 8,
0x0, 8,
0x0, 8,
0x0, 8,
0x0, 8,
0x0, 8,
0x0, 8,
Logger_Manual_V03.51
0x00, 0x91, 0x02, 0xCA, 0x3F, 0x00, 0x80, 0x80
0x00, 0x91, 0x02, 0xCA, 0x3F, 0x00, 0xC0, 0x81
0x00, 0x91, 0x02, 0xCA, 0x3F, 0x00, 0x40, 0x8C
0x00, 0x91, 0x02, 0xCA, 0x3F, 0x00, 0xC0, 0x8D
0x00, 0x91, 0x02, 0xCA, 0x3F, 0x00, 0x00, 0x8E
0x00, 0x91, 0x02, 0xC5, 0x3F, 0x00, 0x80, 0x80
0x00, 0x91, 0x02, 0xC5, 0x3F, 0x00, 0xC0, 0x81
0x00, 0x91, 0x02, 0xC5, 0x3F, 0x00, 0x40, 0x8C
0x00, 0x91, 0x02, 0xC5, 0x3F, 0x00, 0xC0, 0x8D
0x00, 0x91, 0x02, 0xC5, 0x3F, 0x00, 0x00, 0x8E
0x00, 0x91, 0x02, 0xC6, 0x3F, 0x00, 0x80, 0x80
0x00, 0x91, 0x02, 0xC6, 0x3F, 0x00, 0xC0, 0x81
0x00, 0x91, 0x02, 0xC6, 0x3F, 0x00, 0x40, 0x8C
0x00, 0x91, 0x02, 0xC6, 0x3F, 0x00, 0xC0, 0x8D
0x00, 0x91, 0x02, 0xC6, 0x3F, 0x00, 0x00, 0x8E
0x00, 0x91, 0x02, 0xC7, 0x3F, 0x00, 0x80, 0x80
0x00, 0x91, 0x02, 0xC7, 0x3F, 0x00, 0xC0, 0x81
0x00, 0x91, 0x02, 0xC7, 0x3F, 0x00, 0x40, 0x8C
0x00, 0x91, 0x02, 0xC7, 0x3F, 0x00, 0xC0, 0x8D
0x00, 0x91, 0x02, 0xC7, 0x3F, 0x00, 0x00, 0x8E
0x00, 0x91, 0x02, 0xC8, 0x3F, 0x00, 0x80, 0x80
0x00, 0x91, 0x02, 0xC8, 0x3F, 0x00, 0xC0, 0x81
0x00, 0x91, 0x02, 0xC8, 0x3F, 0x00, 0x40, 0x8C
0x00, 0x91, 0x02, 0xC8, 0x3F, 0x00, 0xC0, 0x8D
0x00, 0x91, 0x02, 0xC8, 0x3F, 0x00, 0x00, 0x8E
IPETRONIK GmbH & Co. KG
<----Manual
<-----Group 1
<-----Group 2
<-----Group 3
<-----Group 4
ipetronik.com
66/ 123
Standard functions
[Conditions]
// Name Condition
// Messages which have to be send at measurement start <---- The output sequence is defined by the
sequence of the list
[OnStart]
// Time,
Channel,
Message
2500000,
CAN0,
Manuell_1
<-- 2500000 µs after Start /CAN input/ To adjust a group, replace with Group1_1
2500000,
CAN0,
Manuell_2
<-- 2500000 µs after Start /CAN input/ To adjust a group, replace with Group1_2
2500000,
CAN0,
Manuell_3
<-- 2500000 µs after Start /CAN input/ To adjust a group, replace with Group1_3
2500000,
CAN0,
Manuell_4
<-- 2500000 µs after Start /CAN input/ To adjust a group, replace with Group1_4
2500000, CAN0, Manuell_5
<-- 2500000 µs after Start /CAN input/ To adjust a group, replace with Group1_5
Refer to the header of the *.DAT file for further parameter settings.
7.9
7.9.1
Event controlled measurement
Possibilities for data acquisition
For measurement signal acquisition and storage in electronic systems, analog signals need to be digitalized,
first. This is done by taking discrete measuring values from the continuous signal sequence (Sample & Hold)
and recording them cyclically. Cyclic recording is also used for native digital signals, e.g. for measuring data
packages from bus systems.
For some applications, it is useful to not record CAN bus data cyclically but event-controlled.
In the following, the basic features of both data acquisition types are described.
Logger_Manual_V03.51
IPETRONIK GmbH & Co. KG
ipetronik.com
67/ 123
Standard functions
7.9.2
Cyclic data recording of continuous signals
Features of cyclic data recording (PlugIn IPETRONIK-LOG)
time-based recording in a fixed time grid, e.g. sampling rate 100 Hz
different storage groups allow different data rates for recording
individual time channel for each storage group in measurement data set
continuous recording in equidistant intervals
suitable for analog signals
improved time accuracy due to increased sampling rate (oversampling)
clear comparability of different signals using a synchronization clock (Master Sample Clock MSC)
protocol measurement during data acquisition using bus systems is possible (CCP, XCP, FlexRay, ... )
bus signals are allocated to the respective time grid (sampling rate)
(time) differentiation of two signals is not possible in the time grid
sampling points without real signal value are indicated with "NoValue" (invalid) in data set
Logger_Manual_V03.51
IPETRONIK GmbH & Co. KG
ipetronik.com
68/ 123
Standard functions
7.9.3
Event-controlled data recording of bus signals
Sample graph
Features of event-controlled data recording (PlugIn IPETRONIK-LOG)
event-controlled recording without fixed time grid for bus signals, e.g. CAN bus
all signals of a message are provided with an exact time stamp, as with traffic measurement
individual time channel for each message in measurement data set
discontinuous recording without defined time grid
suitable for measurement of bus signal differences and of sporadic or single signals
measuring values in different messages feature different time stamps > in the result graph, the time
stamps do not lie on the same x-values any more
no protocol measurement possible (CCP, XCP; FlexRay, ... )
determination of exact time difference between signals (difference between time stamps)
"NoValue" entries indicating the absence of signals are avoided
Logger_Manual_V03.51
IPETRONIK GmbH & Co. KG
ipetronik.com
69/ 123
Standard functions
7.9.4
Setting up event-controlled data recording (PlugIn IPETRONIK-LOG)
General
Event-controlled measurement, available from TESTdrive 3.51.00 onwards, features the benefits of signal
measurement and traffic measurement:
Signal selection is already interpreted (name, scaling, unit,...). Yet, measurement is not performed cyclically
but with "real" time stamp. Signals are only recorded if they really are present on the CAN bus. Using the
exact time stamp.
Event-controlled measurement appears like a signal measurement on the configuration surface and in the
measurement file. Loggers process the respective storage groups in traffic measurement mode.
Configuration settings
The respective signals must not be recorded cyclically.
Logger_Manual_V03.51
IPETRONIK GmbH & Co. KG
ipetronik.com
70/ 123
Standard functions
In the storage group, the storage rate has to be set From channel. It should not be a fixed storage rate.
As a result, sampling rate is Event controlled and storage rate is Auto.
Logger_Manual_V03.51
IPETRONIK GmbH & Co. KG
ipetronik.com
71/ 123
Standard functions
Measurement file
Event-based signals are recorded in an event-based storage group TS_xxxxxx.DAT. A signal-based storage
group DOxxxxxx.DAT with cyclic storage rate cannot contain event-based signals since event-controlled or
cyclic recording types are properties of signals and not of storage groups.
There are two types DAT files:
DOxxxxxx.DAT for storage groups with
cyclic storage rate and signals with fixed,
cyclic sampling rate
TSxxxxxx.DAT for storage groups with
event-controlled, non-cyclic signals without
fixed sampling rate
Conclusions
Each message that is recorded eventcontrolled receives an individual time
channel
In DAT format of the logger measurement
each message creates an own internal
storage group (TSxxxxxx.DAT)
In order to ensure strong system
performance, it is useful to check the
number of event-controlled measuring
signals according to the application
(necessary number of storage groups).
Measurement data set
In table view, it becomes obvious that
time intervals are not equidistant any more and
messages (signals) are no more identical. Each
value is measured and saved at the time it
actually occurs on the CAN bus.
Logger_Manual_V03.51
IPETRONIK GmbH & Co. KG
ipetronik.com
72/ 123
Standard functions
7.9.5
Practical example: Determination of the latency of two signals
Task
An electronic system (ECU) receives messages via CAN bus (input signals) and sends them out again on
the CAN bus, e.g. as forwarding or after calculation (output signals).
Processing time = response time of the system is to be determined.
Realization
The response time results from the time difference between input and respective output signal. Since both
incoming and outgoing CAN messages are provided with a time stamp, the exact time difference can be
determined through event-controlled measurement.
Advantages:
No event gets lost (not fixed to a sampling rate or to several signals within one sampling interval).
Unique time stamps from TESTdrive are used.
Event-controlled measurement is based on traffic measurement > traffic group.
Each ID generates an event with a new signal value.
Logger_Manual_V03.51
IPETRONIK GmbH & Co. KG
ipetronik.com
73/ 123
Options (license required)
8
8.1
Options (license required)
Hardware options (internal)
M-LOG and S-LOG can be extended by 3 slots with different IPETRONIK cards. Max. 3 cards can be
combined depending on the assignment to the extension slots and the port replicator. The active CAN cards
support a highly accurate 1 µs time stamp. This time stamp is synchronous for all inputs within a card.
8.1.1
CAN cards
The following CAN cards with galvanically isolated high speed inputs acc. to ISO 11898-2 and low speed
acc.to ISO 11992-1 are available:
2 x CAN High Speed, WakeOnCAN functionality, active data preprocessing and message buffer
4 x CAN High Speed, WakeOnCAN functionality, active data preprocessing and message buffer
3 x CAN High Speed, WakeOnCAN functionality, active data preprocessing and message buffer
+ 1 x CAN Low Speed (5 V, fault-olerant)
3 x CAN High Speed, WakeOnCAN functionality, active data preprocessing and message buffer
+ 1 x CAN Low Speed (24 V)
8.1.2
CAN / LIN cards
The following CAN LIN combination cards with galvanically isolated inputs are available:
2 x CAN High Speed, WakeOnCAN functionality, active data preprocessing and message buffer
+ 2 x LIN
2 x CAN Single Wire (GMW 3089 V2.1) + 2 x LIN
1 x CAN Single Wire (GMW 3089 V2.1) + 1 x CAN High Speed, WakeOnCAN functionality, active data
preprocessing and message buffer + 2 x LIN
8.1.3
Ethernet cards
The following ETH card with galvanically isolated inputs is available:
2 x ETH 10/100 MBit LAN, e.g. as input via XCPonEthernet or FlexRay-Ethernet converter
Logger_Manual_V03.51
IPETRONIK GmbH & Co. KG
ipetronik.com
74/ 123
Options (license required)
8.2
8.2.1
Software options
Import signal description files
IPEmotion supports the import and management of signal descriptions from CANdb (*.dbc), ASAP2 files
(*.a2l), and diagnostic description files (*.idf).
The contents are read and managed by importing the original files into a database (Microsoft SQL-Server).
The original files are therefore not longer required. Please note at updating the CAN system or the control
unit that the current description file must be reloaded to update signal descriptions, if required. An export of
the signal settings changed with IPEmotion into the original description file is not possible.
Import data from a description file: CANdb
(*.dbc), ASAP2 (.a2l), LINdb (*.ldf)
1. Select a CAN input (here CAN 01).
2. Select Import from the tool bar.
3. Select the directory and the type of the
decsription file to open.
dbc defines CANdb files
a2l defines ASAP2 files
ldf defines LINdb files (LIN Description File)
4. To import an A2L file, select the
communication protocol first
5. Confirm with OK.
6. The imported signals (Pool) are displayed in
a table.
General signals at CAN 01 cannot be configured if CAN 01 is already used for IPETRONIK
devices!
Importing signal descriptions from ASAP2 or CANdb is the easiest and most secure method to
configure signals.
Signals can also be manually created at an input (without description file). Select Add
components > Standard CAN from the tool bar within the Signals navigation tab.
Logger_Manual_V03.51
IPETRONIK GmbH & Co. KG
ipetronik.com
75/ 123
Options (license required)
Import CANdb file
Logger_Manual_V03.51
IPETRONIK GmbH & Co. KG
ipetronik.com
76/ 123
Options (license required)
Import signal descriptions from the CANdb
Signals in data source
Logger_Manual_V03.51
Select signal
Properties of highlighted
signal (Front_right)
IPETRONIK GmbH & Co. KG
ipetronik.com
77/ 123
Options (license required)
Import ASAP file
Logger_Manual_V03.51
IPETRONIK GmbH & Co. KG
ipetronik.com
78/ 123
Options (license required)
Import signal descriptions from A2L
Signals in data source
CCP protocol settings
Select signal
Properties of highlighted
signal (Front_right)
Resume active
The ECU can be disconnected and and reconnected to
the CAN bus. Data acquisition is continued after
reinitialization.
Seed & Key
Authentication procedure used for restricted access to
ECUs. A program file provided by the ECU manufacturer
is required to proof access authority.
EPK check
Compares the checksums of the configuration (A2L file)
with the respective sums stored with the ECU.
Use optional commands
Enables optional commands provided by the ECU.
Commands are listed in the A2L file and make the
communication more comfortable.
Logger_Manual_V03.51
IPETRONIK GmbH & Co. KG
ipetronik.com
79/ 123
Options (license required)
Import Diagnostic file
Logger_Manual_V03.51
IPETRONIK GmbH & Co. KG
ipetronik.com
80/ 123
Options (license required)
8.2.2
Detection mode and cycle rate
Polling
Polling functionality is supported by A2L for CCP and XCP, i.e. no DAQ lists are
required.
IPEmotion offers three different speeds for data requests. The times are reference values because the
values must be individually requested at the control unit and create a high bus load.
SLOW
Example:
1000 ms
MIDDLE
100 ms
FAST
10 ms
st
If 5 values are detected in the SLOW polling mode, the 1 value is requested by the control unit
a 2nd time after approx. 6 s.
DAQ list or polling?
Communication via CCP protocol takes place by sending the data cyclically or triggered by an
event after the first inquiry. The send rate is defined in the respective DAQ list, e.g. 10 ms, 100
ms or synchronous to an event. Not all control units support this mode or the DAQ lists are not
included in the A2L file. In this case, the signals can be sampled individually with the polling
mode. But this method causes a much higher bus load and therefore longer response times.
8.2.3
Traffic acquisition
The CAN traffic acquisition (also CAN-Trace) allows high-capacitive recording of CAN messages (total bus
traffic) with the CAN controller of each measuring input. Due to the fact that a huge amount of data can result
from this method within a short time, data acquisition can be restricted with 20 definable admission filters.
Every input has 2 ID trigger to control the traffic acquisition start.
Filters and triggers
With selecting the respective branch, the available filters are displayed in a table. You can now define the ID
areas of the CAN messages, which are saved at meeting one of the trigger conditions.
2 ID triggers are available within the traffic properties in the dialog. As soon as one of the trigger conditions is
met (OR operation), all filtered CAN messages of the CAN inputs are saved. A condition can be defined for
every data byte within the ID trigger (= CAN message). Only if all conditions are met (AND operation), the
trigger is activated.
Data format and conversion
Traffic data is saved in a binary file with header (description) and the actual data, e.g. TD001234.bin. To
generally use the data (e.g. import in CANalyzer), data is converted into the ASCII format with the data
converter.
Use the IPETRONIK data converter version 2.xx IPEconverter WIN with graphical user interface (requires a
license ) or the version with the command line IPEconverter CMD (no license required).
The software, as well as, the documentation are saved at the IPETRONIK CD:
...\IPETRONIK_SoftwareProducts\Tools\DataConverter\…
Logger_Manual_V03.51
IPETRONIK GmbH & Co. KG
ipetronik.com
81/ 123
Options (license required)
Configuring traffic acquisition
1. Select a CAN input (CAN 02).
2. Select Traffic recording from the main
menu Add components or with the
context menu and right mouse button.
3. Now the tree structure shows the new arm
Traffic recording at the respective CAN
input.
4. Select Filter and/or ID-Trigger from the
main menu Add components or with the
context menu and right mouse button to
restrict the recording to the required data.
Logger_Manual_V03.51
IPETRONIK GmbH & Co. KG
ipetronik.com
82/ 123
Options (license required)
8.2.4
Statistics calculation
The frequency of signals is counted and evaluated with classifications. To do so, the acquisition range is
divided into equal (equidistant) zones (classes). The current values is assigned to one class at every
sampling and the frequency is counted (see figure).
Class
Measuring signal
Table
Classification
Frequency
Advantages
Disadvantages
Much less storage required than with a time
related acquisition
No original value
Very suitable for statistical analyses (e.g. life
cycle tests)
No time reference of the signal
Classification methods
Different classification methods have been developed in the past whereof IPETRONIK supports the most
common methods (acc. to DIN 45667, FVA sheet):
Random sampling counting
Level crossing counting
From-To counting
Edge counting
Rainflow method (available upon request)
Please find further information in the Classification.pdf document (Classifying with KIM/KAR and DIS) on the
IPETRONIK CD or at the FTP info server.
Requirements
Hardware
M-LOG, S-LOG, FLEETlog, IPElog
Configuration
IPEmotion
Software
TESTdrive V03.06 or V03.18 (IPEmotion) or V03.50 (IPElog) or higher
It is recommended to use the latest software version for guaranteeing a clean functionality of all
components..
Logger_Manual_V03.51
IPETRONIK GmbH & Co. KG
ipetronik.com
83/ 123
Options (license required)
Configuring statistic / classification
1st Step
Creating configuration
Start IPEmotion and load an existing configuration or create a new configuration.
Import the corresponding signal descriptions (CANdb or ASAP2) and/or configure additional
IPETRONIK devices.
Activate the desired inputs and run the required scaling.
Select a sampling rate or accept the default sampling rate. Please note that the sampling rate, which is
selectable in the classification, cannot be higher than the maximum sampling rate.
2nd Step
Defining storage group
(if time related data is also required)
Create a new storage group with Storage groups and the context menu
Add components to also record the time related signals.
Assign the desired signals to the corresponding storage group.
3rd Step
Defining classification
Select Data processing in the system structure and select Statistic
from the main menu Add components or with right mouse button
> context menu.
Select Statistic in the system structure and select Components >
Channel from the main menu or with right mouse button > context menu
to create channels.
Define additional classification settings within the tabs General,
Settings, and Trigger.
Reset behaviour
Data is written into a new classification
file at changing the configuration or at
starting acquisition.
Sampling rate
Data storage rate of classification
Trigger (Statistik)
General trigger, defines start- and stoptrigger, value range 0 / 1
Classification
Name
any name for classification
Mode
selected classification method
Trigger
defines start- and stop-trigger of the active
channel (classification start and stop
Logger_Manual_V03.51
IPETRONIK GmbH & Co. KG
ipetronik.com
84/ 123
Options (license required)
8.2.5
Operating in FTP mode (terminal server)
TESTdrive version 3.09.00 allows starting M-LOG as FTP server. Data can easily be transmitted with a FTP
software (e.g. Total Commander or WS_FTP). Depending on the user rights, data can additionally be
deleted or written. A separate USB flash drive incl. TESTdriveCmd.xml file is required for this functionality.
The running acquisition is stopped and the log file saved with connecting the USB.
If the TESTdriveCmd.xml file includes the "StartFTPServer" OnConnect job, there is no post processing.
TESTdrive reads the corresponding parameters and starts the FTP server.
Server access requires the following user data:
Version
User
Password
Access rights
V03.09.00
guest
none
Read to TO directory
A reboot is automatically running at connecting USB flash drive to correctly stop the service as FTP server.
Procedure:
1. Switch-on M-LOG
2. Connect USB flash drive with TESTdriveCmd.xml
3. Connect Ethernet cable between M-LOG and PC, e.g. 600-591.xxx (M-LOG PR05, S-LOG)
4. Configure network settings of PC, create additional "Alternative configuration"
User defined
IP address: 192.168.0.1 (Example)
Total Commander settings: Server name: 192.168.0.2, Enter user name and password
8.2.6
Recording audio and video data
Recording video data
Data logger supports recording video or single shots with a camera. The camera is connected to the logger
USB port.
Following settings are available:
Resolution
Defines the image quality
"Low"
160 x 120 Pixel (B x H)
30/20/10/5 images per second
"Medium"
320 x 240 Pixel (B x H)
30/20/10/5 images per second
"High”
432 x 240 Pixel (B x H)
30/20/10/5 images per second
Max. recording time Defines the recording duration
Frame rate
Defines the number of images per second
All three options directly influence the required memory.
Trigger
A trigger condition must be defined to start recording.
Trigger mode
Triggering to raw data or scaled values
Raw
Triggering to raw data
Phys.
Triggering to physical values (acc. to scaling)
Logger_Manual_V03.51
IPETRONIK GmbH & Co. KG
ipetronik.com
85/ 123
Options (license required)
Recording audio data
Data logger (M-LOG, S-LOG) supports recording audio signals (sounds, speech) with a microphone at the
audio input.
Following settings are available:
Bit rate
Defines the audio signal quality
22050 Bit/s (FM radio), 11025 Bit/s (AM radio), 8000 Bit/s (Phone quality)
Max. recording time Defines the recording duration
Both options directly influence the required memory.
Trigger
A trigger condition must be defined to start recording.
Trigger mode
Triggering to raw data (Raw) or scaled values (Phys)
8.2.7 UDS protocol (Unified Diagnostic Services)
UDS protocol combines KWP2000, GMLAN, and DiagnosticOnCan in one protocol. An advantage is the
clear session handling (higher compatibility of different control units). Furthermore, UDS supports modern
memory structures, which require a > 32 Bit addressing.
The corresponding description file has the ODX extension.
Control units of some manufacturers already support UDS, which will be used as standard diagnostic in near
future.
Jobs overview
TESTdrive V03.15 supports the following jobs, which can be read via UDS:
FS_READ
FS_READ_DETAIL
IDENT
READ_DATA_REFERENCE
FG_READ
DYNAMICALLY_DEFINE_LOCAL_ID
These jobs can be defined with an *.idf file.
Storing data
The results are optionally stored as binary file (*.CSV and *.J**) or as trace and binary file (*.CSV, *.J** and
*.T**).
The files are identified as follows:
Single data detected via KWPonCAN:
(former description)
BDKxxxx.CSV bzw. BDKxxxx.Jxx
BDJxxxx.CSV bzw. BDSxxxx.Jxx
UDS data detected via trace mode:
BDUxxxx.txx
Selecting protocol
The UDS protocol is selected with the corresponding tab in the import module.
Logger_Manual_V03.51
IPETRONIK GmbH & Co. KG
ipetronik.com
86/ 123
Options (license required)
8.3
Recording GPS-Data
The GPS receiver GPS 18 and the NMEA protocol option, M-LOG, S-LOG, as well as, FLEETlog WAN with
integrated GPS receiver support the continuous recording of GPS data with the global satellite navigation
system. This functionality allows positioning and logging of test routes with a data rate of 1 Hz.
Predefined settings are available to configure the acquisition. The single channels are activated as required.
The accuracy of the positioning data is considerably defined by the number of received
satellites (12 satelites are in the geostationary orbit).
Due to physics, the accuracy of the height acquisition (Altitude) with this method is considerably
lower than that of the length acquisition (Latitude = geographical width, Longitude =
geographical length).
Logger_Manual_V03.51
IPETRONIK GmbH & Co. KG
ipetronik.com
87/ 123
Options (license required)
8.4
Remote data transfer
The logger offers the availability of wireless data transfer by corresponding options. Single vehicles, as well
as, entire vehicle fleets can be managed from one or several bases. Due to the worldwide good to excellent
GSM network coverage, regional and global test drives can be managed from any base.
8.4.1
Transferring data using GPRS and Internet to FTP server
Components
M-LOG, S-LOG, FLEETlog WAN, IPElog
M-LOG, S-LOG with GPRS data transfer option with COMgate WAN, antenna, data transfer
software or with modem, antenna, data transfer software
Connecting cables
SIM card for modem (depending on provider)
Functional principle
A logger in measuring mode continuously stores data as defined in the configuration. If the test series is
completed (status of remote signal is inactive, e.g. terminal 15), data is packed and transferred via GPRS in
GSM network to the next node point. This data is then transferred via internet to a FTP server for being
available for download. All data transfer settings are defined in the IPETRONIK software.
Logger_Manual_V03.51
IPETRONIK GmbH & Co. KG
ipetronik.com
88/ 123
Options (license required)
8.4.2
Transferring data using Wireless LAN to netzwork server
Components
M-LOG, S-LOG, FLEETlog WAN, IPElog
M-LOG, S-LOG with WiFi data transfer option with COMgate, antenna, data transfer software or with
client, antenna, WiFi software
Connecting cables
WiFi access point to connect with network (M-LOG, S-LOG)
Funktional principle
A logger in measuring mode continuously stores data as defined in the configuration. If the test series is
completed (status of remote signal is inactive, e.g. terminal 15), data is packed. If the vehicle is within reach
of an access point (up to 300 m outdoors), data is transferred via WiFi to the access point. This data is then
transferred via local network to a server. If the local network is connected to the internet, data can also be
transferred to a FTP server for being available for download. All data transfer settings are defined in the
IPETRONIK software. Due to multiple encoding options (transmission protocol and user), a very high degree
of security against unauthorized access is guaranteed.
Logger_Manual_V03.51
IPETRONIK GmbH & Co. KG
ipetronik.com
89/ 123
Display modules
9
9.1
Display modules
M-VIEWfleet
M-VIEWfleet is a alphanumerical data display, which is connected to the USB of the logger. M-VIEWfleet
provides different displaying modes besides four status LEDs and buttons. The number of displayed
channels is only limited by the processor load.
Only connect MVIEWfleet to logger if
logger is switched-off. If
M-VIEWfleet is connected
to logger during operation,
the USB interface can be
damaged.
M-VIEWfleet is connected to M-LOG with an USB 2.0 interface. A second USB port of the logger is available
at the display. USB 2 is used for e.g. a program update or to exchange measurement or configuration data
via USB flash drive. USB connections are designed for a maximum length of 5 m. Display settings are
defined in the system configuration.
Logger_Manual_V03.51
IPETRONIK GmbH & Co. KG
ipetronik.com
90/ 123
Display modules
9.1.1 Keys and LEDs
Operating status LEDs
Red
Error
Green
Value status LEDs
For induvidual control by
user
M-VIEW detected by logger
Value display
2-lines display of
signal and value
DATA/PWR socket
Cable connection to
logger
Light sensor
For brightness control
Audio input
To connect a
microphone
USB socket
For data exchange with
USB flash drive
Status line
With additional
information
On/Off
Switch-on/off logger at
M-VIEW
Menu
Start/Stop acquisition
OK
Switch, Scroll, Buzzer
off, Clear alarm
Up/Down
Manually scroll display
Status line
The scroll mode MANUAL (with Up/Down keys) or AUTO (automatically) is displayed in the right zone of the
staus line. The following informatiojn is alternately shown in the left zone:
DATAFILE
Name of current data file
TIME LEFT
Available time in days (D) and hours (H) for data recording
DRIVER
Selected driver
SHIFT
Selected shift (track or road sections belonging together)
OK
Function in standard display
1.
Display Min/Max
Press longer than one second
2.
Back to standard display
Press longer than one second
Function in standard display in scroll mode AUTO:
(Changed from AUTO to MANUAL with Up/Down keys)
1.
Back to auto scroll mode
Press longer than one second
If the key is not pressed, the display changes after 30 s into auto scroll mode.
Switching from MANUAL to AUTO is only possible if auto scroll mode has been activated!
Function at configured alarm limit values:
1.
Buzzer off
Shortly press to switch-off buzzer
2.
Clear alarm
Press longer than one second, Back to standard view
If the alarm has already been cleared 5 times, a final message appears to definitely delete the alarm.
Up/Down ▲ ▼
One line up
▲
One line down
▼
Switch AUTO > MANUAL
▲ or ▼ if AUTO (Auto scrolling) has been activated in configuration
Logger_Manual_V03.51
IPETRONIK GmbH & Co. KG
ipetronik.com
91/ 123
Display modules
Menu
Stop acquisition -> Press longer than two seconds
Start acquisition -> Press longer than two seconds
The option Allow start and stop of acquisition must be activated in the configuration. The
measurement file number is increased by one at every acquisition start. If the option Track or
Track/Driver (List type selection) is additionally selected, files can be merged to one file until
the final end of data recording.
Devices connected to the logger remain switched-off until acquisition stop.
ON/OFF button (PIC firmware ≥ V1.05 required on the logger!)
Logger on -> Press longer than one second
Logger off -> Press longer than one second
Green LED shows the status of the switch-on command. (LED on = REM2 ON)
Terminal 15 should not be used with the On/Off key because only one operation is supported
either with the On/Off key or with terminal 15. Mixed operations with both remote functions are
not possible.
Operating status LEDs
Red
1. Error
2. Logger is booting, initializing M-VIEW
Green Operation, M-VIEW detected by logger
Value status LEDs
The 4 status LEDs can be controlled with calculations. Additional limit violations can therefore individually be
displayed.
9.1.2 Configuring M-VIEWfleet
Select Display in the tree structure.
Select Add components.
Select M-VIEWfleet.
Select the desired signals.
Confirm the desired signals with OK.
Define the alarm values for the upper and lower signal limit, if desired. If the current signal reaches the alarm
limit, the display changes into the message window and the buzzer sounds. Clear the alarm with OK.
Activate the detection of the minimum and/or maximum values for the respective signal. With pressing OK,
the display changes into showing the minima and maxima. If the detection has not been activated, ------.-- is
shown. Pressing OK again changes back to standard display.
Logger_Manual_V03.51
IPETRONIK GmbH & Co. KG
ipetronik.com
92/ 123
Display modules
Define status LEDs for limit display
The 4 status LEDs can be activated by separate and user-defined calculation formulas. Additional thresholds
can therefore be defined and reaching these limits can optically be signalized. In addition, the LEDs can be
used as status display for the 4 digital logger outputs.
To do so, the following options are available:
Use the same formula like at the corresponding digital output
Status query of digital output to 1 (LED ON, for the time digital output = 1)
Setting display modes
Select Active to use M-VIEWfleet in the configuration.
No further settings can be defined without activating M-VIEWfleet! If an existing M-VIEWfleet
configuration is deactivated, the logger display has no function! This is signalized by the red
LED. The red LED is also on if the USB port is damaged during operation by disconnecting the
cable.
Logger_Manual_V03.51
IPETRONIK GmbH & Co. KG
ipetronik.com
93/ 123
Display modules
Scroll mode
Off
Manually switching lines with Up/Down
5s
Continuous line switching in interval of 5 s, display moves line by line from the bottom up
in order of signal list
List type
Off
Neither track nor driver defined
Track
Track selection by driver is assigned in data
Track/driver
Track, as well as, driver are selected before start and set in data
The text file of the track selection list is defined in:
...\IPETRONIK\\IPEmotion MAL-PlugIn IPETRONIK LOG V03.xx.xx\Data\MViewfleet\MVIEWfleetTracks.txt
The text file of the driver selection list is defined in:
...\IPETRONIK\\IPEmotion MAL-PlugIn IPETRONIK LOG V03.xx.xx\Data\MViewfleet\MVIEWfleetDrivers.txt
Changes of the entries can manually be defined in the respective text file.
Allow start and stop of acquisition
Pressing the menu key stops the data storage and the current measurement file is closed.
Pressing the menu key again starts the next data storage and the number of measurement file is increased
by one.
Merge measurement files
This function requires a selected list type!
The end of every acquisition includes the End Shift xxx query. If it is confirmed with OK, all previous partial
acquisitions of one file are merged and the number for the next measurement file is increased by one. If this
function is not activated, an own file is written after every acquisition stop and a following acquisition is
recorded with a new number.
Confirm shift/track at stop
A selected list type is required for this function and Merge measurement files must be activated!
The query runs after acquisition stop:
End Shift xxx!
Yes OK?
Track is stopped, partial acquisitions are merged in one
measurement file
No OK?
Track is continued at next start with same measurement file
The query runs after acquisition start:
Shift xxx Good Trip!
OK?
Currently saved track is continued with new acquisition file
Change OK?
Track and driver can be selected again
If nothing is entered after a query, an acoustic message sounds after 20 s and the saved
settings are accepted for the next acquisition.
Logger_Manual_V03.51
IPETRONIK GmbH & Co. KG
ipetronik.com
94/ 123
Display modules
9.2
M-VIEWgraph
Important advice for mounting!
If mounting with a suction pad holder, the bottom of the display enclosure must be additionally
fastened with Velcro tape to an underlayer/board (e.g. dashboard). Free mounting only with the
suction pad holder is not permitted for test drives..
M-VIEWgraph is an alphanumerical and graphical data display.
The display is connected to the logger via USB port. In addition to two status LEDs, it provides four trigger
LEDs to show limit violations. The display is controlled with 12 illuminated keys, 4 keys with standard
functions, 8 keys, which can individually be defined (projected).
The illuminated 7’’ TFT display has a resolution of 800 x 480 pixel to display graph charts and numerical
values.
M-VIEWgraph cannot be
supplied with power via
the logger as MVIEWfleet.
Connect M-VIEWgraph
and logger ONLY if
switched-off, otherwise the
USB interface could be
damaged.
ALWAYS connect PWR(black banana male
connector = PWR-GND) of
the M-VIEVgraph cable to
avoid overload of the
signal GND line (GPS
power, Remote2).
Logger_Manual_V03.51
IPETRONIK GmbH & Co. KG
ipetronik.com
95/ 123
Display modules
9.2.1 Keys and LEDs
Operating status LEDs
Red
Error
Green M-VIEW
d t t d
Value status LEDs
On/Off
Light sensor
For induvidual control
by user
Switch-on/off logger
at M-VIEW
For brightness
control
F1 right
F1 left
Scroll up in limit value
window
F2 left
F2 right
Buzzer off
F3 left
F3 right
Clear alarm, Exit limit
value window
F4 left
F4 right
Scroll down in limit
value window
Page selection
Page up
OK
Page down
Switch-on/off logger
at M-VIEW
Scroll one page
up
Buzzer off
Scroll one page
down
The functionality of keys F1 right to F4 right is also available with the touchscreen of the alarm window.
The side keys F1 to F4 left and F1 to F4 right can be used to control data recording with a corresponding
configuration, e.g. as start- and stop-trigger.
9.2.2 Configuring M-VIEWgraph
M-VIEWgraph supports the display of any number of pages. Due to the fact that the processor capability is
limited, it is recommended not do create more than 20 to 30 different pages (depending on the proportion of
graphical elements).
Configuration of up to 15 pages/200 signals have been tested. Bigger configurations could
cause displaying problems.
Use devices with a serial end number > 116 (Processor PXA320) only with firmware version >=
1.05.
Add M-VIEWgraph, display pages, and channel
Select Display in the tree structure.
Select Add components.
Select M-VIEWgraph.
Add a Display page + Channel.
Logger_Manual_V03.51
IPETRONIK GmbH & Co. KG
ipetronik.com
96/ 123
Display modules
Define status LEDs for limit display
The 4 status LEDs can be activated by separate and user-defined calculation formulas. Additional thresholds
can therefore be defined and reaching these limits can optically be signalized (see M-VIEWfleet).
Define display page
The display can be separated into different areas. A page title can be assigned to every page (invisible in
measuring mode) and a title can be assigned to every screen zone (visible in measuring mode).
The following layouts can be selected with the current IPEmotion version:
Full screen
Horizontal tripartition
Horizontal bipartition (The screen is horizontally divided to 50% each. The upper area shows
graphs and the lower one the current value as numerical display.)
Horizontal bipartition 75 % to 25 %
Vertical tripartition
Vertical bipartition
Vertical bipartition 75 % to 25 %
Dynamic
Example 1:
Display layout Vertical bipartition
The screen is horizontally divided to 50% each.
Both areas show an alphanumerical display.
The scientific display of values (e.g. 1e-03) is used from TESTdrive 3.17.01 only for very great
values.
Graph display settings
Type
Displaying type
Graphs
Signal displaying in curves/graphs
Numerical display
Numerical signal displaying
Updating mode
Scaling type of x-axis
50 %-Scroll
If the defined interval in x-axis area is elapsed, 50 % of the window are
moved to the left and the graphs move from the middle to the right. If they
reach the right end, the 50 % window is moved into the left area and so
on.
Autoscrolling
If the defined interval in x-axis area is elapsed, the current graph data
continuously move from right to left.
Autoscaling
If the defined interval in x-axis area is elapsed, the graph data are accumulated, i.e. scaling of the time axis is dynamically fit.
Logger_Manual_V03.51
IPETRONIK GmbH & Co. KG
ipetronik.com
97/ 123
Display modules
x-axis area
Displayed time interval at x-axis
Select an interval from 15/ 30s, 1/ 2/ 5/ 10/ 20/ 30 min, 1/ 2 h.
One joint y-axis
One joint y-axis for all graphs
Line width
Line width of graphs
Define the line width of all graphs in this area, selectr from 1/2/3 pt.
Numeric display settings
Visible columns
Division of the current screen area for numerical display in horizontal and vertical columns.
Text color
Define the text color for all numerical displays in this screen area.
If a Channel is selected, following settings can be defined in Numerical display tab:
Name
Enter an alternative signal name, e.g. as short description if the original name is too long to show at the
configured M-VIEWgraph display.
Integer places
Number of digits to the left of a separator
Decimal places
Number of digits after a separator
Define limit values (Alarm function)
Limit values of displayed signals can be defined with the main menu
Acquisition > Add limit value.
The respective signal limits are directly defined in the signal dialog
(channel configuration)!
After every limit violation, the display changes into limit value window and
the buzzer sounds. For the time the limit violation is applied, the signal is
dislpayed in red.
Following information is shown in the limit value window:
Signal (signal name) with current value and unit
Date and time of violation
Number of previous violations
defined lower limit value
defined upper limit value
Minimum signal value
Maximum signal value
Status information (file name, available memory duration, date, time)
Scroll through the single limit value windows with the arrow keys of the touch screen or the F1 / F4 keys if
several alarms apply.
After clearing the alarms, the display changes into the measuring window. If the limit violation still applies,
the respective signal is shown in red. A change into the alarm window only takes place if a new limit violation
applies.
Logger_Manual_V03.51
IPETRONIK GmbH & Co. KG
ipetronik.com
98/ 123
Display modules
Acquisition start and stop
see M-VIEWfleet -> Configuring displaying modes
Shift/driver function
see M-VIEWfleet -> Configuring displaying modes
ON/OFF
The logger can manually be started with the ON/OFF button at MVIEWgraph. Press the key for approx. 2 s to start the logger and the
acquisition. The display LED is on and signalizes operation. An
acoustic signal sounds during measuring mode. Press this key again
to stop acquisition and shut down the logger.
Please note that the terminals 30 and 31 of the logger are connected (not terminal 15)!
Simulate function Keys Menu, Up, Down, OK
TESTdrive 3.22 offers the additional keys (Menu, Up, Down, OK), which can be controlled with a trigger.
Activating a respective key can be simulated with a corresponding formula.
The example shows the “OK“ action, e.g. “Switch-off buzzer“, as soon as the digital input is high.
Logger_Manual_V03.51
IPETRONIK GmbH & Co. KG
ipetronik.com
99/ 123
Display modules
Event handling
Event signals can be used to control data recording, as well as, to switch-on/off external components via the
digital outputs.
Add event signal
1. Select Event signals from the
Signals tab.
2. Select Add components from the
tab menu or with the context menu
(right mouse button).
3. Select Event signal to add it to
Select events
1.
2.
3.
4.
Select the Event signal from the list.
Activate Extended tab.
Select Triggering event.
Select Resetting event.
The status of the respective event signal
remains applied from triggering until
M-VIEWgraph Fx xxx
side keys (right/left) F1 to F4 at M-VIEWgraph
BeepOn
Buzzer is activated
BeepOff
Buzzer is deactivated
MonitorOn
M-VIEWgraph is switched-on
MonitorOff
M-VIEWgraph is switched-off
Limit violation On
At least one limit violation applies.
Limit violation Off
No limit violation applies.
TriggeredShutdown
Remote signal logger off, Logger still in follow-up time
Logger_Manual_V03.51
IPETRONIK GmbH & Co. KG
ipetronik.com
100/ 123
Accessories
10 Accessories
10.1 Electrical accessories
10.1.1
COMgate
COMgate is an intelligent extension device for logger and allows remote transmission of measurement and
configuration data.
M-COMgate in mounting enclosure for M-LOG
COMgate is available in 2 versions:
COMgate
WLAN acc. to WiFi 802.11 a/b/g
COMgate WAN
WLAN acc. to WiFi 802.11 a/b/g
and modem for GSM/GPRS/3G
4 status LEDs
SMA for WiFi antenna
FME for modem antenna
Lemo 0B – socket PWR / ETH
Cable 620-614 to logger with
ETH socket Lemo 0B 7-pin
LED status display
LED display
Status
GREEN
PWR ON
Device is ready for operation
(operation: see LED yellow or orange)
MODEM
Establishing connection to UMTS/GPRS network
MODEM
Successfully registered to UMTS/GPRS network
MODEM
Steady connection
WiFi
Establishing connection to WiFi network
WiFi
Successfully registered to WiFi network
WiFi
Steady connection.
ERROR
Interference, potential reasons are:
- transfer of new configuration
- wrong configuration loaded
- general operating interference
ORANGE
YELLOW
RED
Meaning
M-COMgate requires additional external cooling on M-LOG at operating in ambient
temperatures > 70 °C (158 °F)!
Logger_Manual_V03.51
IPETRONIK GmbH & Co. KG
ipetronik.com
101/ 123
Accessories
10.1.2 Extender
CAN-Extender
Input with status
LED (Bus traffic)
Operating status
LEDs
ETH/PWR socket
to M-LOG
M-LOG Extender is an extension device with 4 additional CAN inputs. M-LOG devices, which are already
equipped with a LX800 processor board, as well as, the option Input 2x Ethernet, can be extended without
modifying hardware. The extender is screwed to the bottom of the basis device with 4 screws and connected
to the logger with the cable 620-406.002 (here PR08, or 620-404.002 for PR03 and 620-405.002 for PR04).
Requirements
Data logger with LX800
Option Input 2x Ethernet (with respective port replicator)
free Ethernet input
IPEmotion + LOG-PlugIn ≥ 03.19 (Creation and configuration see ETH 01/02 port)
Advices
The bus inputs of the extender do not support WakeOnCAN and traffic acquisition.
Data is directly stored on the logger.
The maximum data rate is 100 Hz.
The configuration is extended by the additional file *.ecf (Extender Configuration File).
Logger_Manual_V03.51
IPETRONIK GmbH & Co. KG
ipetronik.com
102/ 123
Accessories
10.1.3 GPS receiver
GPS mouse for satellite positioning
Connection to the serial logger interface
Predefined settings of NMEA protocol configuration software
10.1.4 Bus isolator SAM-CAN-ISO
High ohm connection of hardware to vehicle
CAN
Electrical isolation between vehicle bus and
measurement system
Connection with short stub
Version “Hear only“ to avoid unintended influencing of vehicle CAN
SAM-ISO011-23A0
Has e1 approval (Vehicle Type Approval VCA) for
directly connecting with the CAN bus of public
vehicles without restricting the type approval.
10.1.5 iMIC
compact multifunction device (1.57 * 1.44 * 0.98 in) (40 * 36,5 * 25 mm)
Voice recording with audio input
good voice quality
illuminated trigger button
3 status LEDs (green, yellow, multicolor)
integrated buzzer
Button (illuminated)
Triggering of data recording and/or voice recording via digital input 1.
Status LEDs
LED Yellow
Indicates the status of digital output 2 (LED is on if output is active.)
LED Red
Indicates the status of digital output 3 (LED is on if output is active.)
LED Multicolor
green Indicates the status of digital output 1 (green light)
blue
Indicates the satus of the yellow LED (blue light)
red
Indicates the completed boot process. The excitation of the connected devices (at MCAN or SIM-CAN socket) is switched-on.
Buzzer
Acoustically indicates the status of digital output 3 (Buzzer ON if output is active).
The specific functions of the digital inputs and outputs are defined in the measurement
configuration (see Standard functions calculations, trigger, Use of digital inputs and outputs).
Logger_Manual_V03.51
IPETRONIK GmbH & Co. KG
ipetronik.com
103/ 123
Accessories
The button functionality, as well as, the LEDs and buzzer functionality also depends on the
wiring / PIN assignment. If another cable than 620-607.xxx is used, functionality can differ from
the one described above.
Cable 620-607.xxx
PIN assignment cable 620-607.xxx
Logger_Manual_V03.51
IPETRONIK GmbH & Co. KG
ipetronik.com
104/ 123
Accessories
10.2 Mechanical accessories
10.2.1 Module mounting
Dovetail adapter
Adapter plate for mounting to the right
M-LOG housing for connecting M
devices without tools.
Fastening elements
2 fastening strips for mounting
at the device bottom to screw MLOG to an even surface.
Snap-in fastener
2 snap-in holders + 2 fastening strips
for mounting at the device bottom to fix
M-LOG at an even plate without tools.
Snap-in adapter
Mounting plate to use a snap-in fastener to fix M-LOG to plate without tools.
Suction pad holder for M-VIEWfleet / M-VIEWgraph
Suction pad holder with pump for fixing driver display on smooth
surfaces e.g. at windshield.
Figures are
subject to
change!
Due to safety reasons, the bottom of the display housing must rest on an underlay (e.g.
instrument panel). Avoid a free mounting and do not use the suction pad holder alone for drive
tests.
Logger_Manual_V03.51
IPETRONIK GmbH & Co. KG
ipetronik.com
105/ 123
Appendix
11 Appendix
11.1 Cable connection and Pin assignment
11.1.1 M-LOG port replicators
Port replicator PR05 (4x Sub D 9, PWR-IN/REM Lemo 1B 6 pin)
Internal circuits PR05
+URemote I
+URemote I I
+UM-LOG
GND
Portreplikator
M-LOG Grund
8.4V/4.5A
CAP
10A/FF
M-POWER
2.5A MultiFuse
3.3V/1.2A
Modem Power
3V3
2.5A MultiFuse
GPS Power
5V/0.5A
0.3A MultiFuse
LOG
Power
5V0
0.3A MultiFuse
CAN1
5V/0.003A
0.3A MultiFuse
CAN2
PIC
0.3A MultiFuse
CAN3
0.3A MultiFuse
CAN4
0.1A MultiFuse
UBOUT(4x)
0.1A MultiFuse
LED Grün
0.1A MultiFuse
LED Gelb
0.1A MultiFuse
LED Rot
Cable reference PR05
Logger_Manual_V03.51
IPETRONIK GmbH & Co. KG
ipetronik.com
106/ 123
Appendix
PIN assignment PR05
Logger_Manual_V03.51
IPETRONIK GmbH & Co. KG
ipetronik.com
107/ 123
Appendix
Port replicator PR08 (4x Sub D 9, ETH, PWR-IN/REM Lemo 1B 6 pin)
PIN assignment PR08
Logger_Manual_V03.51
IPETRONIK GmbH & Co. KG
ipetronik.com
108/ 123
Appendix
11.1.2 FLEETlog
Logger_Manual_V03.51
IPETRONIK GmbH & Co. KG
ipetronik.com
109/ 123
Appendix
11.1.3 IPElog
Logger_Manual_V03.51
IPETRONIK GmbH & Co. KG
ipetronik.com
110/ 123
Appendix
11.2 Starting up
11.2.1 Overview Configuration & Measurement
Logger_Manual_V03.51
IPETRONIK GmbH & Co. KG
ipetronik.com
111/ 123
Appendix
11.2.2 Flow chart of the measuring process
Logger_Manual_V03.51
IPETRONIK GmbH & Co. KG
ipetronik.com
112/ 123
Appendix
11.3 Practical examples
11.3.1 Calculating memory footprint
The memory footprint per storage group results from the following data
Memory footprint of acquisition channels +
Memory footprint of time channel (relative and absolute time channel) +
Memory footprint of header (description file)
Memory footprint of acquisition channels
Acqu. duration [s] x storage rate [1/s] x channel count x 2 Byte = memory footprint in Byte
Memory footprint in Byte / 1024 = memory footprint in kByte
Memory footprint of time channel (IPE:Clock = relative time channel)
Acqu. duration [s] x storage rate [1/s] x 4 Byte = memory footprint in Byte
Memory footprint in Byte / 1024 = memory footprint in kByte
Do not mix the time channel (relative) with the time stamp channel (absolute = Date, time). The time stamp
channel is only recorded if activated in storage group dialog.
Memory footprint of header file
The memory footprint of the header file depends on the size of acquisition configuration (channel count,
sampling rate, different data formats, ...) and cannot be defined by a general formula. The size of the header
file is usually much smaller so that it can be neglected. Exceptations are short acquisitions or acquisitions
with many channels at low storage rate (< 1 Hz).
Logger_Manual_V03.51
IPETRONIK GmbH & Co. KG
ipetronik.com
113/ 123
Appendix
11.3.2 Linear signal scaling
The conversion of a raw value (binary value, e.g. in a CAN message) into a physical value (value with unit) is
effected with the scaling. IPETRONIK offers the scaling calculator and supports linear scaling with the line
equation as factor/offset or 2 point scaling.
The scaling of a voltage or current signal (sensor output) into a corresponding physical or percentage value
is effected in the same way. The following examples show the connections.
Mathematical basics for the linear equation
Point gradient form
y=m*x+b
b=y-m*x
Two points form
m = dy / dx
m = (y1 – y2) / (x1 – x2)
m = Gradient (gain)
b = constant (offset)
m = Gradient (gain)
Calculation and explanation
1. The linear equation y = m * x + b shows the mathematical connection.
2. Calculate the m gradient within any input range (signal) and the related output range (physical
value).
3. Calculate the offset b by using the x and y values for a known point.
4. Calculate, if required, further y values by using the corresponding x values and the equation, e.g. for
calculating the physical values for another input range (Channel min, max).
Logger_Manual_V03.51
IPETRONIK GmbH & Co. KG
ipetronik.com
114/ 123
Appendix
Example pressure sensor
A pressure sensor has an output signal of -0.5 to 4.5 V in the acquisition range 0 … 20 bar.
The voltage signal is converted to the physical value with the linear scaling.
x1
x2
y1
y2
m
b’
b
4.5
-0.5
20
0
4
2
2
Example CAN raw value in the Word unsigned format als temperature
A temperature signal is a CAN message in the Word unsigned format. The value range of 0… 65535 (16 Bit)
corresponds to a temperature range of -50 °C … +200 °C.
Please note that the output range has an offset of –50 °C. This must be respected at
calculating: (b’ = Offset without output offset, b = Offset + output offset).
x1
x2
y1
y2
m
b’
b
65535
0
200
-50
0.0038147
0
-50
Logger_Manual_V03.51
IPETRONIK GmbH & Co. KG
ipetronik.com
115/ 123
Appendix
Example CAN raw value in the Word signed format as temperature
A temperature signal is a CAN message in the Word signed format. The value range of -32768… 0 ... 32767
(16 Bit) corresponds to a temperature range of –50 °C … +200 °C.
Please note that the output range has an offset of –50 °C. This must be respected at
calculating: (b’ = Offset without output offset, b = Offset + output offset).
x1
x2
y1
y2
m
b’
b
32767
-32768
200
-50
0.0038147
125.0019
75.0019
Logger_Manual_V03.51
IPETRONIK GmbH & Co. KG
ipetronik.com
116/ 123
Appendix
11.4 Status messages
11.4.1 Most important status messages
Following message types are defined:
I
Information
W
Warning
E
Error
D
Debug
Type number: xxx-xxx-xxxx
Number corresponds to the number of the type plate of M-LOG (entry in hw_descr.xml).
Wait max. 3min for write permission (power good)
M-LOG waits until CAPs are loaded (status message "Power good" from PIC). If status is “Power good“, data
is written to flash. If this status is nor reached, (PIC) switches off M-LOG after 3 min.
Power good
Message (from PIC) that CAPs are loaded.
Debounce remote signal 1000 ms
Remote signal must be on at least for 1 s to reach “ON“ status. (Debouncing of remote signal)
Remote signal is detected as such if excitation > 6.5 V at PIN terminal:15 of PWR-IN/REM socket.
Watchdog active
PIC transfers control of M-LOG to TESTdrive.
Function:
Testdrive cyclically describes a storage range in Powermanagement (PIC) (toggling bit). If
this toggling fails for more than two minutes, M-LOG is switched off by Powermanagement
(PIC).
Free disk space: xxx/xxx
Indicates the available total memory space. TestDrive 3.09 shows a "Free disk space: xxxx" at the left
bottom display window. It shows the available space for data storage (40% of total memory space). Initially,
this value fluctuates intensively but stabilizes with a longer acquisition because it is recalculated
permanently.
Time left: xx xx:xx:xx
Display bottom left in monitor window. Meaning: d hh:mm:ss
Power bad
If excitation is too low, status is “Power bad“.
Info: This message is not concerned with CAPs contrary to "Power good" message.
Can`t initialize communication mediums
Dev_conf.xml is not included in Config, i.e. no data transfer activated.
Shutdown in 55 min
If data postprocessing (zipping, establishing, data transferring, data sending, etc.) is not completed within 55
min, Testdrive shuts down and data remains on logger.
Emergency shutdown in 60 min
Logger is unconditionally shut down after 60 min. Powermanagement of M-LOG controls the device.
Logger_Manual_V03.51
IPETRONIK GmbH & Co. KG
ipetronik.com
117/ 123
Appendix
Time left: xx xx:xx:xx
Display bottom left in monitor window. Meaning: d hh:mm:ss
Power bad
If excitation is too low, status is “Power bad“.
Info: This message is not concerned with CAPs contrary to "Power good" message.
Can`t initialize communication mediums
Dev_conf.xml is not included in Config, i.e. no data transfer activated.
Shutdown in 55 min
If data postprocessing (zipping, establishing, data transferring, data sending, etc.) is not completed within 55
min, Testdrive shuts down and data remains on logger.
Emergency shutdown in 60 min
Logger is unconditionally shut down after 60 min. Powermanagement of M-LOG controls the device.
11.4.2 Warning and error messages after program update
Program options without license
TESTdrive Version 3.17 includes a license software to check the use of logger / TESTdrive options. This
requires sending new license keys to the logger.
After a TESTdrive program update, potential warning messages can indicate locked options. TESTdrive
checks if used functions are really unlocked on the logger. Following warning is written into log file if e.g. all
inputs of a card with 4 CAN inputs is used but only 2 are unlocked.
01.04.2009 14:11:45 W CAN1 : Upper limit of licenced CAN interfaces reached. Max= 2
Please contact the sales team at +49 7221 / 9922 – 222 to assist you with warning and error messages, as
well as, licensing.
TESTdrive V03.22 deactivates the non-licensed functionality and warns with the red status LED
(temporarily at acquisition start). Depending on the missing license, acquisitions are limited
(e.g. possible calculations but no classification) or disabled (e.g. at missing license for
interface).
If an extender is used at the logger, an additional license for the extender is required!
The system shows the following warning if an extender is used with a non-licensed CCP protocol:
16.02.2011 15:36:01 E Extender.80200011: Error reading XML-Buffer at line 11
Logger_Manual_V03.51
IPETRONIK GmbH & Co. KG
ipetronik.com
118/ 123
Appendix
11.5 Description of TESTdrive files
TESTdrive provides the measurement files as zip archives. TESTdrive creates separate zip files for every
acquisition:
MEA_xxxx.zip (Acquisition data + header file + current configuration)
LOG_xxxx.zip (Protocol file for data acquisition)
A data set of an acquisition always includes a header file (AABBCCC.DAT), at least one acquisition file in
DIAdem format, as well as, the corresponding acquisition configuration (e.g. IPEmotion.isf).
The names of the single acquisition files are generated according to
the AABBCCCC.DDD structure:
AA
=
Data type
BB
=
Consecutive number within a data type
CCCC
=
Consecutive number of an acquisition
After reaching the consecutive file
number 9999 (CCCC), counting starts
again with 0001!
If the file with this number still exists, it
is overwritten with new data!
DDD
=
File extension
AA data type indicates the type of data:
DO
=
Data Online (storage group with time channel)
PM
=
Post Mortem data of a ring buffer group (storage group with time channel)
CO
=
(C) Classification Online (storage group with statistic data, without time reference)
A0
=
Audio Online
V0
=
Video Online
J
=
Job data = Diagnostic data
ST
=
Min-Max list
TBQS, T
=
CAN/LIN traffic acquisition (during or after boot process)
MV
=
Maneuver recording
The consecutive BB number clearly assigns data within one data type. Several storage groups for instance
can be detected with real-time data, which are distinguished from each other by this number.
The consecutive CCCC number differentiates between single acquisitions. Each acquisition is therefore
clearly defined.
The DDD file extension defines the data format as follows:
DAT
=
DIAdem header file
T64
=
DIAdem time channel with 64 bit resolution
W8
=
DIAdem data with 8 bit unsigned (BYTE)
W16
=
DIAdem data with 16 bit unsigned (WORD)
W32
=
DIAdem data with 32 bit unsigned (WORD)
I16
=
DIAdem data with 16 bit signed (INTEGER)
I32
=
DIAdem data with 32 bit signed (INTEGER)
R32
=
DIAdem data with 32 bit in floating point displaying (REAL)
R64
=
DIAdem data with 64 bit in floating point displaying (REAL)
WAV
=
Audio file in WAV format
AVI
=
Video file in AVI format
CSV
=
Comma Separated Values
Jxx
=
Binary file with job result
Logger_Manual_V03.51
IPETRONIK GmbH & Co. KG
ipetronik.com
119/ 123
Appendix
Recorded signals are divided into different files accordingly to data typet, i.e. all 8 bit signals unsigned are in
a *.W8 file, all 32 bit signals signed in a *.I32 Datei, etc.
Important advices:
TESTdrive defines the number of the storage group during the initialization process. An assignment of the
storage group number to the order in the configuration interface is not given.
All information of a storage group is stored in the DAT file. The DAT file has a 8 bit ASCII format (ANSI code
page 1252, ISO 8859-1).
The storage group name can be defined with IPEmotion and is also stored in the DAT file.
All project information are stored in the DAT file (vehicle no., project name, etc.). At working with
classifications, the DAT file contains additional fields to define the classification in detail.
11.5.1 Data types
Time-related data (Storage group)
The header file and the corresponding data files are created for every storage group (= signals with common
storage rate).
Example (Acquisition no. 699 > DOBBCCCC.DDD)
Storage group 1
Storage group 2
Storage group x
DO010699.DAT
Header
DO010699.R32
32 Bit (Real)
DO010699.W16
16 Bit (Word unsigned)
DO010699.W32
32 Bit (Word unsigned)
DO020699.DAT
Header
DO020699.W8
8 Bit (Byte unsigned)
DO020699.W32
32 Bit (Word unsigned)
DO0x0699.DAT Header
DO0x0699.W8
16 Bit (Word unsigned)
Statistics
TESTdrive saves classification data in DIAdem format, which includes all parameters in one header file. This
header file includes additional information about classification description. Corresponding to the storage
groups and the general DIAdem conventions, binary data is included in the same files. These files are
separated accordingly to data type and are defined by an extension corresponding to data type, e.g. *.W32,
*.R64.
The results of several classifications of the same data type are stored in one binary file. Most classification
types create results of the W32 data type. The retention time classification can create different data types.
Example (Acquisition no. 699 > COBBCCCC.DDD)
Header
CO010699.DAT
Classification m … n CO010699.W32
CO010699.R64
Logger_Manual_V03.51
Header
32 Bit (Word unsigned), can include several
classifications
64 Bit (Real), can include several classifications
IPETRONIK GmbH & Co. KG
ipetronik.com
120/ 123
Appendix
Audio recording
A DIAdem acquisition and one or several audio files (WAV format) are created with an audio recording.
The DIAdem acquisition contains the trigger event, the WAV file includes the audio data.
Every audio file is assigned to one triggering event. The names of the audio files include the counter value of
the trigger channel to create a direct reference within the acquisition data. The respective audio file is
recorded for the time of an activated trigger.
Example DIAdem file (Acquisition no. 699 > A000CCCC.DDD)
Trigger channel
A0000699.DAT
Header
A0000699.W16
16 Bit (Word unsigned)
Example audio file (Acquisition no. 699 > ABBBCCCC.WAV)
Audio sequence 1
A0010699.WAV
Audio data of 1. trigger event
Audio sequence 2
A0020699.WAV
Audio data of 2. trigger event
Audio sequence x
A00x0699.WAV
Audio data of 3. trigger event
Video recording
A DIAdem acquisition and one or several video files (JPG = single image or AVI = video sequence) are
created with an video recording.
The DIAdem acquisition contains the trigger event, the JPG or AVI file includes the video data.
Every video file is assigned to one triggering event. The names of the video files include the counter value of
the trigger channel to create a direct reference within the acquisition data. The respective video file is
recorded for the time of an activated trigger. Exactly one single image is saved per trigger event,
independent of the trigger duration.
Example DIAdem file (Acquisition no. 699 > V000CCCC.DDD)
Trigger channel 1 (Video)
V0000699.DAT
Header
V0000699.W16
16 Bit (Word unsigned)
I0000699.DAT
Header
I0000699.W16
16 Bit (Word unsigned)
or
Trigger channel 1 (Image)
Example video file (Acquisition no. 699 > VBBBCCCC.AVI)
Video sequence 1
V0010699.AVI
Video data
Video sequence 2
V0020699.AVI
Video data
Image 1
I0010699.JPG
Image data
Image 2
I0020699.JPG
Image data
or
Logger_Manual_V03.51
IPETRONIK GmbH & Co. KG
ipetronik.com
121/ 123
Appendix
Diagnostic acquisition
Error memory and non-recurring data
TESTdrive creates additional files for error memory and non-recurring data. This CSV file (BDJDcccc.CSV)
is an overview and includes all information about the completed jobs. Every successful job is saved in a
binary file (BDS1cccc.Jxx), which contains the actual data.
A CSV file**, as well as, the corresponding jobs are created after the completed acquisition of UDS services.
** A CSV file is only created in binary mode, not in trace modeT.
The names of the single acquisition files are generated according to BDPECCCC.DZZ structure:
BDPECCCC.DZZ
with P = U (UDS protocol), P = K (KWP protocol)
BDPECCCC.DZZ
with E = ECU number (1 ... 9)
BDPECCCC.DZZ
with D = J (Job or binary file), D = T (Trace file)
BDPECCCC.DZZ
with ZZ = Job number (01 ... 99)
Beispiel non-recurring data (Acquisition no. 699 > BDPECCCC.DZZ)
Trace file
BDU10699.T01
UDS protocol, ECU no. 1, Acquisition no. 699, Job no. 1
Binary file
BDU10699.J01
UDS protocol, ECU no. 1, Acquisition no. 699, Job no. 1
CSV file
BDJD0699.CSV
Job overview of binary files
Measurement status file
Measurement status file in XML format offers information about the process of a completed acquisition. This
includes:
- Acquisition start and stop (… in standardized XML format “DataTime”)
- General system information (hardware, TESTdrive version,…)
- Storage group trigger
- Acquisition / Diagnosis information
- Limit violations
- Maneuver detection
Measurement status file is created after acquisition stop and is stored in the zip container of the acquisition
(MEA_xxxx.zip) or attached to the status e-mail if this file creation has previously been activated in
IPEmotion Options > PlugIns > IPETRONIK LOG > PlugIn specific settings > Options > General >
Create measurement status file.
Example Measurement status file (measurement number 699 > MSxxyyyy.xml)
xx = Append number, yyyy = Measurement number
Measurement status file 1
MS010699.xml
Messstatus status file 2
MS020699.xml
If an acquisition is later continued (Append mode), TESTdrive increases the append number in the file name.
Logger_Manual_V03.51
IPETRONIK GmbH & Co. KG
ipetronik.com
122/ 123
Appendix
Min-Max list (STG file)
TESTdrive creates a separate file (STG file) to record minimum and maximum values of selected signals.
Example STG file (Acquisition no. 699 > STBBCCCC.STG)
STG file 1
ST010699.STG
Min / Max data of storage / process group 1
STG file 2
ST020699.STG
Min / Max data of storage / process group 2
Traffic recording (CAN, LIN)
TESTdrive saves traffic acquisitions in binary format. A traffic acquisition can include two binary files:
- Traffic data recorded by TESTdrive during boot time
- Traffic data recorded by TESTdrive during run time
Advice: Storage of CAN traffic data and LIN traffic data in the same file
The names of the single acquisition files are generated according to TBBBCCCC.BIN structure:
TBBBCCCC.BIN
Traffic data recorded by TESTdrive
TBBBCCCC.BIN
Consecutive number within an acquisition
TBQSCCCC.BIN
Traffic data recorded by micro controller
Maneuver recording
TESTdrive creates a file in ASCII format for maneuver recordings.
The maneuver file functions like a storage group, i.e. the file receives a consecutive number within the
acquisition.
The names of the single acquisition files are generated according to MVBBCCCC.ASC structure:
MVBBCCCC.ASC
Name of respective storage group
Example (Acquisition no. 699 > MVBBCCCC.ASC)
Storage group 1
Storage group 2
Maneuver file
Logger_Manual_V03.51
DO010699.DAT
Header
DO010699.I16
16 Bit (Integer signed)
DO020699.DAT
Header
DO020699.R32
32 Bit (Real)
MV030699.ASC
IPETRONIK GmbH & Co. KG
ipetronik.com
123/ 123