1
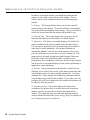
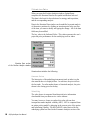
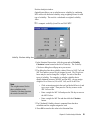
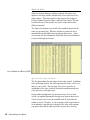
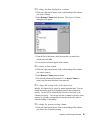
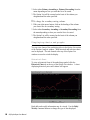
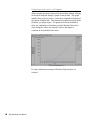
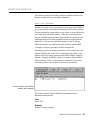
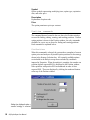
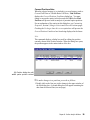
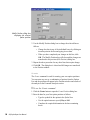
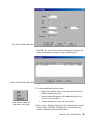
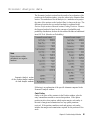
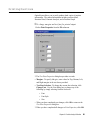
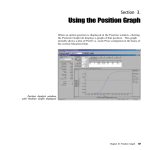
Chapter III Using OptionExpert 13 14 AIQ OptionExpert User Manual Section 1. Using the Position Analysis Window The Position Analysis window provides access to powerful and easyto-use tools for the selection, analysis, and evaluation of option positions. You can do as little as specify a stock or index and OptionExpert will select the optimum strategy and best position for you. Or, you can choose your own strategy and/or position by analyzing and evaluating various options using the analytical tools of the system. To help you decide which stock or index you want to view for option trading possibilities, Position Analysis provides access to both realtime and historical charts and, as with the option pricing information, all data retrieval takes place automatically in the background through your internet data service connection. Whether you or the system does the selecting, the Position Analysis window is where analysis and evaluation take place. Chapter III: Position Analysis Window 15 Beginning the Analysis To begin the analysis, you first specify a ticker symbol. The current market date is shown in the box to the right of the symbol box. When the Position Analysis window opens, options are retrieved for the ticker currently shown in the symbol box. Other information pertaining to the symbol is also retrieved including Current Price, Volatility, Call and Put MIV, and Put/Call Ratio. OptionExpert Toolbar Symbol list box Date box Position Analysis button Trackers button 1. Enter a symbol To enter a symbol, click an insertion point in the toolbar list box and type the symbol. This symbol represents the optionable stock or index that is the underlying instrument for the options that you will be analyzing and evaluating. Once entered, symbols are stored in a list that can be used to quickly retrieve frequently analyzed symbols. Simply click the arrow on the list box to display the list and select the symbol you want. You may also use this list to change the symbol with the Position Analysis window open. To change the symbol, select another symbol from the list box on the toolbar and press Enter. 2. Display the Position Analysis window To open the Position Analysis window, simply click the Position Analysis toolbar button. This button is located just to the right of the date box on the toolbar. The Position Analysis function requires that data must be downloaded off the internet. Since the downloading can take a few minutes to complete, a Download Progress box is displayed during the process. This box shows five items, each of which is a separate download. To keep you aware of the progress, each item is checked off as its download is completed. 16 AIQ OptionExpert User Manual When the Position Analysis window opens, the data that is displayed is determined by the entry in the symbol box on the toolbar. An example of the Position Analysis Window for a specific date is shown. The option data displayed is for the S&P 500 index (ticker symbol SPX) on 09/20/99 (market date). OptionExpert screen with Position Analysis window displayed Chapter III: Position Analysis Window 17 Explanation of Position Analysis window In order to use Position Analysis, you should first understand the purpose of each of the various sections of the window. The five sections, which will be explained in detail on the following pages, include: 1) Strategy. The Strategy list box allows you to select a specific option strategy for the analysis. The system will then recommend the best option positions to implement that strategy. Also, you can choose to have the system select both the strategy and position for you. 2) Situation Data. This section displays the current price for the ticker and other data used in the analysis of available options. 3) Option List. The Option List initially displays a list of all of the options available for the selected symbol on the date shown above. For each option, bid and ask prices are listed along with a number of other items of useful information. All real-time information is dynamically updated. If the list exceeds the capacity of the screen, you can use the arrows or cursor bar to view the complete list. This same section is also used for displaying both Historical Charts and Real Time Charts of the underlying symbol. In addition, once positions have been computed or created, the Position Graph function may be used to view graphical displays of how position profitability is impacted by various parameters. 4) Position. Once positions have been selected or created, they are displayed one at a time in this section. If the analysis finds more than one profitable position, the most profitable position (Pos 1) is always displayed first. Other positions are displayed by clicking the buttons arrayed along the top of the Position window. If you create your own positions, they will also be displayed in this window and a button will be added for each new position. 5) Economic Analysis. This section displays the results of the evaluation of the position that is currently selected in the position window, given the situation data as listed in the Situation Data window. The results may also vary somewhat depending upon the Analysis Method selected in the Option Strategy Properties dialog box (see Customizing Properties, Section 5). 18 AIQ OptionExpert User Manual Strategy List Position section with position shown in Position window Situation Data Economic Analysis Option List Strategy List The Strategy list box allows you to limit the selection process to a single option strategy, and the system will recommend the best option positions to implement that strategy. Also, you can ask the system to limit the selection to bullish or bearish strategies only or you can choose to have the system select both the strategy and position for you. See Section 2. Strategies menu Chapter III: Position Analysis Window 19 Situation Data When you open the Position Analysis window, OptionExpert completes the Situation Data for the symbol and the date selected. This data is the basis for the selection of a strategy and/or position, and the corresponding analysis. Data in the Situation Data window can be modified to permit analysis of alternative positions by clicking an insertion point in the text box of the item you want to modify and typing the change. All of the data fields may be modified. The key value is the Indicated Value. This value represents the user's projected price performance for the underlying stock or index. Situation Data section of the Position Analysis window Situation data includes the following: Current Price The latest price of the underlying instrument (stock or index) on the date entered above is displayed here. In real-time, the price reflects the last trade. For after market hours or historical analysis, the price shown is the closing price for the day. Volatility The value shown is computed from historical price information downloaded from your data service via the internet. You may, however, choose to replace this value with one that incorporates market implied volatility (MIV). MIV is computed from an option pricing model by plugging in the current price of the option and calculating volatility. Put and Call MIV values derived for the underlying symbol are listed in the Economic Analysis section of the 20 AIQ OptionExpert User Manual Position Analysis window. OptionExpert allows you to calculate a new volatility by combining MIV values with historical volatility using weighting factors for each type of volatility. The result is a calculated or weighted volatility value. å To compute volatility from Put and Call MIV: Volatility Calculator dialog box 1. In the Situation Data section, click the green and red Volatility Calculator button located to the left of Volatility. The Volatility Calculator dialog box will pop on to your screen. 2. The dialog box lists three volatility values (Historical, MIV Call, and MIV Put) and the current Weight assigned to each. The Weight text boxes may be used to change the weights for each of the three types of volatility. For example, to calculate volatility that is equally balanced between Call MIV and Put MIV, you can assign weights of 0 to Historical, 50 to MIV Call, and 50 to MIV Put. Note The weights entered for the three volatilities in the Volatility Calculator function do not need to total 100. Click an insertion point in the text box labeled Historical and type a new weight. Then press the Tab key to move to the MIV Call text box. Enter a weight for MIV Call and press the Tab key to move to the MIV Put box. Enter a weight for MIV Put and then click the Calculate button. 3. The Calculated Volatility shown is computed from the three volatilities and the weights assigned to each. 4. Press OK to transfer this value to the Situation Data. Chapter III: Position Analysis Window 21 Interest Rate The interest rate shown is dependent on the option selected in Option Strategy Properties, Interest Rate tab. If the Symbol option is selected in the Interest Rate page, a symbol must be entered and the rate shown is the current rate for this symbol. This is typically a risk-free interest rate such as the yield on 90-day Treasury Bills. Properties also gives you the option of entering a fixed interest rate value. To modify the default interest rate, see Customizing Properties, Section 5. Dividend Dividend is the current annual dividend for the stock. This value is also obtained through your internet data service. Analysis Date The analysis date is the date in the future when the options being considered will be evaluated. This date automatically is set to next option expiration day and it is assumed that the position will be cleared at this time. Please Note 10-Day Limit: Only those options that expire more than 10 trading days from the current date are included in the option selection process. If you wish to override this 10-day limit, select Time on the Open Interest, Time, Volume Screening page of Option Screening Properties and enter a value in the Minimum (days) text box. (See Customizing Properties, Section 5.) Indicated Value Note If you enter an Indicated Value that is more than 30% above or below the current price, a warning box will appear. 22 AIQ OptionExpert User Manual The Indicated Value is the projected price for the underlying instrument on the analysis date. In option analysis, it is commonly assumed that stock market returns are distributed by lognormal distribution. This assumption is the basis for the Black-Scholes model and, therefore, the Indicated Value is assumed to be the mean of a lognormal distribution. The Indicated Value that appears when the Position Analysis window initially opens is computed by OptionExpert based on several factors. These factors include the current short-term direction of price and the current Situation Data values for Current Price, Volatility, and Analysis Date. The formula for the computation of Indicated Value is detailed in the Appendix. This formula is based on Lawrence McMillan's formula for upward and downward stock potential as described in the 3rd edition of his book Options as a Strategic Investment. Those users who prefer to use their own forecast of Indicated Value can simply type a new value in the Indicated Value data box. Position Capital Capital is maximum amount of money that the user wishes to make available for any one position. Capital is entered in Option Strategy Properties (Capital/Breakeven tab). You can modify the default figure for Capital ($5,000) in the Properties function. (See Customizing Properties, Section 5.) Chapter III: Position Analysis Window 23 Option List When the Position Analysis window is opened, the Option List appears in the large window located in the lower right area of the main window. This same window is also used for the display of Position Graphs, Historical Charts, and Real Time Charts. The tabs located at the top of this window are used to switch between the different functions. The Option List displays a list of all of the available options for the ticker you are analyzing. When the window is opened, the list is automatically downloaded from your internet data service. After a few seconds, the data columns are filled with data as the information is retrieved through the internet. List of Options for IBM on 8/10/99 Option List data columns The first data column for each option is the ticker symbol. In addition to the underlying symbol, this code represents the month, strike price, and type (put or call). The next item, Description, provides an explanation of the code, concisely listing the expiration month and year, strike price, and option type. During market trading hours, the next three items, bid, ask, and volume, are updated dynamically through your internet data service. Values for open interest are not available until 24 hours after the market is closed. Therefore, if you are going to follow open interest as an indicator of possible price changes in the value of the options, you must realize that the data represents the prior days activity. 24 AIQ OptionExpert User Manual The final five items are computed by OptionExpert based on the Black-Scholes model, and are explained below. Theoretical Value (Value) This value, sometimes called fair value and sometimes normal value, is the reasonable price one expects an option to trade at under a given set of conditions. OptionExpert uses the Black-Scholes mathematical formulas for computing this theoretical value. Factors taken into consideration in computing the value are time to expiration, volatility, interest rates, dividends, and stock price, all of which influence option prices to differing degrees. Percentage (%) This element is the percentage of market price to the theoretical value. You should look for values here that are less than 100, which means that the current market price for the option is less than the theoretical value. A value less than 100 would indicate a possible bargain. Delta Delta is the amount that you can expect the value of the option to change with one unit change in the stock price. A unit, in the case of stock options, is one dollar. The value for delta will decrease for calls as the strike prices increase above the current market value. For puts, the reverse is true. Gamma (G...) Gamma is the expected change in the value for Delta, given a one unit change in the stock price. Market Implied Volatility (MIV) It should be noted here that Market Implied Volatility (MIV) applies to the underlying ticker, and not the options. Nevertheless, the Market Implied Volatility is computed for puts and calls because the experienced option trader will use the difference between MIVs for puts and calls, and the difference between the Market Implied Volatility and the published stock volatility as additional indicators for direction and extent of price movement for an option. Chapter III: Position Analysis Window 25 Customizing the Option List grid A special right-mouse click menu provides the ability to easily modify the Option List grid by inserting, renaming, or removing data columns. You can also specify columns used for both primary and secondary sorting of the list. To display the menu, click on one of the column headings with the right mouse button. Right Mouse Click Menu å To add a new data column: 1. With your right mouse button, click on the heading of the column where you want the new column to be inserted. 2. Select Insert Column from the menu. The Show Columns dialog box will appear. Show Columns dialog box 3. From the list of data items, select the data item that you want shown in the new column and click OK. 4. A new column containing the selected data item will appear immediately to the right of the column you originally clicked with the right mouse button. 26 AIQ OptionExpert User Manual å To change the data displayed in a column: 1. With your right mouse button, click on the heading of the column you want to change. 2. Select Rename Column from the menu. The Replace Columns dialog box will appear. 3. From the list of data items, select the item that you want in the column and click OK. 4. Your selection will now appear in this column. å To remove a data column: 1. With your right mouse button, click on the heading of the column you want to remove. 2. Select Remove Column from the menu. 3. The selected column will be removed. Use Insert Column to restore any data items that have been removed. å To change the sorting order of the Option List: Initially, the Option List is sorted by option expiration date. You can change the sorting order by designating specific data columns for sorting. The list will be automatically resorted on the basis of the column you specify. You can specify that a column be used for either primary or secondary sorting and you can specify that the order be either ascending or descending. å To change the primary sorting column: 1. With your right mouse button, click on the heading of the column you want to use for primary sorting. Chapter III: Position Analysis Window 27 2. Select either Primary Ascending or Primary Descending from the menu depending on how you want the list to be sorted. 3. The Option List will be resorted on the basis of the column you designated and the order specified. å To change the secondary sorting column: 1. With your right mouse button, click on the heading of the column you want to use for secondary sorting. 2. Select either Secondary Ascending or Secondary Descending from the menu depending on how you want the list to be sorted. 3. The Option List will be resorted on the basis of the column you designated and the order specified. Displaying charts and graphs You can view charts of the underlying ticker in the Option List section of the Position Analysis window. Both historical and real-time charts can be displayed. The tabs located at the top of the Option List window are used to switch the display. Historical Chart To view an historical chart of the underlying symbol, click the Historical Chart tab at the top of the Option List window. A chart displaying historical prices and volume will appear. Both daily and weekly information may be viewed. Use the Daily/ Weekly command buttons to change the type of data displayed. 28 AIQ OptionExpert User Manual The data and price values at the top of the chart correspond to the current position of the movable cursor line. To view close, high, low, and open prices on a specific date, move the cursor line to the date using the left and right arrows or the slider button at the base of the window. Real Time Chart To display a real-time chart of the underlying symbol, click the Real Time Chart tab at the top of the Option List window. A chart displaying real time prices and volume will appear. You can select the interval of time that the price bars represent. Use the command buttons to change the price data between 1 min., 5 min., 15 min., 30 min., and 1 hour intervals. The data, time and price values at the top of the chart correspond to the current position of the movable cursor line. To view close, high, low, and open prices for a specific time, move the cursor line to the time using the left and right arrows or the slider button at the base of the window. Chapter III: Position Analysis Window 29 Displaying Position Graphs When an option position is displayed in the Position window, clicking the Position Graph tab displays a graph of that position. This graph initially shows a plot of profit vs. stock price computed on the basis of the current Situation Data. This function is designed to provide all the flexibility you might require. The graph can be easily modified to show any combination of parameters and the Situation Data can be easily changed to allow you to quickly observe the impact of variations in the individual data values. For more information on using the Position Graph function, see Section 3. 30 AIQ OptionExpert User Manual Position section The Position section of the Position Analysis window consists of the Position window and a set of position commands. Position window Whether you create your own positions or the system selects them for you, your positions are displayed individually in the Position window. For each position the system selects or you create, a tab is added to the row of tabs at the top of the window. When the system finds more than one profitable option position (expected ROI is positive) for the conditions imposed, the most profitable position is assigned the tab labeled Pos 1, the next most profitable position is Pos 2, and any additional positions are numbered in order based on expected ROI. To display a position, you simply click the assigned tab. The strategy type for the displayed position is shown at the top of the window following the word Position. Simple strategies (Buy or Sell Option) consist of a single option position while complex strategies (Spreads, Strangles, Straddles) consist of as many as three different option positions. If the overall position is comprised of more than one option position, each position is listed as a separate line. Position section with Position window and commands The Position window lists the following information for each individual option position: Type Buy or Sell. Quantity Number of option contracts. Chapter III: Position Analysis Window 31 Symbol Option symbol representing underlying issue, option type, expiration date, and strike price. Description Explanation of option code. Price The option premium or price per contract. Position commands The command buttons located in the row above the Position window are used for finding, editing, creating, and tracking positions. Until an option position is shown in the Position window, the only commands available for you to use are those for finding and creating positions. Each command is explained below. Find Positions When this command is selected, the system takes a snapshot of current option prices and analyzes all possible option positions for the strategy shown in the Strategy Selection box. All currently available options are included in the analysis except those excluded by conditions imposed in Properties. When the analysis is complete, the number one position (highest expected ROI) is displayed in the Position window. Other positions with positive ROI are numbered in order of their expected ROI. These are displayed by clicking the numbered buttons at the top of the Position window. Dialog box displayed when a covered strategy is selected 32 AIQ OptionExpert User Manual Covered Positions Note: When the selected strategy is (or includes) a covered strategy such as Covered Call Write or Variable Ratio Call Write, Find Positions displays the Covered Positions Conditions dialog box. You must change or accept the entries in this box and click OK before Find Positions will proceed with its analysis of potential option positions. For an explanation of the entries in this dialog box, see Customizing Properties, Section 5, Margin Criteria and Covered Positions pages. Checking the No longer show this screen option box will prevent the Covered Position Conditions box from being displayed in the future. Edit This command displays a dialog box used for editing the position currently shown in the Position window. When the dialog box opens, the position appears in the main window of the box. Edit Position dialog box with middle option position selected å To make changes to a position, proceed as follows: 1. Double click on the line you wish to change in the upper window of the Edit dialog box. A second dialog box will appear containing the data from the selected line (see next page). Chapter III: Position Analysis Window 33 Modify Position dialog box displaying the selected option position 2. Use the Modify Position dialog box to change the selected line as follows: Change the data in any of the individual boxes by clicking an insertion point in the box and typing in new data. When you have completed your changes to this line, click OK. The Modify Position box will close and the changes are transferred to the previous (Edit Position) dialog box. 3. Repeat the above procedure for any other lines that require change. 4. Click OK. The dialog box is closed and all changes are transferred to the Position window. Create The Create command is used for creating your own option positions. You can enter any one or a combination of options from the Option List and the position will appear in the Position window and results of the analysis in the Economic Analysis section. å To use the Create command: 1. Click the Create button to open the Create Position dialog box. 2. Enter the data for your first option position as follows: Type the symbol for the option in the Symbol box. Use the option buttons to specify Buy or Sell. Complete the required information in the three remaining boxes. 34 AIQ OptionExpert User Manual First Create Position dialog box 3. Click OK. The second Create Positions dialog box will appear and display the information entered in the previous dialog box. Second Create Position dialog box 4. To create an additional option position: Right mouse click anywhere in the white space in the main window to display the menu. From the menu that appears, select Add to display the first Create Position dialog box. Create Position dialog box right mouse click menu Use this dialog box to create your next position. 5. When you have finished creating all of the option positions required for the strategy, click OK. The dialog box is closed and the new position is transferred to the Position window. Chapter III: Position Analysis Window 35 Track When the Track command is selected, a small tracking window is created for the position shown in the Position window. This window displays the current profit or loss from the position along with the last prices for the option(s) and the underlying ticker. See Section 4 for information on tracking positions. 36 AIQ OptionExpert User Manual Economic Analysis data The Economic Analysis section lists the results of an evaluation of the position in the Position window, given the values in the Situation Data section. The method used for the analysis (i.e., method used to project the value of the options on the Analysis Date) is shown at the top. The differences between the two analysis methods is explained in the Position Profit section of the next section, Finding Positions. Because the Expected method is based on the concepts of probability and probability distribution, the data for this method includes an additional item, B/E Prob. (Break-even Probability). Note Figures shown within parenthesis are negative numbers. Economic Analysis section of the Position Analysis window for both Analysis methods Following is an explanation of the specific elements computed in the Economic Analysis window. Cash Outlay Outlay is the price of the contracts in the Position window, plus the entry commissions needed to execute that position. If the option position involves short options which require margin, cash outlay is the total of margin and commissions less any option premiums received. If the position combines stock and options, cash outlay includes the margin and commissions required for the purchase of the stock. Chapter III: Position Analysis Window 37 Margin Requirement If margin is required, the amount is shown here. Margin for short options is calculated using the Options Initial Margin % value entered in the Margin Criteria page of Broker/Margin Properties. Margin for stock positions is calculated using the Initial Margin % values for long and short stock, also entered in Broker/Margin Properties. You can modify the default value for Margin see Customizing Properties, Section 5. Commissions The commissions field displays the total commissions for both entering and exiting that position. Commissions are computed using the commission schedule selected on the Profile tab of Broker/Margin Properties see Customizing Properties, Section 5. Total Investment For positions where stock is not involved, Total Investment is cash outlay less commissions. When stock is involved, Total Investment includes the full value of the stock position rather than the margin requirement. Additional Maintenance Additional Maintenance is any additional margin, called maintenance margin, that is required when a position moves against you. For short options, the amount of additional maintenance is calculated using the Options Maintenance Margin % value entered in the Margin Criteria page of Broker/Margin Properties. For stock, the amount of additional maintenance is calculated using the Long and Short Maintenance Margin % values, which are also entered in the Margin Criteria page of Broker/Margin Properties. You can modify the default Margin figures (see Customizing Properties, Section 5). OptionExpert also gives you the option of excluding Additional Maintenance from Cash Outlay (see the Margin Criteria page of Properties). Receipts Receipts is the expected revenue for the alternative stock and option prices, less exit commissions. Profit Profit is receipts less the outlay. See Position Profit in next section for further explanation. 38 AIQ OptionExpert User Manual Position ROI and Cash ROI (Return on Investment) ROI (return on investment) is equal to the profit divided by the outlay times 100. Position ROI is derived using Total Investment as the outlay. For Cash ROI, Cash Outlay less Commissions is used as the outlay. Delta Delta shows the change in the value of the position from a one unit ($1.00) change in the price of the stock. Maximum Loss This is the maximum loss possible, excluding the possibility of an early exit from the position, if the market moves against the position. If there is a single option in the position, the maximum loss would be about the same as the outlay. In other words, the outlay is the actual maximum loss. In the case of a spread, the Maximum Loss will be somewhat different from the outlay because the options that comprise the spread move in different directions in reaction to a change in the price of the stock. For the Expected analysis method, Maximum Loss is computed based on probability distribution (see Expected Profit Defined in Section 2). Break-even Probability (B/E Prob) For the Expected analysis method, the probability of the position breaking even is computed. Using the Indicated Value as the expected value, and placing the lognormal distribution around that value, the economic impact of each alternative value of the underlying stock are evaluated. From this, the probability of exiting the position on the analysis date with at least a zero or a positive gain is computed. No value less than the minimum Break-even Probability figure entered in Properties will be accepted when the system is selecting a position using the Expected method of analysis. You can modify the default value for Break-even Probability in the Properties function (See Customizing Properties, Section 5). Call MIV and Put MIV (Market Implied Volatility) Call MIV and Put MIV is the market implied volatility for the stock computed by the calls, and then by the puts, and weighted by the volume, or the number of options at each strike price. Chapter III: Position Analysis Window 39 Put/Call Ratio The Put/Call Ratio is a contrarian indicator. The PCR value is equal to the volume or the number of puts on a given day divided by the number of calls, and in turn divided by the 10-day exponentially smoothed average of the same indicator multiplied by 100. As a contrarian indicator, the PCR says that when the puts greatly outnumber the calls, the market is reaching a bottom. Hence, a number around 200 would be a bullish signal, and a number around 50 would be a bearish signal. The PCR indicator is a popular indicator in option trading and it is included for the convenience of the user. 40 AIQ OptionExpert User Manual Printing Positions OptionExpert allows you to easily produce hard copies of position information. The printed information includes position detail, Situation Data, Economic Analysis, and a Position Graph. å To change margins and text font for printed output: 1. Select Print Properties from the File submenu. 2. The Text Print Properties dialog box provides two tabs: Margins - To specify Margins, enter values for Top, Bottom, Left, and Right margins in the text boxes provided. Text Font Selection - To change the current font selection, click Change Font. Use the Font dialog box to change any of the following by simply selecting from the list boxes: Font Font Style Size When you have completed your changes, click OK to return to the Text Print Properties dialog box. 3. When you have completed all changes to Print Properties, click OK. Chapter III: Position Analysis Window 41 å To print position information: 1. The position you want to print must be selected in the Position section of the Position Analysis window. Positions are selected by clicking the numbered tabs in the Position window. 2. Printing reproduces the currently displayed Position Graph. To verify that the current graph settings are correct, display the Position Graph (click Position Graph command above large lower window). Make any changes to graph settings before printing. 3. To print the selected position, select Print Position from the File submenu. Printed position information 42 AIQ OptionExpert User Manual