1
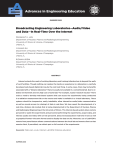
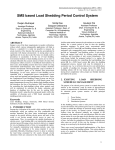
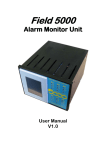
Nuclear Engineering and Design 237 (2007) 1185–1194
A web-based nuclear simulator using RELAP5 and LabVIEW
K.D. Kim a,∗ , Rizwan-uddin b
a
b
Korea Atomic Energy Research Institute (KAERI), Dukjin 150, Yusung, 305-353 Taejon, Republic of Korea
University of Illinois at Urbana-Champaign (UIUC), Department of Nuclear, Plasma and Radiological Engineering,
103 S. Goodwin Ave., Urbana, IL 61801, USA
Received 20 September 2006; received in revised form 7 January 2007; accepted 8 January 2007
Abstract
A web-based nuclear reactor simulator has been developed using the best-estimate nuclear system analysis code RELAP5 as its engine, and
LabVIEW for graphical user interface and web-casting. Simulator retains the accuracy of the best-estimate code. Results are displayed in user
friendly graphical format. Color-coded nominal values are displayed along with the current status of different variables in tab activated windows.
Some variables of interest are also shown as a function of time. All graphical outputs are displayed in web browsers making the simulator’s front
end independent of the operating system. The interactive simulation feature allows the users to simulate specific reactor transients – such as LOCA,
scram, etc. – using a single click. Simulator’s graphical output can be web-casted and is thus available to anybody with access to the web. Moreover,
if permitted, the simulator can be operated remotely from another site connected to the server via the World Wide Web.
© 2007 Elsevier B.V. All rights reserved.
1. Introduction
Large system analysis computer codes such as RELAP5 (US
NRC, December 2001), RETRAN (Computer Simulation &
Analysis, 2001), TRAC-M (US NRC, April 2001), CATHARE
(Farvaque, 1992), MARS (Jeong et al., 1999), etc. have played
an important role in evaluating nuclear reactor systems for a
wide range of planned and accidental conditions. Most of these
codes required high performance computers to simulate complicated reactor phenomena. However, rapid advances in computer
technology now enable these codes to run on personal computers or workstation in real or nearly real time. This has helped
in more widespread use of these codes. One limitation that still
restricts their use on an even wider scale is that these codes
often have complicated I/O structure. User friendly graphical
user interfaces (GUI) will not only help in their increased use,
they are also likely to help in better and efficient interpretation
of the results obtained using these codes. This has motivated the
development of easy-to-use GUI tools for best-estimate codes,
such as SNAP (Jones, 2000) and PEGASYS (Agee, 1996). Some
∗
Corresponding author.
E-mail addresses: [email protected] (K.D. Kim), [email protected]
( Rizwan-uddin).
0029-5493/$ – see front matter © 2007 Elsevier B.V. All rights reserved.
doi:10.1016/j.nucengdes.2007.01.004
GUIs have been developed so that the system codes can be used
like a conventional nuclear plant analyzer (NPA) (Bartsoen et
al., 1997; Maselj et al., 1997; Kim et al., 2001, 2003).
In addition to the user friendly interfaces, real time webcasting of results obtained using these codes in GUIs is also
desirable. With easy accessibility and fast Internet communication, a greater degree of freedom in simulation and/or analyses of
nuclear transient conditions can be achieved if computer codes
– and their output – are accessible from anywhere in the world
through the web. Such a web-based interactive interface can also
be very useful for team work when there is a need to share real
time data. With increasing emphasis on team work, with teams
often located in geographically distant locations, such a capability can act as the bridging interface allowing better collaboration
and interactive exploration of real time data.
Using mostly off-the-shelf technology, development of such
a capability – a web-based nuclear reactor simulator based on a
best-estimate code and with user friendly interface – is reported
here. Specifically, a user friendly, graphical interface is developed to execute and to display the voluminous output of the
widely used best-estimate code RELAP5. Moreover, a capability
to web-cast that I/O interface in real time is also available. This
has been achieved using the virtual instruments (VIs) feature
available in LabVIEW (Laboratory Virtual Instrument Engineering Workbench); a commercially available package for data
1186
K.D. Kim, Rizwan-uddin / Nuclear Engineering and Design 237 (2007) 1185–1194
acquisition and visualization. In addition to the graphical display of the large quantity of data that is generated by such
codes, interactive control functions have also been added that
allow simulation of operator actions such as scram, etc. Operator
actions can be initiated by the local user as well as, if permitted,
by the distant user through the web. The key features of this
web-based nuclear simulator are summarized below:
• RELAP5 forms the engine of this simulator. Hence, all
standard RELAP5 features are available in this simulator.
Moreover, existing RELAP5 input data files can be used.
• A LabVIEW based graphical user interface has been developed to display the large amount of output data “during” as
well as “after” the transient simulations.
• Simulator can be run on a server by users who are allowed
to access the server through the web. Since all interactions
take place via a web browser, it is machine independent.
Remote users accessing/running the simulator see the results
in windows that open in the web browser.
• Interactive control functions are provided so that users (local
as well as remote) can perform operator actions during the
simulations.
The simulator is developed using RELAP5 as its engine.
However, the methodology used here for the web-based nuclear
simulator is very general, and it can be easily extended to other
system analysis codes. The tools and methodology used to
develop the web-based nuclear simulator are presented in the
next section.
2. Tools and methodology
Development of a web-based simulator can be broken into
two steps: identification of an “engine”; and development of
a GUI. A personal computer with Windows OS was used as
the developmental platform. This choice was primarily dictated
by the fact that the dynamic link library (DLL) for RELAP5,
which was chosen as the engine for the simulator, was generated in the Windows environment. [However, since the user
interaction is via a web browser, the simulator can be used with
other machines, and operating systems other than Windows.]
RELAP5 is selected as the engine of this simulator because of
its widespread use worldwide. RELAP5 input decks for most
nuclear plants are already available, and can be directly or
with very minor modifications used with the simulator developed here. [The choice was also, at least partly, dictated by the
desire to develop a means to graphically display the voluminous
text-based output generated by RELAP5.]
LabVIEW 8.0 (National Instruments, 2003) was used to
develop the graphical user interface (GUI) of the web-based
nuclear simulator. LabVIEW has been used in the past in laboratories (Oliveira et al., 1998; MacLaren et al., 1999) and is
routinely used to process experimental data. It has recently been
used to develop web-based virtual laboratory (Jurcevic et al.,
2006; White, 2006), but it has not been used as a front end of a
large system analysis nuclear simulation software, as is done in
the application reported here.
The sub-programs added for the DLL programming are
located in a separate directory and maintained as an independent static library. The RELAP5 files that have been modified
to implement the interactive control feature are also saved in a
directory different from the one where these sub-programs (or
subroutines) are saved in a standard version of RELAP5. The
number of variables for the interface between RELAP5 dynamic
link library (DLL) and virtual instruments (VIs) in LabVIEW is
minimized to simplify the interface. Standard input decks of
RELAP5 are used as input for this simulator. Since interactive control feature has been added, control parameters for this
new feature however must be provided along with the standard
RELAP5 input.
The interactive, web-based user interface is developed using
the virtual instruments feature in LabVIEW. LabVIEW—virtual
instrument (LabVIEW-VI) is a powerful and flexible graphic
programming language. It provides a platform to efficiently
develop user interfaces and to display data. Moreover, with the
click of a mouse it provides a web-based running environment.
For LabVIEW programming, a modular approach was adopted.
Each module is encapsulated with well-defined interfaces. The
modules, such as the core power, temperature, pressure, etc., are
then simply assembled together to create the complete simulator. This modular approach reduces the programming effort and
the complexity of the design. Because each component is independent and self-contained with well-defined interfaces, it can
be repeatedly used, saving time and effort in future development
work. The simulator developed here taps into the data directly
from the RELAP5 arrays for the variables to be plotted. This
allows the display of data while simulation is still continuing.
LabVIEW-VIs are coupled with RELAP5 as dynamic link
library (DLL). RELAP5 main program is changed into a subprogram, and is exported to LabVIEW. The changes made to
accomplish this are shown in Appendix A. The same appendix
also shows a new sub-program, set files, added to set up the
I/O files. Also, as an example, the part of RELAP5 minor edit
input and the related part of a new sub-program to graphically
show the output of RELAP5 in the LabVIEW-VI are shown and
described in Appendix A.
Fig. 1 shows a schematic diagram of the web-based engineering simulator. The user provides the input and output file names
for RELAP5 DLL via the main control module by either entering
the path and name of the file, or by simply browsing through the
storage media on the computer. These paths and file names are
transferred to RELAP5 DLL when user clicks on the “run” button in the main control module. The simulator runs using these
files as input decks. Local or remote master user, who has the
control of the simulator, can simulate operator’s actions through
the main control page, and this control action is also passed to
RELAP5 DLL through LabVIEW-VIs. During the transient calculation, the RELAP5 DLL transfers the results to LabVIEW,
and the LabVIEW-VIs show the data in graphical form. Through
Internet, the users connected to the server running the simulator
can access the graphical output of LabVIEW-VIs.
LabVIEW-VIs, which are coupled with RELAP5 as DLLs,
make it possible to run RELAP5 from a web-browser through
the network without the code and/or input file being present in
K.D. Kim, Rizwan-uddin / Nuclear Engineering and Design 237 (2007) 1185–1194
1187
Fig. 1. Schematic diagram of a web-based nuclear simulator.
the end user’s computer. The simulator can reside on a server.
Users who are permitted to be connected to the server through
the Internet can interactively simulate the transient in interactive mode using control features through their web browser and
examine the results on-line.
Each user interface screen in the web-based simulator, which
will be called a module, is a LabVIEW virtual instrument.
Each module consists of elements such as a windows, meters,
switches, etc. Since LabVIEW-VI is a graphical language, the
graphic elements within each module can be replaced by other
instruments or modified using such simple mouse operation as
drag and drop.
User interface screens in the web-based nuclear simulator
developed here consist of six modularized LabVIEW-VIs: a
main control module for problem set up and interactive control;
and five RELAP5 output visualization modules.
Local or remote master user can select the code I/O files, execute the code and simulate operator’s action through the main
control page which appears in their web browser when they
connect to the server. The main control window as well as other
windows displaying the data can be web-casted over the Internet. However, only one master user or client can control the
transient simulation. It should be noted that the RELAP5 input
data can be used without any changes. However, to fully utilize
the capabilities of this tool, additional input cards must be added
into the existing RELAP5 input deck to specify the parameters
for the interactive control features.
3. Main features
Main features of this web-based nuclear simulator are
explained using an example of a typical Westinghouse two-loop
PWR (Pressurized Water Reactor), modeled as the target plant
for this application. While results shown here are for one spe-
cific nuclear power plant, the simulator can easily be adapted
for other plants. Specific details for adapting this tool to other
LWRs are given later in this section.
3.1. Control module
Fig. 2 shows the main window (a LabVIEW virtual instrument) of the web-based nuclear simulator. It consists of a main
tool bar and five tab sheets. The tab sheets include the “main control”, “nodalization”, “reactor power”, “pressure & level” and
“temperature.” Each tab sheet is developed as a separate module or virtual instrument. Output data can be seen in graphical
format by selecting appropriate tabs at the bottom of the simulator window. This leads to the display of the selected data in
the currently open window. Option is also available to open new
windows to display the selected data. Hence, a user can select
to view the data in a separate window or web browser (open in
new window) by clicking on the buttons on the left side of the
main window (under, stand-alone pages). Contents of these tab
sheets are discussed in more detail below. User can control the
execution mode using the buttons for run, stop and pause on the
main tool bar (see inset in Fig. 2).
The main control module is designed to set up the I/O files,
code execution, accident initiation, simulation of reactor control,
and to open other output pages in separate browser windows.
The main control module has three edit boxes and associated
buttons to browse and select the input, output, and restart data
files. User can execute (start) the RELAP5 code or pause/resume
the execution by clicking a button in the main tool bar on top
of the window shown Fig. 2. User can terminate the execution
by clicking the stop button on the top-right corner of the window shown in Fig. 2. [Although there is an alternate method
to terminate the execution by clicking the “stop” button in the
main tool bar, it is not recommended because it forces the ter-
1188
K.D. Kim, Rizwan-uddin / Nuclear Engineering and Design 237 (2007) 1185–1194
Fig. 2. Main control page.
mination by LabVIEW intrinsic function without following the
proper termination procedure.] Few frequently used transient
simulation scenarios, such as LOCA, steam generator tube rupture and built-in trip control functions such as reactor scram
and reactor coolant pump ON/OFF, are made available as single
click switches. Since current work is only to demonstrate the
capabilities and feasibility of a web-based simulator using LabVIEW, the GUI currently does not provide interactive features
to control all aspects of a reactor. However, additional interactive controls can be added without significant effort. The red
button is used as a reactor scram switch as well as an indicator
to show the reactor’s current status. Two toggle switches show
the current status of the reactor coolant pumps and two push
buttons above these switches are used to select the auto/manual
mode.
Access to reactor output data in graphical form is available
by clicking on the tabs at the bottom left of the window shown
in Fig. 2, which results in display of the clicked module in the
same window (replacing the control window). User can also
elect to view the data in newly opened windows by clicking on
the desired module button on the left edge of the control module
(buttons under the heading; Stand-alone Pages) shown in Fig. 2.
transient simulation so that the users can easily follow plant
dynamics. There are five data modules that can be accessed to
display a wide range of data. These are described below.
3.2. Data visualization modules
3.2.1. Reactor power module
A picture of the reactor power module is shown in Fig. 3.
It shows major reactor power related parameters through indicators and trend graphs. Specifically, this module shows: total
reactor power; fission power; major contributions to the reactivity worth; fuel centerline temperatures along five different axial
positions; and reactor core collapsed water level. This module
is designed to display important reactor power related variables
as well as parameters that lead to change in power. For example, user can easily analyze the contributions to a change in
reactor power by examining the reactivity effects and fuel temperatures which affect Doppler feedback. Operating range for
reactor power is indicated with green color in the reactor power
indicators, and the power levels above the high reactor power
set point are marked in red. RELAP5 input model was prepared
to automatically scram the reactor if reactor power is above the
high power set point. Core water level is included to show the
increase in fuel temperature due to uncovered core during loss
of coolant or steam line break accidents. Trend graph shows the
change of reactor power with time.
RELAP5 produces a large amount of text-based output in a
transient simulation. Web-based nuclear simulator is designed
to provide graphical displays of the results during or after a
3.2.2. Pressure and level window
Pressure and water levels on the primary and secondary sides
are very important parameters for reactor operation and reactor
K.D. Kim, Rizwan-uddin / Nuclear Engineering and Design 237 (2007) 1185–1194
1189
Fig. 3. Reactor power module.
safety evaluation. This window shows pressures and collapsed
water levels for the pressurizer and two steam generators using
meters for pressure, level indicators for water level, and trend
graphs. See Fig. 4. The state of the primary side pressure and
water inventory is shown using the pressurizer pressure and pressurizer water level. Steam dome pressure and narrow range water
levels show the state of the pressure and water inventory of the
secondary side of the two steam generators. These instruments
also show reactor’s normal operating range in green color, above
high-high set point in red color and below low-low set point in
yellow color, thus making it very easy to assess reactor’s current
operating status. This window also includes the trend graphs for
pressures and water levels for pressurizer and secondary side of
steam generators.
3.2.3. Temperature window
This window, shown in Fig. 5, shows hot leg, cold leg and
average temperatures for each loop. These temperatures indicate
Fig. 4. Pressures and water levels.
1190
K.D. Kim, Rizwan-uddin / Nuclear Engineering and Design 237 (2007) 1185–1194
Fig. 5. Temperature window.
such reactor operating conditions as thermal power generated
on the primary side, reactor over cooling and under cooling, etc.
This window also shows, for each leg, the saturation temperatures with red bars on the upper part of the thermometers. This
information is crucial in determining the level of sub-cooling
margin that must be maintained to protect the reactor coolant
pump. These temperatures are also shown in trend graphs as a
function of time.
Fig. 6. Flow rates window.
K.D. Kim, Rizwan-uddin / Nuclear Engineering and Design 237 (2007) 1185–1194
1191
Fig. 7. Nodalization window.
3.2.4. Flow rate window
Flow rates for the primary loop and charging/letdown flows
and various secondary flows are included in this window shown
in Fig. 6. Primary loop flows are essential for reactor cooling,
and charging/letdown is used to maintain water inventory on
the primary side. On the secondary side, main and auxiliary
feedwater flow, steam flow for each steam generator and turbine
isolation flow and steam depressurizing valve flow are shown
in the window. These flows are also shown in trend graphs as a
function of time.
3.2.5. Nodalization window
Conventional simulators are often based on simplified models
and coarse computational cells. This does not permit evaluation
and display of spatial distributions of quantities of interest. Since
RELAP5, a code that calculates fairly detailed spatial distributions, is the engine behind the simulator developed here, it is possible to display the evolution of spatial distribution of quantities
of interest such as temperature or void fraction, etc. The nodalization window is designed to show void distribution in nuclear
steam supply system. Color is used to show the level of void fraction in each cell. Dark blue represents 100% water, and decreasing intensity of blue shows an increasing amount of void. Fig. 7
shows the change in void fraction distribution during a large loss
of coolant accident. The figure on the left shows the void distribution during normal operating conditions, and the one on the
right shows void distribution about 100 s after the accident.
Windows and variables shown in the figures above are for a
specific two-loop PWR. However, the target plant can be easily
replaced by another plant by simply changing the RELAP5 input
file. Data windows showing scalars for a different plant design,
for example for a four loop plant, will however require some
minor modifications to display the additional variables for the
different plant design. In the current version of the simulator,
nodalization window is the only window that displays spatial
distribution of a variable (void fraction). Since, geometry and
number of cells may vary from plant to plant and from one simulation to another, the nodalization window must be tailored for
each plant geometry and the number of cells. This may require a
moderate amount of effort to tailor the simulator’s nodalization
window for the geometry and the number of cells used in any
plant simulation.
4. Summary and conclusions
A web-based nuclear reactor simulator based on RELAP5 has
been developed using LabVIEW-VIs. RELAP5 was selected as
the engine for this simulator since it is a very widely used bestestimate code that has been well-verified over several years.
Moreover, RELAP5 input decks for most nuclear power plants
are already available which makes it relatively easy to tailor
the simulator for these power plants. Although the web-based
simulator was developed for a particular PWR plant, it can be
developed for other nuclear plants and experimental facilities
by changing the input deck of the RELAP5 code, and making
minor modifications in the data display windows. The simulator
engine (RELAP5) can also be switched with any other system
analysis code since the interface between the simulator engine
and graphical user interface program is well-defined and the two
are coupled by dynamic link libraries.
LabVIEW has been used as a development environment and
as generic graphical user interface because LabVIEW is based
on a graphical language which is easy to use, provides excellent
graphics capabilities, and moreover, it has the ability to make
all results available, in real time, on the World Wide Web. Such
web-based simulation capabilities can also be very useful for
team work such as international and/or distance collaborations.
Future work will focus on adding additional interactive features for operator actions as well as extending the development
to GEN-IV reactor designs.
Acknowledgements
This work was supported in part by the US DOE INIE grant.
K.D. Kim acknowledges the support from Korea Science and
Engineering Foundation (KOSEF) for partially supporting the
visit to UIUC. Work was performed while K.D. Kim was a
visiting scientist at UIUC.
1192
K.D. Kim, Rizwan-uddin / Nuclear Engineering and Design 237 (2007) 1185–1194
Appendix A
Slight changes are made in seven RELAP5 subroutines and six new subroutines are added to generate the dynamic link library
to couple RELAP5 with LabVIEW-VI. Two examples of the changes made to RELAP5 code are shown and described below.
RELAP5 main program was changed to a sub-program for LabVIEW.
Sub-program set files, shown below, is added to set up the I/O files.
K.D. Kim, Rizwan-uddin / Nuclear Engineering and Design 237 (2007) 1185–1194
1193
To minimize the changes in RELAP5 input, the values of parameters graphically shown in the LabVIEW-VI are obtained from
the RELAP5 minor edit variables. A sub-program named r5m33 data is added to get the values of the minor edit variables, and to
pass the information for the control parameters including interactive control function, program control between RELAP5 DLL and
LabVIEW-VI. Following part of sub-program, r5m33 data, is to export the values of minor edit variables to LabVIEW for graphical
representation and web-casting.
Following is the part of RELAP5 input to define minor edits:
1194
K.D. Kim, Rizwan-uddin / Nuclear Engineering and Design 237 (2007) 1185–1194
References
Agee, L.J., 1996. Status of EPRI software. In: Presented at Korea Electric Power
Corp., Electric Power Research Institute.
Bartsoen, L., Mandy, Cs., Stubbe, E., 1997. Nuclear plant analyzer: an efficient
tool for training and operational analyses. In: Proceedings of the Second
CSNI Specialist Meeting on Simulators and Plant Analyzers, Finland.
Computer Simulation & Analysis, Inc., 2001. RETRAN-3D: A Program for
Transient Thermal–Hydraulic Analysis of Complex Fluid Flow Systems, vol.
1: Theory and Numerics. Electric Power Research Institute, EPRI NP-7450.
Farvaque, M. 1992. User’s manual of CATHARE 2 V1.3E, CEA,
STR/LML/EM/91-61.
Jeong, J.J., Ha, K.S., Chung, B.D., Lee, W.J., 1999. A multi-dimensional
thermal–hydraulic system analysis code, MARS 1.3.1. J. Korean Nucl. Soc.
31 (3), 344–363.
Jones, K.R., 2000. Symbolic nuclear analysis package. In: Proceedings of the
2000 ANS/ENS International Mtg, Embedded Topical Mtg. #2, “Best Estimate” Methods in Nuclear Installation Safety Analysis, Washington, DC,
November 12–16.
Jurcevic, M., Malaric, R., Sala, A., 2006. Web based platform, for distance training on Electrical Measurements Course, Measurement Science
Review, vol. 6, Sec. 1, No. 4, 2006. Available via Web at http://www.
measurement.sk/2006/S1/Jurcevic.pdf.
Kim, K.D., Lee, S.W., Jeong, J.J., 2001. A visual environment for system analysis
codes. Prog. Nucl. Energy 39 (3–4), 335–344.
Kim, K.D., Lee, S.W., Jeong, Lee, Y.J., Chung, B.D., Hwang, M.G., 2003. Development of a nuclear reactor transient analyzer based on the best-estimate
codes, RETRAN and MARS. Trans. ANS 89.
MacLaren, S., Faltens, A., Ritchie, G., Seidl, P., 1999. Preliminary
Results from a Scaled Final Focus Experiment for Heavy Ion Inertial
Fusion. In: Proceedings of the 1999 Particle Accelerator Conference,
New York.
Maselj, A., Vonjovic, D., Gregoric, M., 1997. NPA applications: development in the nuclear safety authority framework. In: Proceedings of the
Second CSNI Specialist Meeting on Simulators and Plant Analyzers,
Finland.
National Instruments, 2003. LabVIEW: Getting Started with LabVIEW.
Oliveira, V.A., Aguiar, M.L., Silva Jr., W., 1998. User-friendly computer software in control and instrumentation teaching and learning. In: Proceedings
of the International Conference on Engineering Education (ICEE98), Rio
Othon Palace, August 17–20, p. 1998.
US Nuclear Regulatory Commission, Office of Nuclear Regulatory Research,
April 2001. TRAC-M/FORTRAN 90 (version 3.0) Theory Manual, US
Nuclear Regulatory Commission Report NUREG/CR-6724, Washington,
USA.
US Nuclear Regulatory Commission, Office of Nuclear Regulatory Research,
December 2001. RELAP5/MOD3.3 Code Manual Volume 1: Code Structure, System Models and Solution Methods, US Nuclear Regulatory
Commission Report NUREG/CR-5535, Washington, USA.
White, J.R., 2006. Available via web at http://nuclear101.com/.