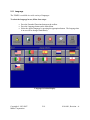
1
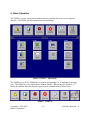
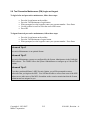
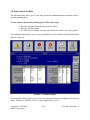
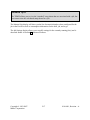
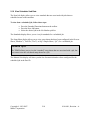
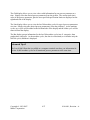
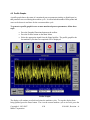
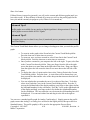
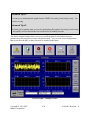
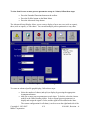
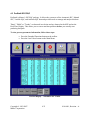
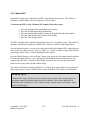
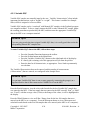
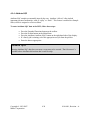
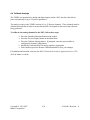
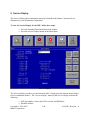
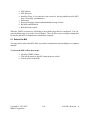
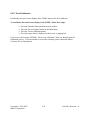
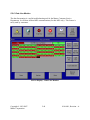
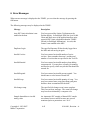
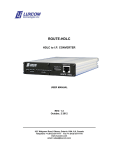
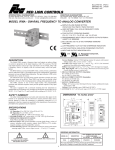
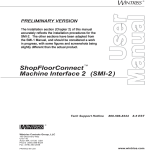
ProHelp® EPM
Production & Process Monitoring System
TSMIU User’s Manual
For ProHelp® EPM, Release 7.5
MANUAL #810-0091
Revision – A
November 30, 2007
ATTENTION
You can obtain service support by visiting Mattec’s web site at http://www.mattec.com, by
emailing the help desk at [email protected], or by telephone at (513) 683–1802.
Copyright © 1983-2007
Mattec Corporation
1-2
810-0091, Revision – A
TABLE OF CONTENTS
1.
2.
Introduction........................................................................................................................ 1-4
Basic Operation.................................................................................................................. 2-6
2.1 Status / Alarm Display.................................................................................................... 2-7
2.2 Operator Login ............................................................................................................... 2-9
2.3 Operator Logout ........................................................................................................... 2-10
2.4 Scrap Entry ................................................................................................................... 2-11
2.5 Downtime Selection ..................................................................................................... 2-12
2.6 Call For Help ................................................................................................................ 2-13
2.7 Machine Preventive Maintenance (PM) Login and Logout ......................................... 2-14
2.8 Tool Preventive Maintenance (PM) Login and Logout................................................ 2-15
2.9 View Current Job Data ................................................................................................. 2-16
2.10
View Scheduled Job Data ......................................................................................... 2-18
2.11
Language ................................................................................................................... 2-19
2.12
Preferences ................................................................................................................ 2-20
3.
Advanced Features........................................................................................................... 3-21
3.1 Change Cavities............................................................................................................ 3-21
3.2 Change Percent Regrind ............................................................................................... 3-22
3.3 Change Material Lot(s)................................................................................................. 3-23
3.4 Add Setup Material....................................................................................................... 3-23
3.5 Job Control ................................................................................................................... 3-24
3.6 Kanban Quick-Start ...................................................................................................... 3-25
4.
Process Monitoring .......................................................................................................... 4-26
4.1 Last Values ................................................................................................................... 4-26
4.2 Profile Graphs............................................................................................................... 4-28
4.3 ProStat® SPC/SQC ...................................................................................................... 4-33
4.3.1 Automatic SPC....................................................................................................... 4-34
4.3.2 Manual SPC ........................................................................................................... 4-35
4.3.3 Variable SQC ......................................................................................................... 4-36
4.3.4 Attribute SQC ........................................................................................................ 4-38
4.4 Calibrate Analogs ......................................................................................................... 4-39
5.
Service Display ................................................................................................................ 5-40
5.1 Reboot the MIU ............................................................................................................ 5-41
5.2 Miscellaneous Service Display Features ...................................................................... 5-42
5.2.1 Communications Loopback ................................................................................... 5-42
5.2.2 Enter Key Code...................................................................................................... 5-42
5.2.3 Printer..................................................................................................................... 5-42
5.2.4 Light Test ............................................................................................................... 5-42
5.2.5 Touch Calibration .................................................................................................. 5-43
5.2.6 Data Line Monitor.................................................................................................. 5-44
6.
Error Messages................................................................................................................. 6-45
Copyright © 1983-2007
Mattec Corporation
1-3
810-0091, Revision – A
1. Introduction
Mattec Corporation's ProHelp® EPM Production and Process Monitoring System is specifically
designed for real-time monitoring of all types of production equipment. It is used extensively in
the plastics injection molding, extrusion, blow molding, blown film, metal stamping, die casting,
printing, painting, and assembly industries. The basis behind the benefits from the
ProHelp® EPM system is the rationale that plant managers and operational people will take
corrective actions to solve problems on production equipment when they are aware of such
problems. ProHelp® EPM is the device to alert employees to problems immediately when the
problems occur. Therefore, tremendous savings can occur in increased productivity and
decreased scrap parts.
The ProHelp® EPM system combines computer hardware, computer software, and Machine
Interface Units (MIUs) into an efficient system to provide real-time production monitoring,
production reports, process alarms, plant scheduling aids, and SPC/SQC process and part
capability analysis. Floor personnel can make use of the machine-mounted terminals to signal
different departments for help, to view production results at the machine site, and to enter
downtime reasons or scrap reasons. Production, downtime, and scrap reports can be generated
on a shift and daily basis, or the user can generate these reports for extended time periods by
specifying a start and end date for the desired report. Job history data is continuously
summarized and available for management's review.
Mattec’s TSMIU is a color, touch-screen machine interface unit that provides production and
process monitoring and an easy-to-use operator interface. It is available for use with the
ProHelp® EPM system and can be combined with other Mattec MIUs.
The TSMIU offers the following:
•
•
•
•
•
•
•
•
•
Production monitoring, including runtime, downtime, and scrap.
Process Monitoring
Operator login and logout.
Scrap entry.
Downtime selection.
Call for help.
Job data display.
Preventive maintenance.
SPC/SQC.
The TSMIU has several distinct advantages versus placing PCs on the shop-floor, including:
•
The TSMIU is an industrial-strength device that is designed for use on the shopfloor.
Copyright © 1983-2007
Mattec Corporation
1-4
810-0091, Revision – A
•
•
Repair costs for the TSMIU are very low. Component-level repairs, as opposed to
board replacements, are performed in-house by Mattec personnel, generally for a
fixed price.
The TSMIU is typically supported by your Maintenance Department, not your
IS/IT Department.
This manual describes the operation of the TSMIU that is available for use with ProHelp® EPM.
In most cases, the Mattec Customer Service Department will work closely with your System
Manager to configure your system properly. This manual assumes that your system has been
properly installed and configured.
When the TSMIU is restarted, it will display a large Mattec logo until it is configured. You can
press the Mattec logo to go to the Service Display. This will allow you to configure settings that
are used by the MIU to communicate with the host computer.
When the TSMIU is started and configured, the Status/Alarm Display is displayed. You can
press the buttons on the screen to navigate to other areas of the application.
Copyright © 1983-2007
Mattec Corporation
1-5
810-0091, Revision – A
2. Basic Operation
The TSMIU is a color, touch-screen machine interface unit that has an easy-to-use operator
interface. The TSMIU provides optional process monitoring.
Mattec’s TSMIU – Main Menu
The TSMIU-0 is an X-in-1 TSMIU that is capable of monitoring 2 to 16 machines at the same
time. The TSMIU-0 is very similar to the standard TSMIU. When using the TSMIU-0, a 7th
button, the Machine Selection Display, appears on the standard toolbar, shown below:
Mattec’s TSMIU-0
Copyright © 1983-2007
Mattec Corporation
2-6
810-0091, Revision – A
2.1 Status / Alarm Display
The TSMIU has a number of displays that allow you to view information about the currentlyrunning job(s) and/or process parameters, including the Status/Alarm Display.
To view job data for the currently-running job and current process parameter
information, follow these steps:
•
Press the Status/Alarm button on the toolbar.
The Status/Alarm Display can show you a great deal of data for the currently-running job.
Status/Alarm Display (Dial)
When viewing the Status/Alarm Display (Dial), you can press the dials on the display to jump to
other areas of the TSMIU. The dials that have a picklist (e.g., “Time To Go %”) can be
configured to display other values by pressing the picklist then selecting a new display value.
The configured values will be remembered the next time this display is shown.
Copyright © 1983-2007
2-7
810-0091, Revision – A
Mattec Corporation
Simply press the buttons on the display to navigate to other areas of the display.
Data on this display includes the following:
•
•
•
•
•
•
•
•
Job Number
Part Number
Good Production made for the shift
Scrap Production entered for the shift
Production To Go until the Job reaches its lot size
Run Hours for the shift
Down Hours for the Shift
Hours To Go until the Job is complete
Status/Alarm Display (Grid)
If a family job is running, the Job Number field on the display will be a picklist that allows you
to select the different son jobs that comprise the family job.
Copyright © 1983-2007
Mattec Corporation
2-8
810-0091, Revision – A
2.2 Operator Login
To login to the MIU as a machine operator, follow these steps:
•
•
•
Press the Login button on the toolbar.
Press the Tracking Login button to login for Operator Tracking or press the
Efficiency Login button to login for Operator Efficiency.
When prompted, use the keypad to enter your operator number. Press Enter.
Operator Login Display
Advanced Tip #1
Operator Efficiency logins keep track of how well the operator runs the machine. Operator
Tracking logins are similar to a time clock and do not keep track of how well the operator runs
the machine. The System Administrator should instruct you as to which type of login to use.
Copyright © 1983-2007
Mattec Corporation
2-9
810-0091, Revision – A
Advanced Tip #2
If you have purchased Mattec’s MIU Security Option, you will be prompted to enter a
password when you login to the MIU. You will then be able to access some areas of the MIU
and not access other areas of the MIU, depending on the security permissions that the System
Administrator has assigned to you.
2.3 Operator Logout
To logout from the MIU as a machine operator, follow these steps:
•
•
•
Press the Login button on the toolbar.
Press either Logout button (Tracking Logout or Efficiency Logout).
When prompted, use the keypad to enter your operator number. Press Enter.
Copyright © 1983-2007
Mattec Corporation
2-10
810-0091, Revision – A
2.4 Scrap Entry
To enter scrap parts for the current shift, follow these steps:
•
•
•
Press the Scrap Entry button on the toolbar.
Select the appropriate scrap reason.
When prompted, use the number keys to enter the quantity of scrap. Press Enter.
Advanced Tip #1
Scrap reasons are configured by the System Administrator in the ProHelp® EPM software.
The TSMIU allows the System Administrator to configure up to 200 scrap reasons.
Advanced Tip #2
You may not enter more scrap parts (for the shift, for the job) than good parts that have been
produced.
Advanced Tip #3
To enter scrap parts for a prior shift or for a different job, you must use the Edit Facilities
program from a computer terminal.
Advanced Tip #4
If you are running a family job, you may optionally select the “father” job or a specific “son”
job. If you select the father job, you will enter scrap cycles, not parts, for all running son jobs.
You may use the picklist to select a specific son job, in which case you will enter scrap parts
for that son job.
Copyright © 1983-2007
Mattec Corporation
2-11
810-0091, Revision – A
2.5 Downtime Selection
When the machine stops cycling, the MIU will automatically detect this condition and start
accumulating downtime. Once the cause of the downtime is known, it’s important to select the
reason from the list of downtime reasons.
If the MIU is down for an “Unknown” reason, the red light on the front of the TSMIU will blink
(until you select a downtime reason).
To select a downtime reason, follow these steps:
•
•
Press the Downtime button on the toolbar.
Select the appropriate downtime reason.
Advanced Tip #1
Downtime reasons are configured by the System Administrator in the ProHelp® EPM
software. The TSMIU allows the System Administrator to configure up to 191 downtime
reasons.
Advanced Tip #2
Some downtime reasons are “forced down” (i.e., “non-production”) reasons. When you select
a forced down downtime reason, the MIU will think that the machine is down, even if it is
cycling. You must then press the “In Prod” button to place the machine back into production.
Machine setup is an example of a downtime reason that is commonly-configured to be a forced
down downtime reason.
Forced down downtime reasons are configured by the System Administrator.
Advanced Tip #3
If you select a “forced down” downtime reason, you must select reason #1 (“In Prod”) when
the machine starts cycling.
If you select a normal downtime reason, the MIU will automatically start counting parts and
runtime when the machine again starts cycling.
Advanced Tip #4
If you are using Mattec’s Voice Alarm option, you can “Acknowledge” voice alarms for
downtime conditions by pressing the Acknowledge Voice button.
Copyright © 1983-2007
Mattec Corporation
2-12
810-0091, Revision – A
2.6 Call For Help
The TSMIU allows you to call for help for various reasons. These help calls can be seen on any
Real-Time Display.
To call for help, follow these steps:
•
•
Press the Call for Help button on the toolbar.
Select the appropriate help call reason.
Advanced Tip #1
A call for help stays active until you cancel it by pressing the “Cancel Help” button.
Advanced Tip #2
Help call reasons are configured by the System Administrator in the ProHelp® EPM software.
The TSMIU allows the System Administrator to configure up to 8 help call reasons, plus
“Cancel Help”.
Advanced Tip #3
If you are using Mattec’s Voice Alarm option, your call for help can be announced over a PA
system. You can “Acknowledge” voice alarms for help calls by pressing the Acknowledge
Voice button.
Copyright © 1983-2007
Mattec Corporation
2-13
810-0091, Revision – A
2.7 Machine Preventive Maintenance (PM) Login and Logout
To login in for machine preventive maintenance, follow these steps:
•
•
•
•
•
Press the Login button on the toolbar.
Press the Machine Maintenance Login button.
When prompted, use the keypad to enter your operator number. Press Enter.
Use the picklist to scroll to select the correct PM reason.
Press OK.
To logout from machine preventive maintenance, follow these steps:
•
•
•
Press the Login button on the toolbar.
Press the Machine Maintenance Logout button.
When prompted, use the keypad to enter your operator number. Press Enter.
Advanced Tip #1
Preventive Maintenance is an optional feature.
Advanced Tip #2
Preventive Maintenance reasons are configured by the System Administrator in the ProHelp®
EPM software. The TSMIU allows the System Administrator to configure up to 100 machine
PM reasons.
Advanced Tip #3
If you have purchased Mattec’s MIU Security Option, you will be prompted to enter a
password when you login to the MIU. You will then be able to access some areas of the MIU
and not access other areas of the MIU, depending on the security permissions that the System
Administrator has assigned to you.
Copyright © 1983-2007
Mattec Corporation
2-14
810-0091, Revision – A
2.8 Tool Preventive Maintenance (PM) Login and Logout
To login in for tool preventive maintenance, follow these steps:
•
•
•
•
•
Press the Login button on the toolbar.
Press the Tool Maintenance Login button.
When prompted, use the keypad to enter your operator number. Press Enter.
Use the picklist to scroll to select the correct PM reason.
Press OK.
To logout from tool preventive maintenance, follow these steps:
•
•
•
Press the Login button on the toolbar.
Press the Tool Maintenance Logout button.
When prompted, use the keypad to enter your operator number. Press Enter.
Advanced Tip #1
Preventive Maintenance is an optional feature.
Advanced Tip #2
Preventive Maintenance reasons are configured by the System Administrator in the ProHelp®
EPM software. The TSMIU allows the System Administrator to configure up to 100 tool PM
reasons.
Advanced Tip #3
If you have purchased Mattec’s MIU Security Option, you will be prompted to enter a
password when you login to the MIU. You will then be able to access some areas of the MIU
and not access other areas of the MIU, depending on the security permissions that the System
Administrator has assigned to you.
Copyright © 1983-2007
Mattec Corporation
2-15
810-0091, Revision – A
2.9 View Current Job Data
The Job Data display allows you to view and even modify standards that are associated with the
currently running job(s).
To view data for the currently running job(s), follow these steps:
•
•
•
Press the Extended Functions button on the toolbar.
Press the Job Data button.
If a family job is running, select the son job that you wish to view in the picklist.
The Standards display allows you to view job standards as well as production information for the
shift, job, and to go.
Job Data – Standards Display
The Setup Sheet display allows you to view setup sheets that have been configured in the Process
Sheet (“Machine”), Tool ID (“Tool”), or SQC Sample Sheet (“QC”).
Copyright © 1983-2007
Mattec Corporation
2-16
810-0091, Revision – A
Advanced Tip #1
The TSMIU allows you to view the “standard” setup sheets that are associated with a job, but
you can not view the web-based setup sheets for a job.
The Material List display will show you the list of materials that have been configured for the
job in the Part ID as well as consumption information for the shift, job, and to go.
The Job Settings display allows you to modify settings for the currently running job(s) and is
described further in Section 3, Advanced Features.
Copyright © 1983-2007
Mattec Corporation
2-17
810-0091, Revision – A
2.10 View Scheduled Job Data
The Next Job display allows you to view standards that are associated with jobs that are
scheduled to run on this machine.
To view data a scheduled job, follow these steps:
•
•
•
Press the Extended Functions button on the toolbar.
Press the Next Job button.
Select the desired job in the Job Number picklist.
The Standards display allows you to view job standards for a scheduled job.
The Setup Sheet display allows you to view setup sheets that have been configured in the Process
Sheet (“Machine”), Tool ID (“Tool”), or SQC Sample Sheet (“QC”) for a scheduled job.
Advanced Tip #1
The TSMIU allows you to view the “standard” setup sheets that are associated with a job, but
you can not view the web-based setup sheets for a job.
The Material List display will show you the list of materials that have been configured for the
scheduled job in the Part ID.
Copyright © 1983-2007
Mattec Corporation
2-18
810-0091, Revision – A
2.11 Language
The TSMIU is available in a wide variety of languages.
To select the language in use, follow these steps:
•
•
•
Press the Extended Functions button on the toolbar.
Press the Language button on the Main Menu.
Select the desired language by pressing the appropriate button. The language that
is in use will be changed immediately.
Language Selection Display
Copyright © 1983-2007
Mattec Corporation
2-19
810-0091, Revision – A
2.12 Preferences
The TSMIU allows you to change the background color that is used.
To change the background color for the TSMIU, follow these steps:
•
•
•
Press the Extended Functions button on the toolbar.
Press the Preferences button on the Main Menu.
Select the desired color scheme by pressing the appropriate button. The
background color that is in use will be changed immediately.
Copyright © 1983-2007
Mattec Corporation
2-20
810-0091, Revision – A
3. Advanced Features
Advanced features of the TSMIU are described in the following sections.
3.1 Change Cavities
To change the active cavities for the running job, follow these steps:
•
•
•
•
Press the Extended Functions button on the toolbar.
Press the Job Data button on the Main Menu.
Press the Job Settings button.
Press the Cavities field. When prompted, enter the new number of active cavities
and press Enter.
Advanced Tip #1
The active number of cavities must be greater than or equal to 1 and less than or equal to the
total number of cavities that are configured in the Tool ID.
Advanced Tip #2
You can not change the active cavities for a family job or son job(s) from the TSMIU. If a
family job is running, you must change the active cavities from a computer terminal.
Copyright © 1983-2007
Mattec Corporation
3-21
810-0091, Revision – A
3.2 Change Percent Regrind
The percent regrind modifies the amount of virgin and regrind material that the system
accumulates as a job runs.
To change the percent regrind for the running job(s), follow these steps:
•
•
•
•
Press the Extended Functions button on the toolbar.
Press the Job Data button on the Main Menu.
Press the Job Settings button.
Press the Percent Regrind field. When prompted, enter the new percentage of
regrind material that is being used and press Enter.
Advanced Tip #1
If a family job is running, your changes will be applied to all running son jobs, regardless of
whether the father job or a son job is selected in the picklist.
Copyright © 1983-2007
Mattec Corporation
3-22
810-0091, Revision – A
3.3 Change Material Lot(s)
The TSMIU allows you to specify four (4) simultaneous material lot numbers for a job. You
may change any of the lot numbers an unlimited number of times. Changes should be made
when different lots of material are introduced into the process.
To change the material lot(s) in use for the running job(s), follow these steps:
•
•
•
•
Press the Extended Functions button on the toolbar.
Press the Job Data button on the Main Menu.
Press the Job Settings button.
Press the appropriate material lot field. When prompted, enter the new material
lot number and press Enter.
Advanced Tip #1
If a family job is running, your changes will be applied to all running son jobs, regardless of
whether the father job or a son job is selected in the picklist.
3.4 Add Setup Material
You can manually increase that amount of material (virgin and regrind) that has been used by the
machine during the setup process.
To add setup material for the running job, follow these steps:
•
•
•
•
Press the Extended Functions button on the toolbar.
Press the Job Data button on the Main Menu.
Press the Job Settings button.
Press the Add Setup Material button. When prompted, enter the new number of
active cavities and press Enter.
Advanced Tip #1
If a family job is running, you must select the appropriate son job from the picklist. If you try
to enter Setup Material for the entire family job, the error message “Invalid Material” will be
displayed.
Copyright © 1983-2007
Mattec Corporation
3-23
810-0091, Revision – A
3.5 Job Control
Job Control allows you to stop recording data for the currently-running job (i.e., end or suspend
the current job) and start recording data for the next-scheduled job (i.e., start the next job).
To perform Job Control, follow these steps:
•
•
•
•
•
Press the Extended Functions button on the toolbar.
Press the Job Control button on the Main Menu.
If a family job is running, select the job to end/suspend from the picklist. You can
end/suspend the entire family or end/suspend a specific son job.
Select the job to start from the Next Job picklist. If you are not going to start
running another job, select “None – Don’t Start Another Job”.
Press Suspend Current Job to suspend the currently-running job and start the next
job or press End Current Job to end the currently-running job and start the next
job.
Advanced Tip #1
When performing Job Control, most jobs should be “ended”. You will only “suspend” a job if
you need to stop making parts for the currently-running job in order to make parts for a “hot”
job, with the intention of coming back to the first job.
Advanced Tip #2
If you make a mistake and “end” a job that should have been “suspended” or “suspend” a job
that should have been “ended”, a job manager can easily fix the mistake using the “Status
Override” feature in the Job Scheduler program.
Advanced Tip #3
Job Control can also be performed at a computer terminal that is connected to the host
computer.
Advanced Tip #4
If you are running a family job, you can optionally end/suspend a son job and start a pending
son job.
Copyright © 1983-2007
Mattec Corporation
3-24
810-0091, Revision – A
3.6 Kanban Quick-Start
The Kanban Quick-Start feature allows you to implement a manual Kanban tracking system and
create/start jobs at the TSMIU.
To create and start running a new Kanban job, follow these steps:
•
•
•
•
•
•
Press the Extended Functions button on the toolbar.
Press the Job Control button on the Main Menu.
If a family job is running, select the job to end/suspend from the picklist. You can
end/suspend the entire family or end/suspend on specific son job.
Select “Create and Start – by selecting Part & Tool” from the Next Job picklist.
Select the Part/Tool combination that you intend to use in the Next Part picklist
and specify a Lot Size.
Press Suspend Current Job to suspend the currently-running job and start the next
job or press End Current Job to end the currently-running job and start the next
job.
Advanced Tip #1
Kanban Quick-Start is an optional feature.
Advanced Tip #2
Mattec also has a Kanban Scheduling option that will automatically create and schedule
Kanban jobs for you.
Advanced Tip #3
The Parts/Tools that will be displayed include the first 100 Process Sheets that have been
defined for this machine.
Copyright © 1983-2007
Mattec Corporation
3-25
810-0091, Revision – A
4. Process Monitoring
An important feature of the TSMIU is that is allows you to automatically monitor specification
and control limits for up to 32 process parameters. Detailed information about the process
parameters can be seen at the MIU and on computer displays. The following sections describe
some of the process monitoring features of the TSMIU.
4.1 Last Values
The TSMIU allows you to view information for all monitored process parameter for up to the
last 500 machine cycles. This data can be viewed in real-time.
To view process parameter information, follow these steps:
•
•
Press the Extended Functions button on the toolbar.
Press the Last Values button on the Main Menu.
Last Values – Line Display
Copyright © 1983-2007
Mattec Corporation
4-26
810-0091, Revision – A
The Grid display allows you to view color-coded information for one process parameter at a
time. Simply select the desired process parameter from the picklist. The current (real-time)
value of the process parameter, plus the user-specified specification limits are displayed on the
right-hand side of the display.
The Line display allows you to view the last 500 machine cycles for up to 4 process parameters
at a time. Simply select the desired process parameter(s) from the picklist(s). As the machine
cycles, new cycles will be added to the left-hand side of the display and the oldest cycle will be
removed from the display.
The Bar display groups information for the last 500 machine cycles into 11 categories, then
graphs those categories. As the machine cycles, the data is recalculated (so it includes only the
last 500 cycles) and then is displayed.
Advanced Tip #1
The Last 10,000 Chart that is available at a computer terminal can show you information for
the last 10,000 machine cycles for all monitored process parameters at the same time.
Copyright © 1983-2007
Mattec Corporation
4-27
810-0091, Revision – A
4.2 Profile Graphs
A profile graph shows the status of a monitored process parameter (analog or digital input) as
that parameter was read during the machine cycle. It can include thousands of data points and
can even be drawn in real-time for the current machine cycle.
To generate a profile graph for one or more monitored process parameters, follow these
steps:
•
•
•
Press the Extended Functions button on the toolbar.
Press the Profiles button on the Main Menu.
Select the appropriate signal from the Signal picklist. The profile graph for the
last machine cycle that was completed will be displayed.
Profile Graphs
The display will continue to refresh each time the machine cycles. To stop the display from
being updated, press the Pause button. The view the current machine cycle as it occurs, press the
Copyright © 1983-2007
Mattec Corporation
4-28
810-0091, Revision – A
Show Live button.
If Show History is turned on (pressed), you will see the current and all future graphs (until you
leave this screen). If Show History is turned off, at most you will see the profile graph for the
last cycle and the currently-in-progress cycle (if Show Live is turned on).
Advanced Tip #1
Profile graphs are available for any analog or digital signal that is being monitored. However,
profile graphs are not available for PLC signals.
Advanced Tip #2
A computer user can view data for any four (4) monitored process parameters at a time via the
Real-Time Display.
The Current Touch Mode button allows you to change what happens when you touch the profile
graph:
•
•
•
•
•
To zoom in on the graph, select Zoom In in the Current Touch Mode picklist.
Press the chart one or more times to zoom in.
To zoom out, once you have zoomed in, select Zoom Out in the Current Touch
Mode picklist. Press the chart one or more times to zoom out.
Once you have zoomed in, you can pan to the left or the right. To pan, select Pan
in the Current Touch mode picklist. Drag your finger from the left to the right
across the chart to see more data on the right side of the chart. Drag your finger
from the right to the left across the chart to see more data on the left side of the
chart.
To display the value of a point on the chart, select Value at Point in the Current
Touch Mode picklist. Press the chart. A vertical line will be drawn where you
have pressed the chart and the value of the data point that intersects that line will
be displayed.
You can calculate the area under the curve for a subset of the chart. To do this,
select Area Under the Curve in the Current Touch Mode picklist. Press the Yaxis on the left-hand side of the display and drag your finger to the right to define
the left-hand boundary for the calculation. Press the Y-axis on the right-hand side
of the display and drag your finger to the left to define the right-hand boundary
for the calculation. The area under the curve between the two bounding lines will
be displayed. You can touch either line and drag it to the left or the right to
reposition it.
You can save a standard profile graph for Analog 5 and Analog 6. Simply generate the profile
graph, ensure that Analog 5 or Analog 6 are selected in the Signal picklist, then press the Save
Standards button. The profile graph(s) will be saved to the appropriate Process Sheet.
Copyright © 1983-2007
4-29
810-0091, Revision – A
Mattec Corporation
Advanced Tip #3
You can save a standard profile graph from the TSMIU for Analog 5 and Analog 6 only. You
must be viewing
Advanced Tip #4
If a family job is running when you save the standard profile graph(s) for Analog 5 and Analog
6, the graph(s) will be stored in the Process Sheets for all running son jobs.
The Profile Graphs Display allows you to view profile graphs for all monitored process
parameters (at the same time) on up to 4 different charts. You can even create configurations
that are saved to the MIU so they can easily be recalled in the future.
Profile Graphs – Multiple Charts
Copyright © 1983-2007
Mattec Corporation
4-30
810-0091, Revision – A
To view data for one or more process parameters on up to 4 charts, follow these steps:
•
•
•
Press the Extended Functions button on the toolbar.
Press the Profiles button on the Main Menu.
Press the Advanced Setup button.
The Advanced Setup Display allows you to create a display of up to one, two (wide or square),
three (wide or square), or four charts. You can add multiple process parameters to any chart.
Profile Graphs – Advanced Configuration
To create an advanced profile graph display, follow these steps:
•
•
Select the number of charts (and style) to display by pressing the appropriate
Arrangement button.
Add one or more process parameters to each chart. To do this, select the chart to
modify in the Chart Number picklist. Select a Signal (process parameter) to
display and assign the signal a Color, and the signal will be added to the chart.
The current configuration for all chart(s) can be seen on the right-hand side of the
Copyright © 1983-2007
Mattec Corporation
4-31
810-0091, Revision – A
display in the Summary window.
To permanently save this advanced configuration, press the Save As button and give the chart a
name. To retrieve an existing configuration, select the configuration from the picklist (in the
lower right-hand corner of the display), then press OK.
For additional information, contact the Mattec Customer Service Department.
Copyright © 1983-2007
Mattec Corporation
4-32
810-0091, Revision – A
4.3 ProStat® SPC/SQC
ProStat® is Mattec’s SPC/SQC package. It allows the system to collect Automatic SPC, Manual
SPC, Variable SQC, and Attribute SQC data and provides tools to manage and analyze this data.
"Runs", "Shifts" or "Trends", are detected in real-time and are alarmed at the MIU and on the
Real-Time Display. This allows you to correct machine problems before you actually start
producing bad parts.
To view process parameter information, follow these steps:
•
•
Press the Extended Functions button on the toolbar.
Press the Last Values button on the Main Menu.
ProStat Display – Automatic SPC Limits
Copyright © 1983-2007
Mattec Corporation
4-33
810-0091, Revision – A
Advanced Tip #1
ProStat® is an optional feature. This button will be disabled if you have not purchased this
feature.
4.3.1 Automatic SPC
Automatic SPC samples are collected automatically by the MIU. This feature is enabled or
disabled in a Process Sheet.
To view the results of Automatic SPC sampling, follow these steps:
•
•
•
Press the Extended Functions button on the toolbar.
Press the ProStat button on the Main Menu.
Press the Auto (Automatic SPC) button on the right-hand side of the display.
Press the Results button to view the color-coded results for the last Automatic SPC sample that
was taken. If the last sample caused a “Run” (a “Shift” or a “Trend”) with the average value (XBar) or the Range of the values, it will be highlighted in the display.
Press the XBar-R button to view an X-Bar / Range chart for the last 100 samples that were taken.
Press the Histogram button to view a Histogram and calculated results based on the last 100
samples that were taken. Press the Limits Display button to view the user-specified control
limits for the average value (X-Bar) and the Range.
The Limits Calc button is currently disabled. To calculate new control limits for the monitored
process parameters, use the Calculate Limits feature in the Real-Time Display or in ProStat®.
Advanced Tip #1
An Automatic SPC sample will abort (not be recorded) if one or more of the monitored
process parameters can not be calculated when the data is collected. These values (that can’t
be calculated) will be displayed a “N/A” in the Last Value column of the on the Status / Alarm
Display (Grid Display).
Advanced Tip #2
The time when an Automatic SPC Sample will be collected by the MIU is calculated by the
monitoring engine. The date/time for the next sample that will be taken can be seen in the
SPC Trigger field on the Service Display.
Copyright © 1983-2007
Mattec Corporation
4-34
810-0091, Revision – A
4.3.2 Manual SPC
Manual SPC samples are collected by the MIU, when instructed by the user. This feature is
enabled in a Sample Sheet, which is assigned to a Process Sheet.
To instruct the MIU to take a Manual SPC sample, follow these steps:
•
•
•
•
•
Press the Extended Functions button on the toolbar.
Press the ProStat button on the Main Menu.
Press the Manual (Manual SPC) button on the right-hand side of the display.
Press the Entry button on the bottom of the display.
Press the Take Sample button.
The MIU will gather and record the information for the next 2-9 machine cycles. The number of
machine cycles that are included in a Manual SPC sample are defined in the Sample Sheet.
Press the Results button to view the color-coded results for the last Manual SPC sample that was
taken. If the last sample caused a “Run” (a “Shift” or a “Trend”) with the average value (X-Bar)
or the Range of the values, it will be highlighted in the display.
Press the XBar-R button to view an X-Bar / Range chart for the last 100 samples that were taken.
Press the Histogram button to view a Histogram and calculated results based on the last 100
samples that were taken. Press the Limits Display button to view the user-specified control
limits for the average value (X-Bar) and the Range.
The Limits Calc button is currently disabled. To calculate new control limits for the monitored
process parameters, use the Calculate Limits feature in the Real-Time Display or in ProStat®.
Advanced Tip #1
A Manual SPC sample will abort (not be recorded) if one or more of the monitored process
parameters can not be calculated when the data is collected. These values (that can’t be
calculated) will be displayed a “N/A” in the Last Value column of the on the Status / Alarm
Display (Grid Display).
Copyright © 1983-2007
Mattec Corporation
4-35
810-0091, Revision – A
4.3.3 Variable SQC
Variable SQC samples are manually input by the user. Variable “characteristics” often include
important part dimensions, such as “height” or “weight”. This feature is enabled in a Sample
Sheet, which is assigned to a Process Sheet.
Variable SQC samples can be “correlated” with Manual SPC samples via the ProStat® program
at a computer terminal. To do so, simply instruct the MIU to take a Manual SPC sample, gather
the resulting parts that are produced by the MIU, and then enter the appropriate Variable SQC
data at the MIU or at a computer terminal.
Advanced Tip #1
If you are going to take the time to input Variable SQC data, it is a really good idea to take the
corresponding Manual SPC samples first.
To enter Variable SQC data at the MIU, follow these steps:
•
•
•
•
•
Press the Extended Functions button on the toolbar.
Press the ProStat button on the Main Menu.
Press the Variable (Variable SQC) button on the right-hand side of the display.
If a family job is running, select the appropriate son job from the picklist.
Enter the data for all characteristics, as appropriate. Press Send to permanently
save the data.
The Variable Characteristics that can be entered, and the number of measurements
(“Observations”) that are entered, are configured in the Sample Sheet.
Advanced Tip #2
You can input Variable SQC data via one or more gauges by connecting the gauge(s) to a
GagePort interface that is then connected to COMM Port #3 on the MIU.
Press the Results button to view the color-coded results for the last Variable SQC sample that
was entered at the MIU. If the last sample that was entered at the MIU caused a “Run” (a “Shift”
or a “Trend”) with the average value (X-Bar) or the Range of the values, it will be highlighted in
the display.
Press the XBar-R button to view an X-Bar / Range chart for the last 100 samples that were
entered (at the MIU or at a computer). Press the Histogram button to view a Histogram and
calculated results based on the last 100 samples that were entered (at the MIU or at a computer).
Copyright © 1983-2007
Mattec Corporation
4-36
810-0091, Revision – A
Press the Limits Display button to view the user-specified control limits for the average value
(X-Bar) and the Range.
The Limits Calc button is currently disabled. To calculate new control limits for the monitored
process parameters, use the Calculate Limits feature in ProStat®.
Copyright © 1983-2007
Mattec Corporation
4-37
810-0091, Revision – A
4.3.4 Attribute SQC
Attribute SQC samples are manually input by the user. Attribute “defects” often include
important part non-conformities, such as “splay” or “flash”. This feature is enabled in a Sample
Sheet, which is assigned to a Process Sheet.
To enter Attribute SQC data at the MIU, follow these steps:
•
•
•
•
•
Press the Extended Functions button on the toolbar.
Press the ProStat button on the Main Menu.
Press the Attribute (Attribute SQC) button on the right-hand side of the display.
If a family job is running, select the appropriate son job from the picklist.
Enter the data as appropriate.
Advanced Tip #1
Entering Attribute SQC data does not cause a scrap entry to be created. That’s because it’s
possible to have Attribute defects that don’t result in scrap.
Copyright © 1983-2007
Mattec Corporation
4-38
810-0091, Revision – A
4.4 Calibrate Analogs
The TSMIU can optional have analog and digital inputs (and/or a PLC interface) that allows
process monitoring for up to 32 process parameters.
The analog circuitry in the TSMIU consists of 6 or 12 discrete channels. These channels must be
calibrated periodically in order to ensure that the MIU corresponds to the actual values that are
being generated.
To calibrate the analog channels for the MIU, follow these steps:
•
•
•
•
•
Press the Extended Functions button on the toolbar.
Press the Service Display button on the Main Menu.
Press the Calibrate Analogs button. If prompted, enter the password that is
configured in System Configuration.
Modify the Gain and Offset for analog signals as appropriate.
When finished, press the Remote Calibration button to save your changes.
For additional information, reference the MIU Calibration Procedures Application Note, #7200168 on Mattec’s website.
Copyright © 1983-2007
Mattec Corporation
4-39
810-0091, Revision – A
5. Service Display
The Service Display shows information that may be helpful to the Mattec Customer Service
Department or your Maintenance Department.
To view the Service Display for the MIU, follow these steps:
•
•
Press the Extended Functions button on the toolbar.
Press the Service Display button on the Main Menu.
Service Display
The Service Display can show you data about the MIU. Simply press the buttons on this display
to access additional features. The “Service Display” button of the Service Display includes the
following:
•
•
MIU part number, release date, PLD revision, and BIOS date.
Machine number.
Copyright © 1983-2007
Mattec Corporation
5-40
810-0091, Revision – A
•
•
•
•
•
•
•
MIU address.
MIU baud rate.
InterMsg Timer. Every time this value resets to 0, the host and this specific MIU
have successfully communicated.
Pulse timer.
Received message counter and transmitted message counter.
RxDnTm and RxDnCnt.
Bad checksum counter.
When the TSMIU is restarted, it will display a large Mattec logo until it is configured. You can
press the Mattec logo to go to the Service Display. This will allow you to configure settings that
are used by the MIU to communicate with the host computer.
5.1 Reboot the MIU
You may need to reboot the MIU when you perform configuration-related changes at a computer
terminal.
To reboot the MIU, follow these steps:
•
•
•
Open the TSMIU cabinet.
Turn off the power to the MIU using the power switch.
Turn on power to the MIU.
Copyright © 1983-2007
Mattec Corporation
5-41
810-0091, Revision – A
5.2 Miscellaneous Service Display Features
The MIU’s Service Display allows you to access several miscellaneous (and rarely-used)
features. These features are described in the following sections.
5.2.1 Communications Loopback
The standard TSMIU includes four (4) built-in COMM ports, including the following:
•
•
•
•
COMM Port 1 – Host communications (RS-485).
COMM Port 2 – Unused RS-232 communications.
COMM Port 3 – Configurable port typically used for PLC communications.
COMM Port 4 – Configurable port typically used for GagePort input.
The COMM Loopback button on the Service Display allows the Mattec Customer Service
Department to perform diagnostic tests on the MIU. You should not test the COMM ports in the
TSMIU while the MIU is running and configured. The internal or external tests can cause the
MIU to lock-up or drop communications.
5.2.2 Enter Key Code
Mattec’s oldest MIUs that were manufactured in 1983 required the user to enter “key codes” to
perform specific tasks. This feature is rarely used but is still supported. The TSMIU allows you
to enter key codes 200 through 399. A list of key codes can be found on Mattec’s website in the
MIU Key Codes Application Note, #720-0004.
5.2.3 Printer
The TSMIU supports a directly-connected parallel printer. No additional configuration is
required.
The Printer display on the Service Display allows you to cancel a pending print job (that was
generated at the MIU) or print a test sheet to the printer.
5.2.4 Light Test
When you press the Light Test button on the Service Display, the lights on the outside of the
MIU (amber, red, green, and white) will turn on. This allows you to determine if a bulb has
burned out.
Copyright © 1983-2007
Mattec Corporation
5-42
810-0091, Revision – A
5.2.5 Touch Calibration
Periodically, the touch-screen display of the TSMIU may need to be recalibrated.
To recalibrate the touch-screen display of the TSMIU, follow these steps:
•
•
•
•
Press the Extended Functions button on the toolbar.
Press the Service Display button on the Main Menu.
Press the Touch Calibration button.
Press the targets that are displayed on the screen, as appropriate.
If you receive the message “ERROR – Please retry calibration”, then you should repeat the
calibration process. If you are unable to resolve this situation, please contact the Mattec
Customer Service Department.
Copyright © 1983-2007
Mattec Corporation
5-43
810-0091, Revision – A
5.2.6 Data Line Monitor
The data line monitor is a useful troubleshooting tool for the Mattec Customer Service
Department. It will show all host/MIU communications (for this MIU only). This feature is
rarely used by customers.
Service Display – Data Line Monitor
Copyright © 1983-2007
Mattec Corporation
5-44
810-0091, Revision – A
6. Error Messages
When an error message is displayed at the TSMIU, you can clear the message by pressing the
OK button.
The following messages may be displayed at the TSMIU:
Message
Description
Auto SPC limit calculation is not
enabled at the host.
You have pressed the Limits Calc button on the
ProStat display. In ProHelp® EPM, the Last 10,000
Chart and other areas of the application allow more
powerful SPC limits calculations than the TSMIU
offered (in ProHelp® Millennium). As such, this
feature is not enabled at the MIU.
Duplicate Login.
The specified Operator ID has already logged in to
the MIU and can not log in again.
Invalid Cavities.
You have entered an invalid number of active
cavities. Enter a number between 1 and the total
number of cavities that are specified in the Tool ID.
Invalid Material.
You have entered an invalid number when adding
setup material. You may have a family job running
and need to specify which son job this data should be
entered for.
Invalid Regrind.
You have entered an invalid percent regrind. You
should enter a value between 0 and 100.
Invalid Scrap.
You have entered an invalid quantity of scrap. You
may have entered more scrap parts than good parts
that have been accumulated for the shift.
Job change comp.
The specified job change event is now complete.
This is not an error message. The actual job change
may have been initiated by a computer user.
Sample aborted due to invalid
analog value.
An Automatic SPC sample or Manual SPC sample
was aborted (not recorded) because one or more
monitored process parameters was “N/A”.
Copyright © 1983-2007
Mattec Corporation
6-45
810-0091, Revision – A