1
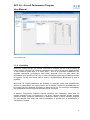
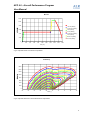
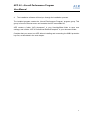
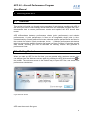
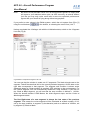
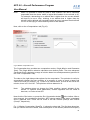
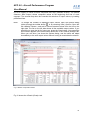
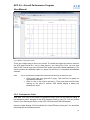
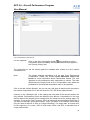
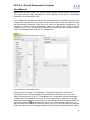
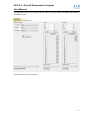
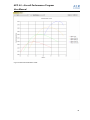
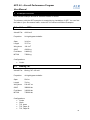
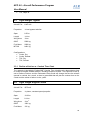
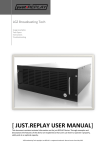
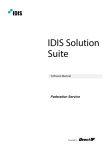
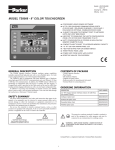
APP 6.0 Quick Start Version 1.0 January 2013 APP 6.0 - Aircraft Performance Program Quick Start 1 Introduction 1.1 Overview 1.1.1 The ALR Aerospace Flight Performance Program The software utility Aircraft Performance Program (APP) was designed to provide engineers, aircraft operators and researchers with a tool that allows computing of customized flight performance. Physics based flight equations are solved with high accuracy and numerical stability, using the proven APP computation algorithms. Years of experience and customer feedback make APP a reliable, efficient and versatile tool. APP relies on tabulated input of the physical characteristics of an aircraft, such as mass, lift, drag and thrust. While APP can be used to analyse and optimize a given aircraft design, it does not estimate aerodynamics or propulsion data. Therefore, the user is always in full control over the results. Together with the extensive Technical Reference document, APP is a trusted tool and not a black box. Since its founding in 1980, ALR Aerospace has a rich history of aerospace related activities, ranging from concept design of advanced fighter aircraft and light training aircraft, air traffic management, fluid- and aerodynamic engineering, up to supporting cutting edge solar powered aircraft projects. The Aircraft Performance Program APP has served ALR and its global partners and customers as a reliable, trusted and validated tool for all aircraft performance related questions. In its 6th major version, APP has been built from the ground up, but keeping the proven and reliable computation engine. ALR Aerospace Project Development Group, Zurich 1 APP 6.0 - Aircraft Performance Program User Manual Fig 1: The APP Desktop showing the Welcome Screen 1.1.2 An Integrated Package The Aircraft Performance Program was designed to improve productivity during all phases in a design process. APP 6 is an integrated high performance program that allows computation and manipulation of aircraft point performance and aircraft mission performance data, originating from basic configuration, aerodynamic and engine properties. APP 6 contains all the tools needed to compute, organize, present, visualize and print the performance and mission data efficiently. 1.1.3 User Friendly GUI APP 6 offers an intuitive Windows graphical user interface (GUI). The tabbed interface allows working with different computations opened at the same time, manipulating aircraft data and displaying the influence on flight performance almost instantaneously. Colored icons guide the eye and smooth the workflow. Users new to APP will appreciate the Welcome Screen to quickly get started using the examples provided with APP. Experienced users can efficiently work with multiple aircraft and calculations without losing focus and overview. High quality charting, printing and report generation capabilities are built into the software. Data can easily be exported to spreadsheet software. 2 APP 6.0 - Aircraft Performance Program User Manual Fig 2: Window GUI 1.1.4 Versatility Due to its modular design, the Aircraft Performance Program can be used for nearly all flying vehicles. Whether you need to evaluate the turn rate of a high-tech fighter aircraft or the maximum glide ratio of a silent glider - due to its numerical capabilities, the program determines performance data within seconds. Even for rare cases like acceleration at a specified climb rate or other customized performance tasks are solved at a glance. At any time during input or output, a toggle between British and SI units is possible. More than 50 output parameters are available to generate charts and spreadsheets. Without re-computation, the output format can be altered. Charts and spreadsheets can be copied into any Windows document or saved into a file. For maximum compatibility the spreadsheet module supports Microsoft Excel file format. A Mission Computation supports mission definition and calculation. More than 20 mission segments can be combined in any order. Several optimizer modes evaluate maximum range, maximum endurance or maximum radius of action. Mission progress for user-defined time steps and output parameters is printed onto a spreadsheet or visualized on a chart. 3 APP 6.0 - Aircraft Performance Program User Manual Mission 12000 10000 No Header Text 8000 Take-Off (Military) Acceleration (Military) 6000 Climb (Military) Cruise (Military) Acceleration (Military) 4000 Climb (Military) Maneuvre (Military) 2000 Descent (Military) 0 0 200 400 600 800 1000 1200 1400 1600 1800 2000 Time [sec] Fig 3: Graphical result of a mission computation G-Envelop 18000 16000 14000 12000 10000 8000 6000 4000 2000 0 0.0 0.2 0.4 0.6 0.8 1.0 1.2 1.4 1.6 1.8 Mach [-] Fig 4: Graphical Result of a Point Performance computation 4 APP 6.0 - Aircraft Performance Program User Manual 1.1.5 How to Contact ALR Postal Address: Phone: +41 (0)44 202 93 88 Arbeitsgruppe für Luft- und Raumfahrt Fax: +41 (0)44 202 24 00 Gotthardstrasse 52 CH-8002 Zurich Switzerland Website: www.alr-aerospace.ch Email: [email protected] 1.1.6 Getting Help Choose Help|Online Manual from the APP menu to open this manual in an Acrobat Reader shell. Choose Help|Technical Reference from the APP menu to open the technical reference document in an Acrobat Reader shell. 5 APP 6.0 - Aircraft Performance Program User Manual 1.2 Installation 1.2.1 Hardware and Software Requirements To use APP 6, your computer must have: Windows XP SP2 or higher operating system A Intel or compatible CPU A hard disk with about 20 MB of available disk space At least 64 MB of extended memory to run APP 6 smoothly A Windows-compatible mouse A minimum screen resolution of 1024x768 pixel, however a higher resolution is strongly suggested. 1.2.2 Installing APP on the Hard Disk 1. To start the installation, insert the program CD-ROM into your drive. An installation mask should automatically appear (if not, start it by double clicking the autorun.exe located on the CD-ROM). Fig 5: Installation Screen 2. Install the device drivers for the software protection key WIBUKey by pressing the corresponding button. 3. Install the professional version of APP 6 by pressing the corresponding button. 6 APP 6.0 - Aircraft Performance Program User Manual 4. The installation software will lead you through the installation process. The installed program creates the „Aircraft Performance Program“ program group. This group is found in the start menu and contains the APP executable file. APP creates a folder “ALR Aerospace” in your User/AppData folder to save user settings, and a folder “APP 6 Professional Edition/Examples” in your document folder. Consider that you cannot run APP without installing and connecting the WIBU protection key first, as described in the next chapter. 7 APP 6.0 - Aircraft Performance Program User Manual 2 Working with APP 2.1 Overview This section will guide you through some examples of calculations possible with APP. It will show you how to load existing aircraft data from the examples provided with APP, demonstrate how to create performance results and explains the APP aircraft data model. APP differentiates between performance charts (point performance) and mission performances. A point performance is flown at an imaginable single point in time, characterized by a clearly defined fuel mass, whereas mission performances are flown in the context of a mission (climb, accelerate, cruise, …). Mission performance calculations take into account the steadily changing fuel mass over time. Section 2.2 provides a quick start tutorial, showing you how to calculate an existing mission and generate a performance chart. 2.2 Getting Started When you start up APP for the first time, you are greeted with a welcome screen. You can always show the Welcome screen again by pressing the APP Welcome button in the toolbar. The welcome screen is the easiest way to open APP files, and create new performance calculations. Fig 6: Welcome Screen APP uses three main file types: 8 APP 6.0 - Aircraft Performance Program User Manual Name File Extension Aircraft *.actf Mission Computation *.mis Performance Charts *.perf Icon Each button on the welcome screen gives you the option to either create a new file, or load an existing file. 2.2.1 Mission Computation Start APP, then click on the button Mission Computation, Open on the welcome dialog. A file dialog box opens. Navigate to the APP examples folder on your PC. You can find the folder in your Documents folder, under APP 6 Professional Edition/Examples/. Open the folder Light-Weight Fighter and load the file LWF Ferry.mis. You should be presented with the following screen: Fig 7 Mission Computation Screen For the impatient: Click on the Run Computation button in the toolbar to run the computation and immediately see the mission profile appear in the <Result (Chart)> tab. 9 APP 6.0 - Aircraft Performance Program User Manual The vertical list on the left shows you the available tabs of the opened file. The individual tab pages let you change settings, perform computations and view results. Currently, the tab <Description> is active and corresponding entry in the tab list is highlighted. On the top, you can see the horizontal file tabs. Now, only the tab for our LWF Ferry.mis file is visible, together with the red mission computation icon. Now click on the tab <Select Aircraft>. This page shows you the loaded aircraft file, in this case the generic Light-Weight Fighter (LWF) example aircraft form ALR. Fig 8: Mission Computation Settings Tab The next tab, <Settings>, shows the initial configuration and the state of your aircraft (Fig 8). In the drop down menu Configuration, you select the basic aircraft configuration. The configuration determines for example the maximum payload the aircraft can carry and the maximum fuel capacity. The first three fields set the start point of your mission. This can be at either at an airport, where the Altitude Field stands for the departure airport altitude, or it can be already in-flight. In latter case, you need to define your initial speed, using either the Mach or the Velocity field. Note: If your start your mission in-flight, make sure that the selected velocity corresponds to a valid flight state. If the velocity is chosen to small, the aircraft will stall, and if it’s chosen too high, the aircraft will break apart. In either case, the computation will not start correctly. The next fields, Fuel Percent and Fuel Mass, you set the initial fuel load. A value of 100% corresponds to total fuel including the available external fuel tanks (if present in the selected external stores configuration). The Payload field lets you select the percentage of payload. This value stays constant over the duration of your mission. A payload can either be passengers, cargo, or special mission equipment. To see how much payload your aircraft can carry, select type 100 into the field and watch the difference in the field Mass. This field shows your take-off mass, including fuel, payload and the mass of external stores (if selected). 10 APP 6.0 - Aircraft Performance Program User Manual Note: Be careful to set plausible values for Fuel Percent and Payload. An empty tank will come to your attention rather quick, as APP cannot fly an aircraft without fuel. But you may only notice much later in some too optimistic performance figures that your aircraft is flying along without any payload. If you prefer to enter values in the British system, switch the unit system from [2] to [1] using the unit buttons in the toolbar, or selecting the menu View | Unit 1 Having completed the <Settings> tab with the initialization data, switch to the <Segment List> tab (Fig 8). Fig 9 Mission Computation Segment List Tab You can see that the mission is made out of 5 segments. The black triangle next to the segment Takeoff denotes that this is the currently selected segment. All the data on the right side corresponds to that segment. The segment end condition is shown under Segments stops at. If that condition is reached, APP switches to the next segment. For the Takeoff segment, APP will automatically determine a stop condition. If you click on the Climb at Mach segment, you will see that the stop condition is Altitude > 11000m. When the aircraft reaches 11000 Meters, the climb segment stops, and the Cruise at Mach segment starts. The first flight state of a new segment is always the last state of the previous segment. That means the cruise segment will be calculated at a Mach number of 0.8, set by the stop condition in segment 2) Acceleration) and at an altitude of 10000m, set by segment 3) Climb at Mach. 11 APP 6.0 - Aircraft Performance Program User Manual Note: While it is possible to select any kind of stop condition, the user is ultimately responsible that the choice made is logical and feasible for the aircraft to fly. For example, descending to an altitude that is higher than the current altitude will lead to an error. Also, climbing to an altitude that is higher than the aircraft’s ceiling altitude will eventually lead to an error, because the aircraft will run out of fuel trying to unsuccessfully climb to that altitude. Now, click on the <Computation> tab (Fig 10). Fig 10 Mission Computation Tab The Computation box provides two computation modes, Single Mission and Parameter Study. The Single Mission selection calculates one mission profile. The more advanced Parameter Study calculates a range of mission based on varied parameters (specified in the <Adv. Computation> tab). The tabs on the right side provide options for the computation. The optimizer is useful to automatically change the stop condition of a segment in order to reach a target fuel value at the end of a mission, e.g. “cruise for X nautical miles, so that at the end of the mission, there is 5% fuel left”. The optimizer will then determine X. Note: The optimizer does not change the flight condition (speed, altitude) of the aircraft. To optimize these parameters, choose segments such as Climb at best rate, or Cruise at best SR Now click the Run button, or press the Run Computation button in the toolbar. After a short moment, the computation should be. APP outputs results in two ways: in tabulated and in graphical form. These can be found in the tab <Result (Sheet)> and <Result (Chart)>, respectively. Fig 11 Mission Computation SheetFig 11 shows the sheet tab. The first drop down box lets you control the level of detail, from a description of the mission (Mission Description) 12 APP 6.0 - Aircraft Performance Program User Manual up to an output of values at each computed time step (Detailed Output). The default selection, Brief Output, shows computed values at the beginning and end of each segment. The second drop down box controls the selection of output values, by loading predefined lists. Note: To change the number of displayed output values, open the options dialog (either through the toolbar button , or by choosing View | Options. Open the tab <Mission Param.> and add or remove desired values from the list on the right side. The list on the left side shows all the available output values. If you would like to save the list for future use, press the Save button. Your saved list will now also appear in the second drop down box in the <Result (Sheet)> tab. When you are done, just close the options dialog, and the sheet will adapt immediately to the new output values without having to recalculate the mission. Fig 11 Mission Computation Sheet Fig 12 shows the <Result (Chart)> tab. 13 APP 6.0 - Aircraft Performance Program User Manual Fig 12 Mission Computation Chart There are multiple ways to store your results. The sheet and chart can each be saved in the APP sheet format file (*.vts) or chart format (*.vtc). Using File | Print, you can save data in PDF format using your preferred PDF printer (must be installed separately). The sheet provides the additional option to export into an Excel or compatible shreadsheet software. Hint: If you would like to extract the numerical values from a chart you can: Click on the chart, then type Ctrl-C (copy). Then use Ctrl-V or paste in a spreadsheet software. Click in a line in the chart to activate it. Then press and hold Ctrl while clicking on the point of interest. APP should display a dialog box showing the value. 2.2.2 Performance Chart Start APP, then click on the button Performance Chart, Open on the welcome dialog. A file dialog box opens. Navigate to the APP examples folder on your PC. You can find the folder in your Documents folder, under APP 6 Professional Edition/Examples/. Open the folder Boeing 747 and load the file Cruise Efficiency Chart.perf. You should be presented with the following screen: 14 APP 6.0 - Aircraft Performance Program User Manual Fig 13 Performance Chart Screen For the impatient: Click on the Run Computation button in the toolbar to run the computation and immediately see the performance chart appear in the <Result (Chart)> tab. The vertical list on the left shows again the available tabs, similar as in the mission computation file. Note: The shown example calculation is of the type Point Performance Computation. Please see Section Error! Reference source not found. for more information about Performance Charts. The user interface for all performance chart calculations is similar. The main differences are usually found on the <Computation> tab, where the parameter for the selected computation have to be specified. Click in the tab <Select Aircraft>. As you can see, this page is identical with the page in the mission computation file. It will now show the 747-100 as the loaded aircraft. Continue to the <Settings> tab. In the settings tab, the state of the aircraft needs to be fully defined. Performance Charts are different from Mission Computations in the way that the state of the aircraft will not change from the values set in the settings page. For example, if you set the Fuel Percent to 100%, all values will be calculated at that mass. If you want to calculate cruise performance, 100% fuel mass is not realistic (since that is only the case at take-off or after an in-flight refuelling). You might want to choose 80% for the beginning of a cruise, 50% for mid-cruise charts, and 20% to calculate end of cruise performance. 15 APP 6.0 - Aircraft Performance Program User Manual Same holds for other values, you need to define Altitude, Mach/Velocity, Payload etc. The values that are being calculated of course depend on the type of computation selected in the <Computation> tab. The Configuration dropdown box shows the configurations the aircraft file provides. The configuration selected here can set your maximum fuel mass, as well as maximum thrust and aerodynamic properties. Make sure you select an appropriate configuration. For example, to perform a cruise computation, make sure that you don’t select a take-off configuration, or if you are performing supersonic computations with a combat aircraft, select a configuration with sufficient (i.e. reheat) thrust. Fig 14 Performance Chart Settings Page Now select the next page, <Computation>. This page is specific for each kind of computation chart. For the example point performance computation, you can see a Select Computation box (Fig 15). The dropdown box Computation defines the equation or flight state to be calculated. Currently, a Cruise computation is performed. The flight states are computed at all the values given in the X-Range and the Parameter tables. No click the Run Button and compare the values in the <Computation> page (Fig 15) with the result shown in the tab <Result (Chart)> (Fig 16). As you can see in the resulting Chart, the values from the X-Range are plotted on the X-Axis, and the Parameter values 16 APP 6.0 - Aircraft Performance Program User Manual correspond to each of the curves. On the Y-Axis, you may select and output value that is of interest to you. Fig 15 Point Performance Computation 17 APP 6.0 - Aircraft Performance Program User Manual Fig 16 Cruise Point Performance Chart 18 APP 6.0 - Aircraft Performance Program User Manual 3 Example Aircraft APP includes example aircraft for selected classes of aircraft. The directory with the APP examples is created during installation of APP. You can find the folder in your Documents folder, under APP 6 Professional Edition/Examples/. 3.1 Airbus A320 Aircraft File: A320.acft Propulsion 2x high bypass turbofan Span 34.10 m Length 37.57 m Wing Area 122.4 m2 OWE 43100 kg Fuel Mass 21480 kg MTOW 73500 kg Configurations: 3.2 Cruise Boeing 747 Aircraft File: Boeing 747-100.acft Propulsion 4x high bypass turbofan Span 59.6 m Length 70.6 m Wing Area 510.967 m2 OWE 358000 lbs Fuel Mass 316300 lbs MTOW 735000 lbs Configurations: Cruise Climb T/O, clean T/O, Flaps 10 T/O, Flaps 20 19 APP 6.0 - Aircraft Performance Program User Manual 3.3 T/O, Flaps 30 Light-Weight Fighter Aircraft File: LWF.acft Propulsion 1x low bypass turbofan Span 8.53 m Length 14.4 m Wing Area 18 m2 OWE 5000 kg Fuel Mass 2000 kg MTOW 8401 kg Configurations: Cruise, Dry Cruise, Reheat TOL, Dry TOL, Reheat 3.3.1 Radius-of-Action vs. Combat Time Chart The example Light-Weight Fighter/LWF Combat Time Variation.mis demonstrates how to model a complex combat mission, including weapons release. The Optimizer mode is set to Radius-of-Action, and the Parameter Study mode will change the time the aircraft spends in combat. As a result, a chart is generated that will plot the combat time on the x-axis and the radius-of-action on the y-axis. 3.4 Light Single Engine Piston Aircraft File: SEP.acft Propulsion 1x piston, constant speed propeller Span 10.38 m Length 8.14 m Wing Area 18 m2 OWE 1001 kg Fuel Mass 151 kg 20 APP 6.0 - Aircraft Performance Program User Manual TOW 1400 kg Configurations: 3.5 Cruise at Best Power Cruise at Best Economy Small UAV Aircraft File: UAV.acft Propulsion 1x piston, fixed pitch propeller Span 5.71 m Length 4.61 m Wing Area 3.4258 m2 OWE 188 kg Fuel Mass 42 kg MTOW 275 kg Configurations: Cruise 21