1
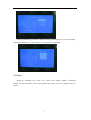
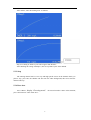
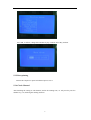
%2'7 User manual Contents 1. Principle of Operation ...................................................................................................................3 2. Specifications ................................................................................................................................3 3. Features .........................................................................................................................................3 4. Unpacking the instrument .....................................................................................................4 5. Operation.......................................................................................................................................4 5.1 Keyboard instruction...........................................................................................................4 5.2 The main interface...............................................................................................................5 5.3 Menu ...................................................................................................................................5 5.3.1 Working Cycle..........................................................................................................5 5.3.2 Start ..........................................................................................................................6 5.3.3 Stop ..........................................................................................................................8 5.3.4 Date aiter ..................................................................................................................8 5.3.5 Data printing.............................................................................................................9 5.3.6 Check Channel .........................................................................................................9 6. Preparation for measurement ......................................................................................................10 6.1 Preparation for experiment...............................................................................................10 6.2 Water sample pretreatment...............................................................................................10 6.2.1 Adjust PH ...............................................................................................................10 6.2.2 Disposing-chlorine .................................................................................................10 6.2.3 Influence of temperature ........................................................................................10 6.3 Inoculation Solution .................................................................................................. 11 6.4 Nutrition Buffer Solution .................................................................................................. 11 6.5 Preparation of the BOD Standard Solution ...................................................................... 11 7. Determination.............................................................................................................................. 11 8. Evaluating the measuring result .................................................................................................12 2 1. Principle of Operation The instrument is designed by the pressure-difference method, simulating the degradation of natural organic matter. 21%of the oxygen in the air on the top of Test Bottle continuously replenish the dissolved oxygen consumed in water, carbon dioxide(CO2)produced in the process of organic matter degradation is absorbed by Sodium hydroxide coming from sealed cap, pressure sensor monitor constantly the pressure change of sample bottle. There is a correlation between Biochemical Oxygen Demand BOD (correspond to the consumption of oxygen in the test bottle ) and Gas Pressure, the instrument deal with such relevance, display directly Biochemical oxygen demand BOD value on the screen. 2. Specifications BOD7-5 Tester Range 0 to 35, 0 to 70, 0 to 350, 0 to 700 mg/L(without dilution) 700 to 4000 mg/L(need to dilute). Dimension(L x W x H) 31 x 30 x 14 cm Sample Quantity 6 x 500ml Weight 5Kg Temperature 20℃±1℃ Accuracy ±5% Repeatability ≤5% Resolution 0.1 mg/L (0–35, 0-70) 1mg/L (0–350, 0-700) * The minimum dimension requirements of Biochemical incubator: 35 x40 x35 cm 3. Features ●Display the trend curve ●Printer output ●Ling to the PC through USB interface ●Mercury-free devices to ensure the accuracy and safety of the BOD measurement ●Real-time clock display ●Automatic collection and storage of data ●BOD curve for a user to view 3 ●Link to the computer to print process curves ●No parameter and data loss after suddenly electricity cut-off ●LCD humanization interface display, easy to learn, easy to operate ●1-30 days of the testing time, setting by the keys ●Store data and update the result, observe the change rate of BOD in the screen during any testing time, store 240 data points and 20 groups data of each sample. ●Conform to the standards for environmental protection HJ 505-2009 4. Unpacking the instrument Check each component according to the following list. . BOD7-5 Tester 1 x Power line 1 x Communication cable 1 x CD 6 x Seal Plunger 6 x Sample bottles 6 x Magnetic Stirrer 1 x Sampling spoon for potassium hydroxide particle 5. Operation 5.1 Keyboard instruction Channel selection key 1-6 According to the relate channel selection key, display Data corresponding to the 6 sample bottles Up or Down arrow key Selection function key, set addition and subtraction Menu Menu key, press this key to select “Starting Work”, “Data Printing”, “Working Cycle”, “System Date”. Esc Cancel and Back OK Perform a confirming operation 4 5.2 The main interface Display interface after starting up the instrument (In the running state, the background of No1 to No 6 is white) 5.3 Menu Press “Menu”,display “Choosing menu”, you can select “Start”, “Data Printing”, “Working Cycle”, “Date aiter”, “Stop” and “Language”. The selection menu interface as follows: 5.3.1 Working Cycle Press “Menu”,display “Choosing menu”, the cursor located in “Start” at this moment, press “Down Arrow” until “Working Cycle”, Press OK. Through Up or Down Arrow keys to select a working cycle, can be set to 5day, 7day or 10 day, press Ok to finish setting. 5 Setting up Working Cycle must be ahead of setting up Starting Work. If you set up Starting Work firstly, Working Cycle will not able to set up, interface as following: 5.3.2 Start Setting up “Working Cycle”, then set up “Start”. Press “Menu”, display “Choosing menu”, the cursor located in “Start” at this moment, press OK, select No 1 channel. Picture as follows: 6 Press OK, display the range selection, select the range by Up or Down Arrow Key. For example, select 350mg/L, as follows: Press OK, finish the starting work for Sample 1 channel, start to work. As follows: There is an hour’s delay here. 7 After an hour, enter the running state. As follows: Stop, no working or finish a cycle will be appear this interface. After finishing the setting of Sample 1, then set up others by the same method. 5.3.3 Stop The running channel can be set to stop. Through put the cursor on the channel which you plan to stop, press OK, the channel will turn into the white background, this tell us that the channel will stop. 5.3.4 Date aiter Press “Menu”, display “Choosing menu”, the cursor located in “Start” at this moment, press “Down Arrow” until “Date aiter”. 8 Press OK, as follows, change date and time by Up or Down Arrow Key and OK. 5.3.5 Data printing Connect the computer to print each channel process curve. 5.3.6 Check Channel After finishing the setting of each channel, and in the running state, we only need to press the number key (1-6) checking the running situation. 9 6. Preparation for measurement 6.1 Preparation for experiment 6.1.1 When you start to do the experiment, make sure that biochemical incubator is switched on the power supply ahead of 8h, and normal operation under20℃ constant temperature. 6.1.2 In the case of constant temperature, put dilution water, dilutial water and inoculative dilution water into the incubator for reserve 6.2 Water sample pretreatment 6.2.1 Adjust PH If the sample or diluted sample PH isn’t in the range of 6-8, using 0.5mol/L hydrochloric acid solution or 0.5mol/L sodium hydroxide solution adjust PH to 6-8. The preparation of hydrochloric acid solution(0.5mol/L):put 40ml(ρ=1.18g/ml) hydrochloric acid into water, diluted to 1000ml. The preparation of sodium hydroxide solution(0.5mol/L):put 20g sodium hydroxide into water,diluted to1000ml. 6.2.2 Disposing-chlorine Usually place the sample water containing small amount of free chlorine 1-2 hours, free chlorine can disappear. For the sample water, free chlorine can not disappear in a short period, by adding right amount sodium sulfite solution, to remove the free chlorine. 6.2.3 Influence of temperature In order to expel the supersaturation dissolved oxygen in water, the sample water from a lower temperature water or eutrophic lake should heating up to 20℃ rapidly, or cause the result on the low side. The sample water from high temperature water or wastewater outfall should cool down to 20℃ rapidly, or cause the result on the high side. 10 6.3 Inoculation Solution If the sample being tested itself does not contain sufficient adaptability of microorganism, taking following measure to obtain inoculating water. Inoculation temperature should be around 20±l℃. City sewage, usually use residential area sewage, after filtering, placed in the 20℃ incubator for a day, take supernatant as inoculating water. The sample from the outlet of biochemical treatment structure. When industrial wastewater contain refractory organics, take the sample from discharge outlet 3-8Km downstream as inoculating water; If no such water source, take domestication strains measure to culture inoculating water adapting to the sample being tested in the lab, we suggest to adopt the following method: take the neutralization or appropriate dilution of the sample for continuous aeration, add a small amount of fresh water every day, at the same time, add amount of surface soil, garden soil or sewage, make the microorganism adapting to the water large number of propagation. When appear large flocculus in the water, or there is a mutation on the chemical oxygen demand decreased value, which indicate adaptive microorganism have been propagated, be used as inoculating water. Generally, the domestication process take 3-8days. 6.4 Nutrition Buffer Solution We offer the user compound nutrition buffer reagent, the user also can prepare the nutrition buffer solution by themselves, the cost can be reduced. Method of preparing can refer to HJ505-2009---<Water Quality Biochemical Oxygen Demand of 5 Days (BODT_5) Determine Dilution and Inoculation Method > 6.5 Preparation of the BOD Standard Solution Under the temperature of 103℃ , drying the anhydrous glucose(C6H12O6)and glutamate (HOOC-CH2-CH2-CHNH2-CHOO)for one hour, take each 150mg dissolved in the distilled water, diluted to the graduation line in 1000ml volumetric flask, the solution concentration is 210±10mg/L at the moment, they are prepared when needed. The solution can also be a small amount of cryopreservation, immediately use after melting. 7. Determination Make the sample heat or cool to 20±1℃, according to the following table, put sample water, inoculation solution, nutrition buffer solution, nitrification inhibitor into the sample bottle, then add the distilled water to the total capacity graduation line. Put the potassium hydroxide into the seal cup(through the four holes on seal cup carbon dioxide contact with 11 potassium hydroxide particles), put seal cup into the bottle mouth, make the bottle mouth completely seal, then put the BOD test bottle into the measuring instrument, tighten the bottle cap, put into constant temperature incubator, turn on power supply to determine, with the change of time, appear a curve on the display, the curve can be directly read out the BOD value at different time. Range(mg/L Sample Water(ml) 0---35 0---70 0---350 0---700 370 305 110 45 Inoculation solution 10 to 35(remark1) adding amount(ml) Nutrition buffer solution 1 adding amount(particles) 1(remark3) Nitrification inhibitor Total volume(ml) 420 355 160 95 Dilution factor 1.14 1.16 1.45 2.11 Potassium hydroxide 2 adding amount (particles) Remark: 1) Generally, add 20ml inoculation solution, Necessary to adjust the amount of inoculation solution, so as to obtain the best result. 2)If the water sample to be tested in itself contains sufficient microorganisms, You can not join the inoculation solution, and the sample volume is the total capacity, dilution factor is 1. 3) If a sample contains nitrifying bacteria, maybe occur nitration reaction, need to add a nitrification inhibitor. Correction Result:BOD correction value= BOD instrument reading × Dilution factor 8. Evaluating the measuring result A curve by daily measured value, intuitively indicating the biochemical effect, according to the curve, we can make a reasonable judgment, as follow: 12 Curve 1 ----Select the smaller measuring range. When the sample BOD range is unknown, according to the determined value of the total organic carbon (TOC), permanganate index (IMn) or chemical oxygen demand (CODCr), and according to the ratio of BODT5 and TOC, IMn or CODcr on the following table, estimate BODT5 expected value. Water type BODT5/TOC Untreated wastewater 1.2---2.8 1.2---1.5 0.35---0.65 0.3---1.0 0.5---1.2 0.20---0.35 Biochemical treatment wastewater BODT5/IMn BODT5/CODcr Curve 2 ----the curve indicates the beginning of nitrification. Usually, after 5 days, typical wastewater occur organic nitrogen biological oxidation. The development of nitrifying bacteria is slower than other types of bacteria. However, some samples contain a high concentration nitrifying bacteria will cause very fast nitrification phenomenon. Adding one 13 nitrification inhibitor ally thiourea can control the nitrification problem. Curve 3 ---- If the sample water can not contain enough bacteria, or lack of regulation, means biochemical process lag, need to increase the inoculation solution. Curve 4 ----The negative at the beginning, indicating the sample of initial temperature is lower than the limited range(20 ± 1 °C). Oxygen supersaturated samples will also show this curve Curve 5 ----the curve indicates there is a leak. If the leak is slight, oxygen consumption curve trend is not obvious, the error is large. If there is such a reaction, please check whether the sealing cup and the sample bottle are polluted or damaged. 14


![IDVisor Hardware User Manual [Rev 1.1]](http://vs1.manualzilla.com/store/data/005787323_1-ba2f62bd59c5cdea456b5da531a1d222-150x150.png)