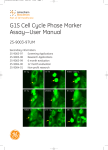
1
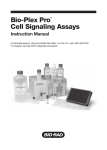
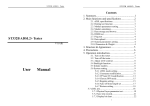
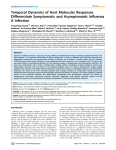
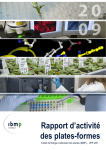
GE Healthcare
EGFP-STAT3 Assay
Product User Manual
Codes:
25-8010-38
25-8010-39
25-8010-40
25-8010-41
Page finder
1. Introduction
1.1. STAT3
1.2. EGFP-STAT3 assay
3
3
4
2. Licensing considerations
2.1. Right to use
2.2. Legal
6
6
6
5.4.7. Effect of different assay media
5.4.8. Effect of serum starvation
5.4.9. Effect of using DRAQ5 nuclear stain
5.4.10. Fixed Assay
5.4.11. AG490 imhibition curve
5.4.12. Results obtained on the IN Cell Analyzer
1000
3. Product contents
8
3.1. Component summary
8
3.2. BHK derived cell line expressing EGFP-STAT3 fusion
protein - NIF2027
8
3.2.1. BHK derived parental cell line
8
3.2.2. BHK derived EGFP-STAT3 expressing cell line 8
3.3. EGFP-STAT3 expression vector - NIF2028
8
3.4. Materials and equipment required
9
3.5. IN Cell Analysis System
9
3.5.1. IN Cell Analyzer 3000
9
3.5.2. Nuclear Trafficking Analysis Module
9
3.5.3. IN Cell Analyzer 1000
9
3.6. EGFP-STAT3 translocation assay on epifluorescence
microscopes
10
3.7. Software requirements
10
4. Safety warnings, handling and precautions
4.1. Safety warnings
4.2. Storage
4.3. Handling
4.3.1. Vector
4.3.2. Cells
11
11
12
12
12
12
5. Cell assay design
5.1. Culture and maintenance of BHK derived EGFPSTAT3 expressing cell line
5.1.1. Tissue culture media and reagents required
5.1.2. Reagent preparation
5.1.3. Cell thawing procedure
5.1.4. Cell subculturing procedure
5.1.5. Cell seeding procedure
5.1.6. Cell freezing procedure
5.1.7. Growth characteristics
5.2. Assay set up
5.2.1. Live cell EGFP-STAT3 assay using the IN
Cell Analyzer 3000
5.2.2. Microplate set up for 96 well format assays
5.2.3. Schematic agonist assay protocol
5.2.4. Agonist assay protocol (96 well format)
5.2.5. Fixed cell assay format
5.3. Results
5.3.1. Calculating the Z’-factor
5.3.2. Example results
5.4. Assay characterization
5.4.1. Translocation index
5.4.2. Summary of quantitative assay parameters
5.4.3. Seeding density
5.4.4. IL-6 dose response
5.4.5. Time course
5.4.6. Sensitivity of assay to DMSO, ethanol, and
methanol
13
25-8010-38UM
Pagefinder,
Rev B, 2006
22
22
23
23
23
24
6. Vector use details
6.1. General guidelines for vector use
6.2. Transient transfection with pCORON1000
EGFP-STAT3
6.3. Stable cell line generation with pCORON1000
EGFP-STAT3
25
25
25
7. Quality control
7.1. EGFP-STAT3 cell line
7.2. EGFP-STAT3 expression vector
26
26
26
8. Troubleshooting guide
27
9. References
28
10. Related products
30
11. Appendix
11.1. Appendix A: Restriction map of pCORON1000
EGFP-STAT3
31
25
31
13
13
13
14
14
15
15
15
16
16
16
16
17
17
18
18
18
19
19
19
20
20
20
Front cover:
Top image: BHK cells expressing the EGFP-STAT3 fusion
protein 25 minutes after the addition of control buffer only.
Bottom image: BHK cells expressing the EGFP-STAT3 fusion
protein 25 minutes after stimulation with agonist (30 ng/ml
IL-6).
Images shown are 1/14th of the actual image size acquired
by the IN Cell Analyzer 3000.
BioImage is a Danish Biotech company specializing in
developing drug candidates that exert their activity through
modulation of protein translocation. For more information,
visit their Web site at www.bioimage.dk
21
2
1. Introduction
1.1. STAT3
Signal transducers and activators of transcription (STATs) are a family of latent
transcription factors that are activated in response to binding of polypeptide
signalling molecules to cell membrane receptors. Activated STAT proteins form
dimers that translocate to the nucleus, where they bind to promoter regions
in target genes and ultimately modify the pattern of gene expression (1, 2, 3,
4). Seven mammalian STAT genes have been identified in three chromosomal
clusters (5). The encoded proteins (STAT1, STAT2, STAT3, STAT4, STAT5a, STAT5b
and STAT6) are activated by distinct sets of cytokines and growth factors, and
each STAT protein activates a distinct set of target genes. STAT proteins were
initially described in the context of cell signalling, where they contribute to such
diverse processes as development, differentiation, proliferation and apoptosis (1,
2). Increasingly a role for STAT proteins, particularly STAT3, in transformation and
tumor progression is being defined (6).
STAT3 was first described as a DNA-binding activity, isolated from IL-6 stimulated
hepatocytes, that was capable of selectively binding to an enhancer element in
the promoter of acute phase genes (7, 8). In fact, given the correct physiological
context STAT3 is activated not only by IL-6, but by the entire family of IL-6-type
cytokines including IL-11, leukemia inhibitory factor, ciliary neurotrophic factor,
oncostatin M, cardiotrophin-1 and cardiotrophin-like cytokine (9). Non-cytokine
ligands such as epidermal growth factor, hepatocyte growth factor, platelet
derived growth factor, granulocyte colony-stimulating factor and leptin have all
been shown to activate STAT3 (3, 10). Upon stimulation of cell surface receptors,
STAT3 proteins are recruited to activated receptors through an interaction between
the STAT3 src homology 2 (SH2) domain and phosphotyrosine docking sites on the
receptors’ intracellular domains. Subsequently, STAT3 is phosphorylated at a single
site close to the carboxy-terminus (Tyr705) either directly by the receptor kinase or
indirectly by a receptor associated Janus kinase (Jak).
Following phosphorylation, STAT3 forms a dimer in which the SH2 domain of one
STAT3 molecule binds to the phosphorylated Tyr705 of the other and vice versa.
The STAT3 dimer then translocates through the cytoplasm to the nucleus (4). The
processes by which this occurs are poorly understood although receptor-mediated
endocytosis may be involved (11). Within the nucleus, STAT3 dimers recognize and
bind an 8–10 base pair inverted repeat DNA element with a consensus sequence
5’TT(N4–6)AA-3’ commonly referred to as a GAS element (IFN-g-activated sequence)
and initiate a change in transcription (2).
In mammalian cells the time scale for STAT activation and nuclear import is
typically in the range of 5–60 minutes following stimulation. During the subsequent
period of signalling decay STATs are exported from the nucleus back to the
cytoplasm; in the case of STAT3 this event is dependent on multiple nuclear
export signals (12). As would be expected, STAT signalling is highly regulated and
several regulatory processes are involved, although the complete pathway for
individual STATs remains unclear. Deactivation of signalling from the cell surface
can occur by degradation of the receptor-ligand complex via the ubiquitinproteosome pathway (13) and through the induction of the suppressor of cytokine
signaling (SOCS) family of proteins, which inhibit Jaks (14). Further, a number of
phosphatases, acting either at the receptor or at the receptor associated Jak, can
lead to a cessation of STAT signalling (15, 16). The STAT proteins themselves can
also be dephosphorylated by specific phosphatases in both the cytoplasmic and
nuclear compartments (17, 18). Protein inhibitors of activated STATs (PIAS) bind to
STAT dimers in the nucleus preventing DNA recognition (19).
Structurally, STAT3 is similar to other STAT proteins and has four main domains (Fig
1.1). The first, an amino-terminal oligomerization domain, is involved in stabilizing
STAT3 dimer-DNA interactions. An 18 amino-acid flexible polypeptide chain (coiled25-8010-38UM
Chapter 1,
Rev B, 2006
3
coil region) links the oligomerization domain to the DNA-binding domain, which
confers binding specificity. The SH2 domain, which is the most highly conserved
STAT domain, is necessary for receptor recruitment, association with activating
JAKs and STAT3 dimerization. Finally, the carboxy-terminal transactivation
domain is involved in transcriptional regulation of target genes. In addition to
phosphorylation within the dimerization domain at Tyr705, phosphorylation of
Ser727 within the transactivation domain appears to contribute to maximal
transcriptional activity of STAT3, possibly by enhancing the recruitment of
transcriptional cofactors (20, 21).
Coiled-coil
Linker
Oligomerization
DNA binding
SH2
Y
Dimerization
S
Transactivation
Fig 1.1. Schematic showing major
structural features of STAT3 including
conserved tyrosine (Y) and serine (S)
phosphorylation sites.
STAT3 appears to regulate different genes in different cell types. For example, its
induction of the anti-apoptopic gene Bcl-2 in B cells results in cell proliferation,
while it’s down regulation of c-myc and c-myb and induction of junB and IRF-1 in
monocytic cells are linked to cell differentiation and growth arrest (22). Defining
other functions for STAT3 has been somewhat difficult since STAT3 knockout mice
die early in embryogenesis (23); it has been postulated that STAT3 is involved
in providing nutritional support to the implanted blastocyst. Experiments using
mice in which STAT3 is ablated in a specific tissue or cell lineage have shown an
involvement of STAT3 signalling in IL-6 dependent T cell proliferation (24), skin
remodeling (25), deactivation of macrophages and neutrophils (26), motorneuron
survival following axotomy (27) and mammary gland involution upon forced
weaning (28). STAT3 signalling has recently been shown to be involved in leptin
induced melanocortin production and body energy homeostasis (29) making it an
attractive therapeutic target for the control of obesity.
Since the discovery that STAT3 is constitutively phosphorylated in v-srctransformed cells, there is increasing evidence that aberrant STAT3 signalling is
involved in oncogenesis. In particular, STAT3 is associated with cancers of the head,
neck and breast, and with multiple myelomas, leukemias and lymphomas (6). Thus
the STAT3 signalling pathway is an attractive target for therapeutic intervention in
a number of human cancers.
1.2. EGFP-STAT3 assay
A cell-screening assay examining the STAT3 signalling pathway (Fig 1.2.) has been
developed. The assay is based on Redistribution™ technology and quantifies
the intracellular location of a EGFP-STAT3 fusion protein in a stably transfected
mammalian cell line. The STAT3 Redistribution assay monitors translocation of
EGFP-STAT3 from the cytoplasm to the nucleus of cells stimulated with IL-6
Fig 1.2. Schematic of the STAT3
signalling pathway (provided with
permission from BioCarta, www.
biocarta.com).
Cytokines
Extracellular
Cytoplasm
P
P
JAKs P
P
TYK2
Tyr7
P
STAT3
STAT3
P
Tyr7
mTOR
STAT3P
STAT3
P
MAPK
P
P
DNA
Ser7 STAT3 P Transcription
P STAT3
Nucleus
25-8010-38UM
Chapter 1,
ISRE/GAS
Rev B, 2006
4
(Fig. 1.3.). This assay is optimized for image acquisition and analysis on the IN Cell
Analyzer 3000, using the Nuclear Trafficking Analysis Module, although the assay
can also be imaged on the IN Cell Analyzer 1000 and other subcellular imaging
systems. Using the recommended assay format, IL-6 has an EC50 value of
19.4 ng/ml.
Fig 1.3. Agonist-induced redistribution
of EGFP-STAT3 from the cytoplasm to
the nucleus.
Agonist,
25 minutes
Un-stimulated cell:
Majority of EGFP-STAT3
localized in cytoplasm .
25-8010-38UM
Chapter 1,
Rev B, 2006
Stimulated cell:
EGFP-STAT3
redistributes to nucleus .
5
2. Licensing
considerations
2.1. Right to use
Use of this assay is limited as stated in the terms and conditions of sale. These
vary in accordance with the product code purchased.
Description
Product Code
EGFP-STAT3 Assay, Screening applications
25-8010-38
EGFP-STAT3 Assay, Research applications
25-8010-39
EGFP-STAT3 Assay, 6 month assay evaluation
25-8010-40
EGFP-STAT3 Assay, 12 month assay evaluation
25-8010-41
The assay was developed in collaboration with BioImage A/S and sold under
license from:
BioImage A/S under patents US 6172188, US 5958713, US6518021, EP851874,
EP0815257, EP0986753 and other pending and foreign patent applications; and
Invitrogen IP Holdings Inc (formerly Aurora Biosciences Corporation) under US
patents US 5625048, 5777079, 5804387, 5968738, 5994077, 6054321, 6066476,
6077707, 6090919, 6124128, 6319969, 6403374 European patent 1104769 ,
0804457 and Japanese patent JP 3283523 and other pending and foreign patent
applications; and
Columbia University. This product is sold under license from Columbia University
under US patents. 5491084 and 646826. Rights to use this product, as configured,
are limited to internal use for screening, development and discovery of therapeutic
products; NOT FOR DIAGNOSTIC USE OR THERAPEUTIC USE IN HUMANS OR
ANIMALS. No other rights are conveyed; and
University of Florida Research Foundation under patents US 5968750, 5874304,
5795737, 6020192 and other pending and foreign patent applications; and
Iowa Research Foundation. The CMV promoter is covered under US patents
5168062 and 5385839 and its use is permitted for research purposes only. Any
other use of the CMV promoter requires a license from the University of Iowa
Research Foundation 214 Technology Innovation Center Iowa City IA52242 USA;
and
Osaka University under US patents 5,719,042 , 5,844,082, CA patent 2145969, CN
patent 1073157 and other pending and foreign patent applications.
The exact terms of use for the product as configured are specified in the Terms
and Conditions of Sale accompanying the product, but are limited to internal use
for development and discovery of therapeutic products. No rights other than those
expressly granted are conveyed.
2.2. Legal
GE and GE monogram are trademarks of General Electric Company.
Cy is a trademark of GE Healthcare companies.
BioImage and Redistribution are trademarks of BioImage A/S
Biocarta is a trademark of Biocarta Inc
FuGENE is a trademark of Fugent, LLC
Microsoft is a trademark of Microsoft Corporation
25-8010-38UM
Chapter 2,
Rev B, 2006
6
Hoechst is a trademark of Aventis
Geneticin is a trademark of Life Technologies Inc
DRAQ5 is a trademark of Biostatus Limited
© 2006 General Electric Company – All rights reserved.
GE Healthcare reserves the right, subject to any regulatory and contractual
approval, if required, to make changes in specification and features shown herein,
or discontinue the product described at any time without notice or obligation.
Contact your GE Healthcare representative for the most current information and a
copy of the terms and conditions
http//www.gehealthcare.com/lifesciences
GE Healthcare UK Limited
Amersham Place Little Chalfont Buckinghamshire HP7 9NA UK
25-8010-38UM
Chapter 2,
Rev B, 2006
7
3. Product contents
3.1. Component summary
• BHK derived cells expressing the EGFP-STAT3 fusion protein (two vials, each
containing 1 ml and 1 x 10⁶ cells) - NIF2027
• pCORON1000 EGFP-STAT3 expression vector (one vial containing 10 μg DNA, at a
concentration of 250 μg/ml, supplied in TE buffer: 10 mM Tris, 1 mM EDTA pH 8.0)
- NIF2028
• User manual
3.2. BHK derived cell line expressing EGFPSTAT3 fusion protein - NIF2027
3.2.1. BHK derived parental cell line
The parental cell line BHK-21 (C-13) (ATCC CCL-10) was derived from the kidneys
of five unsexed, one-day-old hamsters (30). Following 84 days of continuous
cultivation, interrupted only by an eight-day preservation by freezing, clone 13 was
initiated by single-cell isolation (31).
3.2.2. BHK derived EGFP-STAT3 expressing cell line
BHK-21 cells were transfected with the pCORON1000 EGFP-STAT3 vector (supplied)
using the FuGENE 6 transfection method according to the manufacturer’s
instructions. A stable clone expressing the recombinant fusion protein was
selected using 1 mg/ml Geneticin for approximately two weeks. The isolated clone
was chosen at passage 12 and grown for a further 10 passages before being
sorted using a FACS machine. Following sorting, the cells were grown for a further
8 passages before freezing. The cells have been tested and found to be negative
for mycoplasma, bacteria and yeast (testing details available on request).
3.3. EGFP-STAT3 expression vector - NIF2028
The 8.493 kb plasmid, pCORON1000 EGFP-STAT3, contains a bacterial ampicillin
resistance gene and a mammalian neomycin resistance gene (see Fig 3.1.) The
sequence of the construct is available on a CD, upon request. Please e-mail
[email protected]
A detailed restriction map is shown in chapter 11, appendix A.
Fig 3.1. Vector map of the supplied
EGFP-STAT3 expression vector.
Bsr GI (97)
C MV enhancer
PvuI (665)
CMV promoter
Hind III (757)
Ampicillin resistancegene
Chimeric intron
PvuI (7220)
T7 promoter
EGFP
BamHI (6407)
Synthetic poly A
pCORON1000-EGFP-STAT3
8493 bp
Bsr GI (1817)
Neomycin resistance gene
Bam HI (2992)
Hin dIII (5435)
SV40 minimum origin of replication
SV40 enhancer /early promoter
STAT3
f1 ori
PvuI (4465)
NotI (4176)
SV40 late polyA
25-8010-38UM
Chapter 3,
Rev B, 2006
8
3.4. Materials and equipment required
The following materials and equipment are required, but not provided.
• Microplates. For analysis using the IN Cell Analyzer 3000, Packard Black 96 Well
ViewPlates (Packard Cat # 6005182) should be used. For assays in 384 well
format, please e-mail [email protected] for recommendations.
• A CASY 1 Cell Counter and Analyzer System (Model TT) (Schärfe System GmbH) is
recommended to ensure accurate cell counting prior to seeding. Alternatively a
hemocytometer may be used.
• Environmentally controlled incubator (5% CO2, 95% relative humidity, 37°C)
• Imager / microscope (e.g. IN Cell Analyzer 3000)
• Laminar flow cell culture bench
• Tissue culture flasks (T-flasks) and pipettes
• Controlled freezing rate device providing a controlled freezing rate of 1°C per
minute
• Standard tissue culture reagents and facilities (section 5.1.1.)
3.5. IN Cell Analysis System
The EGFP-STAT3 assay has been developed and optimized for analysis using the
IN Cell Analyzer 3000, in conjunction with the Nuclear Trafficking Analysis Module.
Please refer to the instrument user manual for details on instrument set up and
the analysis module manual for details on the algorithm settings. The assay can
also be imaged and analyzed with the IN Cell Analyzer 1000 system. For further
information on either of these products, please contact GE Healthcare.
3.5.1. IN Cell Analyzer 3000
The IN Cell Analyzer 3000 is a line-scanning, laser-based, confocal imaging
system, with three high-speed CCD cameras. It has been developed specifically
for performing information-rich cellular assays very rapidly and at high resolution,
enabling high-throughput and high-content testing of drug compounds.
3.5.2. Nuclear Trafficking Analysis Module
The Nuclear Trafficking Analysis Module provides a method to quantify the
movement of target molecules between the cytoplasm and the nucleus in either
direction. The fluorescence intensity of a target molecule in discrete nuclear
and cytoplasmic regions is measured and the ratio of the sampled intensities
calculated as an index of translocation.
3.5.3. IN Cell Analyzer 1000
The IN Cell Analyzer 1000 is a bench top automated microscope system designed
for imaging sub-cellular end-point assays. The systems’ core components are
a Nikon microscope, xenon lamp and high-resolution CCD camera. Additional
optional modules include liquid handling (both compound and reservoir dispense
as well as aspirate) and temperature control to enable imaging live-cell assays
over extended periods and in real-time.
The IN Cell Analyzer 1000 system has a number of complementary analysis
modules, as well as the capability to export images and data into other
commercial analysis packages. The Nuclear Trafficking Analysis Module for the
IN Cell Analyzer 1000 measures nuclear translocation by comparing sampled
fluorescence intensity of the labeled molecule in the nuclear and cytoplasmic
compartments.
25-8010-38UM
Chapter 3,
Rev B, 2006
9
3.6. EGFP-STAT3 translocation assay on
epifluorescence microscopes
For speed of screening and quality of the images obtained, we recommend
performing the EGFP-STAT3 assay on the IN Cell Analyzer systems. However, it is
possible to adapt the assay to be read on alternative imaging platforms.
Laboratory grade inverted epifluorescence microscopes such as the Nikon Diaphot
or Eclipse models or the Zeiss Axiovert model are suitable for image acquisition.
A high-quality objective (Plan/Fluor 40 x 1.3 NA or similar) and epifluoresence
filter sets compatible with GFP and the desired nuclear dye will be required. A
motorized stage with multi-well plate holder and a heated stage enclosure are
also recommended for assays performed on epifluorescence microscopes, and a
suitable software package will be required for image analysis.
3.7. Software requirements
IN Cell Analysis System
Nuclear Trafficking Analysis Modules are available from GE Healthcare for
automated image analysis of the EGFP-STAT3 assay for both the IN Cell Analyzer
1000 and the IN Cell Analyzer 3000. Analyzed data are exported as numerical
files in ASCII format. ASCII format data can be imported into Microsoft™ Excel,
Microsoft Access, or any similar package for further data analysis as desired.
Confocal or epifluorescence microscope
Suitable software will be required for analysis of images acquired on microscopes
other than the IN Cell Analysis systems.
25-8010-38UM
Chapter 3,
Rev B, 2006
10
4. Safety warnings,
handling and
precautions
4.1. Safety warnings
Warning: For research use only. Not recommended or intended for diagnosis of
disease in humans or animals. Do not use internally or externally in humans or
animals.
All chemicals should be considered as potentially hazardous. We therefore
recommend that this product is handled only by those persons who have been
trained in laboratory techniques and that it is used in accordance with the
principles of good laboratory practice. Wear suitable protective clothing such
as laboratory overalls, safety glasses and gloves. Care should be taken to avoid
contact with skin or eyes. In the case of contact
with skin or eyes wash immediately with water
CAUTION! Contains genetically modified material
Genetically modified cells supplied in this package are for use in a suitably
equipped laboratory environment. Users within the jurisdiction of the European
Union are bound by the provisions of European Directive 98/81/EC which amends
Directive 90/219/EEC on Contained Use of Genetically Modified Micro-Organisms.
These requirements are translated into local law, which MUST be followed. In the
case of the UK this is the GMO (Contained Use) Regulations 2000. Information to
assist users in producing their own risk assessments is provided in sections 3.3.1.
and 3.3.2. of ‘The Genetically Modified Organisms (contained use) Regulations 2000’
http://www.legislation.hmso.gov.uk/si/si2000/20002831.htm .
Risk assessments made under ‘The Genetically Modified Organisms (Contained
Use) Regulations 2000’ for our preparation and transport of these cells indicate
that containment 1 is necessary to control risk. This risk is classified as GM Class
1 (lowest category) in the United Kingdom. For handling precautions within the
United States, consult the National Institute of Health’s Guidelines for Research
Involving Recombinant DNA Molecules.
Instructions relating to the handling, use, storage and disposal of genetically
modified materials:
1. These components are shipped in liquid nitrogen vapor. To avoid the risk of
burns, extreme care should be taken when removing the samples from the
vapor and transferring to a liquid nitrogen storage unit. When removing the
cells from liquid nitrogen storage and thawing there is the possibility of an
increase in pressure within the vial due to residual liquid nitrogen being present.
Appropriate care should be taken when opening the vial.
2. Genetically modified cells supplied in this package are for use in a suitably
equipped laboratory environment and should be used only by responsible
persons in authorized areas. Care should be taken to prevent ingestion or
contact with skin or clothing. Protective clothing, such as laboratory overalls,
safety glasses and gloves, should be worn whenever genetically modified
materials are handled.
3. Avoid actions that could lead to the ingestion of these materials and NO
smoking, drinking or eating should be allowed in areas where genetically
modified materials are used.
4. Any spills of genetically modified material should be cleaned immediately with a
suitable disinfectant.
25-8010-38UM
Chapter 4,
Rev B, 2006
11
5. Hands should be washed after using genetically modified materials.
6. Care should be taken to ensure that the cells are NOT warmed if they are NOT
being used immediately. To maintain viability DO NOT centrifuge the cells upon
thawing.
7. Most countries have legislation governing the handling, use, storage, disposal
and transportation of genetically modified materials. The instructions set
out above complement Local Regulations or Codes of Practice. Users of
these products MUST make themselves aware of and observe relevant Local
Regulations or Codes of Practice.
For further information, refer to the material safety data sheet(s) and / or safety
statement(s).
4.2. Storage
The EGFP-STAT3 expressing DNA construct (NIF2028) should be stored at
-15°C to -30°C.
The BHK-derived cells expressing the EGFP-STAT3 fusion protein (NIF2027) should
be stored at -196°C in liquid nitrogen.
4.3. Handling
Upon receipt, the cells should be removed from the cryo-porter and transferred to
a gaseous phase liquid nitrogen storage unit. Care should be taken to ensure that
the cells are not warmed unless they are required immediately. The vector should
be removed from the cryo-porter and stored at -20°C until required.
4.3.1. Vector
After thawing the DNA sample, centrifuge briefly to recover the contents.
4.3.2. Cells
Do not centrifuge the cell samples upon thawing.
25-8010-38UM
Chapter 4,
Rev B, 2006
12
5. Cell assay design
5.1. Culture and maintenance of BHK derived
EGFP-STAT3 expressing cell line
5.1.1. Tissue culture media and reagents required
The following media and buffers are required to culture, maintain and prepare the
cells, and to perform the assay.
• GIBCO Dulbecco’s Modified Eagle Media (DMEM) with Glutamax-1, Invitrogen life
technologies 31966-021 or equivalent
• GIBCO Nutrient Mixture F-12 Ham medium with Glutamax, Invitrogen life
technologies 31765-027 or equivalent
• Fetal Bovine Serum (FBS), JRH Biosciences 12103 or equivalent.
• GIBCO Penicillin-Streptomycin (P/S), (10 000 units/ml penicillin G sodium and
10 000 μg/ml streptomycin sulfate), Invitrogen life technologies 15140-122 or
equivalent
• Geneticin (G418), Sigma G-7034 or equivalent
• GIBCO Trypsin-EDTA in HBSS w/o calcium or magnesium, Invitrogen life
technologies 25300-054 or equivalent
• GIBCO HEPES Buffer, 1M solution, Invitrogen life technologies 15630-056 or
equivalent
• Bovine serum albumin (BSA), Sigma A-7888 or equivalent
• GIBCO Phosphate-Buffered Saline (PBS) Dulbecco’s, w/o calcium, magnesium or
sodium bicarbonate, Invitrogen life technologies 14190-094 or equivalent
• Dimethylsulfoxide (DMSO), Sigma D-2650 or equivalent
• Hoechst™ 33342, Molecular Probes H-21492 or similar
• DRAQ5™, Biostatus
• Interleukin-6, Human, Recombinant, E. coli (IL-6), Calbiochem 407652
• Cy™5 monocarboxyl dye, GE Healthcare PA05111 or equivalent
• Oregon Green (2’, 7’-difluorofluorescein), Molecular Probes D-6145
• Alexa Fluor (carboxylic acid, succinimidyl ester), Molecular Probes A-10168
• Formalin solution (10%), neutral-buffered, 4% (w/v) Formaldehyde, Sigma HT501-2
• Phosphate buffered saline tablets, Sigma, P-4417
• Standard tissue culture plastic-ware including tissue culture treated flasks
(T-flasks), centrifuge tubes and cryo-vials
5.1.2. Reagent preparation
NOTE: the following reagents are required, but not supplied.
• Heat inactivation of FBS: 30 minutes in water bath at 56°C
• Growth-medium: DMEM with Glutamax-1 supplemented with 10% (v/v) FBS, 1%
(v/v) Penicillin-Streptomycin, and 0.5 mg/ml Geneticin
• Freeze-medium: DMEM with Glutamax-1 supplemented with 10% (v/v) FBS, 1%
(v/v) Penicillin-Streptomycin and 10% (v/v) DMSO
• Assay-medium: Nutrient Mixture F-12 Ham medium with Glutamax
supplemented with 10 mM HEPES, 0.2% (w/v) BSA and 1.0 μM Hoechst Nuclearstain.
25-8010-38UM
Chapter 5,
Rev B, 2006
13
• 10 μg/ml IL-6: IL-6 reconstituted as recommended by the supplier. Add 1 ml of
sterile PBS containing 0.1% BSA to 10 μg IL-6. The stock solution of 10 μg/ml
IL-6 can be aliquoted and stored between +4°C and -70°C until required. As
recommended by the supplier, stock solutions are stable for 1 month at +4°C
or for 3 months at -70°C. On the day of the assay the stock solution of IL-6 is
further diluted in Assay-medium for use in the assay (see section 5.2.4. for further
details).
• Flat field (FF) solution components:
• Cy5 - 1 mM stock solution prepared in 10% (v/v) DMSO, 90% (v/v) PBS
• Oregon Green - 1 mM stock solution prepared in 10% (v/v) DMSO, 90% (v/v) PBS
• Alexa Fluor - 1 mM stock solution prepared in 10% (v/v) DMSO, 90% (v/v) PBS
As explained in the IN Cell Analyzer 3000 user manual, prepare the FF solution
to give adequate fluorescent signal in each channel used, where the fluorescent
counts should be less than 3300, at maximum.
For a Hoechst 33342 nuclear stained assay, prepare an initial FF solution
containing 1.0 μl 10 μM Oregon Green and 20 μl 100 μM Alexa Fluor in 100 μl PBS.
For a DRAQ5 nuclear stained assay, prepare an initial FF solution containing 1.0 μl
10 μM Oregon Green and 10 μl 10 μM Cy5 in 100 μl PBS.
Adjust these solutions if required. Use 100 μl of FF solution for a 96 well plate and
40 μl FF solution for a 384 well plate.
5.1.3. Cell thawing procedure
Two cryo-vials, each containing 1 x 10⁶ cells in 1 ml of Freeze-medium are
included with this assay kit. The vials are stored frozen in the vapor phase of liquid
nitrogen.
1. Remove a cryo-vial from storage.
2. Holding the cryo-vial, dip the bottom three-quarters of the cryo-vial into a 37°C
water bath, and swirl gently for 1–2 minutes until the contents are thawed. Do
not thaw the cells for longer than 3 minutes as this decreases viability.
3. Remove the cryo-vial from the water bath and wipe it with 70% (v/v) ethanol.
Transfer the cells immediately to a T-25 flask and add 5 ml pre-warmed Growthmedium drop-wise to prevent cell damage. Add a further 2 ml Growth-medium
and incubate at 37°C.
NOTE: To ensure maximum cell viability, do not allow the cells to thaw at room
temperature and do not thaw the cells by hand.
5.1.4. Cell subculturing procedure
Incubation: 5% CO2, 95% humidity, 37°C.
The cells should be passaged at a ratio of 1:20 when they are 90% confluent.
1. Warm all reagents to 37°C.
2. Aspirate the medium from the cells and discard.
3. Wash the cells with PBS. Take care not to damage the cell layer while washing,
but ensure that the entire cell surface is washed.
4. Aspirate the PBS from the cells and discard.
5. Add Trypsin-EDTA (2 ml for T-75 flasks and 4 ml for T-162 flasks), ensuring that
all cells are in contact with the solution. Wait for 3–10 minutes for the cells to
round up/loosen. Check on an inverted microscope.
6. When the cells are loose, tap the flask gently to dislodge the cells. Add Growthmedium (8 ml for T-75 and 6 ml for T-162 flasks) and gently resuspend the cells
with a 10 ml pipette until all the clumps have dispersed.
7. Aspirate the cell suspension and dispense 0.5 ml cells into a new culture vessel.
25-8010-38UM
Chapter 5,
Rev B, 2006
14
5.1.5. Cell seeding procedure
The following procedure is optimized for cells grown in standard T-75 and T-162
flasks to be seeded into 96 well microplates.
1. Warm all reagents to 37°C.
2. Aspirate the medium from the cells and discard.
3. Wash the cells with PBS. Take care not to damage the cell layer while washing,
but ensure that the entire cell surface is washed.
4. Aspirate the PBS from the cells and discard.
5. Add Trypsin-EDTA (2 ml for T-75 and 4 ml for T-162 flasks), ensuring that all
cells are in contact with the solution. Wait for 3–10 minutes for the cells to
round up/loosen. Check on an inverted microscope.
6. When the cells are loose, tap the flask gently to dislodge the cells. Add Growthmedium (3 ml for T-75 and 6 ml for T-162 flasks) and gently resuspend the cells
with a 10 ml pipette until all the clumps have dispersed.
7. Count the cells using either a CASY1 Cell Counter and Analyzer System
(Model TT) or a hemocytometer.
8. Using fresh Growth-medium, adjust the cell density to deliver the desired
number of cells to each well. For example, to add 0.8 x 10⁴ cells per well in a
volume of 200 μl, adjust the suspension to 4 x 10⁴ cells per ml. We recommend
a concentration of 4 x 10⁴ cells per ml.
9. Dispense 200 μl of the cells into each well of the microplate, except the well
reserved for the FF solution (see IN Cell Analyzer 3000 manual for further
information).
10. Optionally, incubate the plates undisturbed on a level surface for 1 hour at
room temperature (approximately 20°C). This treatment may reduce edge
effects.
11. Incubate the plated cells for 24 hours at 37°C, 5% CO2, 95% humidity before
starting the assay.
NOTE: If the cells are near confluence prior to trypsinization, they should be
passaged into two T-flasks. They will then be ready for seeding the following day.
5.1.6. Cell freezing procedure
A decreased growth rate has been observed in cell populations after having
undergone more than 10 passages. It is recommended that the users make early
freeze downs of cells at low passage number after expanding from passage 1.
1. Harvest the cells as described in section 5.1.4. and resuspend the cells in a small
volume of Growth-medium.
2. Count the cells as described in section 5.1.5.
3. Pellet the cells at approximately 300 g for 5 minutes. Aspirate the medium from
the cells.
4. Gently resuspend the cells until no clumps remain in Freeze-medium at a
concentration of 1 x 10⁶ cells in 1 ml and transfer into cryo-vials. Each vial
should contain 1 x 10⁶ cells in 1 ml of Freeze-medium.
5. Transfer the vials to a cryo-freezing device and freeze at -80°C for 16–24 hours.
6. Transfer the vials to the vapor phase in a liquid nitrogen storage device.
5.1.7. Growth characteristics
Under standard growth conditions, the cells should maintain an average size
of 18.6 μm as measured using a CASY1 Cell Counter and Analyzer System
(Model TT). The doubling time of the cell line in exponential growth phase has been
determined to be approximately 13.4 hours under standard conditions (Fig 5.1.).
The growth rate may decrease after having undergone more then 10 passages.
25-8010-38UM
Chapter 5,
Rev B, 2006
15
In (cell number)
12
Fig 5.1. Growth curve of the
BHK-derived EGFP-STAT3 expressing
cell line. Only points on the linear
portion are shown. Doubling time =
13.4 hours.
10
8
6
0
25
50
75
100
125
Time (hours)
5.2. Assay set up
5.2.1. Live cell EGFP-STAT3 assay using the IN Cell Analyzer 3000
This manual provides a suggested protocol to use the EGFP-STAT3 assay for
agonist screening on the IN Cell Analyzer 3000.
5.2.2. Microplate set up for 96 well format assays
The EGFP-STAT3 assay is optimized for agonist format (see sections 5.2.3. and
5.2.4.). It is essential that the number of cells per well in the assay plates be
consistent in order to minimize assay variability.
IL-6 is used as a reference agonist with a typical EC50 value of 19.4 ng/ml. The
EGFP-STAT3 assay can be used with either Hoechst or DRAQ5 as the Nuclear-stain.
The majority of data presented in this manual were obtained using Hoechst stain.
As explained in the IN Cell Analyzer 3000 user manual, each run must contain a
flat field well to compensate for variations in fluorescence intensity across each
image. It is possible to prepare a plate solely for this purpose. Alternatively, a
designated well on each plate can contain flat field solution. When seeding the
plate, this well must not contain any cells if the auxiliary flat field correction tool is
to be applied in the analysis module.
5.2.3. Schematic agonist assay protocol
Fig 5.2. shows a typical schematic of the agonist assay. The cells should be
seeded in the appropriate microplate the day before the experiment. The Growthmedium is decanted, the cells are washed and Assay-medium added to each well.
Following a 30 minute incubation at 37°C, 5% CO2, controls and test compound
are added to required wells. After 25 minutes incubation, the microplates are
Fig 5.2. Flow diagram showing a basic
protocol suitable for a EGFP-STAT3
agonist screen.
START
Seed cells.
Incubate overnight, 37 oC, 5% CO 2 .
Decant, Wash, Decant.
Add Assay-medium with nuclear-stain.
Incubate 30 minutes, 37 oC, 5% CO 2 .
Add control and test compounds.
Incubate 25 minutes, 37 oC, 5% CO 2 .
Image plate on IN Cell Analyzer 3000.
STOP
25-8010-38UM
Chapter 5,
Rev B, 2006
16
placed into the IN Cell Analyzer 3000. The Nuclear Trafficking Analysis Module is
used to analyze images from each well.
5.2.4. Agonist assay protocol (96 well format)
NOTE: whenever possible, keep the microplate at 37°C, 5% CO2, and 95% humidity.
1. The day before starting the assay, seed 0.8 x 10⁴ cells per well in 200 μl of
Growth-medium. Incubate for 24 hours at 37°C, 5% CO2. If one of the wells on
the cell plate is used for flat field correction, it should not contain cells.
2. On the day of the assay, prepare the test compounds, solvent controls (if used)
and reference agonist control (IL-6). These samples are typically prepared at
four fold of the final concentration in Assay-medium. For the reference agonist
IL-6, a final concentration of 30 ng/ml is suitable. However, we recommend
that users perform their own dose response curve to establish optimal agonist
concentrations. The concentration range of IL-6 recommended for a doseresponse assay is 0.3 ng/ml to 1 μg/ml.
3. Decant the Growth-medium from the cell plate, removing all excess liquid and
add 100 μl Assay-medium to wash the cells. Decant the wash.
4. Add 150 μl Assay-medium. Incubate at 37°C, 5% CO2 for 30 minutes.
5. Add 50 μl of the prepared four fold dilution stocks of the test and control
compounds to the appropriate wells. If Hoechst 33342 is used as the nuclear
stain, we recommend including a 6 second* time interval between addition to
each well. The order of dispensing should be the same as the well imaging order.
This ensures that cells in each well have been stimulated for the same period of
time prior to imaging. The total well volume is 200 μl.
6. After the first well has incubated for 25 minutes, read the assay plate using the
IN Cell Analyzer 3000. Alternatively for convenience, the live cell assay could
be fixed at the peak translocation time point and then imaged on the IN Cell
Analyzer 3000 (see section 5.2.5. for further details).
7. Perform the data analysis using the Nuclear Trafficking Analysis Module.
*A time interval of 6 seconds is required when using Hoechst 33342 as the nuclear
stain. This corresponds to the time taken to image one tile per well on the IN Cell
Analyzer 3000, using 364 nm and 488 nm excitation on two excitation passes.
If DRAQ5 is used as the nuclear stain, no delay is required, since the 488 nm
and 647 nm channels can be imaged simultaneously. Any other changes to the
protocol that may influence the time taken to image a well should be taken into
consideration during test and control compound addition (e.g. imaging more than
one tile per well).
5.2.5. Fixed cell assay format
In order to avoid the need for strict time-controlled dispensing of test and control
compounds, it is possible to complete the assay using live cells, as described in the
agonist assay protocol, but fix the cells prior to imaging.
1. Perform the assay as described.
2. After incubating with agonist for the optimal time, decant the Assay-medium
and wash the cells in each well with 200 μl PBS. Decant the wash.
3. Add 100 μl 2% formaldehyde in PBS and incubate for 30 minutes at room
temperature.
4. Decant the fixative and wash the cells in each well with 200 μl PBS. Decant the
wash.
5. Store the plate at 4°C with 100 μl fresh PBS in each well.
6. Image and perform analysis as required.
If the cells are to be fixed, the assay can be performed with, the Nuclear-stain in
the Assay-medium for the duration of the assay. Nuclear staining, at the same
25-8010-38UM
Chapter 5,
Rev B, 2006
17
concentrations as normal, can be performed after fixation. If no stain is used
during the assay, the first PBS wash step can be omitted from the protocol.
5.3. Results
5.3.1. Calculating the Z’-factor
Assay performance can be assessed by calculating the Z’-factor, a dimensionless
value defined by Zhang et al. (32). Using the IN Cell Analyzer 3000, a Z’-factor of
> 0.3 should be obtained with the assay under standard conditions, if the
experiment is performed as described in this manual.
Z’ = 1-
(3σc+ + 3σc-)
| μc+ - μc- |
where σ = standard deviation
μ = mean signal
c+ = positive control
c- = negative control
5.3.2. Example results
The following figures (Fig 5.3. and Fig 5.4.) are taken from a single experiment,
providing an example of the image quality and results that can be obtained with
the EGFP-STAT3 assay, using the IN Cell Analyzer 3000. Fig 5.3. shows images
acquired on the IN Cell Analyzer 3000 using the supplied BHK derived EGFP-STAT3
cell line. Images shown here are 1/14th of the full images acquired by the system.
Fig 5.3. The BHK derived EGFP-STAT3
expressing cells 25 minutes after
stimulation with (A) control buffer
only or (B) 30 ng/ml IL-6. The field
of cells shown is not the same. The
nuclear (blue) image channel is not
displayed here.
A
B
Fig 5.4. Data from the example
experiment, generated by the Nuclear
Trafficking Analysis Module, exported
to and analyzed in Microsoft Excel.
Analysis of these results yielded a Z’-factor of 0.65 for the assay as performed
using the conditions described in the legend to Fig 5.3.
25-8010-38UM
Chapter 5,
Rev B, 2006
18
5.4. Assay characterization
5.4.1. Translocation index
All of the characterizations for the EGFP-STAT3 assay were performed on the IN
Cell Analyzer 3000 using the Nuclear Trafficking Analysis Module.
The translocation index for this assay is taken to be the Nuc/Cyt ratio reported
for the cell population imaged in each well. The Nuc/Cyt ratio is the populationaveraged ratio of sampled nuclear and cytoplasmic intensities measured in the
signal channel. This index is used in all the following data.
5.4.2. Summary of quantitative assay parameters
Summaries of typical assay data, using IL-6 as the agonist, are shown in Tables
5.1. and 5.2. In particular, Table 5.1. shows the results calculated from a single
assay plate, indicating the degree of well to well variation. Table 5.2. shows a
summary of the results obtained from 19 assays, performed by different operators
on different occasions, giving an indication of inter assay variation.
Parameter
Signal to Noise
Z’-factor
Magnitude of Response
%CV
Stimulated
Unstimulated
Assay Data
42.46
0.65
1.25
# Assays
1
1
1
# Replicates
48
48
48
4.77
2.57
1
1
48
48
Parameter
Assay Data (± SD*) # Assays # Replicates
Signal to Noise
33.93 ± 7.22
17
48
Z’-factor
0.51 ± 0.10
17
48
Magnitude of Response
1.10 ± 0.14
17
48
%CV
Stimulated
6.32 ± 1.20
17
48
Unstimulated
2.79 ± 0.36
17
48
25-8010-38UM
Chapter 5,
Rev B, 2006
19
Table 5.1. Results from a typical single
assay, performed using the suggested
protocol. Signal to noise is calculated
as (mean signal – mean background)/
(background standard deviation) (32).
Magnitude of response is calculated as
(mean signal – mean background).
% CV is calculated as (standard
deviation x 100)/mean. Z’-factor is a
dimensionless characteristic useful for
evaluation of assay quality (32). It is
defined in section 5.3.1.
Table 5.2. Summary results from
assays performed by different
operators on different occasions,
using the suggested protocol. * SD
shown is the Standard deviation of the
assays Signal to noise is calculated
as (mean signal – mean background)/
(background standard deviation) (32).
Magnitude of response is calculated as
(mean signal – mean background).
% CV is calculated as (standard
deviation x 100)/mean. Z’-factor is a
dimensionless characteristic useful for
evaluation of assay quality (32). It is
defined in section 5.3.1.
5.4.3. Seeding density
Fig 5.5. shows the effect of varying seeding density when the assay is performed
in a 96 well microplate. The data were collected 25 minutes after the addition of
assay buffer control or 30 ng/ml IL-6. Significant differences between stimulated
(30 ng/ml IL-6) and non stimulated (no IL-6) cells were seen at cell densities
ranging from 0.2 x 10⁴ to 1.2 x 10⁴ cells per well. We recommend seeding the cells
at a density of 0.8 x 10⁴ cells per well.
Control (no IL-6)
30 ng/ml IL-6
Translocation index
(Nuc/Cyt)
3
2
Fig 5.5. IL-6-induced EGFP-STAT3
translocation as a function of seeding
density. Stimulated cells were treated
with 30 ng/ml IL-6 for 25 minutes
prior to imaging. Error = ± SD, n = 8
replicates per data point.
1
0
2000
4000
6000
8000
10000
12000
Cell Density (cells/well)
5.4.4. IL-6 dose response
Fig 5.6. shows an agonist dose response curve for the IL-6 response. The data
were collected 25 minutes after addition of agonist, and demonstrate an EC50 of
19.4 ng/ml.
Fig 5.6. IL-6 dose response curve
using the supplied EGFP-STAT3 cell
line. Error = ± SD, n = 8 replicates per
data point.
Translocation index
(Nuc/Cyt)
3
2
1
0
-2
-1
0
1
2
3
4
log [IL-6] (ng/ml)
5.4.5. Time course
Fig 5.7. shows a typical time course of the EGFP-STAT3 translocation and indicates
that the maximal translocation occurs approximately 25 minutes after stimulation
with 30 ng/ml IL-6.
Control (no IL
30 ng/ml IL-6
Translocation index
(Nuc/Cyt)
3
2
1
0
0
10
20
30
40
50
Time (minutes)
25-8010-38UM
Chapter 5,
Rev B, 2006
20
Fig 5.7. Time course of EGFP-STAT3
translocation using 30 ng/ml IL-6 as
agonist. Maximal response is seen
after 25 minutes. Error = ± SD, n = 4
replicates per data point.
5.4.6. Sensitivity of assay to DMSO, ethanol, and methanol
The EGFP-STAT3 translocation was measured in the presence of DMSO
(≤ 2%), ethanol (≤ 2%) or methanol (≤ 2%). As can be seen in Fig 5.8. the IL-6
induced translocation can withstand at least 0.5% of each solvent.
Control (no IL-6)
30 ng/ml IL-6
Translocation index
(Nuc/Cyt)
3
Fig 5.8a. Effect of DMSO on the IL-6
induced EGFP-STAT3 translocation.
Error = ± SD, n = 8 replicates per data
point.
2
1
0
0.00%
0.10%
0.25%
0.50%
1.00%
2.00%
DMSO %
Control (no IL-6)
30 ng/ml IL-6
Translocation index
(Nuc/Cyt)
3
Fig 5.8b. Effect of ethanol on the IL-6
induced EGFP-STAT3 translocation.
Error = ± SD, n = 8 replicates per data
point.
2
1
0
0.00%
0.10%
0.25%
0.50%
1.00%
2.00%
Ethanol %
Control (no IL-6)
30 ng/ml IL-6
Translocation index
(Nuc/Cyt)
3
2
1
0
0.00%
0.10%
0.25%
0.50%
1.00%
2.00%
Methanol %
25-8010-38UM
Chapter 5,
Rev B, 2006
21
Fig 5.8c. Effect of methanol on the
IL-6 induced EGFP-STAT3
translocation. Error = ± SD, n = 8
replicates per data point.
5.4.7. Effect of different assay media
To determine the effect of varying the assay medium on the IL-6 induced EGFPSTAT3 translocation, cells were assayed in either Nutrient Mixture F-12 Ham
medium (Ham F-12) or Dulbecco’s Modified Eagle medium (DMEM) with a range of
additives (10 mM HEPES, BSA and FBS). The results were collected 25 minutes after
incubation in the absence or presence of 30 ng/ml IL-6. The results, shown in
Fig 5.9, demonstrate that the assay tolerates a range of assay media.
Control (no IL-6)
30 ng/ml IL-6
Translocation index
(Nuc/Cyt)
3
Fig 5.9. The effect of different Assay
Media on IL-6 induced translocation
of EGFP-STAT3. Error = ± SD, n = 4
replicates per data point.
2
1
Ham
Ham
F-12
F-12
+ 10
+ 10
mM
mM
HEP
Ham
H
ES
E
PES
F-12
+ 0.1
+ 10
%
mM
BSA
Ham
HEP
ES +
F-12
0
.2%
+ 10
BSA
mM
Ham
HEP
F-12
E
S+1
+ 10
%F
mM
CS
Ham
HEP
F-12
ES +
+ 10
5%
FCS
mM
HEP
ES +
10%
DME
FCS
DME
M+
M+
1
0
10 m
mM
HEP
MH
ES
DME
EPE
S+0
M+
.1%
10 m
BSA
MH
EPE
DME
S+0
M+
.
2
10 m
%B
SA
MH
DME
EPE
S+1
M+
%F
10 m
CS
MH
DME
EPE
M+
S+5
10 m
%F
CS
MH
EPE
S+1
0%
FCS
0
Assay-medium formulation
5.4.8. Effect of serum starvation
To determine the effect of serum starving the cells prior to the assay, cells were
incubated in Assay-medium for 1–4 hours. The results, shown in
Fig 5.10, demonstrate that the assay tolerates a range of serum starvation times
(including the 25 minutes IL-6 stimulation time) in the recommended Assay-medium.
Control (no IL-6)
30 ng/ml IL-6
Translocation index
(Nuc/Cyt)
3
2
1
0
1
2
3
4
Starvation time (hours)
25-8010-38UM
Chapter 5,
Rev B, 2006
22
Fig 5.10. The effect of serum
starvation on IL-6 induced
translocation of EGFP-STAT3. Error = ±
SD, n = 4 replicates per data point.
5.4.9. Effect of using DRAQ5 nuclear stain
GFP expressing cells which have been stained using Hoechst nuclear marker must
be imaged sequentially due to overlap of spectral profiles for the two probes.
For speed of imaging, the red nuclear marker DRAQ5 can be used instead of
Hoechst. Since there is no spectral overlap between DRAQ5 and GFP, images can
be acquired simultaneously. Fig 5.11 shows an IL-6 dose response curve where the
nuclear marker has been changed to 0.3 μM DRAQ5.
Fig 5.11. IL-6 dose response curve
using 0.3 μM DRAQ5 as the nuclear
marker. Error = ± SD, n=8 replicates per
data point. EC50 = 3.9 ng/ml
Translocation index
Nuc/Cyt
3
2
1
0
-2
-1
0
1
2
3
log [IL-6] (ng/ml)
5.4.10. Fixed Assay
In order to avoid the need for strict time-controlled dispensing, it is possible to
complete the assay using live cells, as described in the agonist assay protocol, but
fix the cells prior to analysis. For full details see section 5.2.5. Fig 5.12 shows results
obtained from fixed preparations after 25 minutes stimulation with control (no IL-6)
or 30 ng/ml IL-6. Cells were fixed with 2% formaldehyde in PBS.
Fig 5.12. IL-6 induced EGFP-STAT3
translocation. Cells treated with either
Control (no IL-6) or 30 ng/ml IL-6 for
25 minutes prior to fixation and
imaging on the IN Cell Analyzer 3000.
Error = ± SD, n = 48 replicates per data
point.
Translocation index
(Nuc/Cyt)
3
2
1
0
Control (no IL-6)
30 ng/ml IL-6
5.4.11. AG490 inhibition curve
Fig 5.13. shows an inhibition curve for the antagonist AG490. The data were
collected 25 minutes after the addition of control (no IL-6) or 30 ng/ml IL-6 to cells
which had been pre-incubated with varying concentrations of AG490 for 4 hours.
An IC50 of 20 μM was obtained. Data were acquired from a single experiment, with
5 μM Hoechst nuclear stain as opposed to the recommended 1 μM Hoechst.
Control (no IL-6)
30 ng/ml IL-6
Translocation index
(Nuc/Cyt)
4
3
2
1
0
-8
-7
-6
-5
-4
-3
log [AG490] (M)
25-8010-38UM
Chapter 5,
Rev B, 2006
23
Fig 5.13. AG490 inhibition curve, in the
presence of Control (no IL-6) or
30 ng/ml IL-6. Error = ± SD, n=4
replicates per data point. IC50 = 20 μM
5.4.12. Results obtained on the IN Cell Analyzer 1000
Fig 5.14. and Fig 5.15. show typical images and data for the EGFP-STAT3
translocation assay. After 25 minutes incubation in the absence or presence of
30 ng/ml IL-6, cells were fixed with 2% formaldehyde in PBS prior to imaging on
the IN Cell Analyzer 1000.
Fig 5.14. Images obtained using IN
Cell Analyzer 1000. The BHK-derived
EGFP-STAT3 expressing cells 25 minutes
after stimulation with (A) control buffer
only or (B) 30 ng/ml IL-6.
A
B
Fig 5.15. Results obtained using the
IN Cell Analyzer 1000 and associated
Nuclear Trafficking Analysis Module.
Translocation index
(Nuc / Cyt)
1.4
1.2
1.0
0.8
Control (no IL-6)
25-8010-38UM
Chapter 5,
Rev B, 2006
30 ng/ml IL-6
24
6. Vector use details
The plasmid vector pCORON1000 EGFP-STAT3 (Fig 3.1.) can be used to transiently
or stably express EGFP-STAT3 fusion protein in the cell line of choice.
6.1. General guidelines for vector use
pCORON1000 EGFP-STAT3 has been used successfully to express EGFP-STAT3
fusion protein both transiently and stably in the BHK derived cell line. Expression
levels, translocation responses and other assay parameters may vary depending
on the cell type and the transfection procedure.
6.2. Transient transfection with pCORON1000
EGFP-STAT3
Transient transfection protocols must be optimized for the cell type of choice.
Choice of transfection reagent and cell type will affect efficiency of transfection.
FuGENE 6 Transfection Reagent (Roche) produced successful results when
transfecting pCORON1000 EGFP-STAT3 into BHK cells. For more information, refer
to manufacturer’s guidelines for the desired transfection reagent.
6.3. Stable cell line generation with
pCORON1000 EGFP-STAT3
The process of establishing stable cell lines involves a large number of variables,
many of which are cell-line dependent. Standard methods and guidelines for the
generation of stable cell lines are widely available in the public domain (33).
pCORON1000 EGFP-STAT3 has been used to generate stably transfected cell
populations. The magnitude of the response and the kinetics of the translocation
event achievable with different cell lines are unknown, and may deviate
considerably from the values specified in this manual.
25-8010-38UM
Chapter 6,
Rev B, 2006
25
7. Quality control
7.1. EGFP-STAT3 cell line
The EGFP-STAT3 cell line is supplied at a concentration of 1 x 10⁶ cells per ml in
fetal calf serum containing 10% (v/v) DMSO. The cell line has the characteristics
detailed in Table 7.1.
Property
Value
Measurement method
Magnitude of response
≥ 0.9
Z’-factor ≥ 0.3
For 10 passages after
dispatch
Quality Control Assay
Viability from frozen
> 80%
CASY1 Cell Counter and
Analyzer System (Model TT)
Cell diameter (μm)
18–21
CASY1 Cell Counter and
Analyzer System (Model TT)
> 40 000 for 10
passages after dispatch
FARCyte (Gain 51)
Assay stability
Fluorescence at
4 x 10⁴ cells per
ml (RFU)
Table 7.1. Quality control information
for EGFP-STAT3 cell line
7.2. EGFP-STAT3 expression vector
The EGFP-STAT3 expression vector is supplied in TE buffer (10 mM Tris,
1 mM EDTA, pH 8.9) at 250 μg/ml. The vector has the characteristics outlined in
Table 7.2.
Property
Value
Concentration
Limits
Measurement method
250 μg/ml
Purity - Minimal
contamination of
the DNA construct
by RNA or protein
A260/A280 ratio
Expected restriction
pattern
The restriction
digests should
give fragments of
the sizes shown
in Table 7.3.
UV Absorbance @
260 nm in water
Between
1.8–2.2
UV/Vis Absorbance
@ 260 nm and
280 nm
Agarose gel
electrophoresis
Enzyme(s)
# of cuts
Fragment(s) size (bp)
BamHI
BsrGI
HindIII
NotI
PvuI
2
2
2
1
3
3415, 5078
1720, 6773
3815, 4678
8493
1938, 2755, 3800
25-8010-38UM
Chapter 7,
Rev B, 2006
Table 7.2. Quality control information
for the EGFP-STAT3 expression vector
26
Table 7.3. Expected restriction pattern
for the EGFP-STAT3 expression vector
8. Troubleshooting
guide
Problem
Possible cause
Remedy
1. Low assay response
(positive vs negative controls).
1.1. Passage number too high.
1.1. Start a fresh batch of cells from
an earlier passage number.
Cells should be expanded, and
additional vials should be frozen
down from the vials delivered with
the kit.
1.2. Cell density too low or too high.
1.2. Verify density of cell plating; adjust
plating density to values that yield
optimal assay response.
1.3. Incorrect selection of analysis
parameters.
1.3. Check that the primary parameters
are correct and suitable for the cells
currently in use.
1.4. Incorrect assay/incubation
conditions.
1.4. Ensure that proper incubation
is maintained as consistently as
possible during the assay. When
plates are out of the CO2 incubator
for extended periods, it is essential
that HEPES buffer be added to the
medium to maintain the correct
pH.
1.5. Reagents were not stored properly
or they are out of date.
1.5. Repeat assay with fresh reagents.
1.6. Cells have been stressed during
assay.
1.6. Use actively growing cells
maintained at 37°C. Pre-warm
reagents to 37°C.
2.1. Nuclear-stain concentration too
low.
2.1. Adjust Nuclear-stain concentration
to recommended level.
2.2. Nuclear-stain incubation time too
short.
2.2. Adjust Nuclear-stain incubation
time to recommended length.
3. Image is out of focus.
3.1. Autofocus Offset is chosen
incorrectly or the system may need
to be realigned
3.1. Alignment and calibration of
instrument. Perform Z-stack on
cells. Change Autofocus Offset.
4. Cells do not adhere to well bottom in
plate.
4.1. Plating density too high.
4.1. Reduce plating density.
5. Shading across image field.
5.1. Flat field correction not applied or
flat field solution too weak.
5.1. Apply flat field correction or adjust
flat field solution.
2. Low nuclear intensity.
25-8010-38UM
Chapter 8,
Rev B, 2006
27
9. References
1. Schindler, C., et al. Transcriptional responses to polypeptide ligands: the JAKSTAT pathway. Annu. Rev. Biochem. 64, 621–651 (1995).
2. Darnell, J.E. Stats and gene regulation. Science, 277, 1630–1635 (1997).
3. Kisseleva, T., et al. Signalling through the JAK/STAT pathway, recent advances
and future challenges. Gene, 285, 1–24 (2002).
4. Levy, D.E., et al. What does Stat3 do? J. Clin. Invest. 109, 1143–1148 (2002).
5. Copeland, N.G., et al. Evolution of the mammalian Stat gene family. Genomics,
29, 225–228 (1995).
6. Bowman, T., et al. Stats in oncogensis. Oncogene, 19, 2472–2488 (2000).
7. Akira, S., et al. Molecular Cloning of APRF, a novel INF-stimulated gene factor
3 p91-related transcription factor involved in the gp130-mediated signalling
pathway. Cell, 77, 63–71 (1994).
8. Zhong, Z., et al. Stat3 and Stat4: Members of the family of signal transducers
and activators of transcription. Proc. Natl. Acad. Sci. 91, 4806–4810 (1994).
9. Hirano, T. Signaling mechanisms through gp130: a model of the cytokine
system. Cytokine and Growth Factor Reviews. 8, 241–252 (1997).
10. Boccaccio. C., et al. Induction of epithelial tubules by growth factor HGF
depends on the STAT pathway. Nature, 15, 285–288 (1998).
11. Bild A. H., et al. Cytoplasmic transport of Stat3 by receptor-mediated
endocytosis. EMBO, 21, 3255–3263 (2002).
12. Bhattacharya, S., et al. Regulation of Stat3 nuclear export. J. Clin. Invest., 111,
553–559 (2003).
13. Callus, B.A., et al. Interleukin-3-induced activation of the JAK/STAT pathway is
prolonged by proteasome inhibitors. Blood, 91, 3182–3192 (1998).
14. Hilton, D.J. Negative regulators of cytokine signal transduction. Cell Mol. Life
Sci., 55, 1568–1577 (1999).
15. Irie-Sasaki, J., et al. CD45 is a JAK phosphatase and negatively regulates
cytokine receptor signalling. Nature, 409, 349–354 (2001).
16. Myers, M. P., et al. TYK2 and JAK2 are substrates of protein-tyrosine
phosphatase 1B. J. Biol. Chem. 276, 4771–47774 (2001).
17. Yamamoto, T., et al. The nuclear isoform of protein-tyrosine phosphatase
TC-PTP regulates interleukin-6-mediated signalling pathway through Stat3
dephosphorylation. Biochem. Biophys. Res. Comm., 297, 811–817 (2002).
18. Hoeve, J., et al. Identification of a nuclear Stat1 protein tyrosine phosphatase.
Mol. Cell. Biol., 22, 5662–5668 (2002).
19. Chung C.D. Specific inhibition of Stat3 signal transduction by PIAS3. Science
278, 1803–1805 (1997).
20. Wen, Z., et al. Maximal activation of transcription by Stat1 and Stat3 requires
both tyrosine and serine phosphorylation. Cell, 82, 241–250 (1995).
21. Wen, Z., et al. Mapping of Stat3 serine phosphorylation to a single residue (727)
and evidence that serine phosphorylation has no influence on DNA binding of
Stat1 and Stat3. Nucleic Acids Res., 25, 2062–2067 (1997).
22. Hirano, T., et al. Roles of Stat3 in mediating the cell growth, differentiation
and survival signals relayed through the IL-6 family of cytokine receptors.
Oncogene, 19, 2548–2556 (2000).
25-8010-38UM
Chapter 9,
Rev B, 2006
28
23. Takeda, K., et al. Targeted disruption of the mouse Stat3 gene leads to early
embryonic lethality. Proc. Natl. Acad. Sci., 94, 3801–3084 (1997).
24. Takeda, K., et al. Stat3 activation is responsible for IL-6-dependent T cell
proliferation through preventing apoptosis: Generation and characterisation of
T cell-specific Stat3 deficient mice. J. Immuno., 161, 4652–4660 (1998).
25. Sano, S., et al. Keratinocyte-specific ablation of Stat3 exhibits impaired skin
remodeling, but does not affect skin morphogenesis. EMBO, 18, 4657–4668
(1999).
26. Takeda, K., et al. Enhanced Th1 activity and development of chronic entercolitis
in mice devoid of Stat3 in macrophages and neutrophils. Immunity, 10, 39–49
(1999).
27. Schweizer, U., et al. Conditional gene ablation of Stat3 reveals differential
signalling requirements for survival of motorneurons during development and
after nerve injury in the adult. J. Cell Biol., 156, 287–297 (2002).
28. Chapman, R.S., et al. The role of Stat3 in apoptosis and mammary gland
involution. Conditional deletion of Stat3. Adv. Exp. Med. Biol., 480, 129–38 (2000).
29. Bates, S. H., et al. Stat3 signalling is required for leptin regulation of energy
balance but not reproduction. Nature, 421, 856–859 (2003).
30. Macpherson I. and Stoker M., Polyoma transformation of hamster cell clonesan investigation of genetic factors affecting cell competence. Virology 16,
147–151 (1962).
31. Macpherson I., Characteristics of a hamster cell clone transformed by polyoma
virus. J. Natl. Cancer Inst. 30, 795–815 (1963).
32. Zhang, J. H., et al. A Simple Statistical Parameter for Use in Evaluation and
Validation of High Throughput Screening Assays. J. Biomol. Screen. 4, 67–73
(1999).
33. Freshney, R. I. Cloning and Selection of Specific Cell Types in Culture of Animal
Cells, 3rd Edition, Wiley-Liss Inc, Chapter 11, pp. 161–178 (1994).
25-8010-38UM
Chapter 9,
Rev B, 2006
29
10. Related products
Product Name:
Code:
GFP Assays
GFP-PLCδ-PH domain assay
See below*
GFP-Rac1 assay
See below*
GFP-MAPKAP-k2 assay
See below*
AKT1-EGFP assay
See below*
EGFP-2xFYVE assay
See below*
EGFP-SMAD2 assay
See below*
EGFP-NFATcl assay
See below*
CypHer
pCORON1000 VSV-G tag Expression vector
25-8008-51
pCORON1000 SP VSV-G tag Expression vector
25-8009-92
CypHer5E labeled anti-VSV-G antibody
PA45407
CypHer5E NHS ester (1 mg pack)
PA15401
CypHer5E NHS ester (5 mg pack)
PA15405
*Use of the GFP assays is limited as stated in the Terms and Conditions of Sale.
The product codes vary accordingly. Please contact your local representative for
details.
IN Cell Analysis system
IN Cell Analyzer 3000
25-8010-11
Nuclear Trafficking Analysis Module for the
IN Cell Analyzer 3000
63-0048-96
IN Cell Analyzer 1000
25-8010-26
Nuclear Trafficking Analysis Module for the
IN Cell Analyzer 1000
25-8010-31
25-8010-38UM
Chapter 10,
Rev B, 2006
30
11. Appendix
11.1. Appendix A: Restriction map of pCORON1000 EGFP-STAT3
The following enzymes do not cut the vector: ApaI, AscI, BbrPI, Bpu1102I, BsiWI, Bsp120I, Bst1107I, BstEII, CelII, EcoNI, EcoRV,
EspI, KspI, NruI, PacI, PmaCI, PmeI, PmlI, SacII, SgrAI, SwaI
Enzyme
# of cuts
Positions (c) indicates the complementary strand
AatI
2
3200 5418
AatII
5
279 332 415 601 6670
Acc65I
2
1892 5069
AccI
1
4166
AccIII
3
1825 2306 2850
AciI
90
129 212 240 252 266 399 433 524(c) 557(c) 669 690(c) 767(c) 1326 1367 1434 1473 1611
1724 1784 1787 1944(c) 1990(c) 2061 2218(c) 2493(c) 2518(c) 2589(c) 2617 2826(c)
3630(c) 3636(c) 3740(c) 4035 4175(c) 4179 4456 4517(c) 4531(c) 4534(c) 4562 4589
4967(c) 4993(c) 5006 5014(c) 5082(c) 5267 5279 5288 5300 5310 5321 5367 5522 5585
5679(c) 5743(c) 5844(c) 5847(c) 6087 6127(c) 6132 6182(c) 6198 6224 6280(c) 6339 6411
6449 6475 6485 6524 6698(c) 6745 6844(c) 6953(c) 7030(c) 7074 7195(c) 7241 7432(c)
7523(c) 7885 7894(c) 8029 8139(c) 8260(c) 8279(c) 8406(c) 8434(c)
AcsI
8
1843 2914 3001 3073 3496 4264 4918 4929
AcyI
11
276 329 412 598 2879 3277 3707 5613 6315 6667 7049
AflII
4
829 848 1051 5467
AflIII
3
1849 3296 3794
AgeI
1
1095
AluI
46
728 759 834 1048 1128 1161 1233 1266 1482 1530 1641 1815 1872 1881 1905 1914
1928 1941 2460 2514 2571 2787 2937 2983 3159 3380 3426 3786 3943 4303 4648 4905
5095 5383 5437 5719 6177 6538 6557 7236 7299 7399 7920 8177 8223 8313
Alw44I
3
6420 6917 8163
AlwI
23
1602(c) 1801 2330 2987(c) 3000 3365 3747(c) 4421(c) 4430 5024 5792 5857(c) 6038
6402(c) 6415 6950 6954(c) 7271 7734(c) 7735 7831(c) 7833 7919
AlwNI
7
1953 2215 2283 2460 3786 3955 8068
AosI
4
4484 5023 5715 7366
ApaLI
3
6420 6917 8163
ApoI
8
1843 2914 3001 3073 3496 4264 4918 4929
AseI
2
161 7414
AsnI
2
161 7414
Asp700
1
6989
Asp718
2
1892 5069
AspEI
1
7589
AspHI
9
730 1717 3652 5726 5916 6424 6921 7006 8167
AspI
1
5731
AsuII
1
6295
AvaI
2
1838 4170
AvaII
9
1764 2484 2739 2853 3372 3454 6129 7225 7447
AviII
4
4484 5023 5715 7366
25-8010-38UM
Chapter 11,
Rev B, 2006
31
Enzyme
# of cuts
Positions (c) indicates the complementary strand
AvrII
1
5419
BamHI
2
2992 6407
BanI
11
619 977 1143 1892 2174 3664 4694 5069 5612 5647 7636
BanII
3
730 4664 5978
BbsI
2
962 3976
BbvI
45
821(c) 1253(c) 1359 1643 1650 1676(c) 1679(c) 1890 1914 1928(c) 2221 2266 2286 2301
2466 2469 2727 2763 2841 2992 3071 3146(c) 3435 3704 3792 3795 3942(c) 4016 4290(c)
4497 4565 5036 5560(c) 5686 5728 5744(c) 5837(c) 6249 6544(c) 7155(c) 7546 7849(c)
8055(c) 8058(c) 8148
BcgI
2
1232 7051(c)
BclI
1
3167
BfaI
15
154 753 1058 1087 2326 2632 2641 3214 4231 4582 5420 5474 7396 7731 7984
BfrI
4
829 848 1051 5467
BglI
8
137 244 366 437 2218 4494 5372 7471
BglII
3
1834 2412 8489
BlnI
1
5419
BmyI
17
730 1148 1277 1526 1717 3019 3652 4664 5559 5652 5726 5916 5978 6424 6921 7006
8167
BpmI
9
1552 1792 1918 2305 2341(c) 2725 2788 3644(c) 7520
BpuAI
2
962 3976
BsaAI
4
494 2544 4735 5917
BsaBI
2
4421 6406
BsaHI
11
276 329 412 598 2879 3277 3707 5613 6315 6667 7049
BsaI
4
916(c) 3172(c) 3211(c) 7523
BsaJI
30
514 1106 1136 1276 1439 1463 1518 1960 2034 2258 3182 3195 3272 3353 3368 3761
3887 3948 4136 4170 5030 5131 5203 5326 5361 5370 5419 5776 6045 8317
BsaWI
8
1095 1825 2306 2850 5644 7293 8124 8271
BseAI
3
1825 2306 2850
BsgI
7
1236(c) 1333 1657 2338 2566 2770 3145(c)
BsiEI
9
665 1100 2761 4179 4465 5522 7071 7220 8143
BsiHKAI
9
730 1717 3652 5726 5916 6424 6921 7006 8167
BsiYI
22
203 1277 1440 1790 2166 2228 2229 2735 3287 3346 3762 4093 4516 4842 5327 5594
6138 6551 7999 8278 8444 8462
BslI
22
203 1277 1440 1790 2166 2228 2229 2735 3287 3346 3762 4093 4516 4842 5327 5594
6138 6551 7999 8278 8444 8462
BsmAI
13
588 826 916(c) 941(c) 2396(c) 3172(c) 3211(c) 3860 5464 6552 6594(c) 6747(c) 7523
BsmFI
12
329 480 648 2752 2986 3467 4014(c) 5113(c) 5185(c) 5249(c) 5764 6296
BsmI
3
3898(c) 4240 4333(c)
Bsp1286I
17
730 1148 1277 1526 1717 3019 3652 4664 5559 5652 5726 5916 5978 6424 6921 7006
8167
BspDI
2
4425 6394
BspEI
3
1825 2306 2850
BspHI
3
6644 6749 7757
25-8010-38UM
Chapter 11,
Rev B, 2006
32
Enzyme
# of cuts
Positions (c) indicates the complementary strand
BspMI
7
878(c) 2120(c) 4009 4028 5500(c) 5881 6331
BspWI
53
137 244 366 398 437 530 554 803 1054 1199 1259 1272 1316 1325 1878 1911 1990 2215
2218 2280 2289 2451 2478 2520 2612 2757 2838 4464 4494 4526 4528 4570 4597 4627
5164 5236 5287 5366 5372 5604 5688 5711 5850 5856 5973 6009 6056 6323 6419 7471
7859 8431 8479
BsrBI
7
2826 3630 3636 4591(c) 6226(c) 6280 6747(c)
BsrDI
4
66(c) 5846 7355 7529(c)
BsrFI
9
1095 1258 2756 2855 2875 4630 5932 6113 7504
BsrGI
2
97 1817
BsrI
26
449(c) 887 940 1034(c) 1719(c) 2430(c) 2584 2653 2708 2883(c) 3232(c) 3440 3756(c) 3866
4824 5304(c) 5557 5758 6944 7114(c) 7383 7426 7544 7950 8062(c) 8075(c)
BssHII
1
6010
BstBI
1
6295
BstNI
27
244 437 1153 1278 1390 1465 1519 1897 2035 2236 2359 2442 3273 3354 3458 3583
3662 3850 3928 3950 5133 5188 5205 6000 8318 8331 8452
BstUI
21
214 1436 1754 1851 4507 4531 4551 4927 5014 5679 5980 6012 6413 6493 6596 6598
6698 7030 7523 7853 8434
BstXI
3
3272 3849 6334
BstYI
17
1607 1834 2322 2412 2992 3752 5016 5784 6030 6407 6942 6959 7727 7739 7825 7836
8489
Bsu36I
1
3091
CfoI
34
1092 1397 1438 1754 2481 3955 4147 4485 4509 4522 4531 4553 4579 4587 5024 5607
5615 5679 5716 5982 6012 6014 6242 6495 6598 6698 7030 7367 7460 7853 7962 8136
8236 8303
Cfr10I
9
1095 1258 2756 2855 2875 4630 5932 6113 7504
ClaI
2
4425 6394
Csp45I
1
6295
Csp6I
18
98 372 452 485 536 701 1063 1536 1818 1893 2541 3291 3576 3603 5070 5918 6431
7107
DdeI
21
1711 1729 1831 2921 2986 3091 3152 3376 3412 3653 3676 4089 5077 5379 6276 6427
6662 7088 7628 7794 8203
DpnI
40
664 749 1609 1757 1795 1836 2324 2414 2636 2994 3169 3244 3359 3484 3754 3829
4424 4428 4464 5018 5786 5864 5945 5954 6032 6409 6908 6944 6961 7219 7265 7283
7624 7729 7741 7819 7827 7838 7913 8491
DpnII
40
662 747 1607 1755 1793 1834 2322 2412 2634 2992 3167 3242 3357 3482 3752 3827
4422 4426 4462 5016 5784 5862 5943 5952 6030 6407 6906 6942 6959 7217 7263 7281
7622 7727 7739 7817 7825 7836 7911 8489
DraI
4
4380 7011 7703 7722
DraII
4
2739 3372 3454 6609
DraIII
1
4738
DrdI
6
818 4782 5456 5640 6506 8375
DsaI
7
514 1106 2258 3761 5030 5326 6045
DsaV
42
242 435 1135 1151 1276 1388 1463 1517 1789 1895 2033 2158 2170 2234 2357 2440
2995 3271 3352 3456 3581 3660 3848 3926 3948 4169 4170 4429 5131 5186 5203 5615
5775 5998 6515 6550 7051 7402 8098 8316 8329 8450
25-8010-38UM
Chapter 11,
Rev B, 2006
33
Enzyme
# of cuts
Positions (c) indicates the complementary strand
EaeI
15
9 63 1179 1568 1991 2758 3365 3916 4176 5519 5693 6084 6111 6336 7196
EagI
3
2758 4176 5519
Eam1105I
1
7589
EarI
6
2305(c) 2578(c) 4443(c) 5957(c) 6167(c) 6790(c)
Ecl136II
1
728
EclXI
3
2758 4176 5519
Eco47III
1
1091
Eco57I
12
1261 1305(c) 1504 2107(c) 2281(c) 2662(c) 3959 3988 5759 6191 6923 7935(c)
EcoO109I
4
2739 3372 3454 6609
EcoRI
2
1843 3073
EcoRII
27
242 435 1151 1276 1388 1463 1517 1895 2033 2234 2357 2440 3271 3352 3456 3581
3660 3848 3926 3948 5131 5186 5203 5998 8316 8329 8450
Esp3I
2
6552 6594(c)
Fnu4HI
73
835 1267 1326 1348 1632 1639 1690 1693 1787 1879 1903 1942 1945 1991 2061 2210
2219 2255 2275 2290 2455 2458 2590 2716 2752 2827 2830 2981 3060 3160 3424 3693
3781 3784 3956 4005 4176 4179 4304 4486 4518 4532 4554 5025 5367 5522 5574 5585
5675 5680 5717 5758 5845 5848 5851 6087 6183 6224 6238 6339 6449 6558 6845 7074
7169
7196 7535 7863 8069 8072 8137 8280 8435
FnuDII
21
214 1436 1754 1851 4507 4531 4551 4927 5014 5679 5980 6012 6413 6493 6596 6598
6698 7030 7523 7853 8434
FokI
17
984(c) 1135(c) 1501(c) 2314 2374 2834(c) 3268(c) 3565(c) 3847 3920(c) 5270(c) 5937 5962
6507(c) 7150 7437 7618
FspI
4
4484 5023 5715 7366
HaeII
6
1093 3956 4580 4588 5616 8237
HaeIII
46
11 65 238 431 1181 1281 1570 1682 1858 1957 1993 2170 2221 2234 2239 2615 2760
2859 3119 3200 3367 3586 3640 3918 4178 4454 4743 4885 5035 5360 5366 5375 5418
5521 5695 6086 6113 6338 6611 7198 7465 7545 8003 8437 8455 8466
HgaI
10
688 2868(c) 3266(c) 3696(c) 4513 6323 6499 7057 7787(c) 8365(c)
HgiAI
9
730 1717 3652 5726 5916 6424 6921 7006 8167
HhaI
34
1092 1397 1438 1754 2481 3955 4147 4485 4509 4522 4531 4553 4579 4587 5024 5607
5615 5679 5716 5982 6012 6014 6242 6495 6598 6698 7030 7367 7460 7853 7962 8136
8236 8303
HinP1I
34
1090 1395 1436 1752 2479 3953 4145 4483 4507 4520 4529 4551 4577 4585 5022 5605
5613 5677 5714 5980 6010 6012 6240 6493 6596 6696 7028 7365 7458 7851 7960 8134
8234 8301
HincII
7
678 2689 3302 4115 4133 4167 4319
HindII
7
678 2689 3302 4115 4133 4167 4319
HindIII
2
757 5435
HinfI
30
564 842 958 1074 1829 1866 1971 2002 2074 2108 2188 2352 2394 2668 2777 2965 3046
3680 4045 4108 4163 4783 4805 5441 6098 6232 6284 6391 7590 8107
HpaI
3
3302 4115 4319
HpaII
36
1096 1136 1199 1259 1790 1826 2160 2172 2307 2757 2851 2856 2876 2997 4171 4430
4631 5518 5595 5617 5645 5776 5866 5933 6114 6517 6551 7052 7294 7404 7471 7505
7909 8099 8125 8272
25-8010-38UM
Chapter 11,
Rev B, 2006
34
Enzyme
# of cuts
Positions (c) indicates the complementary strand
HphI
20
530 1122 1125(c) 1455 1479 1608 2274 3162(c) 3184(c) 3252 4084 4735 5791(c) 6569(c)
6578(c) 6862(c) 6897 7103(c) 7519 7746
ItaI
73
835 1267 1326 1348 1632 1639 1690 1693 1787 1879 1903 1942 1945 1991 2061 2210
2219 2255 2275 2290 2455 2458 2590 2716 2752 2827 2830 2981 3060 3160 3424 3693
3781 3784 3956 4005 4176 4179 4304 4486 4518 4532 4554 5025 5367 5522 5574 5585
5675 5680 5717 5758 5845 5848 5851 6087 6183 6224 6238 6339 6449 6558 6845 7074
7169 7196 7535 7863 8069 8072 8137 8280 8435
KasI
1
5612
KpnI
2
1896 5073
Ksp632I
6
2305(c) 2578(c) 4443(c) 5957(c) 6167(c) 6790(c)
MaeI
15
154 753 1058 1087 2326 2632 2641 3214 4231 4582 5420 5474 7396 7731 7984
MaeII
23
75 276 288 329 412 493 598 1172 1385 1556 2543 2656 2975 4624 4734 4777 4789 5729
5916 6667 6987 7360 7776
MaeIII
27
215 302 651 839 902 1290 1779 1921 2262 2436 3147 3708 3987 4289 4545 4557 5733
6039 6540 6928 7116 7269 7327 7658 7941 8057 8120
MamI
2
4421 6406
MboI
40
662 747 1607 1755 1793 1834 2322 2412 2634 2992 3167 3242 3357 3482 3752 3827
4422 4426 4462 5016 5784 5862 5943 5952 6030 6407 6906 6942 6959 7217 7263 7281
7622 7727 7739 7817 7825 7836 7911 8489
MboII
26
967 1350(c) 1395(c) 1398(c) 1593 2113(c) 2117 2197 2322 2460 2595 3055 3981 4460
4596(c) 5436(c) 5974 6184 6264(c) 6807 6916 6994 7749 7820(c) 7972(c) 8484(c)
McrI
9
665 1100 2761 4179 4465 5522 7071 7220 8143
MfeI
2
3344 4328
MluI
1
1849
MluNI
3
11 65 5695
MnlI
61
703(c) 870(c) 1116(c) 1197(c) 1203(c) 1297 1434(c) 1446(c) 1497(c) 1617(c) 2398 2559(c)
2579(c) 2605(c) 2700(c) 2763(c) 2872 2983(c) 3073 3086(c) 3147(c) 3177(c) 3211 3363(c)
3400(c) 3402 3668 3697(c) 3885(c) 3888(c) 4090(c) 4098 4146 4161 4364(c) 4404 4444(c)
4708 5048(c) 5056 5072(c) 5350(c) 5356(c) 5380 5386 5393(c) 5396(c) 5408(c) 5528(c)
5664(c) 6021(c) 6214 6563(c) 6622 7216(c) 7422(c) 7569 7650 8050 8300(c) 8374
MroI
3
1825 2306 2850
MscI
3
11 65 5695
MseI
34
161 784 830 849 917 1052 1067 2696 2800 2939 2945 3005 3301 4114 4318 4379 4525
4796 4894 4911 4922 4934 4945 5468 6457 6638 7010 7375 7414 7649 7702 7716 7721
7773
MslI
17
519 1108 1138 1288 1465 1594 1852 2017 2842 3028 3721 6050 6332 6371 6818 7177 7336
MspA1I
10
2460 3426 3740 3786 5095 5719 6487 6953 7894 8139
MspI
36
1096 1136 1199 1259 1790 1826 2160 2172 2307 2757 2851 2856 2876 2997 4171 4430
4631 5518 5595 5617 5645 5776 5866 5933 6114 6517 6551 7052 7294 7404 7471 7505
7909 8099 8125 8272
MunI
2
3344 4328
MvaI
27
244 437 1153 1278 1390 1465 1519 1897 2035 2236 2359 2442 3273 3354 3458 3583
3662 3850 3928 3950 5133 5188 5205 6000 8318 8331 8452
MvnI
21
214 1436 1754 1851 4507 4531 4551 4927 5014 5679 5980 6012 6413 6493 6596 6598
6698 7030 7523 7853 8434
MwoI
53
137 244 366 398 437 530 554 803 1054 1199 1259 1272 1316 1325 1878 1911 1990 2215
2218 2280 2289 2451 2478 2520 2612 2757 2838 4464 4494 4526 4528 4570 4597 4627
25-8010-38UM
Chapter 11,
Rev B, 2006
35
Enzyme
# of cuts
MwoI (cont’d)
Positions (c) indicates the complementary strand
5164 5236 5287 5366 5372 5604 5688 5711 5850 5856 5973 6009 6056 6323 6419 7471
7859 8431 8479
NaeI
2
4632 6115
NarI
1
5613
NciI
15
1137 1791 2160 2172 2997 4171 4172 4431 5617 5777 6517 6552 7053 7404 8100
NcoI
5
514 1106 5030 5326 6045
NdeI
2
388 1986
NdeII
40
662 747 1607 1755 1793 1834 2322 2412 2634 2992 3167 3242 3357 3482 3752 3827
4422 4426 4462 5016 5784 5862 5943 5952 6030 6407 6906 6942 6959 7217 7263 7281
7622 7727 7739 7817 7825 7836 7911 8489
NgoMI
2
4630 6113
NheI
1
1086
NlaIII
43
118 136 458 518 1110 1344 1374 1569 1764 1809 2011 2409 2841 2847 3042 3300 3491
3516 3612 3798 3819 3834 4128 4161 4196 5034 5167 5239 5330 5487 5832 6018 6049
6075 6564 6648 6753 7146 7182 7260 7270 7761 8481
NlaIV
33
621 979 1145 1683 1894 1958 2176 2233 2740 2741 2860 2994 3118 3351 3455 3666
3767 4663 4675 4696 5071 5137 5209 5614 5649 6409 6702 7292 7503 7544 7638 8410 8449
NotI
1
4176
NsiI
3
2849 5169 5241
NspI
9
2011 2409 2841 3300 3798 5167 5239 6018 6564
NspV
1
6295
PaeR7I
1
1838
PflMI
2
3287 3762
PinAI
1
1095
PleI
16
558(c) 836(c) 952(c) 1068(c) 1823(c) 1979 2082 2402 2959(c) 4116 4171 4791 4799(c)
6278(c) 7598 8101(c)
Ppu10I
3
2845 5165 5237
PpuMI
3
2739 3372 3454
Psp1406I
2
6987 7360
PstI
6
839 2204 2211 3072 4006 5666
PvuI
3
665 4465 7220
PvuII
5
2460 3426 3786 5095 5719
RcaI
3
6644 6749 7757
RsaI
18
99 373 453 486 537 702 1064 1537 1819 1894 2542 3292 3577 3604 5071 5919 6432
7108
RsrII
2
2853 6129
SacI
1
730
SalI
1
4165
SapI
2
5957(c) 6167(c)
Sau3AI
40
662 747 1607 1755 1793 1834 2322 2412 2634 2992 3167 3242 3357 3482 3752 3827
4422 4426 4462 5016 5784 5862 5943 5952 6030 6407 6906 6942 6959 7217 7263 7281
7622 7727 7739 7817 7825 7836 7911 8489
Sau96I
28
237 430 1280 1681 1764 1857 1956 2169 2220 2232 2484 2614 2739 2853 2858 3117
3372 3454 3585 3638 4453 4741 6129 6609 7225 7447 7464 7543
25-8010-38UM
Chapter 11,
Rev B, 2006
36
Enzyme
# of cuts
Positions (c) indicates the complementary strand
ScaI
2
1064 7108
ScrFI
42
244 437 1137 1153 1278 1390 1465 1519 1791 1897 2035 2160 2172 2236 2359 2442
2997 3273 3354 3458 3583 3662 3850 3928 3950 4171 4172 4431 5133 5188 5205 5617
5777 6000 6517 6552 7053 7404 8100 8318 8331 8452
SexAI
2
3456 5186
SfaNI
35
511(c) 1206(c) 1484 1499 1598 2270(c) 2441(c) 2459(c) 2480(c) 2510 2753(c) 2856 3123(c)
3251(c) 3425 3825(c) 3942 4043(c) 4262(c) 4954(c) 4994 5176 5248 5571(c) 5826(c) 5912
5976 6042(c) 6251 6435(c) 6529 6888(c) 7137 7328(c) 8380(c)
SfcI
13
835 1080 1873 1917 2200 2207 3068 4002 4512 5662 7343 8021 8212
SfiI
1
5372
SfuI
1
6295
SmaI
1
4172
SnaBI
1
494
SnoI
3
6420 6917 8163
SpeI
1
153
SphI
4
2841 5167 5239 6018
SspBI
2
97 1817
SspI
4
6 53 4943 6784
StuI
2
3200 5418
StyI
9
514 1106 1960 3195 3887 5030 5326 5419 6045
TaqI
25
824 945 1157 1451 1478 1493 1622 1839 2077 3419 4166 4184 4425 4700 5462 5726
5882 5906 5942 6104 6295 6394 6935 8379 8484
TfiI
14
1866 2002 2108 2188 2352 2668 2777 3046 3680 4045 5441 6098 6232 6391
ThaI
21
214 1436 1754 1851 4507 4531 4551 4927 5014 5679 5980 6012 6413 6493 6596 6598
6698 7030 7523 7853 8434
Tru9I
34
161 784 830 849 917 1052 1067 2696 2800 2939 2945 3005 3301 4114 4318 4379 4525
4796 4894 4911 4922 4934 4945 5468 6457 6638 7010 7375 7414 7649 7702 7716 7721
7773
Tsp509I
24
172 786 1040 1843 2693 2914 2928 2942 3001 3073 3344 3465 3496 4264 4328 4918
4929 4955 5173 5245 5337 7156 7411 7717
Tth111I
1
5731
Van91I
2
3287 3762
XbaI
1
2325
XcmI
2
2256 3350
XhoI
1
1838
XhoII
17
1607 1834 2322 2412 2992 3752 5016 5784 6030 6407 6942 6959 7727 7739 7825 7836
8489
XmaI
1
4170
XmaIII
3
2758 4176 5519
XmnI
1
6989
25-8010-38UM
Chapter 11,
Rev B, 2006
37
GE Healthcare offices:
GE Healthcare Bio-Sciences AB
Björkgatan 30 751 84
Uppsala
Sweden
GE Healthcare Europe GmbH
Munzinger Strasse 5 D-79111
Freiburg
Germany
GE Healthcare UK Limited
Amersham Place
Little Chalfont
Buckinghamshire
HP7 9NA
UK
GE Healthcare regional office
contact numbers:
Asia Pacific
Tel: +85 65 6 275 1830
Fax: +852 2811 5251
Australasia
Tel: +61 2 9899 0999
Fax: +61 2 9899 7511
Austria
Tel: 01/57606-1619
Fax: 01/57606-1627
Belgium
Tel: 0800 73 888
Fax: 02 416 82 06
Germany
Tel: (089) 96281 660
Fax: (089) 96281 620
Spain
Tel: 93 594 49 50
Fax: 93 594 49 55
Italy
Tel: 02 27322 1
Fax: 02 27302 212
Sweden
Tel: 018 612 1900
Fax: 018 612 1910
Japan
Tel: +813 5331 9336
Fax: +813 5331 9370
Switzerland
Tel: 0848 8028 12
Fax: 0848 8028 13
Latin America
Tel: +55 11 3933 7300
Fax: +55 11 3933 7304
UK
Tel: 0800 616928
Fax: 0800 616927
Middle East & Africa
Tel: +30 210 9600 687
Fax: +30 210 9600 693
USA
Tel: +1 800 526 3593
Fax: +1 877 295 8102
GE Healthcare Bio-Sciences
Corp
800 Centennial Avenue
P.O. Box 1327
Piscataway
NJ 08855-1327
USA
Canada
Tel: 1 800 463 5800
Fax: 1 800 567 1008
GE Healthcare Bio-Sciences KK
Sanken Bldg. 3-25-1
Hyakunincho Shinjuku-ku
Tokyo 169-0073
Japan
Denmark
Tel: 45 16 2400
Fax: 45 16 2424
Portugal
Tel: 21 417 7035
Fax: 21 417 3184
Finland & Baltics
Tel: +358-(0)9-512 39 40
Fax: +358-(0)9-512 39 439
Russia & other C.I.S. & N.I.S
Tel: +7 495 956 5177
Fax: +7 495 956 5176
France
Tel: 01 6935 6700
Fax: 01 6941 9677
South East Asia
Tel: 60 3 8024 2080
Fax: 60 3 8024 2090
Central, East & South East
Europe
Tel: +43 1 982 3826
Fax: +43 1 985 8327
Netherlands
Tel: 0800 8282821
Fax: 0800 8282824
Norway
Tel: 815 65 555
Fax: 815 65 666
http://www.gehealthcare.com/lifesciences
GE Healthcare UK Limited
Amersham Place Little Chalfont
Buckinghamshire HP7 9NA UK
25-8010-38UM Rev B, 2006