1
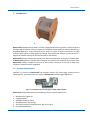
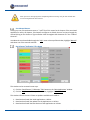
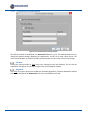
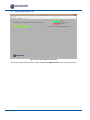
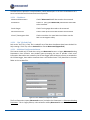
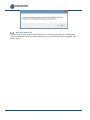
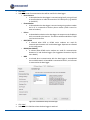
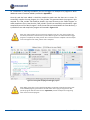
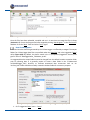
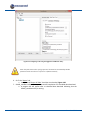
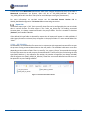
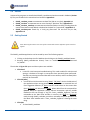
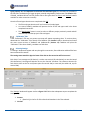
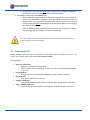
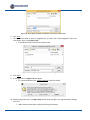
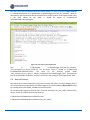
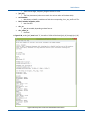
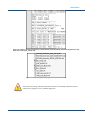
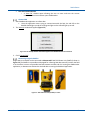
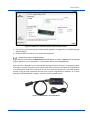
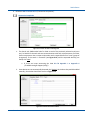
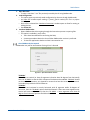
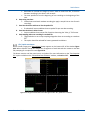
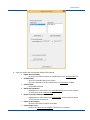
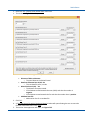
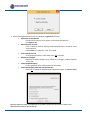
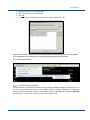
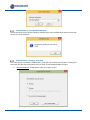
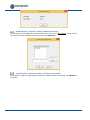
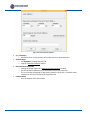
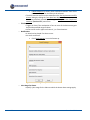
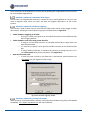
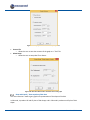
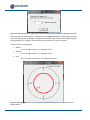
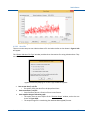
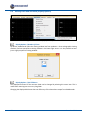
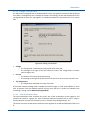
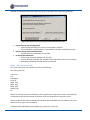
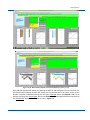
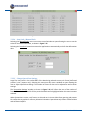
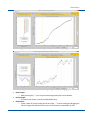
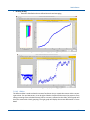
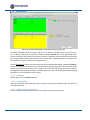
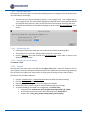
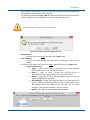
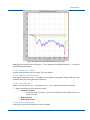
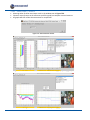
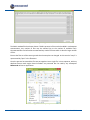
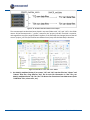
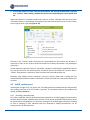
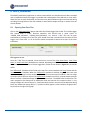
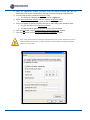
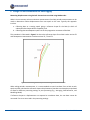
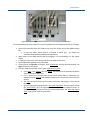
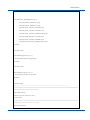
SAA Software
7. SAAView
SAAView is used to visualize 3D or 2D data from ShapeAccelArrays (SAAs). Typically the data are
generated in the field, stored in a Campbell Scientific Data Logger then retrieved manually,
automatically, and / or wirelessly. Arriving raw data are translated into readable form in
SAACR_raw2data and then opened in SAAView.
SAAView may also be used to view exported files from SAARecorder, the “real-time” 3D viewer for
SAA. SAAView functions include graphical viewing and export as images or data files in various
formats.
SAAView may also be used to view non-SAA piezometer, earth pressure cell, or strain gauge data if it
is converted through SAACR_raw2data from Measurand’s SAAPZ or from “third party” devices.
SAAView opens files of Cartesian data, named “multi_saa_allcart.mat”. These files hold data from
multiple SAAs in binary form. One SAA at a time may be viewed.
It is possible to view SAA data along with non-SAA data in the same graph using the ‘GraphAll+’
function (Section 7.3.3) of SAAView.
7.1 Running SAAView
When SAAView is started the window in Figure 7.1 opens and gives the user a choice of four possible
locations to pull data from. SAAView is looking to open a “*.mat” file of converted Cartesian data.
Figure 7.1: ‘Initial’ SAAView window.
SAARecorder Selection
Selecting this allows the user to open a project that would have already been exported from
SAARecorder using the “Export to SAAView” selection (Section 6.2.6.1). The default location of
SAARecorder data is ‘C:\Measurand Inc\SAARecorder\Data’, but it will not necessarily be in that
folder.
CR Logger Selection
Selecting this allows the user to open a project that would have already been processed in
SAACR_raw2data (Section 5). The default location for logger data is in ‘C:\Measurand
Inc\SAA3D\logger_data\[project name]’, but a user’s data will not necessarily be there… i.e. it’s
December 2014
171