1
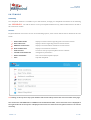
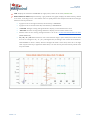
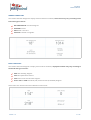
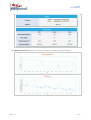
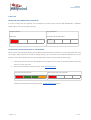
EasyWind Software Manual ✓ STBR : Displays the maximum STARBOARD (or right) value, relative to the mean; GREEN TEXT . ✓ WIND INTENSITY GRAPH : Represented by a grey shadow area graph; displays the wind intensity, related to its mean, according to time. This enables users to rapidly detect and compare wind direction changes related to intensity variations. ✓ If graph curves to the right-hand side, wind intensity is GROWING. ✓ If graph curves to the left-hand side, wind intensity is DECREASING. ✓ + BUTTON : Enlarges moving average window to display a smoothened mean curve. ✓ - BUTTON : Shortens moving average window to display a more reactive mean curve. ✓ Default value for the moving average window is set at the SYSTEM CONFIGURATION SECTION (MEAN WINDOW). ✓ 30 | 45 | 90 | 180 : Default view for user is 360º direction angle. Upon clicked, these values allow the user to configure a 30 | 45 | 90 | 180 degree view, according to the current wind conditions. FOR EXAMPLE: If wind is stable, direction changes will need a closer look, and a 30 or 45 angle view may be necessary to appreciate wind shifts;. If on the contrary the wind is shifty a wider view may be needed. Version 1.3 13 / 28