1
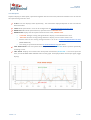
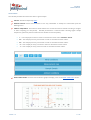
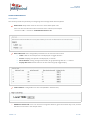
EasyWind Software Manual True Wind Speed Graphical display for wind speed, represented together with the mean value; which will enable the user to view the wind speed change trends in time. ✓ X AXIS : Time axis displays values dynamically. The overall data displayed depends on the time selector above described. ✓ Y AXIS : Wind speed values. Units can be configured at the SYSTEM ONFIGURATION SECTION . ✓ MEAN LINE : Mean wind speed reference, represented as an ORANGE LINE . ✓ MEAN VALUE : Displays the wind speed numerical mean value; ORANGE TEXT . ✓ + BUTTON : Enlarges moving average window to display a smoothened mean curve. ✓ - BUTTON : Shortens moving average window to display a more reactive mean curve. ✓ Default value for the moving average window is set at the SYSTEM CONFIGURATION SECTION (MEAN WINDOW). ✓ ✓ This setting is synchronised with the TRUE WIND DIRECTION graph above. TRUE WIND SPEED : True wind speed values. Represented as a BLUE LINE which is printed dynamically according to time. ✓ LAST VALUE : Displays the numerical last wind speed measurement; BLUE TEXT . If user clicks upon the value, the TRUE WIND SPEED LINE will hide from the graph. Re-displayed when clicked upon again (toggle display). Version 1.3 14 / 28