1
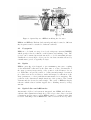
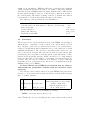
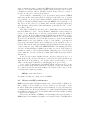
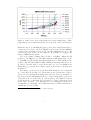
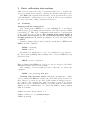
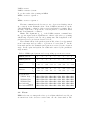
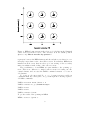
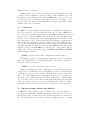
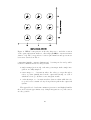
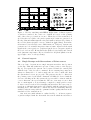
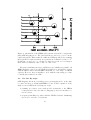
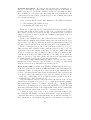
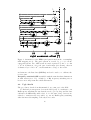
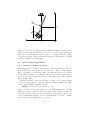
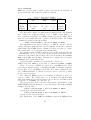
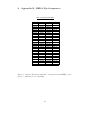
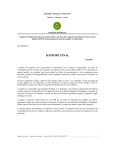
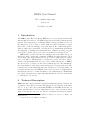
HERA User Manual
The commissioning team∗
version 2.0
November 18, 2009
1
Introduction
The HEterodyne Receiver Array HERA is a receiver system with 18 SIS
mixers tunable from 215 to 272 GHz arranged in a 3x3 dual polarisation pixel
pattern. The main purpose of this first multi–beam spectral line receiver on
the 30m telescope is to allow, together with the related backends, for rapid
raster and on–the–fly imaging of spectral lines in the 1.3mm atmospheric
window. Other more particular observing modes (continuum measurements
and mapping, polarisation measurements and optimised wobbling on point
sources) are possible but not yet offered as standard observing modes. 1
HERA has been embedded into the existing setup of the 30m telescope as
much as possible. Observing commands (PAKO) and data structure follow
closely that of the single pixel spectroscopy receivers. Only where necessary,
new or modified commands have been introduced and only these will be
described in this manual. However in order to make efficient use of HERA,
the user needs to be aware of some basic technical aspects of the instrument,
the particularities of the data stream and typical observing strategies. The
current version of the manual includes the description of observing with both
polarisations and the new WILMA wide band correlator. Complementary
information can also be found in Schuster et al. 2004 A&A (see IRAM 30m
web page). Suggestions for improving this manual are welcome and should
be addressed to A. Sievers.
2
Technical Description
HERA has nine dual polarisation pixels (18 Channels) arranged in the form
of a square center–filled 3×3 array. The distance between pixels on the sky is
24′′ , i.e. close to twice the beam width (FWHP) at 230 GHz. By means of a
quasi-optical K–mirror derotator this pattern can be placed at any position
angle on the sky (see also sect. 4). The two polarisation modules are named
∗
) K. Schuster, A. Greve, P. Hily–Blant, P. Planesas, A. Sievers, C. Thum, and
H. Wiesemeyer
1
contact A. Sievers, C. Thum or K. Schuster
1
Figure 1: Optical layout of HERA, including the derotator.
HERA1 and HERA2. Each module can independently be tuned to different
sky frequencies and be attached to different backends.
2.1
Cryogenics
HERA is cooled with a 3 stage closed cycle refrigerator system (DAIKIN)
which greatly reduced technical overhead times and running costs. The
receiver can be warmed up in 12 hours and be cooled down within 36 hours.
Usually the receiver is kept cold for periods of at least 3 months followed by
a maintenance period of typically 4-5 days.
2.2
Optics
HERAs optics (fig. 1) is designed to give maximum point source coupling
of the individual beams and at the same time to reduce deformations of
the array geometry irrespectively of the position of the K–mirror derotator. With this concept it is possible to obtain extremely simple observation
procedures as it is not necessary to make field maps for calibration of the
array parameters or other particular measurements before mapping. The
positions of the elements are simple functions of the position of the central
elements and the chosen derotation angle. The optics of HERA is largely
reflective which reduces baseline ripples due to standing waves by a large
amount.
2.3
Optical data and efficiencies
An internal cold/hot load system is integrated into HERA and allows to
calibrate all 18 channels in a single hot/cold load procedure. Due to its dual
polarisation and derotation concept HERA cannot be combined with other
receivers. Switching between HERA and other receivers is however possible
2
within about 10 minutes. HERA1 pixels have vertical (in the Nasmyth
cabin) polarisation and share the same local oscillator. They have thus the
same sky frequency. HERA2 has horizontal polarisation and a different LO,
its nine pixels can thus be tuned to a sky frequency, different from that of
the vertical pixels. The relative pointing of the two polarisation modules is
better than 1.2”. Both modules share the same focus setting.
The efficiency related parameters near 230 GHz are :
effective cold load temperature
conversion factor from measured to effective cold load temp.
image band gain
forward efficiency
main beam efficiency
Beam size at 230 GHz
2.4
∼ 97 K
∼ 0.8
∼ 0.1
Feff = 0.90
Beff = 0.52
11.7′′
Derotator
The derotator is an optical ensemble in front of the HERA cryostat (Fig. 1
which allows to compensate for the rotation of the astronomical object in
the focal plane of the telescope. This rotation is due to the general characteristics of an AZ-Alt-mounted Nasmyth-telescope and a function of actual
Azimuth and Elevation. The derotator compensates this rotation by computer controlled movements. The end-effect is, that the pixel pattern (and
polarisation) can be kept fixed on the sky (in the equatorial system or alternatively in the horizontal system). Fields can therefore be easily sampled
homogeneously and a great number of particular observing strategies are
possible. The derotator is constructed as a K-mirror, a device, although
frequently used in optical astronomy, has never been implemented in the
millimiter range before HERA.
To make efficient use of HERA it is essential that the observer
understands the possibilities available with the derotator before
observing.
The current control software allows to keep the HERA pixel pattern stationary, i.e. derotate various hour angle dependent rotations, in the following
three coordinate systems.
F Frame
Nasmyth coord.
H Horizontal
Az., El. Syst.
S
RA, Dec. Syst
Sky
similar to Bolometer
(stationary in the receiver cabin)
useful to align array
with chopping direction
most common mode
The derotator is controlled from PAKO by entering,
PAKO> receiver hera1 /derot β S
where S makes the derotator tracking the sky rotation and β is the position
3
angle (constant in time) by which the HERA pixel pattern is rotated with
respect to the equatorial system (counting east from north). The derotator
command is executed when a “LOAD” is made in the telescope control or
in other words before a new scan is started.
As an example, commanding β = 0◦ . keeps the 9 pixel pattern of HERA
stationary in the equatorial system so that the horizontal rows of 3 pixels
(e.g. pixels No. 1, 4 , and 7) are always parallel to right ascension, like shown
in Fig. 4. In this seemingly simple setup the HERA center pixel (No. 5 in
Fig. 4) is on the telescope’s pointing axis, and all peripheral pixels have
fixed (in time) offsets in the equatorial system of ∆α and ∆δ of 0′′ or ±24′′
according to Fig. 4.
The angle by which the derotator can be physically rotated in the frame
system is limited to ±83◦ . As the K-mirror multiplies rotation angles by
a factor of two this allows to rotate the pixel pattern on the sky within a
range of 332◦ . However while tracking it might happen that the derotator
approaches these physical limits, particularly for sources close to the zenith.
To avoid loss off data the observer should keep an eye on the newly installed
HERA monitor web page (ask the operator or the AOD to open this web
page in the automatic update mode within the screen ensemble of the observer). The current angle and tracking system is displayed in the left upper
corner of this web page. When the DEROTATOR box is turning yellow the
derotator is still tracking normally but its time for action. If it turns red,
tracking is off due to the mechanical limits. Mapping part of an extended
source with the derotator stuck in a limit may result in un-reproducible
distortions.
If the derotator angle displayed in the derotator window is close to a
limit (yellow), the derotator should be rotated by 90◦ (Sky system) in the
right direction. If the limit at −84◦ is approached, set the angle to β − 90◦
where β is the angle demanded by the mapping mode (see below).
A procedure is implemented in MIRA which generates a plot of the
derotator angle in the frame system as a function of time UT. Briefly the
procedure is as follows: Read in an Hera-observation of the source you are
observing and obtain a plot using
MIRA> view /derotator
For further details type ’help view’ in MIRA.
2.5
Mixers and RF performance
HERA uses waveguide SIS mixers which can be tuned in LSB or DSB mode.
The coupling of local oscillator power is obtained over waveguide coupler
modules. LSB is the normal and preferred tuning mode as it offers superior
overall system noise. However it must be recognised that LSB tuning results
frequently in reduced total power stability which sometimes makes pointing
on weak sources difficult.
The noise performance of HERA1 over the tuning range is given by Fig. 2.
HERA2 has a very similar performance for frequencies up to 230 GHz but is
4
Figure 2: SSB receiver noise temperatures across the tuning range. These
temperatures were measured in the laboratory in front of the dewar window.
higher in noise above 230 GHz. In practice, these noise temperatures have to
be increased by a factor of 1.15 if VESPA is used as the backend (IRAM’s
correlators are presently 2 bit 4 level). Another small increase (3. . . 5 K)
comes from losses on the derotator mirrors. It is planned to upgrade the
mixers of HERA in the future.
The local oscillator tuning range is 219 to 274 GHz. Taking the IF
frequency of 4 GHz into account, this results in a RF tuning range of 215
to 270 GHz for LSB tuning (standard tuning mode). DSB tuning is also
possible. The IF bandwidth is 1 GHz. Tuning is automatic and uses look–
up tables. Because these look-up tables have not yet been finalised the
tuning has to be prepared in advance, apart from a series of heavily used
frequencies. 2
The image rejection is about 10 dB in LSB tuning mode for all pixels
(gi = 0.1) and set globally for both modules at the present time. A more
precise rejection measurement using a line injection device is currently being developed and will ultimately allow to retrieve individual rejections for
each pixel from a look-up table at each frequency. The limited accuracy
of the knowledge of sideband rejection leads to relative calibration errors
in the range of 0-10% . For high signal to noise mapping it is therefore
recommended to undertake some additional steps for relative calibration or
“flatfielding” (see Sect XX).
2
See Appendix B for a look-up table of sky frequencies.
5
3
Basic calibration observations
This section describes the basic observations which serve to measure the
telescope pointing and focus and to calibrate the antenna temperature scale.
The HERA pixel pattern is shown in Fig. 3 as it appears in the receiver
cabin (Nasmyth coordinations) before rotation in the derotator assembly
(see sect. 2.4), when looking towards the subreflector.
3.1
Pointing
Pointing with the central pixel.
The central pixels of HERA1, No. 5, and of HERA2, No. 5, are aligned
with the telescope’s pointing axis and with the other SIS receivers to within
better than ≤ 2′′ . This degree of alignment was measured to be independent
of the actual derotator position. For pointing with central pixels it
is therefore not necessary to set a particular derotator angle or
tracking system and the standard pointing model can be used unmodified
for HERA.
Default pointing scans are made with the central pixel of HERA1 and
HERA1 and the command:
PAKO> pointing
PAKO> start
Information on which pixel to ’solve’ for pointing is not yet passed to
the data reduction (MIRA). But pointings can be ’solved’ in MIRA (for any
pixel) as follows:
MIRA> solve 2 /pixel 5
Here we assume that HERA2 is connected to the second part of the CONTINUUM backend. Pixel 5 is the default.
The resulting correction parameters can be taken into account by the
command:
PAKO> set pointing dAzm dElv
Pointing with off-center pixels. Although somewhat more complicated, pointing with HERA is possible also with offset pixels, described by
their offsets xn , yn in arc sec (see Tab. 1) The results are always referred to
the position of the central beam. This option may be used if an off–pixel
has a much better continuum sensitivity or stability than the central pixel.
Right now a few commands have to be entered in PAKO to make pointings
with off–elements:
PAKO> receiver hera1 /derot 0 F
PAKO> offsets xn yn /SYSTEM Nasmyth
PAKO> pointing
6
PAKO> start
PAKO> offsets /clear
To get the result of the pointing in MIRA
MIRA> solve 1 /pixel n
or
MIRA> solve 2 /pixel n
The first command sets the derotator to zero degrees, its default position
(no rotation) in the Nasmyth cabin. Next, PAKO is informed about the
offset in Nasmyth coordinates of the receiver (pixel) used for pointing. Fig. 3
and Tab. 1 show the correspondence between pixel No. n and their offsets
H and V in Nasmyth coordinates,
Note: The arguments xn , yn of the PAKO offsets command have
the opposite signs, as these arguments are offsets for the telescope pointing
which bring off–pixel n back onto the pointing axis. The designation of the
pixels in spectroscopic data is described below.
The nominal offsets of the pixels as given in Tab. 1 have been determined
from beam maps and are valid to a precision of better than 1′′ . In the
horizontal system, the Nasmyth pixel pattern is rotated by the elevation
angle. In the equatorial system, an additional rotation by the parallactic
angle is made.
Table 1: HERA pixel pattern and corresponding spectrometer sections.
HERA1 pixel No.
1
2
3
4
5
6
7
8
9
HERA2 pixel No.
1
2
3
4
5
6
7
8
9
Nasmyth
offsets
offsets
H
V
−24 −24 −24 0
−24 0 +24 −24
0
0
xn
+24 +24 +24
0
0
yn
+24
0
−24
24
0
1H01
2H01
1H01
2H01
1H01
2H01
1H02
2H02
1H02
2H02
1H02
2H02
1H03
2H03
1H03
2H03
1H03
2H03
1H04
2H04
1H04
2H04
1H04
2H04
1H05
2H05
1H05
2H05
1H05
2H05
spectrometers
VESPA V0(1 ... 4)
WILMA W01
WILMA W02
filterbank 4MHERA1
filterbank 4MHERA2
3.2
0 +24 +24 +24
+24 −24 0 +24
0
−24 −24 −24
−24 +24
1H06
2H06
1H06
2H06
1H06
2H06
1H07
2H07
1H07
2H07
1H07
2H07
0
−24
1H08
2H08
1H08
2H08
1H08
2H08
1H09
2H09
1H09
2H09
1H09
2H09
Focus
HERA’s derotator re–images the telescope focal plane which is located about
28 cm in front of the derotator rotation axis, onto the dewar window. The
7
Figure 3: HERA beam pattern at the telescope focal plane in the Nasmyth
cabin, viewed from the receiver. The derotator is at its default position
(derot 0 F). This is not the sky pattern !
separation between the HERA mixers and the subreflector is therefore considerably longer than for the other SIS receivers. Nevertheless, HERA was
installed in such a way that its telescope focus setting of the secondary
mirror is within 0.5 mm of that of the other receivers.
The possibilities to focus HERA are quite similar to the pointing options. There is no difference to single beam receivers for focusing onto the
central element, and one uses the PAKO command offsets to focus on
off–elements.
To focus on off–center pixel No. n, e.g. because it is more stable in
continuum than the center pixel, one goes through the following sequence
of PAKO commands:
PAKO> receiver hera1 /derot 0 F
PAKO> offsets xn yn /SYSTEM Nasmyth
PAKO> focus
PAKO> start
PAKO> offsets /clear
To get the result of the pointing in MIRA
MIRA> solve 1 /pixel n
8
or
MIRA> solve 2 /pixel n
Remark: The focus procedure of the 30m telescope has shown some odds
recently. It is not unusual to have from time to time unsatisfactory focus
fits which would result in very big offsets. HERA has been proven to focus
very closely to the position of the other SIS receivers. Do not simply correct
for proposed focus offsets of more than 2mm, but double check these results
with another focus observation.
3.3
Calibration
For HERA a specific calibration system is used, consisting of dedicated hot
and cold loads. The cold load is integrated into the cryostat of HERA. For
the observer however this is transparent, as the PAKO command calibration
is redirected to control the HERA calibration system. The only difference is
that the cold load temperature may change slightly in time. Because of this
the temperature of the cold load is measured and displayed in the monitor
window that also displays the derotator angles. At present (NCS) the effective cold load temperature and also the hot load temperature read from the
calibration system, are written to the raw-data (IMBFits) files. The values
that the observer sets in PAKO are only used if no other values could be
found. The observer can set these values for HERA1 and HERA2 in PAKO
with the usual command:
PAKO> receiver hera1(2) /tempLoad Tcold-eff Thot
The image rejection is about 10dB in LSB tuning mode for all pixels
(Gni = 0.1 for LSB and 1 for DSB tuning) and set globally for all pixels of
a module at the present time.
PAKO> receiver hera1(2) /gain -10 db
Right now the limited precision of the image rejection factors Gni , is the
largest source of calibration errors. The limited accuracy of the knowledge
of sideband rejection leads to relative calibration errors in the range of 010% . For high signal to noise mapping it is therefore recommended to
undertake some additional steps for relative calibration or “flat-fielding”
(see Sect XX). A more precise rejection measurement using a line injection
device is currently being developed and will ultimately allow to retrieve
individual rejections for each pixel from a look-up table at each frequency.
4
Spectroscopic observing modes
As HERA is a heterodyne receiver, we describe here only spectral line observing modes, although continuum mapping is possible (see section 5). In a
first step the basic observing modes are described and then we explain how
the various backends can be attached. Please consider that due to certain
9
Figure 4: HERA beam pattern on the sky when set to track the rotation
of the equatorial system with zero offset angle (PAKO> receiver hera1
/derot 0 S). The correspondence between pixel numbers and spectrometer
sections is described in Tab. 1.
constraints (mainly computer limitations), observing modes and possible
backend combinations are not independent.
• single stamps (section 4.2), take nine point maps with a single integration, not fully sampled.
• raster maps, i.e. observations where the telescope steps through a
series of points (usually fixed in the equatorial system), at each of
which the telescope dwells for some integration time.
• on-the-fly maps, i.e. observations where data are taken while the telescope moves at constant velocity along a linear path in the equatorial
system.
The upgraded web–based time estimator (version 2.5 and higher) handles
these modes in an approximate way. Simple integrations on point sources
are also possible.
10
Figure 5: Wobbler–switching with HERA. Right frame: A linear sequence
of pixels is considered, the center one of which is located on the pointing
axis of the telescope pointed at a source. When the wobbler is switched on
(wobbler throw is equal to the pixel separation) 4 beams are generated on
the sky. Plus and minus signs after the pixel number indicate the polarity of
the wobbler phases (negative ones are outlined in dashed lines). Left frame:
Observation of an extended source, IRC+10216, in 12 CO(2–1). System temperatures are below 300 K, integration time is 2 min. Apart from the usual
signal in the center pixel, two peripheral pixels detect a negative signal at
the level of about 50%. Horizontal scales (LSR velocity, km/s) and vertical
scale (antenna temperature, K) are identical for all pixels (number in the
upper right corner of each spectrum).
4.1
General aspects
4.2
Single Stamps and Observations of Point sources
The very basic observations are single integrations with a fixed position
on the sky. This will result in 18 spectra on nine position of the sky (see
Fig. 4). If requested the pattern can be turned around the central pixel
with the help of the derotator command. Before starting large maps it is
always recommended to do such a single shot in order to make sure that
the system has been set up properly. The pattern can also be offset from
the pointing center by the usual commands of PAKO. If observed with the
derotator tracking in the sky system the spectra will be written with the
correct offsets into the spectra.30m file. The use of an array receiver offers
also a certain signal–to–noise advantage compared to single pixel receivers.
So far we tested several wobbler switching schemes where the source was observed more efficiently than in the 50% available with the standard wobbler
switching mode. The aim was to combine the increased switching efficiency
available with the array with the optimum baseline quality inherent in the
standard wobbler–switched mode.
Our most successful schema is outlined in Fig. 5. A linear sequence
of pixels is aligned with the horizontal direction in which the subreflector
11
was wobbling.√The wobbler throw is set equal to the pixel separation (usually 24”, but 2 × 24′′ when a diagonal pixel sequence is chosen), and the
derotator is commanded as
PAKO>receiver hera1 /derot −45 H
The standard ’onoff’ command of PAKO then executes two observations
with telescope offsets of ±throw/2. The schema shows that pixel 2 sees the
source in each observation for 50% of the time exactly as in standard wobbler
switching with a single pixel receiver. Additionally, HERA pixels No. 1 and
3 are also looking at the source, but only during one of their phases. Since
the wobbler–switched signal is the difference between the two observations,
pixels No. 1 and 3 register the source signal at a level of −50%. Averaging
the signals from the three pixels with their right polarity therefore increases
the signal–to–noise ratio by √23 over the standard wobbler–switching.3 In
our particular observation (Fig. 5) weak signals are also detected in other
pixels demonstrating that the source is actually extended. The spectroscopic
baseline is flat in all pixels, no deterioration was detected compared to the
standard wobbler–switching with a single pixel receiver. In a more severe
test, a long integration of a CO transition in a z = 2.2 source was made.
The baselines were again flat and the line was detected.
Other wobbler switching schemes were tried where the full signal amplitude was obtained not only for pixel 1, but also for pixels 2 and 9. The S/N
improvement in these more complicated schemes were however less than in
the scheme described above (they would become more interesting with larger
arrays).
position switching. The raster map procedure asks for the position offset
of the reference position with respect to the map center. It is possible to
do several ON source observations per reference observation. This saves
observing time, but was found to easily introduce poorer baselines. (Note
that HERA operates at 1.3mm wavelength)
wobbler switching. This mode gives the best baselines on the 30m. As the
wobbler throw is at maximum 240′′ , map and source size must be matched
carefully if the reference beams are to be kept free of signal. Note that
contrary to position switching the position of reference beams refer to the
current raster point (not the map center) and rotate with respect to the
source.
frequency switching. For many extended sources, wobbler and even position switching may not be adequate, and only frequency switching may
be practical. Owing to its position in the Nasmyth cabin, HERA has the
cleanest optical path of all 30m receivers. Its frequency baselines are found
to be the best recorded so far. A ripple at 6.9 MHz, probably originating from reflections between the subreflector and the mixers, dominates the
spectroscopic baseline. Flat baselines are obtained by setting the frequency
throw equal to this value or multiples of it. Satisfactory performance was
obtained up to throws of 6 × 6.9 MHz (54 km/sec).
3
Compared√ to single pixel wobbler switching the signal is doubled and the noise is
increased by 3. This S/N ratio increase of ∼ 15% is improved to ∼ 22% if optimum
weights are used when averaging the spectra ( 41 , 12 , 14 ) from the three pixels.
12
Figure 6: Orientation of the HERA pixel pattern used in the coarsely sampling OTF mapping mode. The pixel pattern is rotated by χ = 18.5◦ in the
equatorial system. This results in a uniform OTF map where the scanning
lines (parallel to right ascension) are separated in declination by ∆s = 7.6′′ .
If uniform coverage is to be extended toward the north, a second map is
made with a declination offset of ∆δ = 9 × ∆s = 68′′ .
Frequency switching rates up to 10 Hz were successfully tested with both
HERA modules connected to the VESPA backend (sect. 4.1 and Tab. 3) used
with 80 kHz resolution and 40 MHz bandwidth, i.e. 50% usage of VESPA
capacity. However, there is usually no need with the raster-map procedure
to switch faster than about 1 Hz.
4.3
On–the–fly maps
OTF mapping, the most powerful spectroscopic mapping mode on the 30m,
becomes even more powerful with HERA. So far, we have expanded on the
single receiver OTF in the following two ways:
• scanning procedures, some with special orientations of the HERA
beam pattern, reduce the time for mapping by factors somewhere between 3 and 9.
• frequency switching is possible with the VESPA backend, eliminating
the need for reference observations.
13
Scanning procedures. We support the following three scanning procedures, i.e. observing procedures exist, data reduction is tested, and they are
handled by the web–based time estimator (version 2.4 and higher). These
three scanning procedures are associated with different orientations of the
beam pattern (rotation angle χ) with respect to the scanning line (taken
here as right ascension).
⋄ zero rotation (labeled in the Time Estimator: SL–OTF, not inclined)
⋄ coarse sampling (SL–OTF,8 arc sec)
⋄ oversampling (SL–OTF, 4 arc sec)
In the zero rotation mode, the beam pattern is scanned parallel to right
ascension like in Fig. 4. The points on each of the 3 scan lines are sampled
three times, but the area between the three horizontal beam rows is not
sampled. This mode may be useful for obtaining a first quick look on a
weak extended source.
In the coarse sampling mode, the beam pattern is rotated by χ = 18.5◦ .
This results in a slightly under-sampled map where the scan lines are separated by ∆s = 7.6′′ (Fig. 6). The map is homogeneously sampled apart from
60′′ wide vertical margins at the left and right ends of the scanning lines.
In the oversampled mode, the beam pattern is rotated by χ = 9.5◦ .
This generates three bundles of three scan lines spaced by ∆s = 3.9′′ , the
separation between the bundles being ∆δ = 3 × ∆s. Two OTF scans must
therefore be made (see Fig. 7) which are offset by ∆δ in declination. The
scan direction of these two OTF scans may be the same, as shown in the
figure, or opposite to each other. At the end, a homogeneously sampled map
is obtained again, apart from 56′′ wide lateral margins.
Note that for maps smaller than typically 2′ on a side, the size of these
margins are a large fraction of the total area to be mapped. Such small
maps are therefore more efficiently done in raster mode.
Total power OTF is available with VESPA, WILMA and the filter spectrometers. Observations with the 4 MHz filterbank clearly demonstrate the
sensitivity of this observing mode to sky noise and gain variations in the
receiver. Together with the unavoidable nonlinearities of the backends, sky
noise and receiver gain variations lead to base line distortions and (for the
correlators) to platforming. Good and stable weather conditions are therefore mandatory for this observing mode..
The gain drifts are related to the temperature fluctuation of the cryostat
which has an irregular cycle period of 3 to 5 min and sometimes intrinsic
mixer instabilities. Under good weather conditions (Tsys ∼ 300 K) the drifts
which may be as rapid as a few seconds reach amplitudes of 0.2 K. The gain
drifts affect different sections of the bandpass differently, and are statistically
less severe near the times when a reference observation is made.
Software is being developed to correct for the gain drift induced baseline variations. The mainly concerned extra-galactic observers are invited to
contact H. Wiesemeyer ( [email protected]). about what is currently possible. Furthermore, the physical temperature of the mixers are monitored
14
Figure 7: Orientation of the HERA pixel pattern used in the oversampling
OTF mapping mode. The pixel pattern is rotated by χ = 9.5◦ in the
equatorial system. Two OTF scans are made separated by ∆δ = 3 × ∆s
= 12′′ in declination. A second pair of such maps (not shown), offset in
declination by 6 × ∆δ = 71′′ , extends uniform coverage to the north.
and written to the Raw data (IMBFits) and can be used to re–calibrate the
receiver gain.
Frequency switched OTF is available with the same hardware limitations
as with rasters (sect. ??). A high (> 1 Hz) frequency switching rate is
however more important here than with rasters.
4.4
Ugly details
The procedures described in this manual do not exist yet for the NCS.
No Backend pre-integration done in the NCS (yet!). So with fast i.e. 10
Hz Frequency switching the raw data file tend to get very large and the data
calibration in MIRA impossible slow! So for the time being observers are
advised to ’switch as slow as possible’ i.g. use 0.5 Hz Frequency switching
when the intended sampling of the sky is 2 seconds.
15
Figure 8: A rotated coordinate system is illustrated with an outflow source
centered on the star (∗) which is located at α0 , δ0 in the equatorial system.
The new coordinate system has its equator, λ, aligned with the outflow
lobes, and the orgin of the new system is at the star. The latitude, β, makes
an angle κ with the local meridian.
4.5
4.5.1
Special Observing Modes
Rotated coordinate systems
OTF mapping in coordinates other than the equatorial system are also possible in the future, but are not needed anymore to aligne a map with the
plane of a galaxie or a molecular outflow. A OTF map can now be scanned
along inclined scanlines, i.e. scanning both in x and y. The following discussion does also apply in this case, where κ is the angle between the scanning
direction and equator.
In such a system, rotated by the angle κ relative to the equatorial system, the derotator has to be given the same additional angular offset. The
corresponding PAKO command would be
PAKO> receiver hera1 /derot χ−κ S
where χ is as above the angle induced by the OTF mapping mode. This
situation is depicted in Fig. 8 where the array scans along the λ axis of a
descriptive system centred at (α0 , δ0 ) and tilted by the angle κ with respect
to the local meridian. Change of your observations into a rotated coordinate
system is foreseen in PAKO but not yet tested.
16
4.5.2
Backends
HERA as a general purpose multi–beam receiver has strong demands on
spectral backends. Tab. 2 lists the available backends.
type
4MHz FB
VESPA
WILMA
Table 2: Backends for HERA
channel spacing bandwidth number
kHz
MHz
of units
4000
20 – 1250
2000
1024
20 – 640
930
9
9 – 36
18
status
available
available
available
The filterbank consists of 9 units with 256 channels each. The channels
have a half-power width (resolution) of ca. 5 MHz, corresponding to a
noise–equivalent bandwidth of 6.4 MHz. Channel spacing is 4 MHz. The 9
units were successfully taken into operation in February 2003. The PAKO
command for setting up the filterbank is
PAKO> backend 4MHz 1 /Receiver HERA1 or HERA2
The uncalibrated raw data are written to a LINUX computer. An automatic calibration task generates a spectra.30m file which can be analysed
with CLASS. The 4 MHz data are identified by their “set telescope” name.
The central pixel, e.g., is designated as 30M-4M1-1H05.
The digital correlator VESPA offers spectral resolutions in the range 20
- 1250 kHz (Tab. 3). Up to 4 spectral bands per pixel are available for the
current 9+9–pixel array. The 4 bands can be placed anywhere in the lower
half of the 1 GHz wide IF range. Remember to configure the receivers in
”narrow” mode when using Vespa.
A typical PAKO command for setting up the correlator is
PAKO> receiver VESPA 1 0.320 160 0.0 /Receiver HERA1 or HERA2
where one section of VESPA is connected to each HERA pixel. Each
section has a channel spacing of 320 kHz, 160 MHz of nominal bandwidth,
and an offset of zero (in MHz) from the IF center. This configuration uses
50% of VESPA hardware, so that more sections could be connected, possibly
at off–center frequencies.
The calibrated HERA spectra are identified in CLASS by their “set
telescope” name. The central pixel, e.g., is designated as 30M-V01-2H05
where V01 stands for the first frequency band connected and 2H05 stands
for pixel No. 5 of HERA2. (see also Tab. 1).
The new correlator is now the wide band (usable bandwidth 18 x 930
MHz) WILMA backend offering 9 + 9 spectral bands. The setup in PAKO
is simple, the following
PAKO> backend WILMA 1 /Receiver HERA1 or HERA2
sets the first 9 spectral bands, and
PAKO> backend WILMA 2 /Receiver HERA1 or HERA2
sets the second 9 spectral bands.
The distribution of the 4MHz and WILMA backends and HERA1 and
17
HERA2 is now done automatically by a new ’distribution box’. Only the
4MHz has to be switched manually between single pixel receivers and HERA.
Table 3: VESPA configuration table.
channel spacing
kHz
1250
1250
1250
1250
320
320
320
320
80
80
80
80
40
40
40
40
20
20
5
bandwidth, MHz
nominal actual
160
320
480
640
80
160
240
320
40
80
120
160
20
40
60
20
20
40
number of channels
raw data RED calibrated
141.2
281.2
421.2
511.2
70.3
140.3
210.3
280.3
35.1
70.1
105.1
140.1
17.5
35.0
52.5
70.0
17.5
35.0
1152
2304
3456
4608
2304
4608
6912
9216
4608
9216
13824
18432
4608
9216
13824
18432
9216
18432
9(18) × 113
9(18) × 225
9 × 337
9 × 409
9(18) × 225
9(18) × 449
9 × 673
9 × 897
9(18) × 449
9(18) × 897
9 × 1345
9 × 1793
9(18) × 448
9(18) × 896
9 × 1344
9 × 1792
9(18) × 896
9 × 1792
usage
%
25(50)
50(100)
75
100
25(50)
50(100)
75
100
25(50)
50(100)
75
100
25(50)
50(100)
75
100
50(100)
100
Data reduction
Extensions for HERA. Data reduction for HERA data is very similar to
the one for single beam receivers. The only difference is that the raw data
contain now information about the derotator angle offset and the actual
tracking system. In addition the ’actual’ derotator angles are written to the
data once per second or less, so one can recover the correct pixel offsets even
if the derotator is ’stuck’ in one of its limits.
NEW: Calibration via ODP (under development) All the spectral
line data, including some OTF maps will be calibrated on-line under linux
using MIRA.
At present observers have to calibrate their data ’by hand’. The extensions to MIRA concerning HERA are straight-forward: Where apropriate a
command has a (/PIXEL n) option. The reader is referred to the MIRA
documentation for details.
18
6
Appendix B: HERA Sky frequencies
Hera - Sky frequencies (GHz)
HERA - 1
DSB
SSB
267.98
266.99
266.00
264.98
260.99
260.00
257.99
245.99
243.98
231.98
230.00
227.90
226.58
226.28
225.98
225.98
224.00
221.00
218.99
216.98
HERA - 2
DSB
SSB
267.98
266.99
266.00
264.98
260.99
260.00
257.99
245.99
245.00
243.98
231.98
230.00
227.90
226.58
226.28
226.01
226.01
224.99
224.99
224.00
221.00
218.99
216.98
265.91
260.30
244.91
241.70
236.00
231.90
231.20
230.51
230.00
229.01
227.90
227.00
226.61
225.71
224.00
224.00
221.00
220.40
219.59
218.30
216.11
218.00
215.93
244.91
241.70
231.90
231.20
230.51
227.90
226.61
225.71
220.40
219.80
218.30
216.59
216.11
215.93
Figure 9: Current (February 2006) list of frequencies that HERA can be
tuned to. This list is ever expanding.
19