1
changes with the environment, temperature, weather, nearby objects, and Reflections. Therefore, relative
comparison using Histogram to find the Maximum level area is suggested.
(10) EDl5SA is a broadband High frequency (RF) type of Electrical field measuring device. It is used for
applications such as Mobile phone base station antenna radiation, Microwave oven, Cellular/cordless
phone, Radio transmitters, and WiFi wireless LAN installation
It is not for low frequency magnetic
held measurement (AC power line, transformer, high voltage power transmission line, motor ...) which
should be measured with Gauss-meters, such as CORNET ED25G RF/LF meter.
aid.
3) LCD backlit auto-off conlrol and Batterv low indication
--- LCD backlit will ON when the
EDlSSA is power-up. It will auto-off after 10 seconds to save the battery power. To tum on/off the LCD
backlit manually, go to power meter mode, get into HOLD state, then toggle the l"tpush button to turn
on/off the backlit manually. If the 9V battery is below the 5V threshoid, the "BAT Low" indication will
ON in the initial LCD screen when the ED15SA is power-up. The EDl5SA continues working until the
battery dies. When the "BAT loil' is on; there will be no LCD backlit. Please replace the battery when
"BAT low" is on, to make swe the ED15SA is working properly.
2) Spectrum Analvzer modes:
(1) There are two Spectrum Analyzer modes. Normal Spectrum mode, and PeakHold spectrum mode.
The RF signal strength and Frequency Spectrum is shown on the graphics I-CD display with level in dBm
and frequency in GHz.
(2) Two modes ofspectrumanalvzer operations
(a) Normal Speclrum mode -- the EDl5SA displays the real time frequency spectrum,
(b) PeakHold Spectrum mode the ED1SSA hold and displays the peak value of the
measured signal level for each frequency. PeakHold mode is good for monitoring fast changing RF
-
signals, such as burst RF or Digital RF signals. A PeakHold indicator {P} will be shown on the top right
corner of the LCD display in this mode. See $gf,
+ You can change the operation modes by toggling the "Mode/cursor-button" which is the first
button below the power switch. The "Mode/cursor-button" will cycle through (1) Power meter mode (2)
Normal spectrum mode (3) PeakHold spectrum mode.
(3)
Max. Siqnal Level of
the entire 2.4GHz
band--In Normal mode or PeakHold mode,
the LCD
will
display the Maximum signal level measured for the entire 2.4GHz band in the top of the display. This is
good for applications such as Radiation Safety Level measurements, maximum level detections. The
EDl5SA updates the Max. Signal I-evel (dBm) readout for every scan ofthe entire 2.4GHz
For
Radiation Safety applications, signal power level to power density conversion reference table is in the
band.
lowerlefthandsideoftheEDl5SAfrontenclosure.
SeeRFradiationsafetysectionfordetails.
+ The
ED15SA Spectrum Analyzer mode is a narrow band design. the signal indicated is for the
specific frequency. For wide bmd RF signals such as WiFi wireless LAN, each channel bandwidth is
22MHzwide, you need to integrate all the signal levels in the 22MHz bandwidth to get the total signal
power of it. The ED15SA power-meter mode is a broad band design; it shows the total power level
measured in the bandwidth.
(4)
Mode/Cursor bulton ------ The 1" push button below the Power Switch is used to change the
operation mode of the ED15SA in between RF pow€r-meter mode, Nomal Spectrum mode and PeakHold
Spectrum mode. It is also used to move the Frequency Cursor or Channel-Cursor while in "Hold" state.
(5)
Hold button ------ The 2'd push button is used to get a snapshot or to "Hold" the scanning of the
frequency spectrum. Once in the "Hold" state the spectrum scan will freeze and the LCD will display the
signal level and frequency in the Frequency-Cursor location. Push the Hold button again; it will display
the Average signal levels. Push the Hold button again; it will show the signal levels of 14 WiFi channels
in Channel-Cursor location. Push the Hold bufton again to get out of the "Hold" state, and start the
spectrum scanning again,
There are two types of RF signals used in today's wireless communication systems, i.e. Analog RF
and Digital RF signals. The traditional AM/FM Analog RF signals are continues wave signals. The
frequency spectrum of this type of signal is stable and easy to caphrre. AM/FM radio, analog cordless
phone, wireless spy camera, remote control, and Radio transceivers are some examples of Analog RF
signals. Tlpical Analog RF spectrum is shown in Fie.2. Both Normal spectrum mode and PeakHold
mode can be used for Analog RF signal.
Digital RF signal is burst tlpe signals, it is used in digital communications such as: Mobile Phone,
GSM, WiMAX, WiFi wireless I-AN, Bluetooth, Zgbee, DECT phone and most of the new wireless Home
audio/video devices. This type of signal is transmitted very fast in short bursts to shre the frequency
bandwidth between several different devices. In order to capture the frequency spectrum of Digital RF
signals, tracking of the RF bursts are necessary. If the spectrum analyzer is out of sync with Digital RF
burst signal or the burst ON time is short, only short spike of spectrum will be shown. The typical Digital
RF signal frequency spectrum in Nomal Spectrum mode is shown in
In order to show the full
spectrum of Digital RF signal, the PeakHold mode can be used. In PeakHold mode, the spectrum analyzer
will overlap the PeakHolded signals captured several times to reassemble the whole frequency spectrum
of the signal. See Fie.4 for the spectrum in PeakHold mode for the same signal. It might need several
seconds or minutes of capture time in PeakHold mode to show the whole frequency spectrum of the WiFi
WLAN, or Bluetooth signals. Fie.5 shows the Bluetooth frequency Hoping system frequency spectrum.
shows the spectrum for Microwave oven when it is ON, which has very wide frequency spread.
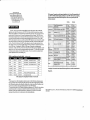
The 2.4GHz band WiFi wireless LAN has frequency coverage from 2.400GH2 to 2.485GH2. The
WiFi frequency band is divided into 14 channels. Each channel is 22MHz wide. There are also overlaps
in between adjacent channels. See below_for the frequency used by each WiFi channel. When ED15SA
is in the "Hold" state and in the Channel display mode, the signal level displayed is the Maximum value
within each channel. Since there re overlaps between adjacent channels, the maximum value may spread
around seveml adjacent chmnels. *Note: (Channel#l, Channel#6, and Channel#l 1 are not overlapped
with each other, and are used in tlpical WiE Access points, there are two notches in the ED1SSA LCD
display frequency axial to mark these three channels). Next to the Maximum value of each channel,
Average signal level of each channel is displayed. This can be used to see the distribution of signals in the
WiFi frequency channels.
WiFi frequency spectrum captured by ED15SA can be used for WiFi WLAN installation and usage
optimization. Try to re-assign the frequency channels used by the WiFi Access-Point to avoid the conflicts
between each other. Data traffic information for each frequency and channel can be estimated by the
frequency/channel spectrum too.
[!g.].
[!g{
*Use the Mode/Cursor button (ln push button) to move the cursors while in "Hold" state.
(6)
Cursors ---- The cursor in the "Hold" state can be used to measure the Signal level for the
specific frequency or channel in the Frequency-Cursor or Channel-Cursor location. Use the "Mode/cursor
button" (1't push button) to move the Cursor. Pushing and hold the "Mode/cursor button" a little bit longer
time will move the cursor quicker along the horizontal axial. The Cursor will wrap around when it reaches
the end of the screen.
* NOTE: the level displayed in the Channel-Cursor is the peak value within each channel. The Average
value within the 22MHz channel bandrvidth of each Channel is shown next to the Peak value. There are
overlaps in adjacent WiFi channels. The cursor is used in the "Hold" state only.
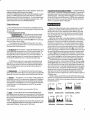
Fiq.2 Anrloq RF
Fic6 Micrcmve oven
Fis.5 Bluet@th
tr1s.6 HoLd-
chanel-@Eor