1
Title Page:
GCAS® Desktop
Manual Guide
Copyright © i-Vigilant Technologies Ltd.
The software "GCAS Desktop", "GCAS" ("Gas Chromatography Analysis Software"), GCAS web version
(http://i-vigilant.com) and this manual guide are protected by intellectual property laws. Unauthorised
copying, modification, or distribution of the software may lead to fine or prosecution according to the
applicable law.
i-Vigilant Technologies Limited is registered in Scotland, United Kingdom, with company registration
number SC426362. Registered office is Unit 26 Murcar Commercial Park, Denmore Road, Bridge of
Don, Aberdeen AB23 8JW.
Revision: 14
Last updated: 12 October 2015
GCAS® Desktop Manual Guide rev. 14
Page 2 of 388
GCAS® Desktop Manual Guide rev. 14
Table of Contents
Title Page: GCAS® Desktop Manual Guide .............................................................................................. 1
Table of Contents ........................................................................................................................................ 3
Revision Log ............................................................................................................................................... 14
1
Welcome ............................................................................................................................................ 18
1.1
What GCAS is ...........................................................................................................................................................18
1.2
System Requirements ...........................................................................................................................................18
1.3
Supported GC Brands ...........................................................................................................................................19
1.4
GCAS Licence and Activation ............................................................................................................................19
1.4.1
Types of Licence ..............................................................................................................................................21
1.4.2
How Many PCs? ...............................................................................................................................................21
1.4.3
Online Activation .............................................................................................................................................22
1.4.4
Offline Activation ............................................................................................................................................23
1.4.5
Instant Trial ........................................................................................................................................................25
1.4.6
Automatic Licence Update ..........................................................................................................................27
1.4.7
Manual Licence Update ................................................................................................................................29
1.4.8
Deactivation ......................................................................................................................................................30
1.5
2
3
Integrity Check ........................................................................................................................................................31
Database ............................................................................................................................................ 33
2.1
Where Your Data is Stored .................................................................................................................................33
2.2
Supported DBMS ...................................................................................................................................................33
2.3
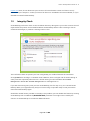
Change Database ...................................................................................................................................................34
2.4
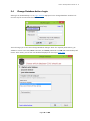
Change Database before Login ........................................................................................................................36
2.5
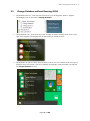
Change Database without Running GCAS ...................................................................................................37
2.6
Reconnect on Network Problem ......................................................................................................................39
2.7
Temporary Database ............................................................................................................................................40
2.8
Flush and Backup ...................................................................................................................................................40
2.9
Automatic Flush and Backup .............................................................................................................................41
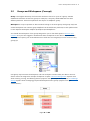
Users, Groups, and Workspaces ..................................................................................................... 44
3.1
User Types and Roles (Concept) ......................................................................................................................44
Page 3 of 388
GCAS® Desktop Manual Guide rev. 14
4
3.2
Groups and Workspaces (Concept) ................................................................................................................45
3.3
Edit Your Profile and Change Your Password .............................................................................................46
3.3.1
Edit Your Profile ...............................................................................................................................................46
3.3.2
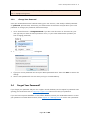
Change Your Password .................................................................................................................................47
3.4
Forgot Your Password? ........................................................................................................................................47
3.5
Logging Out .............................................................................................................................................................48
3.6
Automatic Logout on Inactivity ........................................................................................................................48
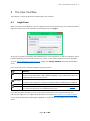
The User Interface ............................................................................................................................ 49
4.1
Login Form................................................................................................................................................................49
4.2
Main User Interface ...............................................................................................................................................50
4.2.1
Device Panel ......................................................................................................................................................50
4.2.2
Recent Device Panel ......................................................................................................................................51
4.2.3
Search Tool and Toolbar ..............................................................................................................................51
4.2.4
Status Bar ...........................................................................................................................................................51
4.3
4.3.1
Choose Devices Dialogue ....................................................................................................................................52
Persistent Device Selection .........................................................................................................................53
4.4
Notifications .............................................................................................................................................................54
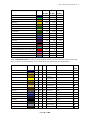
4.5
Standard Colour Palette ......................................................................................................................................55
5
Analysis Parameter ........................................................................................................................... 58
6
C-number Glossary ........................................................................................................................... 59
7
Footprint and Calibration Data ...................................................................................................... 60
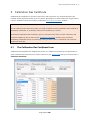
7.1
The Footprint Form ................................................................................................................................................61
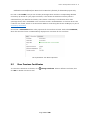
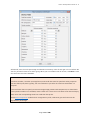
7.2
The Calibration Data Form .................................................................................................................................64
7.3
View Previous Footprints/Calibration Data ..................................................................................................66
7.4
Import New Footprint/Calibration Data........................................................................................................67
7.4.1
Text Import ........................................................................................................................................................68
7.4.2
CSV Import ........................................................................................................................................................70
7.4.3
Manual Entry .....................................................................................................................................................72
7.5
Change Record Flag and Status .......................................................................................................................75
7.5.1
Change Record Flag .......................................................................................................................................75
7.5.2
Change Status ..................................................................................................................................................76
7.6
Incomplete Footprint or Calibration Data ....................................................................................................77
Page 4 of 388
GCAS® Desktop Manual Guide rev. 14
7.7
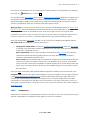
Zoom and Scroll (RF Chart Only) .....................................................................................................................79
7.8
GC Health Status ....................................................................................................................................................81
7.9
Insert Comment ......................................................................................................................................................82
7.10
Send to Correlation Calculator .........................................................................................................................83
7.11
Multilevel-Calibrated RF (ISO 10723) .............................................................................................................84
7.11.1
MLC Flag Bit ......................................................................................................................................................86
7.11.2
Mark As versus Convert To .........................................................................................................................86
7.11.3
Change MLC Flag Bit (Multiple Records) ...............................................................................................88
7.11.4
MLC Constraints ..............................................................................................................................................89
7.12
8
9
Printing .......................................................................................................................................................................89
Mole Composition ............................................................................................................................ 90
8.1
The Mole Composition Form ..............................................................................................................................90
8.2
View Previous Records .........................................................................................................................................92
8.3
Import New Composition Data ........................................................................................................................92
8.4
Spot Sampling .........................................................................................................................................................94
8.5
Change Record Status (Single Record)..........................................................................................................97
8.6
Change Record Status (Multiple Records) ...................................................................................................98
8.6.1
Simple View .......................................................................................................................................................99
8.6.2
Advanced View ............................................................................................................................................. 100
8.7
Insert Comment ................................................................................................................................................... 103
8.8
Automatic or Fixed Scale ................................................................................................................................. 103
8.9
Send to ISO 6976 Calculator ........................................................................................................................... 104
8.10
Multilevel-Calibrated MC (ISO 10723) ........................................................................................................ 105
8.10.1
MLC Flag Bit ................................................................................................................................................... 107
8.10.2
Mark As versus Convert To ...................................................................................................................... 108
8.10.3
Change MLC Flag Bit (Multiple Records) ............................................................................................ 108
8.10.4
MLC Constraints ........................................................................................................................................... 110
Calibration Gas Certificate ............................................................................................................ 111
9.1
The Calibration Gas Certificate Form .......................................................................................................... 111
9.2
View Previous Certificates ................................................................................................................................ 112
9.3
Input a New Certificate ..................................................................................................................................... 113
9.4
Edit a Certificate................................................................................................................................................... 115
Page 5 of 388
GCAS® Desktop Manual Guide rev. 14
9.5
Change Certificate Status ................................................................................................................................ 116
9.6
Change k Number (Coverage Factor) ......................................................................................................... 117
9.7
Insert Comment ................................................................................................................................................... 118
9.8
Send to ISO 6976 Calculator ........................................................................................................................... 119
10
Data Analysis ................................................................................................................................... 120
10.1
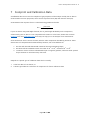
The Data Analysis Form .................................................................................................................................... 120
10.2
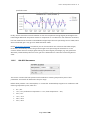
Parameters, Chart Types, and Components ............................................................................................. 120
10.2.1
Parameters ...................................................................................................................................................... 121
10.2.2
Chart Types..................................................................................................................................................... 121
10.2.3
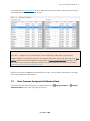
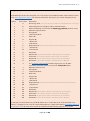
Components .................................................................................................................................................. 124
10.3
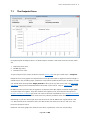
Date and Time Range (Plot Range) .............................................................................................................. 126
10.4
Mean and Standard Deviations ..................................................................................................................... 127
10.5
Zoom Mode and Selection Mode ................................................................................................................ 130
10.6
Change Axes Scale .............................................................................................................................................. 132
10.7
Save or Copy the Chart ..................................................................................................................................... 133
10.8
Colourblind Assistance ..................................................................................................................................... 134
10.9
Selection Mode Menus ..................................................................................................................................... 136
10.10
Other Visual Cues ................................................................................................................................................ 138
10.11
Insert Comment ................................................................................................................................................... 140
11
Uncertainty Calculation ................................................................................................................. 142
11.1
The Uncertainty Calculator Form .................................................................................................................. 142
11.2
Calculation Steps ................................................................................................................................................. 144
11.3
Input Pages ............................................................................................................................................................ 144
11.3.1
Uncertainties to Include ............................................................................................................................ 144
11.3.2
Uncertainty from the Calibration Gas .................................................................................................. 145
11.3.3
Uncertainty from GC Repeatability and Linearity ............................................................................ 145
11.3.4
Uncertainty from GC Reproducibility ................................................................................................... 151
11.3.5
ISO 6976 Inputs ............................................................................................................................................ 151
11.4
Calculation Pages ................................................................................................................................................ 152
11.4.1
Manual Mole Percentage Range ........................................................................................................... 153
11.4.2
Regarding Sensitivity Analysis ................................................................................................................ 154
11.5
Output Pages ........................................................................................................................................................ 155
Page 6 of 388
GCAS® Desktop Manual Guide rev. 14
12
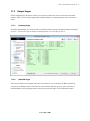
11.5.1
Summary Page .............................................................................................................................................. 155
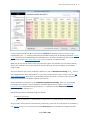
11.5.2
Detailed Pages .............................................................................................................................................. 155
Uncertainty Coefficients ................................................................................................................ 158
12.1
The Uncertainty Coefficients Form ................................................................................................................ 158
12.2
View Previous Coefficient Sets ....................................................................................................................... 160
12.3
Edit Mode ............................................................................................................................................................... 161
12.4
Create New Coefficient Set ............................................................................................................................. 163
12.5
Change Record Status ....................................................................................................................................... 164
13
Uncertainty Trend .......................................................................................................................... 166
13.1
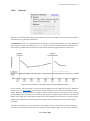
The Uncertainty Trend Form ........................................................................................................................... 166
13.2
Uncertainty Trend Parameters ....................................................................................................................... 167
13.2.1
Uncertainties to Include ............................................................................................................................ 167
13.2.2
Calibration Certificate................................................................................................................................. 168
13.2.3
Footprint Reference .................................................................................................................................... 169
13.2.4
Uncertainty Coefficients and Mole Percentage Range ................................................................. 171
13.2.5
ISO 6976 Parameters .................................................................................................................................. 173
13.2.6
Direction .......................................................................................................................................................... 174
13.2.7
Plot Range ...................................................................................................................................................... 175
13.2.8
Miscellaneous ................................................................................................................................................ 176
13.3
Uncertainty Trend Chart ................................................................................................................................... 176
13.3.1
Comparing Previous Chart ....................................................................................................................... 178
13.3.2
Zoom and Scroll ........................................................................................................................................... 179
13.3.3
Save or Copy the Chart .............................................................................................................................. 180
13.3.4
Other Visual Cues ........................................................................................................................................ 180
13.3.5
Colourblind Assistance .............................................................................................................................. 182
13.3.6
Uncertainty Trend Diagnostic ................................................................................................................. 182
13.4
Insert Comment ................................................................................................................................................... 183
14
Uncertainty Trend Comparison .................................................................................................... 185
15
Comments........................................................................................................................................ 186
15.1
The Comments Form .......................................................................................................................................... 186
15.2
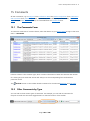
Filter Comments by Type ................................................................................................................................. 186
15.3
Filter Comments by Date ................................................................................................................................. 187
Page 7 of 388
GCAS® Desktop Manual Guide rev. 14
15.4
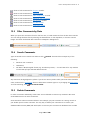
Search Comments ............................................................................................................................................... 187
15.5
Delete Comments ............................................................................................................................................... 187
16
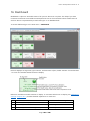
Dashboard ....................................................................................................................................... 189
16.1
16.1.1
Health Status to Display ............................................................................................................................ 192
16.1.2
Rules .................................................................................................................................................................. 195
16.1.3
Uncertainty Calculation Settings ............................................................................................................ 196
16.1.4
Display Style ................................................................................................................................................... 197
16.1.5
Miscellaneous ................................................................................................................................................ 198
16.2
17
Dashboard Settings ............................................................................................................................................ 192
Overriding Rules .................................................................................................................................................. 199
16.2.1
Per-Device Override .................................................................................................................................... 199
16.2.2
Per-Workspace Override ........................................................................................................................... 201
16.2.3
Revoking (Cancelling) an Override ....................................................................................................... 202
Mole Composition Comparison ................................................................................................... 203
17.1
The Mole Composition Comparison Form.................................................................................................. 203
17.2
Parameters and Device List ............................................................................................................................. 204
17.2.1
Gas and Date Range ................................................................................................................................... 204
17.2.2
Devices and Comparison List .................................................................................................................. 204
17.2.3
Start Graphing ............................................................................................................................................... 206
17.3
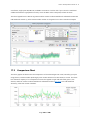
Comparison Chart ............................................................................................................................................... 207
17.3.1
Show or Hide Some Devices ................................................................................................................... 208
17.3.2
Scaling Equalisation .................................................................................................................................... 208
17.3.3
Zoom Mode and Selection Mode ......................................................................................................... 209
17.3.4
Save or Copy the Chart .............................................................................................................................. 211
17.3.5
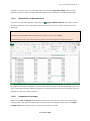
Export Values to Microsoft Excel ........................................................................................................... 212
17.3.6
Comparison of Averages ........................................................................................................................... 212
17.3.7
Send to ISO 6976 Trend Comparison .................................................................................................. 213
17.3.8
Selection Mode Menus .............................................................................................................................. 215
17.3.9
Other Visual Cues ........................................................................................................................................ 216
17.3.10 Colourblind Assistance .............................................................................................................................. 218
18
Correlation Calculator .................................................................................................................... 219
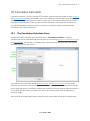
18.1
The Correlation Calculator Form ................................................................................................................... 219
Page 8 of 388
GCAS® Desktop Manual Guide rev. 14
18.2
RF-MW Calculator ............................................................................................................................................... 220
18.3
Any X-Y Calculator .............................................................................................................................................. 222
18.4
Any log(X)-log(Y) Calculator ........................................................................................................................... 223
19
ISO 6976 Calculator ........................................................................................................................ 225
19.1
The ISO 6976 Calculator Form ....................................................................................................................... 225
19.2
Ways to Enter Composition ............................................................................................................................ 226
19.2.1
Manual Input ................................................................................................................................................. 227
19.2.2
Normal Paste and Smart Paste ............................................................................................................... 227
19.2.3
Load a Mole Composition Record ........................................................................................................ 229
19.2.4
Load a Calibration Certificate .................................................................................................................. 229
19.3
Add Description ................................................................................................................................................... 230
19.4
Compare Two ISO 6976 Calculators ............................................................................................................ 230
20
ISO 6976 Trend ............................................................................................................................... 233
20.1
The ISO 6976 Trend Form ................................................................................................................................ 233
20.2
ISO 6976 Properties ........................................................................................................................................... 233
20.3
Plot Range and ISO 10723 Conversion ...................................................................................................... 234
20.4
Mean and Standard Deviations ..................................................................................................................... 236
20.5
Save or Copy the Chart ..................................................................................................................................... 237
20.6
Comparing Previous Chart .............................................................................................................................. 238
20.7
Zoom Mode and Selection Mode ................................................................................................................ 239
20.8
Selection Mode Menus ..................................................................................................................................... 241
20.9
Other Visual Cues ................................................................................................................................................ 242
20.10
Export Values to Microsoft Excel .................................................................................................................. 243
20.11
Insert Comment ................................................................................................................................................... 244
21
ISO 6976 Trend Comparison ......................................................................................................... 246
21.1
The ISO 6976 Trend Comparison Form ....................................................................................................... 246
21.2
Parameters and Device List ............................................................................................................................. 247
21.2.1
Plot Range and ISO 6976 Properties .................................................................................................... 247
21.2.2
Devices and Comparison List .................................................................................................................. 248
21.2.3
Start Graphing ............................................................................................................................................... 250
21.3
Comparison Chart ............................................................................................................................................... 251
21.3.1
Show or Hide Some Devices ................................................................................................................... 252
Page 9 of 388
GCAS® Desktop Manual Guide rev. 14
22
21.3.2
Zoom Mode and Selection Mode ......................................................................................................... 252
21.3.3
Save or Copy the Chart .............................................................................................................................. 253
21.3.4
Export Values to Microsoft Excel ........................................................................................................... 254
21.3.5
Selection Mode Menus .............................................................................................................................. 255
21.3.6
Comparison of Averages ........................................................................................................................... 256
21.3.7
Other Visual Cues ........................................................................................................................................ 259
21.3.8
Colourblind Assistance .............................................................................................................................. 260
ISO 10723......................................................................................................................................... 261
22.1
MLC Coefficients (Concept) ............................................................................................................................ 261
22.2
MLC Constraints (Concept) ............................................................................................................................. 261
22.3
MLC Constraints Override Level (Concept) ............................................................................................... 263
22.4
The Multilevel Calibration Coefficients Form ............................................................................................ 264
22.4.1
View Previous Coefficient Sets................................................................................................................ 264
22.4.2
Edit Mode........................................................................................................................................................ 265
22.4.3
Create New Coefficient Set ...................................................................................................................... 267
22.4.4
Change Record Status ................................................................................................................................ 268
22.5
22.5.1
Overriding Constraints for Footprint/Calibration Data ................................................................. 269
22.5.2
Overriding Constraints for Mole Compositions ............................................................................... 271
22.5.3
Revoking (Cancelling) an Override ....................................................................................................... 274
22.6
Offline Converter Tools ..................................................................................................................................... 274
22.6.1
MLC ↔ Single-Point RF Offline Converter ......................................................................................... 275
22.6.2
MLC ↔ Single-Point MC Offline Converter ....................................................................................... 281
22.7
23
Overriding MLC Constraints ........................................................................................................................... 269
Low-Level ISO 10723 Implementation ....................................................................................................... 288
Lag Time .......................................................................................................................................... 289
23.1
The Lag Time Calculator Form ....................................................................................................................... 290
23.2
The Lag Time Form ............................................................................................................................................. 293
24
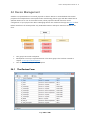
Device Management ...................................................................................................................... 294
24.1
25
The Devices Form ................................................................................................................................................ 294
24.1.1
Create, Edit, Delete Devices ..................................................................................................................... 295
24.1.2
Reorganise Multiple Devices ................................................................................................................... 298
Data Capture ................................................................................................................................... 300
Page 10 of 388
GCAS® Desktop Manual Guide rev. 14
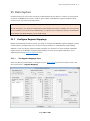
25.1
Configure Register Mappings ........................................................................................................................ 300
25.1.1
The Register Mappings Form ................................................................................................................... 300
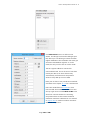
25.1.2
Bit Length and Byte Ordering ................................................................................................................. 301
25.1.3
Calibration Parameter Registers ............................................................................................................ 301
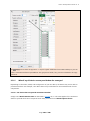
25.1.4
Mole Composition Streams ..................................................................................................................... 303
25.1.5
What if my GC device cannot provide data for some gas? ......................................................... 306
25.1.6
Backup and Restore Configuration ....................................................................................................... 307
25.1.7
Reset to Default ............................................................................................................................................ 308
25.1.8
Tools/Shortcuts ............................................................................................................................................. 308
25.1.9
Troubleshooting ........................................................................................................................................... 309
25.2
Capture Data ......................................................................................................................................................... 310
25.2.1
The GC Connect Form ................................................................................................................................ 310
25.2.2
Connection Settings.................................................................................................................................... 311
25.2.3
Device Settings ............................................................................................................................................. 312
25.2.4
Data Retrieval Options ............................................................................................................................... 313
25.2.5
Start Capture .................................................................................................................................................. 314
25.2.6
Stop Capture and Commit Data ............................................................................................................ 316
25.2.7
Unattended Mode ....................................................................................................................................... 317
25.2.8
Data Capture Error Log .............................................................................................................................. 319
25.2.9
Data Capture Connection Log ................................................................................................................ 320
25.3
Modbus Error Codes and Handling ............................................................................................................. 323
25.3.1
About Error Codes ....................................................................................................................................... 323
25.3.2
Advanced GC Connection Preferences................................................................................................ 323
25.3.3
Automatic Connection Restart ............................................................................................................... 324
25.3.4
Automatic Connection Termination ..................................................................................................... 325
25.4
Controlling Multiple Data Captures ............................................................................................................. 326
25.4.1
Start Multiple Data Captures with Delay ............................................................................................ 327
26
Report .............................................................................................................................................. 329
27
Administrator Menu ...................................................................................................................... 330
27.1
Manage Users ....................................................................................................................................................... 330
27.1.1
Create a New User ....................................................................................................................................... 330
27.1.2
Edit an Existing User ................................................................................................................................... 331
Page 11 of 388
GCAS® Desktop Manual Guide rev. 14
27.1.3
Delete Users ................................................................................................................................................... 332
27.2
Define New User Types and Roles ............................................................................................................... 333
27.3
Manage Groups ................................................................................................................................................... 334
27.3.1
Create, Edit, Delete Groups ...................................................................................................................... 334
27.3.2
Add, Edit, Delete Workspace within Groups ..................................................................................... 335
27.4
Assign Users into Groups ................................................................................................................................. 337
27.4.1
User View ........................................................................................................................................................ 337
27.4.2
Group View ..................................................................................................................................................... 338
27.5
Menu Permissions ............................................................................................................................................... 341
27.6
Action Permissions ............................................................................................................................................. 342
28
Export Data...................................................................................................................................... 343
28.1
Export to CSV ........................................................................................................................................................ 344
28.2
Copy to Microsoft Excel .................................................................................................................................... 348
28.3
Export to Microsoft Access.............................................................................................................................. 352
28.4
Export to Microsoft SQL Server Compact Database ............................................................................. 357
29
Work Offline.................................................................................................................................... 364
29.1
Set Up Temporary Database........................................................................................................................... 364
29.1.1
Create New Temporary Database ......................................................................................................... 364
29.1.2
Restore a Backup ......................................................................................................................................... 366
29.2
Synchronise Temporary Database ................................................................................................................ 366
29.3
Going Offline, Going Online ........................................................................................................................... 367
29.4
Automatic Sync when Returning Online .................................................................................................... 369
29.5
Automatic Switchover on Network Problem............................................................................................ 369
29.6
Automatic Resumption of Data Capture ................................................................................................... 371
29.7
Automatic Detection of Online Connectivity ........................................................................................... 372
29.8
Sync Error Log ...................................................................................................................................................... 374
29.9
Conflict Resolution ............................................................................................................................................. 375
29.10
Login Form in Offline Mode ........................................................................................................................... 377
29.11
Online/Offline Mode Persistence.................................................................................................................. 378
29.12
Maintenance of Temporary Database ........................................................................................................ 379
29.13
Deactivate Offline Working ............................................................................................................................. 380
30
Diagnostic and Maintenance ........................................................................................................ 382
Page 12 of 388
GCAS® Desktop Manual Guide rev. 14
30.1
Diagnostic Mode ................................................................................................................................................. 382
30.2
What Happened to Bug Report Wizard? ................................................................................................... 383
31
GCAS Startup Parameters ............................................................................................................. 385
Page 13 of 388
GCAS® Desktop Manual Guide rev. 14
Revision Log
Revision
:
14
Finalised on
:
12 October 2015
Based on
:
GCAS Desktop version 1.8.1.0
-
Updated chapter 21 (ISO 6976 trend comparison)
-
Inserted chapter 17.3.7 (Send to ISO 6976 trend comparison)
-
Updated screenshots for few other chapters
Revision
:
13
Finalised on
:
17 September 2015
Based on
:
GCAS Desktop version 1.8.0.0
-
Updated chapter 20 (ISO 6976 trend)
-
Updated chapter 15 (Comments)
Revision
:
12
Finalised on
:
26 August 2015
Based on
:
GCAS Desktop version 1.7.4.0
-
Updated screenshots
-
Renumbered chapter 27 to 31 (GCAS startup parameters)
-
Renumbered chapter 26 to 30 (Diagnostics and maintenance)
-
Renumbered chapter 25 to 29 (Working offline)
-
Renumbered chapter 24 to 28 (Export data)
-
Renumbered chapter 23 to 27 (Administrator menu)
-
Renumbered chapter 22 to 25 (Data capture)
-
Renumbered chapter 21 to 24 (Device management)
-
Renumbered chapter 17 to 18 (Correlation calculator)
-
Renumbered chapter 16 to 17 (Mole composition comparison)
-
Renumbered chatper 15 to 16 (Dashboard)
-
Renumbered chapter 14 to 15 (Comments)
-
Updated chapter 1-13 in regard to ISO 10723 support
-
Chapter 14 (Uncertainty trend comparison) is reserved for future updates
-
Updated chapter 19 (ISO 6976 calculator)
-
Chapter 20 (ISO 6976 trend) and 21 (ISO 6976 trend comparison) are reserved for future
updates
-
Inserted chapter 22 (ISO 10723)
-
Updated chapter 23 (Lag time)
-
Chapter 26 (Report) is reserved for future updates
-
Removed chapter 30.2 (Bug report wizard)
Page 14 of 388
GCAS® Desktop Manual Guide rev. 14
Revision
:
11
Finalised on
:
22 December 2014
Based on
:
GCAS Desktop version 1.4.5.0
-
Updated screenshots
-
Inserted chapter 13 (Uncertainty trend)
-
Complete rewrite on chapter 16 (Mole composition comparison)
-
Updated chapter 11 (Uncertainty calculation)
-
Updated chapter 27 (GCAS startup parameters)
-
Minor update on chapter 1.4
Revision
:
10
Finalised on
:
5 November 2014
Based on
:
GCAS Desktop version 1.3.4.0
-
Updated screenshots
-
Updated chapter 12 (Uncertainty coefficients)
-
Updated chapter 23 (Export data)
-
Updated chapter 24 (Work offline, minor changes)
Revision
:
9
Finalised on
:
30 October 2014
Based on
:
GCAS Desktop version 1.3.3.0
-
Inserted subchapter 8.8
-
Inserted subchapter 9.7
-
Updated chapter 14 (Dashboard)
-
Updated chapter 17 (ISO 6976 calculator)
-
Minor updates on chapter 1.4
Revision
:
8
Finalised on
:
13 October 2014
Based on
:
GCAS Desktop version 1.3.1.0
-
Updated chapter 11 (Uncertainty calculation)
-
Updated screenshots
Page 15 of 388
GCAS® Desktop Manual Guide rev. 14
Revision
:
7
Finalised on
:
6 October 2014
Based on
:
GCAS Desktop version 1.3.0.0
-
Major changes in chapter 8 (inserted subchapter 8.5)
-
Updated chapter 12 (Uncertainty coefficients)
-
Major changes in chapter 20 (Agreements and Devices becomes Device Management)
-
Major changes in chapter 21 (Data capture)
-
Updated screenshots
Revision
:
6
Finalised on
:
20 August 2014
Based on
:
GCAS Desktop version 1.2.0.0
-
Inserted chapter 11 (Uncertainty calculation), Mole composition comparison becomes chapter
15.
-
Reserved chapter 12 (Uncertainty coefficients) for future release
-
'Comments' is moved to chapter 13
-
Inserted chapter 14 (Dashboard)
-
Updated chapter 'Correlation calculator', formerly chapter 13, now moved to chapter 16
-
Reserved chapter 17 (ISO 6976 calculator) for future release
-
Reserved chapter 18 (Lag time calculator) for future release
-
Reserved chapter 19 for future release, possibly for AGA-8 calculator
-
'Agreements and devices' is moved to chapter 20, and all previous chapters afterwards are
moved to chapter 21 onwards.
Revision
:
5
Finalised on
:
30 June 2014
Based on
:
GCAS Desktop version 1.1.0.1
-
Updated GCAS Desktop system requirements
-
Added chapter 1.4.4 (Instant trial)
-
Updated chapter 7.4.3 (Manual entry)
-
Inserted chapter 11 (Mole composition comparison)
-
Reserverd chapter 13 (Correlation calculator)
-
Updated chapter 15.1.5 (What if my GC device…)
-
Updated chapter 18.9 (Conflict resolution)
-
Minor updates for contents here and there
-
Updated screenshots
Page 16 of 388
GCAS® Desktop Manual Guide rev. 14
Revision
:
4
Finalised on
:
6 June 2014
Based on
:
GCAS Desktop version 1.0.4.114
-
Skipped revision 3 because revision 3 is only available in the HTML version of manual guide;
-
Included support for Daniel C9+ and C10+ GCs.
-
Updated chapter 4, 6, 7, 8, 10, 11, 12, 13, and 18
-
Updated screenshots.
Revision
:
2
Finalised on
:
29 April 2014
Based on
:
GCAS Desktop version 1.0.2.37
-
Added chapter 1.3 (Supported GC brands),
-
Added chapter 8 (Mole composition),
-
Included support for ABB GCs,
-
Updated chapter 10, 12, and 18,
-
Reserved chapter 9 (Lag time calculator),
-
Corrections on chapter 14.3 (Manage groups),
-
Expanded chapter 17 into 17.1 (Diagnostic mode) and 17.2 (Bug report wizard),
-
Updated screenshots,
-
Corrections on grammar and spelling errors.
Revision
:
1
Finalsed on
:
20 February 2014
Based on
:
GCAS Desktop version 1.0.0.1
-
First release.
Page 17 of 388
GCAS® Desktop Manual Guide rev. 14
1
Welcome
Thank you for choosing GCAS® Desktop as a companion for your gas chromatograph devices. These
help files provide guides about GCAS Desktop operation.
1.1
What GCAS is
GCAS® (Gas Chromatography Analysis Software) is a software tool specifically designed for GC (Gas
chromatograph) conditional-based monitoring. The main purposes of the monitoring method
embedded in the software are:
1.
To analyse instantaneous GC data to see if it is working properly,
2.
To provide and analyse historical data in order to identify changes and predict failures,
3.
To support extended reproducibility tests so that the GC uncertainty may be determined.
GCAS comes in two versions, GCAS Web and GCAS Desktop. GCAS Web is available for customers
using i-Vigilant central database. Both share the same database, so that you can log in to either
version and see the same data. GCAS Web is being phased out, therefore i-Vigilant Technologies
encourages all customers to move onto GCAS Desktop.
1.2
System Requirements
GCAS® Desktop requires:
1) Microsoft® Windows® Vista, Windows 7, Windows 8, Windows 8.1, or Windows 10. Also please
note that Windows XP is no longer supported. We had one case GCAS Desktop did not run
correctly on XP.
2) Microsoft .NET Framework 4.0. This is available from http://www.microsoft.com/enus/download/details.aspx?id=17718. Windows 8.1 and 10 have included .NET Framework 4 (even
4.5) therefore no need to install .NET Framework unless the setup package tells you.
3) Microsoft SQL Server Compact Edition (CE) version 4.0. This is available from
http://www.microsoft.com/en-us/download/details.aspx?id=17876.
4) Microsoft Visual C++ 2010 Runtime redistributable x86. This is available from
http://www.microsoft.com/en-us/download/details.aspx?id=5555.
5) Internet connection, preferred.
6) 1280 x 720 screen resolution.
7) If you need to work with Microsoft Access databases or to export data to Microsoft Access
database: You would need a separate licence of Microsoft Office or Microsoft Access 2010/2013,
or either the free Microsoft Access Database Engine 2010 or free Microsoft Access Runtime 2013.
Get Microsoft Access Database Engine 2010 from http://www.microsoft.com/enus/download/details.aspx?id=13255 or Microsoft Access Runtime 2013 from
http://www.microsoft.com/en-us/download/details.aspx?id=39358.
Page 18 of 388
GCAS® Desktop Manual Guide rev. 14
1.3
Supported GC Brands
GCAS Desktop is compatible with gas chromatograph devices which use thermoconductivity
detector (TCD) and use peak area formula to calculate response factor.
For the time being, GCAS Desktop supports gas chromatograph manufactured by Daniel Industries
and ABB. GCAS Desktop is able to import files generated by these brands. We plan to broaden this list
in the future.
If your GC device is neither Daniel nor ABB, consult our support team to find a workaround. For
instance, if your GC works in a similar manner as Daniel GCs only with slight differences, you can still
designate the device as Daniel GC in GCAS Desktop but the interpretation of the charts will be
different. As long as the device follows Modbus standard, automatic data capture should work without
problems.
1.4
GCAS Licence and Activation
GCAS Desktop requires a valid GCAS licence to run. GCAS licence carries the information required such
as what features are available to you, how many number of GC devices you can use, and the expiry
date.
Current version of GCAS operates a GCAS licence version 3. GCAS licence version 1 was used for
development purposes and is now obsolete. GCAS licence version 2 was used by beta (test) version of
GCAS Desktop. Although current GCAS Desktop can read GCAS licence version 2, some features will
be unavailable and we strongly recommend users of licence version 2 to upgrade their licences into
version 3.
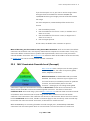
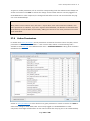
Customers can select which GCAS features to include in order to suit their need. The features are listed
here:
o
Modules
Basic features (always included) – Analysis parameter, Footprint, Calibration data,
and Comments.
o
Data Analysis
Live Data Analysis
Data Comparison
Calibration Gas Certificate
Uncertainty Calculation (automatically unlocks calibration gas certificate module)
Uncertainty Trend (automatically unlocks calibration gas certificate module too)
ISO 6976 Calculator
ISO 6976 Trend
ISO 10723
Lag Time Calculator
Device communication
Page 19 of 388
GCAS® Desktop Manual Guide rev. 14
o
o
o
Modbus® over Serial
Modbus® over TCP
Data import
Text Import (for Daniel or ABB GCs)
CSV Import
Manual Data Entry (always included)
Data export
Export to CSV
Export to Microsoft SQL Server Compact Edition
Export to Microsoft Office
Databases
i-Vigilant Central Database
Local Corporate Database
Local Offline Database (always included)
Work-offline Capability
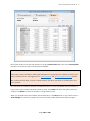
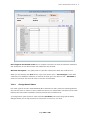
Our website offers three packages of GCAS Desktop: basic, advanced, and comprehensive. Features
included in each package are listed in this table.
Features
Modules
Basic features
Data Analysis
Live Data Analysis
Calibration Gas Certificate
Uncertainty Calculation
Uncertainty Trend
ISO 6976 Calculator
ISO 6976 Trend
ISO 10723
Lag Time Calculator
Communication
Modbus® over Serial
Modbus® over TCP
Data import
Text import
CSV import
Manual Data Entry
Data export
Export to CSV
Export to Microsoft SQL Server CE
Export to Microsoft Office
Databases
i-Vigilant Central Database
GCAS Basic
GCAS Advanced
Page 20 of 388
GCAS Comprehensive
GCAS® Desktop Manual Guide rev. 14
Local Corporate Database
Local Offline Database
Work-Offline Capability
Users buying GCAS basic package or GCAS advanced package have options to purchase add-on
features à la carte which are appended to their licences. Visit our website for pricing information of
each feature. Users buying GCAS comprehensive package have no more add-ons available as they
already get access to all GCAS features.
1.4.1
Types of Licence
There are two types of GCAS licence: Lifetime and Subscription.
Lifetime licences or perpetual licences are GCAS licences that never expire. Lifetime licences are
intended for customers who purchased retail copies of GCAS Desktop, i.e. one-off purchases.
On the contrary, subscription licences are licences that renew periodically. They are intended for
customers with subscription plan. Depending on customer preference, renewal period can be monthly,
quarterly, semester, annual, or biannual. Customer with subscription licence should check for licence
update periodically or leave the automatic licence update on, in order to ensure continuous access to
GCAS Desktop.
Trial licence is a subtype of subscription-based licence for new and prospective customers.
Depending on customer request, i-Vigilant Technologies Limited issues trial licences which typically
last between one to three months. Usually, trial licences carry all GCAS features with a limited
maximum number of GC devices. Within their trial period, customers can upgrade their licences to
standard subscription licence with select GCAS features and enough number of GCs to suit their
needs.
Instant trial licence is more specific type of trial licence. This licence is issued only once per computer
and only valid for 4-day trial. An instant trial licence is upgradable to a regular trial licence (see the
previous paragraph) which later on, still upgradable again to a full licence. Read more about instant
trial.
1.4.2
How Many PCs?
When you purchase GCAS Desktop from i-Vigilant’s website, the website asks for information such as
the package you want, any feature add-on packs, how many GCs and how many PCs. We generate
your licence based on this information thus your licence is ready when you go through online
activation process.
Currently our website offers 1, 3, or 5 computers. Contact us if you need more than 5 computers so we
can arrange a discount for you. This number of PC becomes the activation count. One successful
online activation will reduce this number by one. If you don’t have internet access and request offline
activation by sending your computer code, we will send your licence via email then we will also
Page 21 of 388
GCAS® Desktop Manual Guide rev. 14
decrease your activation count by one. When this activation count reaches zero, you have used up all
your available licences and cannot activate GCAS Desktop on other PCs.
1.4.3
Online Activation
If your computer has a working internet connection, we advise to activate your GCAS online. During
online activation, GCAS Desktop contacts GCAS Activation Server maintained by i-Vigilant
Technologies to retrieve your licence.
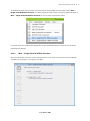
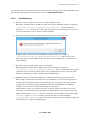
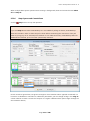
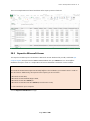
1.
The first time GCAS is run, it requests for activation. The following window pops up.
2.
Online activation requires internet connection.
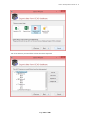
3.
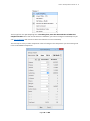
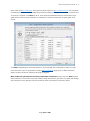
Click Activate online button and you shall see this window:
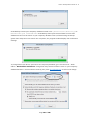
4.
Registration name is your customer identifier name as you have entered during checkout
process on our website. For offline purchase, we will send your registration name. This name is
case sensitive, requires exact spelling.
5.
Registration key is six numeric digit and doesn’t start with zero. This key is available on the
confirmation page and my account page (for online purchase) or in our confirmation email (for
offline purchase).
Page 22 of 388
GCAS® Desktop Manual Guide rev. 14
6.
If you purchased GCAS Desktop through an offline channel such as PO or direct meeting:
Tell us your computer code either by email, fax, or phone. Our email address is [email protected]. Wait for our confirmation that we have successfully generated your licence.
7.
If you purchased GCAS Desktop through our website:
You don’t have to tell your computer code because your licence is generated automatically at the
time of first activation. As long as you entered correct registration name and key (case sensitive)
and you haven’t exceeded your activation count, licence generation will work without problems.
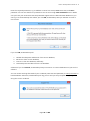
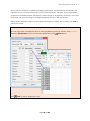
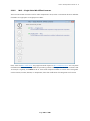
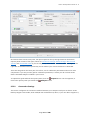
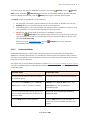
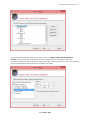
8.
Type your registration name and registration key, then click
Activate. Provided that all data
were correct, this window will show.
Otherwise you see an error message similar to this one.
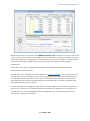
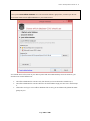
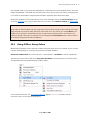
9.
Click Install licence. If UAC is enabled on your computer, and it is usually enabled by default, a
UAC prompt may appear. If you are the computer administrator, click Yes to continue. Otherwise
ask your computer administrator to type in the admin password.
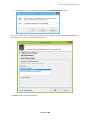
10. The following window confirms that your licence and registration key have been installed on your
computer.
11. Click Close and now GCAS Desktop is activated, ready to use.
12. In rare cases where UAC is disabled possibly by your system administrator, the licence would be
installed automatically without UAC prompt. This implies you wouldn’t see the screen as depicted
in step 8 and 10.
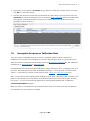
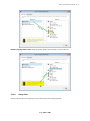
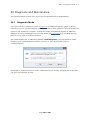
1.4.4
Offline Activation
For computers without internet connection e.g. on off-shore location or remote site, you can activate
GCAS Desktop offline. You need your licence string (or QR code image file) together with your
registration key stored offline such as in your corporate email or in a USB flash drive.
Page 23 of 388
GCAS® Desktop Manual Guide rev. 14
1.
The first time GCAS Desktop is run, it requests for activation. The following window pops up.
2.
Offline activation does not require internet connection.
3.
Click Activate offline. UAC prompt may appear.
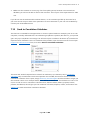
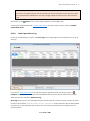
4.
GCAS Activator window is displayed.
5.
Tell us your computer code via email to [email protected] or via fax. We need this code to
generate your licence. After we generate your licence string, we will reduce your activation count
by one (1) accordingly.
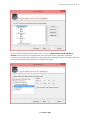
6.
Once you have received our reply, either enter the licence string or load the QR code image. Then
enter the registration key as well.
7.
Licence string is a long encoded text which looks similar to this.
zZPgHRyhHRqMsZijmaukdJaWlaqhpZulp4SuroCR76Oum6KXoqiZmJ3mkaC1eZq2qpidn6eOp4WY
l4GYrYukuHmnl6KutqqupKqKqZyU3e/brLWklouss5qgspajqoGTkRSEqea6ie6GqqqRnL92obiIqamk
vaKsoLSsjaCegaKnrKigpaV7uA==
Page 24 of 388
GCAS® Desktop Manual Guide rev. 14
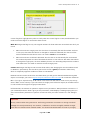
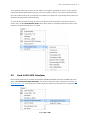
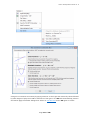
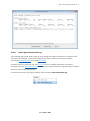
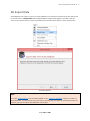
8.
QR code image file looks like the following.
This is a standard QR code image that contains the licence string itself. You can use your
smartphone or any QR code scanner to verify its content.
9.
Click Install on GCAS Activator form.
10. The following message box confirms that your licence and registration key have been successfully
installed. On some Windows versions, this message is displayed in a command prompt window
instead of a message box.
11. Click OK and GCAS Desktop is activated, ready to use.
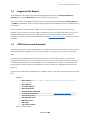
1.4.5
Instant Trial
Instant trial is offered to new and prospective customers to try GCAS Desktop quickly without the
hassle of sending your computer code and waiting for your licence in our reply and for us to set up a
database for you. Unlike "regular" trial licences, instant trial licence is only valid for 4 (four) days,
including the day you started the instant trial. After your trial period expires, GCAS Desktop will stop
Page 25 of 388
GCAS® Desktop Manual Guide rev. 14
working. You can then request for an extended trial or purchase a full licence altogether. Contact us to
get an arrangement.
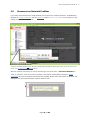
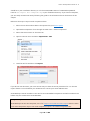
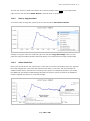
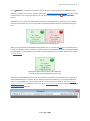
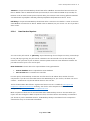
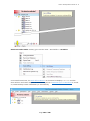
To try GCAS Desktop using instant trial, click Instant 4-day trial on this window.
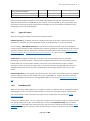
Read the information presented in the oncoming window. If you agree, click Agree and start instant
trial.
Instant trial information window.
A UAC prompt may appear. If you are the computer administrator, click Yes to continue. Otherwise,
ask an administrator to enter the required password.
Page 26 of 388
GCAS® Desktop Manual Guide rev. 14
If you cannot find the button, instant trial may not be available for you because probably you already
used it before. Instant trial is only offered once per computer. For example, if a user tries to uninstall
GCAS Desktop after his trial period is over and then reinstalls the software again, he will not see the
Instant 4-day trial button a second time.
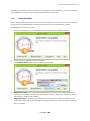
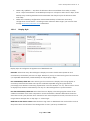
1.4.6
Automatic Licence Update
Licence update is an update for your licence. For example, a customer has subscription plan and they
just extended their subscription for another month, the expiry date on their licence is then updated to
the latest subscription end date. Another example, a customer decided to add more features to their
licence. Their licence is updated to reflect this change.
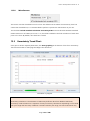
By default, GCAS checks for licence update in GCAS Activation Server once during launch, and once
every 24 hours. Automatic licence update works only if your computer has a working internet
connection.
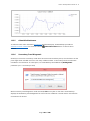
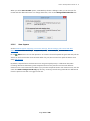
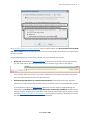
1.
If there is any update for the licence in GCAS Activation Server, a window similar to this one shall
appear. The text on this notification window may vary depending on what kind of update is
available for you (e.g. extension of expiry date, feature update, or limit upgrade on number of GC).
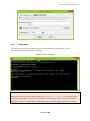
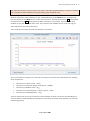
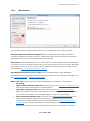
2.
Click Install. It may trigger a UAC prompt. Click Yes on the UAC prompt or ask your computer
administrator to type the required password. GCAS Desktop will update the licence and the
Page 27 of 388
GCAS® Desktop Manual Guide rev. 14
window similar to this one shall appear.
3.
In rare cases where UAC is disabled by your system administrator, or if GCAS Desktop is running
in elevated mode (run as administrator), the notification window will appear green instead of
yellow. The licence is updated automatically and you don’t have to click the Install button.
To configure how GCAS should check licence update automatically, go to the Help menu > Licence >
Configure Auto-update.
Page 28 of 388
GCAS® Desktop Manual Guide rev. 14
1.4.7
1.4.7.1
Manual Licence Update
If you are online
You can force GCAS Desktop to check for licence update now. To do so, go to the Help menu >
Licence > Check for update.
1.4.7.2
If you are offline
Should the computer had difficulties connecting to the internet e.g. on remote areas or off-shore sites,
we will send you a new licence string and/or QR code. To install this new licence, go to the Help menu
> Licence > Manual Update.
UAC prompt may appear. Afterwards, either enter the new licence string or open the new QR code,
but re-enter the same registration key as the previous one. (The software automatically does this for
you.) Click Install and GCAS Activator will replace the installed licence string with the new one.
Page 29 of 388
GCAS® Desktop Manual Guide rev. 14
1.4.8
Deactivation
To uninstall your licence and registration key, start an elevated command prompt (run as
administrator) and then execute this command:
GCASActivate /revoke
Note
Deactivation does not automatically increase your activation count. Contact us once the deactivation
process is completed so we can raise your activation count by one (1), thus you can activate GCAS
Desktop on another PC. Please attach a screenshot of your command prompt window in your email.
Page 30 of 388
GCAS® Desktop Manual Guide rev. 14
Instant trial users, do not deactivate your instant trial licence because instant trial licence is only
offered once per computer—unless you have a full licence or extended trial licence available, or if you
decided to uninstall GCAS Desktop.
1.5
Integrity Check
GCAS Desktop performs a check on the installation directory during start up in order to ensure that all
required files are present and unmodified. When GCAS Desktop detects a file is missing or has an
unauthorised changes, it presents a warning similar to this.
This notification does not prevent you from using GCAS; you could still dismiss the notification
through OK button and log in to GCAS as usual. However, there is a higher risk of GCAS crashing at
some point later. Especially when there is a .dll file missing, this will raise Dll Not Found
Exception or File Not Found Exception error message later on.
If you see this warning every time you start GCAS Desktop, the first step to try is to reinstall GCAS
Desktop. Have your registration key and your licence string or QR code ready in case you need to
reactivate GCAS Desktop again.
Should the reinstall action provides no remedy to the problem, you can disable this feature by running
GCAS Desktop with an additional /disablefilecheck parameter. You might want to modify the
shortcut to GCAS Desktop to include this additional switch.
Page 31 of 388
GCAS® Desktop Manual Guide rev. 14
Page 32 of 388
GCAS® Desktop Manual Guide rev. 14
2
Database
GCAS Web and GCAS Desktop reads and stores data into GCAS database. This chapter explains further
about GCAS database.
2.1
Where Your Data is Stored
There are three different choices of data storage:
1. i-Vigilant central database
Data is stored in database server(s) maintained by i-Vigilant Technologies. Customers using this
database server can access it using both GCAS Web and GCAS Desktop. Using this server requires
internet connection.
2. Corporate database server
Also known as "local corporate database", your data is stored in a database server within your
company local area network (LAN). Customer can access data on this database server using GCAS
Desktop only.
3. Local offline database
Data is stored in a file on your computer. This database is permanently offline, isolated from
outside world. Customer can access data on this database server using GCAS Desktop only.
Each choice is a distinct GCAS feature in your GCAS licence. Customer with GCAS licence that only
includes i-Vigilant Central Database and Local Corporate Database cannot use local offline database.
2.2
Supported DBMS
GCAS database is a relational database managed by a Database Management Server (DBMS). GCAS
does not develop its own DBMS, but instead uses one of the following commercial DBMSes.
1.
Local corporate database
a.
MySQL version 5 or later,
b. Microsoft SQL Server 2008 (untested), 2012, or 2014.
2.
Local offline database
a.
Microsoft SQL Server Compact Edition v4.0,
b. Microsoft Access 2010/2013.
*Especially for Microsoft SQL Server 2014, you need to install updates for Microsoft .NET Framework 4
from Windows Update. Also Microsoft SQL Server 2016 is in technical preview version at the time this
document is written, hence we do not recommend storing your precious data on a beta DBMS.
Should you have interest in setting up a local corporate GCAS database within your company network
or using a local offline database for your company, contact our support team to arrange a deployment
for you.
Page 33 of 388
GCAS® Desktop Manual Guide rev. 14
2.3
Change Database
Most users do not have to worry about changing database. But if your data is stored in two or more
databases, tell GCAS Desktop which database it should connect to.
To switch database, make sure that no forms open on your work area and you are not working offline.
Next, go to File menu > Change Database.
This menu will bring up the Change Database dialogue. Choose which database you would like to use
whether i-Vigilant central database, your own corporate database, or an offline database file.
Page 34 of 388
GCAS® Desktop Manual Guide rev. 14
Enter the required parameters, e.g. IP address or server host name, DBMS username, and DBMS
password. You can test whether the parameters are correct through Test connection button. Make
sure you have your GCAS username and password registered in the desired GCAS database so you
can log in to GCAS Desktop later. When you click OK, GCAS Desktop asks you whether to switch it
now or later.
If you click OK, GCAS Desktop will:
1.
Unload all workspaces and devices from current database,
2.
Disconnect from current database,
3.
Connect to the new database, and finally
4.
Load workspaces and devices from new database.
Otherwise if you click Cancel, GCAS Desktop keeps connection to current database until you exit the
software.
You can resume working afterwards if your credential (username and password) is exactly the same in
both databases. Otherwise, GCAS Desktop will log you out and you are prompted to log in again
using the correct credential.
Page 35 of 388
GCAS® Desktop Manual Guide rev. 14
2.4
Change Database before Login
Starting from GCAS Desktop 1.7.3.0, login window displays a link to change database. Find the link
near the top left corner below the database name.
This link brings you to the same Change Database dialogue. Enter the required parameters e.g. IP
address or server host name, DBMS username, and DBMS password. Click OK and GCAS Desktop will
restart. After restart, you see the new database displayed on the top of login form.
Page 36 of 388
GCAS® Desktop Manual Guide rev. 14
2.5
1.
Change Database without Running GCAS
On Windows Vista or 7, open the Start menu then go to All Programs. Within i-Vigilant
Technologies, click on the shortcut Change Database.
2.
On Windows 8 or 8.1, open the Start screen. Change the view to All Apps view. Scroll to the
right, find i-Vigilant Technologies and the same shortcut should be there.
3.
On Windows 10, open the Start menu (or Start screen if you are on tablet mode). Next, go to
All Apps. Jump to the letter I then find i-Vigilant Technologies. Inside the folder you will find
the Change Database shortcut.
Page 37 of 388
GCAS® Desktop Manual Guide rev. 14
4.
Alternatively, run GCAS Desktop with additional /changedatabase parameter.
Any of the actions above would bypass the login screen straight to the Change Database dialogue. On
this dialogue box, select the desired database server.
Click OK and start GCAS Desktop again.
Page 38 of 388
GCAS® Desktop Manual Guide rev. 14
2.6
Reconnect on Network Problem
If you were disconnected from GCAS database server because of network problem*, GCAS Desktop
displays an overlay notification and the status bar reads Network Problem. Click anywhere on the
overlay to dismiss the notification.
(*because of network problem and you do not have work-offline capability included in your licence, or you do have one but
you've never set up a temporary database before)
Wait for network connectivity to recover and then go to the File menu > Reconnect Database in
order to reconnect. If the reconnection attempt is successful, GCAS Desktop displays a tooltip
notification while all workspaces and devices are reloaded. Please close and reopen all windows and
dialogues that were opened before network disconnection.
Page 39 of 388
GCAS® Desktop Manual Guide rev. 14
2.7
Temporary Database
Temporary database is a subset of whole GCAS database. This kind of database is used by work-offline
feature, on which GCAS operates if it is in offline mode. Temporary databases use Microsoft SQL
Server Compact Edition as the DBMS.
Unlike the complete database that stores all data for all GCAS users, temporary database stores only
data relevant to you. This means temporary database contains data for groups you have been
assigned to, devices in these groups, and data for these devices only. Each user would have their own
temporary databases. You would find these databases in [installation directory]\DBWorkOffline\.
By default, GCAS Desktop synchronises data from the database server to temporary database for one
latest month. That is, today minus one month. You can change this range from one month up to two
years. To set up your temporary database and change how much data to synchronise, go to chapter
29 Working offline and 29.1 Set up temporary database.
2.8
Flush and Backup
Flush and backup is applicable for users with local offline databases—that is, Microsoft SQL Server
Compact Edition or Microsoft Access. Users of local corporate databases or i-Vigilant central database
may skip chapter 2.8 and 2.9.
Flushing a file means writing any pending changes to the file that existed in computer memory, into a
permanent storage device—in this case, your hard disk drive. If for some unfortunate reason GCAS
crashed, or a power cut happened, your database in computer memory/cache is lost. If GCAS doesn't
flush the file at all, you will lose all data since the time GCAS was started. With a periodic flush, you
lose only data since the last flush, not all the way back to GCAS start time. Nonetheless, GCAS cannot
protect your hard disk from physical damages, especially during a power cut event.
To flush your database manually, go to the File menu on main user interface. Select Flush and
Backup, then Flush Now.
Page 40 of 388
GCAS® Desktop Manual Guide rev. 14
GCAS can also backup your database file after a flush. This feature is not yet turned on as you need to
set up the backup destination directory beforehand.
By default, GCAS flushes your database file once every hour. You can configure the automatic flush
settings at chapter 2.9 Automatic Flush and Backup.
2.9
Automatic Flush and Backup
On main user interface, go to the File menu, select Flush and Backup, and finally Automatic Flush
and Backup Preferences. This menu shows the Automatic Database Flush and Backup dialogue.
Page 41 of 388
GCAS® Desktop Manual Guide rev. 14
To turn off automatic flush, uncheck Flush the database into hard disk drive periodically. All other
options will be turned off.
Set the desired flush interval at Flush every field. You can choose between 0.5 hours (every 30
minutes) and 168 hours (one week). The default is one hour.
To turn on automatic backup, check Backup database file after flushing and set the desired backup
directory. The backup directory can be on an internal hard disk of the same PC, an external hard disk,
a USB thumb drive, or at a network location. Be sure that external drives are plugged or network path
is accessible when GCAS finished flushing. For network locations, GCAS Desktop supports UNC
notation such as \\server\shared directory\ or mapped network drives. Currently there is no support
for FTP, SSH/SFTP, or WebDAV access.
Create monthly subfolders: If this is ticked, GCAS creates additional folders having the format of
year\month. The database backup files goes to the directory\year\month.
Append "backup" at the end of destination file name: Tick this to add "backup" to the file name.
For example if your local offline database is Contoso.sdf, the backup file will be Contoso backup.sdf
(or Contoso backup 1.sdf, Contoso backup 2014-12-11.sdf, depending on what selected at the file
name options). Tick this option if you back up your database to the same directory as the local offline
database file itself.
Notify me if backup failed: This option causes GCAS Desktop to display a tooltip notification if
backup operation failed. Cause of failure can be an unplugged external drive, insufficient free space on
the hard disk, your external drive has a write-protect switch, invalid or inaccessible network locations,
a firewall that prevented GCAS from reaching the network location, or the target network server is
down.
Use overlay notification: If this option is checked, GCAS Desktop prompts an overlay notification
instead of a tooltip notification. Overlay notification is that black transparent overlay which covers
entire working area — therefore it will interrupt your work, signifying backup is a high-priority task.
Tooltip notification disappears after few seconds, but overlay notification remains until you click it to
dismiss. Additionally, upon dismissing the overlay notification, GCAS Desktop will open Windows
Explorer or File Explorer and point it to the location of your local offline database, so you can do the
backup manually.
There are four options that determine how the backup file shall be named.
1.
Keep original file name: The backup file has the same name as the original database file
(with additional word "backup" if you opt to append "backup" at the end of filename). GCAS
overwrites the previous backup file because it has the same name.
2.
Append number: GCAS Desktop appends a sequential number at the end of file name. This
option prevents overwriting.
3.
Append date: GCAS Desktop appends today's date to the backup file with the format of
yyyy-mm-dd. This overwrites previous backup files on the same day, hence only one backup
file can exist per day.
Page 42 of 388
GCAS® Desktop Manual Guide rev. 14
4.
Append timestamp: GCAS Desktop appends today's date and current hour and minute with
the format of yyyy-mm-dd-hh-nn. This option prevents overwriting.
Page 43 of 388
GCAS® Desktop Manual Guide rev. 14
3
Users, Groups, and Workspaces
GCAS users are users who are authorised to access data in GCAS database. GCAS requires users to
enter their valid credential before presenting the main interface. Each user has their own user type and
role, which control what kinds of data in the database are accessible to the user and what permissions
the user has over the data.
When a GCAS user is assigned into a group, this implies the user is authorised to access, read, and
write data to a portion of GCAS database which is allocated for this particular group. A user may be
assigned to multiple groups.
3.1
User Types and Roles (Concept)
User types and user roles constitute the access control list (ACL). If you use i-Vigilant central database,
this ACL is shared between GCAS Web and GCAS Desktop.
User types control which menus are available to the user. Default installation of GCAS would set up
three user types: Administrator, super user, and general user. Administrator has access to all areas of
GCAS modules and menus, while general user has access to essential features only.
You can create custom user types and assign custom menu permissions to each of them if you are the
GCAS administrator. To do so, read chapter 27.2 Define new user types and roles and 27.5 Menu
permissions.
User roles control which actions are available to the user. An action is a specific command available in
some modules such as Footprint, Calibration Data, Mole Composition, and Devices. Those commands
are accessible through the Action menu on the menu bar. Default installation of GCAS Desktop would
set up six user roles:
System administrator
Engineer 1
Engineer 2
Partner
Read-only
Custom
Similar to user types, system administrator has access to all actions in both GCAS Web and GCAS
Desktop. On the other side, read-only role has the least access.
You can also define your own user roles and aszsign action permissions to them if you are the GCAS
administrator. Go to chapter 27.2 Define new user types and roles and 27.6 Action permissions to read
more.
Page 44 of 388
GCAS® Desktop Manual Guide rev. 14
3.2
Groups and Workspaces (Concept)
Group is the highest hierarchy of all GCs. Each GC device has to be a part of a group. A GCAS
database should have at least one group. For example, a company called ACME Ltd. has three
different platforms. These three platforms are all part of "Platforms" group.
Workspace is a way to separate GC devices which belong to the same group. Each group may have
several workspaces. For instance group Platforms has three different platforms, so each platform has
its own separate workspace: Platform A, Platform B, and Platform C.
You should see workspaces of the groups assigned to you on the device panel in the main user
interface once you have logged in. Underneath these workspaces are GC devices. If you don't see
anything on this panel, your GCAS administrator could have not assigned your user account to any
groups yet.
One group may have several workspaces, and one workspace contains many GC devices. One GC
device cannot be assigned to multiple workspaces. Chapter 24 Device Management explains more
about creating, moving, and deleting devices (requires user type "super user"). Chapter 27.3 Manage
Groups explains about managing groups and workspaces within groups (requires user type
"administrator").
Page 45 of 388
GCAS® Desktop Manual Guide rev. 14
3.3
Edit Your Profile and Change Your Password
Each user has their associated user profile and credential. User profile is a set of personal information
such as real name, email address, postal address, and phone number. Credential is the username and
password required to log in to GCAS database.
3.3.1
Edit Your Profile
To edit your user profile, follow the steps below.
1.
Go to the Profile menu > Edit profile. If you do no see this menu, your user type may not have
the menu permission for it. Contact your GCAS administrator.
2.
This menu brings forth the Edit Profile dialogue.
3.
Enter the information then click Save.
Regarding time zone
If you use i-Vigilant central database, all user comments (e.g. in the Footprint or Calibration Data) have
their timestamps converted to server time zone. GCAS Desktop uses this time zone information in
your user profile to display timestamps of user comments in the correct time, including times when
you are travelling. If you enter a time zone other than the actual time zone you are living in, GCAS
Desktop may display user comments with wrong time.
If you use local corporate database or local offline database, GCAS Desktop assumes the server time
zone is the same as your time zone. No time zone conversion is performed.
Page 46 of 388
GCAS® Desktop Manual Guide rev. 14
Empty time zone information is replaced by the default Europe/London (UTC+0 standard time,
UTC+1 daylight saving time).
3.3.2
Change Your Password
Once your GCAS administrator finished creating your user account, it has usually a default password
of "password" (all lowercase). Otherwise, your administrator should have told you about your initial
password. To change your password, follow these steps.
1.
Go to the Profile menu > Change Password. If you don’t see this menu on the menu bar, your
user type may not have the menu permission for it (i.e. your GCAS administrator prohibits you
from changing password).
2.
The Change Password dialogue will appear.
3.
Type your current password once and your desired password twice. Then click Save to commit the
change.
4.
Use the new password for the next time you log in to GCAS Desktop.
3.4
Forgot Your Password?
If you forgot your password and you use i-Vigilant central database, send a request for password reset
quoting your GCAS username to [email protected] then we will reset your password.
If you use local corporate database or local offline database, contact your GCAS administrator to reset
your password. To GCAS administrators, follow chapter 27.1 Manage Users to reset a user’s password.
Page 47 of 388
GCAS® Desktop Manual Guide rev. 14
3.5
Logging Out
Go to the Profile menu > Log Out or press Ctrl+L shortcut key to log out. The next user can now
log in.
Be informed that if GCAS Desktop is in offline mode, only users who have set up their temporary
databases can log in to GCAS.
3.6
Automatic Logout on Inactivity
To protect your data, GCAS Desktop can trigger automatic logout if it has been idle for certain period
of time. The login form will look like this if you leave GCAS Desktop without any activity for some
amount of time.
By default, GCAS Desktop does not log you out automatically. To turn on this feature and to configure
the idle timeout threshold, go to the Profile menu > Idle timeout.
GCAS pauses the idle timer if you have data capture operation running in background, or if database
synchronisation between database server and temporary database is in progress.
Page 48 of 388
GCAS® Desktop Manual Guide rev. 14
4
The User Interface
This chapter is a quick guide about GCAS Desktop user interface.
4.1
Login Form
When you launch GCAS Desktop, you see a splash screen for few seconds then you are presented with
login form. Enter your GCAS username and password then click Log in.
At the top, the login form displays which database you are connected to. In case you frequently switch
between databases, this information helps you to enter correct GCAS credential of current database.
You can change database straight from here, simply click Change database link under the database
name.
Icon on top-left corner indicates database connectivity status.
Icon
Meaning
Database connection is closed. This may indicate network problem or I/O error. If
you don’t have GCAS feature Work-offline Capability in your GCAS licence, this icon
is displayed during network problem.
(spinning)
Database connection is in progress. You can enter credential but GCAS Desktop
must wait until connection is opened successfully before validating your credential.
Database connection is open.
No database connection currently present. GCAS is in offline mode (see chapter
29.10) thus no connection is initiated until you log in.
If you see the offline warning icon next to the Quit button similar to the screenshot below, this
indicates the login form is in offline mode. Read more on chapter 29.10 Login Form in Offline Mode.
You need the GCAS feature Work-offline Capability to be included in your GCAS licence to use offline
mode.
Page 49 of 388
GCAS® Desktop Manual Guide rev. 14
The check box Remember me on this database is intended to speed up login process in case you
have only one user in the GCAS database (thus you always use the same credential) and it is a private
computer, meaning no one else uses that computer. Ticking this box causes GCAS Desktop to
automatically fill in your username and password the next time GCAS is launched, therefore you can
simply hit Enter key to log in. Never tick this box on a shared or public computer.
4.2
Main User Interface
Once you have entered your valid credential, you would see the main user interface.
4.2.1
Device Panel
The device panel lists all workspaces assigned to you and all GC devices under these workspaces. Click
on a GC device to select it. Features such as Footprint, Calibration data, Mole Composition, or
Uncertainty Calculator works with one device only, therefore make sure you select the correct device.
The selected device name is displayed on the top of device panel. Learn more about workspaces.
Page 50 of 388
GCAS® Desktop Manual Guide rev. 14
Icon
Meaning
Daniel GC, either C6+ complete or C6+ without neopentane.
Daniel GC, either C7+ complete or C7+ without neopentane.
Daniel GC, either C9+ complete or C9+ without neopentane.
Daniel GC, either C10+ complete or C10+ without neopentane.
ABB GC, either C6+ complete or C6+ without neopentane.
ABB GC, either C7+ complete or C7+ without neopentane.
Unsupported GC.
4.2.2
Recent Device Panel
Below the device panel is known as recent device panel. This section lists your recently used devices.
Clicking a device on this list also selects it, which is the same effect as selecting the same device from
the device panel above. Recent device list is persistent, that is, this list is preserved after you exit GCAS
Desktop and run it again the next time.
4.2.3
Search Tool and Toolbar
There is a small toolbar under recent device panel. It has a search tool to help you find a device if you
have a lot of GC devices on your device panel. Type the device name and click
Search. When you
are in search mode, the recent device panel temporarily turns into search results panel. After you find
the device in the search result list, click the device to select it or click
Finish searching to close the
search tool.
The toolbar also contains three more buttons.
Button
What it does
Hide recent devices
Hides the recent device panel. Your main device panel fills the entire
sidebar.
Show recent devices
If the recent device panel is hidden, this button brings it back visible.
Clear recent devices
Clears your recent device list.
Refresh devices
Reloads all workspaces and GC devices on your device panel.
4.2.4
Status Bar
Status bar at the bottom of the form hosts two elements: work-offline indicator and status indicator.
Work-offline indicator appears if you have Work-offline Capability included in your GCAS licence.
The indicator displays one of these symbols.
Page 51 of 388
GCAS® Desktop Manual Guide rev. 14
Icon
(depending on network
Text
Meaning
medium)
Online
Offline
Disconnected
GCAS is working online and is connected to database
server.
GCAS is working offline and is connected to temporary
database.
GCAS is not connected to any database servers. Go to
File menu > Reconnect Database to reconnect.
Status indicator displays general status of GCAS Desktop and status bar notifications, which are
usually related to database, licence update, and later on–software updates. Specific status associated
with specific module will not be displayed on the status bar, but on their own form instead. For
example, Footprint form, Calibration Data form, Mole Composition form, and Data Analysis form have
their own
4.3
busy indicator on each user interface. Most of the time, status indicator reads "Ready".
Choose Devices Dialogue
Choose Devices dialogue appears if you open a GCAS database having number of GC devices exceeds
the limit permitted by your GCAS licence. This dialogue lets you choose which GC devices to be
accessible during current session of GCAS Desktop.
Page 52 of 388
GCAS® Desktop Manual Guide rev. 14
As an example, meet Frank. He is a talented GC specialist service engineer. He bought a GCAS licence
of 5 GC devices. One day a customer called, requesting his help to analyse problems on their GCs. The
customer exported part of their GCAS database to a Microsoft SQL server compact database and
handed the .sdf file to Frank. Unfortunately this database has 8 devices. When Frank changes database
to this .sdf file, GCAS presents Choose Devices dialogue when the main window is being loaded. As his
licence only permits five GC devices maximum, Frank must choose which five out of these eight to be
visible during this session. To see the other three, Frank needs to restart GCAS to end current session
and start a new session, thus displaying the Choose Devices dialogue again. This time, he chooses the
remaining three (and optionally two out of the other five).
4.3.1
Persistent Device Selection
Device selection made through Choose Devices dialogue is not persistent. Next time GCAS Desktop is
launched, it presents Choose Devices dialogue again, allowing you to select the other devices that
were not visible during previous session.
To make your device selection persistent, tick Remember my selections on this computer. This
causes GCAS to remember your selection for the next time GCAS is launched and thereafter. The
selection is valid for current GCAS database only. If you change into different GCAS database, Choose
Devices dialogue may re-appear. Again, you have the option to remember your selections for that
database as well.
At some point you may change your mind. Go to the Subscription menu > Choose Devices to display
this dialogue again. Here you can change your selected devices to make visible, or simply untick
Remember my selections on this computer to cancel the persistence. Unticking the check box
causes GCAS Desktop to re-display Choose Devices dialogue the next time GCAS is launched. Please
note this menu is not visible directly after making selection through Choose Devices dialogue. It will be
there the next time GCAS Desktop is launched, so you need to spend one session with your current
device selections first.
Page 53 of 388
GCAS® Desktop Manual Guide rev. 14
4.4
Notifications
GCAS Desktop has four kinds of notifications.
1.
Status bar notification
Status bar notification is displayed on—what else?—the status bar. This kind of notification
usually contains less important messages. You probably see the message “xyz form is busy”
most often when you attempt to close a form which was busy calculating. Status bar
notifications dismiss themselves after few seconds.
2.
Tooltip notification
Tooltip notifications contain only informational messages but GCAS needs to catch your
attention. It appears at the top-left corner of work area. Tooltip notifications dismiss
themselves after few seconds.
3.
Panel notification
GCAS Desktop uses panel notification to ask your decision. The notification is displayed at the
bottom of work area. Panel notifications have up to three buttons. Click one of them to
perform the appropriate action and dismiss the notification.
4.
Overlay notification
Possibly the most annoying one, overlay notification is the black transparent window which
covers the entire work area. Overlay notifications interrupt your work therefore GCAS Desktop
reserves them for urgent messages only. Click anywhere on the overlay to dismiss the
Page 54 of 388
GCAS® Desktop Manual Guide rev. 14
notification.
In case you missed a notification, check the Notification Log from the File menu. Notification Log
window displays the last 10,000 notifications. Click Replay notification to replay it. Replayed panel
notifications still show decision buttons, but this time these buttons serve no function other than to
dismiss the notification.
4.5
Standard Colour Palette
This chapter is hidden on the HTML version of GCAS Desktop manual. It only serves as a link
destination target from chapters explaining alternative colour scheme for colourblind users.
This table lists the standard colour pallete which GCAS uses for all charts across different modules.
Page 55 of 388
GCAS® Desktop Manual Guide rev. 14
Component
Colour
Red
Green
Blue
(0-255)
(0-255)
(0-255)
Methane
8
13
145
Ethane
3
225
72
Propane
226
127
20
i-Butane
226
214
45
n-Butane
168
149
30
12
172
48
i-Pentane
205
226
118
n-Pentane
35
114
21
Hexane
97
109
95
Heptane
53
127
220
Octane
132
60
192
Nonane
76
34
110
Decane
4
2
0
234
58
58
21
210
198
Unnormalised total or R pass limit
255
0
0
Mean
233
94
211
Mean + 2 standard deviations
241
136
136
Mean – 2 standard deviations
116
170
236
Neopentane
Nitrogen
Carbon dioxide
2
When colourblind-assist is turned on, GCAS Desktop switches to this alternative colour palette and
turns on several visual assistances. This is to aid users with protanopia and deuteranopia.
Component
Colour
R
G
B
Line chart
Pie chart
Point
chart
Methane
8
13
145
Solid line
Solid
Ethane
214
185
90
Solid line
Solid
Propane
180
134
20
Dashed line
Horizontal black dash
i-Butane
255
255
0
Solid line +
black shadow
Solid
n-Butane
188
145
29
Solid line
Solid
Neopentane
151
125
46
Solid line
10% white-dotted
Dashed line +
black shadow
10% black-dotted
Dash-dot +
black shadow
Solid
Solid line
Solid
i-Pentane
247
217
117
n-Pentane
119
92
20
Hexane
109
106
94
Heptane
94
115
219
Octane
53
74
193
Nonane
30
42
110
Decane
4
2
0
84
78
59
156
163
195
60
46
0
Nitrogen
Carbon dioxide
Unnorm. total/R2 pass
Dash-dot
Vertical white dash
Solid line
Solid
Solid line
Diagonal white stripes
Dash-dot
Solid
Dashed line Diagonal white criss-cross
Solid line
Solid
Dash-dot-dot 25% white-dotted
Page 56 of 388
GCAS® Desktop Manual Guide rev. 14
Mean
155
151
136
Solid line
Mean + 2 std dev
97
116
212
Solid line
Mean – 2 std dev
146
162
235
Solid line
Page 57 of 388
Not applicable
GCAS® Desktop Manual Guide rev. 14
5
Analysis Parameter
Analysis parameters are collection of information that could assist users when analysing the GC
performance. When something goes wrong, it is a good idea to compare the parameters stored in this
form and the actual condition observed on the GC device.
To view or edit analysis parameter for a particular device, select that device on the device panel on the
main user interface and then go to the View menu > Analysis Parameter.
The first two fields, cycle time and R2 limit, accept only numeric value. The rest can accept
alphanumeric characters. If no R2 limit entered, GCAS assumes the default R2 threshold to be 0.995.
Click Save to commit the change, Cancel to discard the change, or Reset to reload previous values.
If all input fields are greyed out, your user account might not have sufficient action permission to edit
Analysis Parameter. Contact your GCAS administrator.
Page 58 of 388
GCAS® Desktop Manual Guide rev. 14
6
C-number Glossary
On GCAS Desktop and GCAS Web user interface, users might see C1, C2, C3, and so on. These are
carbon atom count of supported alkane gases.
Current version of GCAS Desktop supports C1 (methane) to C10 (decane). GCAS Web only supports
C1 to C7 (heptane)
Notation
Alternative
Gas name
Formula
notation
C1
C1
Methane
CH4
C2
C2
Ethane
C2H6
C3
C3
Propane
C3H8
C4
NC4
n-Butane
C4H10
IC4
i-Butane
C4H10
NC5
n-Pentane
C5H12
IC5
i-Pentane
C5H12
NEOC5
Neopentane
C5H12
C6
C6
Hexane
C6H14
C7
C7
Heptane
C7H16
C8
C8
Octane
C8H18
C9
C9
Nonane
C9H20
C10
C10
Decane
C10H22
C5
In case of butane and pentane, C4 (without prefix N or I) refers to n-Butane while C5 means nPentane.
Page 59 of 388
GCAS® Desktop Manual Guide rev. 14
7
Footprint and Calibration Data
A calibration data is one record or snapshot of gas properties of the analyte read by the GC device.
GCAS records two main properties, which are the response factor (RF) and retention time (RT).
GCAS assumes the response factor is calculated using peak area formula.
𝑅𝐹 =
𝑝𝑒𝑎𝑘 𝑎𝑟𝑒𝑎
𝑚𝑜𝑙𝑒 𝑐𝑜𝑚𝑝𝑜𝑠𝑖𝑡𝑖𝑜𝑛
If your GC device uses peak height formula, that is, peak height divided by mole composition,
unfortunately your GC device is not compatible with GCAS. Or to the least, the RF chart on both
Footprint form and Calibration Data form may not help you in the analysis of GC health status.
Some GC devices use the inverse formula, which is mole composition divided by peak area. These
devices are still compatible with GCAS Desktop however, with a few differences:
1.
RF chart will descend downwards instead of the usual ascending shape,
2.
RF values will be somewhere within the order of 10 -6 to 10-8, instead of 106 to 108.
3.
Correlation charts will show a downward slope or negative gradient, unlike the usual upward
slope. However R2 calculation stays the same.
Footprint is a special type of calibration data which is usually:
1.
Is the first data of a GC device, or
2.
A known good data as a reference of comparison for future calibration data.
Page 60 of 388
GCAS® Desktop Manual Guide rev. 14
7.1
The Footprint Form
Principal purpose of Footprint form is to show footprint records. It has three sections of charts, which
are:
1.
Response factor chart,
2.
RF-MW log charts,
3.
Retention time chart.
To open Footprint form, select the device from the device panel then go to View menu > Footprint.
Response factor chart graphs the response factor from gas with lowest to highest molecular weight. It
should have a nice ascending slope, otherwise it may indicate problems within your GC device. In case
you wonder what the dropdown Single-point RF is doing at the top-left corner, that is for ISO 10723
conversion and you also need GCAS feature ISO 10723 in your licence. Jump to chatper 7.11 for more.
RF-MW log charts plot the base-10 logarithm of response factor (RF) against molecular weight (MW)
of certain sequence of gases. They also calculate the regression line, and computes the square of
Pearson correlation coefficient (R) value. If R2 value is less than threshold set in the Analysis Parameter
(default is 0.995), the number turns red and this may indicate problems within GC device.
Depending on your GC device type, there may be three or two RF-MW charts. Supported C6+ and
C7+ devices have three correlation charts. GC devices with two ovens such as C9+ and C10+ only
have two correlation charts.
Retention time chart graphs the retention time value, or peak time, in the unit of seconds (s).
Page 61 of 388
GCAS® Desktop Manual Guide rev. 14
Chart view
To see the exact value of a data point on the charts, hover your mouse cursor over the dots.
Otherwise, switch to table view. On table view, MW is the molecular weight in gram per mole.
Page 62 of 388
GCAS® Desktop Manual Guide rev. 14
Table view
Special value −1
If you see −1 (negative one) for all RF values in this table view, this means the footprint does not have
response factor data. This record may come from data capture operation but with an additional
configuration to ignore incoming RF data. Similarly, if you see −1.00 for all RT values, the footprint
does not have retention time data. Read more about incomplete footprint record.
Retention time chart behaves differently for Daniel C9+/C10+ GCs and ABB GCs. Daniel C6+/C7+
devices have one detector and thus have a certain sort order and is constant. ABB devices have two
detectors and Daniel C9+/C10+ have two ovens, thus the sort order does not apply because the
sequence of analyte gas coming out from one detector is independent from the sequence of the other
detector.
In this case, the RT chart is sorted by value. You can show bar charts from both detectors, from the
first detector only, or from the second detector only.
Example of retention time chart for ABB C6+ GCs. There is a filter dropdown on the right side.
Page 63 of 388
GCAS® Desktop Manual Guide rev. 14
7.2
The Calibration Data Form
The main purpose of Calibration Data form is to show calibration data records and also to compare
this calibration data to the immediate preceding footprint. Similar to Footprint form, the Calibration
Data form has RF chart, RF-MW log charts, and RT chart.
To open Calibration Data form, select the desired device on the device panel on main user interface,
and afterwards go to the View menu > Calibration Data.
Response factor chart and retention time chart display the calibration data values in red and footprint
values in blue. You can hide the footprint (blue) line or bar by unticking the Show footprint check
box on top of footprint timestamp display.
Unlike the other two charts, RF-MW logarithm charts only calculate the logarithm, regression line, and
R2 value of calibration data (red) record only.
Page 64 of 388
GCAS® Desktop Manual Guide rev. 14
Page 65 of 388
GCAS® Desktop Manual Guide rev. 14
In the same way as Footprint form, switch to table view to see exact numeric values. Here you will see
the comparison to footprint value side-by-side.
Special value −1
If you see −1 (negative one) for all RF values in one or both of the table views, this means the
calibration data (or its footprint) does not have response factor data. This record may come from data
capture operation but with an additional configuration to ignore incoming RF data. Similarly, if you
see −1.00 for all RT values, the calibration data (or its footprint) does not have retention time data.
Read more about incomplete calibration record.
Retention time chart for ABB devices and Daniel C9+/C10+ is also sorted by value and you can apply
filter to show data from which detector.
7.3
View Previous Footprints/Calibration Data
To browse previous record of footprint or calibration data, click
calibration data button at the top region of the form.
Page 66 of 388
Change footprint or
Change
GCAS® Desktop Manual Guide rev. 14
Select a different record then click OK button or double click the record on this list.
You can always reload the latest record through
Load latest footprint or
calibration data button.
7.4
Import New Footprint/Calibration Data
To import a new footprint or calibration data, follow the steps below.
1.
Select the desired GC device on your device panel.
Page 67 of 388
Load latest
GCAS® Desktop Manual Guide rev. 14
2.
Open Footprint or Calibration Data form through the View > Footprint menu or View >
Calibration Data.
If you import new data through Footprint form, the imported data shall be marked as
footprint. If you import new data through Calibration Data form, the data will be marked as a
calibration data.
3.
Notice the Action menu on the menu bar. To continue, pick one of the supported import
formats.
a. Text import
b. CSV import
c. Manual entry
7.4.1
Text Import
GCAS Desktop supports calibration report files generated by GC devices manufactured by Daniel
Industries and ABB. If you have the file, open the Action menu and select Import Data. If you don’t
see this menu, your user account may not have the action permission for it or the Text Import feature
was not included in your GCAS licence. Contact your GCAS administrator.
Load the data source file and select the appropriate importer module. The importer module depends
on the format of the file. For example, GCAS Desktop supports legacy Daniel report files, Daniel 370XA
files, and Daniel 700XA files. These three report files have different formats and are not compatible to
one another, therefore we include three Daniel importer modules to handle each of them.
Page 68 of 388
GCAS® Desktop Manual Guide rev. 14
The required files look similar to the screenshots below.
Example of calibration data generated by Daniel GC (legacy format)
Example of calibration data generated by ABB GC
Page 69 of 388
GCAS® Desktop Manual Guide rev. 14
Text import will import one record at a time. The device tag name in the text file must match the
device name (tag) in GCAS database. The device tag name is the “Analyzer” in Daniel GC report
file, or “Station ID” in ABB GC report file.
7.4.2
CSV Import
Should you wish to upload multiple records in one go or if your GC device was not manufactured by
Daniel Industries nor ABB, you would need to use CSV import.
The CSV spreadsheet must follow the template to be recognised by GCAS Desktop (see warning box
below). The template defines column allocation within the spreadsheet. Failure to comply with this
template will result in wrong data being associated with wrong gas or component.
CSV file template should be inside your installation directory. The default directory is C:\GCAS. Look
for CSV import file template.zip in that folder. If you lose this template, you can easily
recreate new one by following the guide in the information box at the bottom of this chapter.
When you are ready to import the CSV file, open the Action menu and choose Import Data - CSV.
Load the CSV file and click Import. GCAS Desktop has only one CSV importer module.
Likewise if you do not see this menu, your user account may not have the action permission for it or
the CSV Import feature was not included in your GCAS licence. Contact your GCAS administrator.
Page 70 of 388
GCAS® Desktop Manual Guide rev. 14
Lost your template?
GCAS Desktop has two CSV templates, one is for footprint and calibration data import while the other
is for mole composition import. For footprint/calibration data import, the column assignments are:
Column
Excel name
Description
1
A
Device tag name. (Yes, you can import data for multiple devices in one go.)
2
B
Record flag. Fill 1 for footprint or 2 for calibration data.
3
C
Record timestamp in the format of dd/mm/yyyy hh:mm (24-hour clock).
4
D
Methane response factor.
5
E
Nitrogen RF.
6
F
Carbon dioxide RF.
7
G
Ethane RF.
8
H
Propane RF.
9
I
i-Butane RF.
10
J
n-Butane RF.
11
K
Neopentane RF. If your device doesn’t read neopentane, fill in 0 (zero).
12
L
i-Pentane RF.
13
M
n-Pentane RF.
14
N
Hexane RF.
15
O
Heptane RF. If your device doesn’t read heptane, fill in 0 (zero).
16
P
Octane RF. If your device doesn’t read octane, fill in 0 (zero).
17
Q
Nonane RF. If your device doesn’t read nonane, fill in 0 (zero).
18
R
Decane RF. If your device doesn’t read decane, fill in 0 (zero).
19
S
Is it multilevel-calibrated RF? Fill 0 for single-point or 1 for MLC.
If you don’t have ISO 10723 in your licence, always fill 0 (zero).
20
T
Methane retention time.
21
U
Nitrogen RT.
22
V
Carbon dioxide RT.
23
W
Ethane RT.
24
X
Propane RT.
25
Y
i-Butane RT.
26
Z
n-Butane RT.
27
AA
Neopentane RT. If your device doesn’t read neopentane, fill in 0 (zero).
28
AB
i-Pentane RT.
29
AC
n-Pentane RT.
30
AD
Hexane RT.
31
AE
Heptane RT. If your device doesn’t read heptane, fill in 0 (zero).
32
AF
Octane RT. If your device doesn’t read octane, fill in 0 (zero).
33
AG
Nonane RT. If your device doesn’t read nonane, fill in 0 (zero).
34
AH
Decane RT. If your device doesn’t read decane, fill in 0 (zero).
In case your GC device does not provide RF data at all, or no RT data at all, set all RF values or RT
values to -1 (negative one). This will cause GCAS Desktop to regard these data as incomplete footprint
or calibration data. RF or RT chart will not be rendered instead of being graphed as all-zeroes.
Page 71 of 388
GCAS® Desktop Manual Guide rev. 14
7.4.3
Manual Entry
Aside from text and CSV import, you also have an option to enter the RF and RT values by hand.
Manual entry also provides additional options to accommodate some GC devices which calculate RF
value using the inverted formula (i.e. mole percentage divided by peak area) or GC devices providing
only the data of peak area. Nevertheless, this method is the least recommended way to import data
because it is very suspectible to human error.
Open the action menu and select Import Data - Manual Entry. This menu displays the Manual Data
Entry form. If you do not see this menu, your GCAS user account may not have the action permission
for manual entry or your GCAS licence does not include Manual Data Entry. Contact your GCAS
administrator.
Page 72 of 388
GCAS® Desktop Manual Guide rev. 14
First things first, set the footprint or calibration timestamp accordingly. Next you can begin entering
RF and RT values in the available input fields.
If your footprint or calibration data does not have retention time data, untick Have Retention Time.
This will disable all RT input fields. Similarly, if you do not wish to enter RF values, untick Have
Response Factor. Read more about incomplete footprint or calibration data.
Response factor input has three options, described below.
Response factor values are readily available: RF data is the values you entered.
Response factor values are inverse of these values: RF data is calculated from the
reciprocal of the values you entered. If you type 1.567E-7 for example, the RF value will be
1 / 1.567×10⁻⁷, which is 6,381,621 (rounded). Use this option if your GC device uses the
inverted formula, that is mole percentage divided by peak area.
Response factor values are calculated from peak area: This option shows two input fields
for every gas. First input field is for peak area as given by your GC device. Second input field is
for mole percentage, as in the component data table or calibration gas certificate. RF values
are then calculated using the formula peak area divided by mole percentage.
o
Mole fraction instead of percentage: This option changes mole percentage input
into mole fraction. GCAS Desktop will convert mole fraction back into percentage at
later stage.
Page 73 of 388
GCAS® Desktop Manual Guide rev. 14
Retention time input has two options, and both are related to its gas order. To make RT input fields
use the same gas order as RF input fields, choose Follow RF gas order. This is particularly useful if
you want to paste the numbers from your spreadsheet (see tip box below) but the gas order in your
spreadsheet is different from the default sort order.
Tip
You can copy numbers from Microsoft Excel or other spreadsheet processing software. Press Ctrl+V
on the first text box and the rest will follow. Alternatively, click
Paste next to the corresponding
input field series.
Click Hide options link near the the top-right corner to hide both option panels and to make larger
room for the input fields.
Always check the numbers — and also the timestamp — before you click Save. Once it is saved, the
record is not editable.
Page 74 of 388
GCAS® Desktop Manual Guide rev. 14
7.5
Change Record Flag and Status
7.5.1
Change Record Flag
Footprint and calibration data share the same record structure in database, distinguished by a flag.
This flag can be changed from footprint to calibration data and vice versa. To change this flag, do the
following.
1.
From an open Footprint or Calibration Data form, go to Action menu > Set Status. If you do not
see this menu, your user account may not have the action permission for it. Contact your GCAS
administrator.
2.
This will show Set Status and Flag dialogue.
3.
Choose one of the options in Set flag group, whether to set the record as a footprint or as a
calibration data. Click OK to commit the change.
4.
Notice that the record is reloaded using the other form. That is, for footprint it will be reloaded
using Calibration Data form, and for calibration data it will be reopened using Footprint form.
5.
The Comments tab opens automatically and it is advised to write a comment of why the record
flag was changed. Comments tab will not open in case your GCAS user account doesn’t have
Page 75 of 388
GCAS® Desktop Manual Guide rev. 14
action permission to post comments.
7.5.2
Change Status
Every footprint or calibration record has a status bit that can change from active to inactive or vice
versa. Inactive records will not be included in data analysis therefore will not affect the calculation of
mean and standard deviation in data analysis. Below are the steps to mark records as inactive or
active.
1.
From an open Footprint or Calibration Data form, go to Action menu > Set status. If you do not
see this menu, your user account may not have the action permission for it. Contact your GCAS
administrator.
2.
This will show Set Status and Flag dialogue.
Page 76 of 388
GCAS® Desktop Manual Guide rev. 14
3.
Choose one of the options in Set status group, whether to mark this record as active or inactive.
Click OK to commit the change.
4.
The form will reload the record and you should see the new status on the top section. Next, the
Comments tab opens automatically and it is advised to write a comment of why the record status
was changed. Comments tab does not open if your GCAS user account doesn’t have action
permission to post comments.
7.6
Incomplete Footprint or Calibration Data
There are cases of incomplete footprint record or incomplete calibration data. A footprint or
calibration record is said to be incomplete if it has only response factor data, or only retention time
data, but not both. Incomplete records usually come from data capture operation but with additional
configuration to ignore RF data or ignore RT data.
If GCAS Desktop was instructed to ignore RF data, it assigns the special value −1 (negative one) to all
RF values. The same goes for RT, which GCAS Desktop assigns −1 to all RT fields. You shall see this
special −1 value when you switch to table view on either Footprint or Calibration Data form.
Why −1? This value is used to differentiate the 0 (zero) value, which indicates the gas is missing or not
present in the calibration inlet. By default, GCAS Desktop will still plot zero values on RF or RT chart,
but not the −1's. You can override this behaviour by starting GCAS Desktop with an additional
/drawincompleteRFRT parameter.
When you view an incomplete record, its response factor chart or retention time chart will display a
text annotation on top of itself. For example,
Page 77 of 388
GCAS® Desktop Manual Guide rev. 14
In the screenshot above, the calibration record does not have retention time data. You only see blue
bars (footprint), but red bars (calibration) are missing. Another example,
…the calibration record has RF data but its footprint does not. You only see red line (calibration) but
blue line (footprint) is missing. The chart displays annotation that the footprint does not have RF data.
If you are on Calibration Data form, the annotation may obscure part of the chart. Click once on the
annotation to reveal the
close icon. Click again on the
(Footprint form does not have this feature.)
Page 78 of 388
close icon to remove the annotation.
GCAS® Desktop Manual Guide rev. 14
7.7
Zoom and Scroll (RF Chart Only)
Daniel C9+ and C10+ devices have a distinctive characteristic on their RF charts: The line chart rises
slowly, but suddenly jumps to a much higher number starting at the first gas being detected by the
second detector.
In order to zoom a part of this chart, drag a rectangle on the area you would like to zoom in.
Use the scroll bars to pan the zoomed chart.
To zoom in further, drag another rectangle area.
To zoom out, either click both circled minus buttons Θ or right click on the chart then select Zoom
All-Out.
Page 79 of 388
GCAS® Desktop Manual Guide rev. 14
The crosshair cursor is the dotted magenta line which appeared when you click anywhere on the chart
region or as a remnant of a zoom operation. These lines may act as a ruler or guide. To remove these
lines, right click on the chart and select Hide Crosshair Cursors.
Page 80 of 388
GCAS® Desktop Manual Guide rev. 14
7.8
GC Health Status
GCAS Desktop may suggest an action should you see a fail alarm, which is R 2 (correlation) value is
below the defined threshold. For the time being, this feature is only available for Daniel C6+ and C7+
GCs.
Go to the Health status tab on either Footprint form or Calibration Data form. In the example below,
the correlation value of light-and-heavy components (methane, ethane, hexane) happened to be
under the threshold.
Let's take a detour to the RF-MW charts. Here we see the R2 (correlation) value of C1-C2-C6 is short
under the threshold of 0.995. By looking at the third chart, we see that C6 is below the trend line.
Hexane is lower than where it should be.
Page 81 of 388
GCAS® Desktop Manual Guide rev. 14
We can infer that the hexane backflush stage is late, so that a part of hexane eluted to the second
column. To achieve the goal in this example, we need to adjust the timing of valve 2 to close a bit
faster. After making such adjustment, we have a good correlation on the next calibration cycle:
GC health status is only available for Daniel C6+ and C7+ devices. Method of suggestion based on R2
values for Daniel C9+, Daniel C10+, and ABB GCs is currently not available.
7.9
Insert Comment
Users can comment on a record. It is useful to write comments when an action is being done onto GC
device, or in case of unexpected behaviour has occurred. You are also taken to the comment section
automatically whenever record property is changed (either record flag or record status). It is a good
practice to provide explanation on why the record property was changed.
1.
To insert comment, open the Comments tab or go to Action menu > Add Comment.
2.
Write your comment on the text box at the lower section of the form then click on Submit button.
Page 82 of 388
GCAS® Desktop Manual Guide rev. 14
3.
Make sure the comment is correct (e.g. free from spelling errors) because once inserted into
database, you will not be able to remove the comment. This is a part of the requirement for audit
trail.
If you do not see the textbox and the Submit button, i.e. the comment grid fills up the entire form,
your user account may not have action permission to write comments or your user role is Read-only.
Contact your GCAS administrator.
7.10
Send to Correlation Calculator
This shortcut is intended for unsupported GC or those in special needs. For example, your GC is C10+
complete, is actually calibrated with C10 calibration gas (decane is present). But later on, your process
gas is only up to C9 (decane is missing). This will mess up the correlation calculation (R 2) because the
response factor of decane is zero. To workaround this problem, open the Action menu from an open
Footprint or Calibration Data form, then select Send to Correlation Calculator.
This menu will send all response factor values from methane (C1) to decane (C10) to Correlation
Calculator. Only normal butane and normal pentane are included, their isomers are not. Once the
Correlation Calculator form is open, simply delete any unwanted gases and the calculator will get you
the correct R2 result. In our example before, C10+ device treated as C9+ should have R2 of C6-C7-C8C9, not C7-C8-C9-C10. In Correlation Calculator form, delete methane, ethane, propane, butane,
pentane, and decane; this will give you the correlation of hexane, heptane, octane, and nonane. Visit
chapter 18 to read more about correlation calculator.
Page 83 of 388
GCAS® Desktop Manual Guide rev. 14
Correlation Calculator with data sent from Footprint or Calibration Data form. Delete unwanted gases to
get the correct R2 result. For example, to get the correlation of C7-C8-C9-C10, delete everything from
methane to hexane.
7.11
Multilevel-Calibrated RF (ISO 10723)
GCAS Desktop supports the traditional single-point response factors as well as multilevel-calibrated
(MLC) response factors.
Note
This feature requires ISO 10723 feature in your GCAS licence.
Users with ISO 10723 feature in their licences will see MLC selector at top-left region of response
factor chart. This dropdown list lets you change the displayed RF whether the single-point or the MLC
one. GCAS Desktop performs ISO 10723 conversion on-the-spot, therefore the actual RF values in the
database are not affected. By default, GCAS Desktop displays single-point RF.
Page 84 of 388
GCAS® Desktop Manual Guide rev. 14
Single-point RF has the familiar graph as discussed so far, it has to be ascending and the values are in
the range of millions to hundreds of millions. However multilevel-calibrated RF is different: All values
are close to one (1.0), therefore its chart is somewhat horizonally flat. Multilevel-calibrated RF has no
much use as it is not usable for correlation calculation, but you can easily detect anomalies if the chart
is not flat.
ISO 10723 conversion for footprint/calibration data requires:
1.
A multilevel calibration (MLC) coefficient set installed before the timestamp of the
footprint/calibration record, and
2.
An active calibration gas certificate installed before the timestamp of the footprint/calibration
record.
If these two conditions are not met, the footprint or calibration record is said to be not convertible. For
calibration data, these conditions must be fulfilled for both the calibration record itself and the
preceding footprint. GCAS displays a
warning icon next to the MLC dropdown selector if your
footprint or calibration data is not convertible; also if the calibration data is convertible but its
preceding footprint isn’t. In the latter case, the MLC coefficients are between the footprint and
calibration record timestamp. Click on the warning icon to see the detailed reason why the record is
not convertible.
MLC conversion warning icon.
Page 85 of 388
GCAS® Desktop Manual Guide rev. 14
To see the MLC coefficients associated with current record, open the Action menu, select ISO 10723,
then click View MLC Coefficients. This menu calls Multilevel Calibration Coefficients form and loads
the correct coefficient set associated with current footprint or calibration data.
7.11.1
MLC Flag Bit
Footprint and calibration records have an additional flag bit to indicate whether the RF values are
single-point or multilevel-calibrated. If you don’t have ISO 10723 feature in your licence, this flag bit is
always set to single-point. To recap, footprints and calibration data have three flag bits: One to
indicate active/inactive, another one to indicate whether it is a footprint or calibration data, and the
last one to indicate whether its RF are single-point or MLC.
Open the Action menu and select ISO 10723. The first submenu is not clickable but it tells you what
the flag bit of current record is. In the screenshot below, it tells us the flag bit for this record is MLC,
even though RF chart displayed at the back is single-point.
You can change the MLC flag bit if necessary, however there is one important difference between
“Mark As” and “Convert To”. Read more on the next chapter, 7.11.2.
7.11.2
Mark As versus Convert To
Open Action menu, select ISO 10723, then select Mark As… or Convert To… and GCAS Desktop
reveals this dialogue box.
Page 86 of 388
GCAS® Desktop Manual Guide rev. 14
Current flag bit is highlighted in yellow to clarify what the current flag bit is. Next, decide whether you
need to mark the flag bit or convert the whole record.
Mark As changes the flag bit only. The original numbers of all RF values are untouched. Use this if you
notice:
MLC selector shows “single-point” but the chart is horizontally flat and all numbers are close
to one (1.0). Also when the selector is changed to multilevel-calibrated, the chart is still flat
and all numbers become almost zero. You need to mark the record as MLC.
MLC selector shows “multilevel-calibrated” but the chart is not horizontally flat and instead
the numbers skyrocket to scale of hundreds of billions or even trillions. Also when the selector
is changed to single-point, the chart suddenly forms a nice ascending shape and the numbers
now make sense. You need to mark the record as single-point.
Convert To changes the flag bit and converts all RF values, thus changing the actual numbers stored
in database—permanently. Use this when you see the record is good (the numbers make sense),
which is completely opposite condition of when to use Mark As.
Because Convert To also converts the actual RF values, you will get the desired numbers during data
export. For example, you want to export footprint/calibration data into CSV. All records are marked as
MLC. If you go to export directly, all RF values in the result CSV will also be close to one (1.0) as they
were in MLC. On the contrary if you use Convert To single-point before the export, RF numbers will be
in scale of millions like typical single-point RF values.
Unlike Mark As, the Convert To operation requires action permission “MLC permanent conversion”. If
your GCAS administrator doesn’t give you this permission, GCAS displays a message saying that you
don’t have sufficient permission to perform conversion when you select Convert To in this dialogue
box.
Important
Be very cautious when using Convert To. Performing permanent conversions on wrong record will
damage the record permanently. For instance, a calibration record is wrongfully marked as singlepoint where it should’ve been marked as MLC. You should use Mark As MLC here. But if you apply
Page 87 of 388
GCAS® Desktop Manual Guide rev. 14
Convert To MLC instead, the numbers will change to somewhere close to zero—damaging the record
permanently.
7.11.3
Change MLC Flag Bit (Multiple Records)
Changing MLC flag bit as described in chapter 7.11.2 only changes one record at a time. Sometimes
you need to change flag bit of a bunch of records, such as when you notice calibration records
coming from data capture should be marked as MLC but you forgot to set it in modbus mapping.
Therefore all these records are still wrongly marked as single-point. To save time, go to the Action
menu, select ISO 10723, then select Mark As… (Bulk).
This dialogue lets you change MLC flag bit of all records of the selected GC device (no exceptions), or
limited to certain date range, or specific selections of available records. For specific selections, a
star indicates a footprint.
Page 88 of 388
GCAS® Desktop Manual Guide rev. 14
Note
There is no Convert To feature for bulk operation because it may damage multiple records.
7.11.4
MLC Constraints
We moved the explanation about concepts and application of MLC constraints to chapter 22.2. Most
of the time, users need not to worry about MLC constraints. However there is a slim chance the
default MLC constraints causes nonsensical RF values, such as 300 billions where it should be about 17
millions. In such cases, you may need to override the MLC constraints in order to get the correct
result. Read more on chapter 22.2 about MLC constraints.
7.12
Printing
From an open Footprint or Calibration Data, go to the File menu on the main menu bar. Select Page
Setup to configure paper size and print orientation. Select Print Preview to get a preview or Print to
begin printing. Alternatively, the menu Print Preview and Print are also found inside the Action menu.
The Quick Print menu immediately sends the footprint or calibration data to your default printer
according to what has been set in Windows Control Panel, using current page setup (default is A4
portrait).
Print preview dialogue.
GCAS Desktop has different print layout for portrait and landscape orientation. GC health status and
user comments are printed on subsequent pages.
Page 89 of 388
GCAS® Desktop Manual Guide rev. 14
8
Mole Composition
Mole composition (formerly “mole percentage”) is a record of, as its name suggests, mole composition
of either calibration gas or process gas in one chromatography cycle.
Note
In order to use features related to mole composition e.g. Mole Composition form, mole composition
data capture, and mole composition data analysis, you need GCAS feature Live Data Analysis in your
GCAS licence.
Early versions of GCAS Desktop only recognises mole percentage, but now GCAS can work with any
scale. We generalise mole percentage, fraction, or whatever scale it is, into one name – mole
composition. From this chapter onward, the term “mole composition” may be abbreviated as “MC”.
8.1
The Mole Composition Form
Mole Composition form displays mole composition data presented in grid view. By default, numbers
in this grid is the normalised composition. The pie chart next to the grid helps visualising the data,
although in many cases methane composition overwhelms everything else. This is caused by the use
of balanced methane in calibration gas.
To open Mole Composition form, select the device from device panel on the main user interface, then
go to the View menu > Mole Composition.
Page 90 of 388
GCAS® Desktop Manual Guide rev. 14
Mole Composition form as seen by users with ISO 10723 feature included in GCAS licence.
Users without ISO 10723 feature will not see features related to multilevel calibration (MLC).
As mole composition data may come from multiple streams, the stream number is displayed on top of
the pie chart. Some GC designates stream 1 as the calibration stream and stream 2 as process stream,
while some others specify stream numbers the other way round. GCAS Desktop can also handle GC
devices with more than two streams, the appropriate stream number is always there on top of the pie
chart.
Remove mode check box will hide the mode (Latin: modus) from the pie chart. That is, the datum with
highest value among other data. For example, if you have methane composition at 90%, it would be
difficult to see other gases cramped in the remaining 10%. Ticking this option will hide methane from
the pie chart.
Show legend toggles show or hide the legend of pie chart.
High precision causes the form to show all numbers in 8-digit decimals instead of four digits. If you
see some rounding errors, that is because GCAS uses 32-bit floating point for mole composition data
to save database space.
Colourblind assist. To aid users with colour blindness (protanopia and deuteranopia), GCAS Desktop
provides an alternative colour scheme for the pie chart.
Page 91 of 388
GCAS® Desktop Manual Guide rev. 14
Show unnormalised reveals third column in grid view: the unnormalised composition. If you have ISO
10723 feature in your licence, this check box also reveals the unnormalised MLC composition as well.
Nonetheless, the pie chart always displays normalised composition.
Show difference check box is available for customers having ISO 10723 feature in their licences. This
check box reveals an additional column in grid view called the delta. It contains the difference
between normalised single-point composition and normalised MLC composition. Delta is computed
as single-point minus MLC.
8.2
View Previous Records
To load previous mole composition data, click
Change record button at the top region of the
form. Select a different record, then click OK or double click the list item.
Select Record dialogue. Timestamps on this screenshot are fictional, actual records are usually 4-7
minutes apart.
You can always load the latest mole composition data through
8.3
Load latest record button.
Import New Composition Data
Unlike footprint or calibration data import which allows text files, CSV files, or manual entry; GCAS
Desktop supports only CSV import for mole composition data—if not captured live using data
capture. The CSV file must follow the standard template for mole composition. The template file
Page 92 of 388
GCAS® Desktop Manual Guide rev. 14
should be in your installation directory or in the browser/HTML version of GCAS Desktop Manual.
Look for CSV import file template.zip in your installation directory. If you lose this template,
you can easily recreate new one by following the guide in the information box at the bottom of this
chapter.
Below are the steps to import mole composition data.
1.
Select the GC device whose data to be imported on your device panel.
2.
Open Mole Composition form through the View menu > Mole Composition.
3.
Notice the Action menu on the menu bar.
4.
Open the Action menu and select Import Data - CSV.
5.
Load the CSV file and then click Import.
If you do not see this menu, your user account may not have the action permission for it or the CSV
import feature is not included in your GCAS licence. Contact your GCAS administrator.
GCAS Desktop treats all numbers in the CSV file as unnormalised composition and will normalise them
before they are committed to GCAS database.
Lost your template?
GCAS Desktop has two CSV templates, one is for footprint and calibration data import while the other
is for mole composition import. For mole composition import, the column assignments are:
Page 93 of 388
GCAS® Desktop Manual Guide rev. 14
Column
Excel name
Description
1
A
Device tag name. (Yes, you can import data for multiple devices in one go.)
2
B
Stream number.
3
C
Record timestamp in the format of dd/mm/yyyy hh:mm (24-hour clock).
4
D
Methane mole composition.
5
E
Nitrogen MC.
6
F
Carbon dioxide MC.
7
G
Ethane MC.
8
H
Propane MC.
9
I
i-Butane MC.
10
J
n-Butane MC.
11
K
Neopentane MC. If your device doesn’t read neopentane, fill in 0 (zero).
12
L
i-Pentane MC.
13
M
n-Pentane MC.
14
N
Hexane MC.
15
O
Heptane MC. If your device doesn’t read heptane, fill in 0 (zero).
16
P
Octane MC. If your device doesn’t read octane, fill in 0 (zero).
17
Q
Nonane MC. If your device doesn’t read nonane, fill in 0 (zero).
18
R
Decane MC. If your device doesn’t read decane, fill in 0 (zero).
19
S
Unnormalised total.
20
T
Is it multilevel-calibrated MC? Fill 0 for single-point, or 1 for MLC.
If you don’t have ISO 10723 in your licence, always fill 0 (zero).
8.4
Spot Sampling
A spot sample is a special mole composition record. Regular mole composition record is the
composition of gases read by the GC device, but spot sample is the composition of gases before they
enter GC device. Spot sampling is conducted directly on the pipeline (on the sample probe) before
entering the pressure letdown system (hence the name “spot”); or if the process gas is delivered in gas
tank/canister then the sampling method is administered straight on the canister.
The purpose of spot sampling is to verify if your pressure letdown system works properly — no
leakage, no condensation, no dropout, etc. If the spot sample record is very close to the regular mole
composition record (taking the lag time into account), then generally speaking your pressure letdown
system should be fine.
To enter spot sample data, select the device from the device panel then open the Mole Composition
form through View menu > Mole Composition. Open the Action menu, then click Spot Sampling.
Page 94 of 388
GCAS® Desktop Manual Guide rev. 14
This brings forth the Spot Sampling form. First thing first, enter the date and time of when the
sample was taken. Once the record commits to database, you cannot change its timestamp but you
can set it as inactive and re-enter a same record with the correct timestamp.
The next step is to key in mole composition value of each gas. The composition you are entering now
is the unnormalised composition.
Page 95 of 388
GCAS® Desktop Manual Guide rev. 14
As you type, the total/sum is updated accordingly and all values are automatically normalised in the
rightmost column. The form deduces the correct scale automatically. Therefore, for a few first gases,
total/sum for normalised column may display 1 (mole fraction) or 10 (decimal). As you fill in more and
more fields, the scale will change accordingly and typically end up in 100 (percentage).
Always double-check the numbers to avoid potential human error. When you are ready, click Save to
commit the record.
Tip
You can copy values from Microsoft Excel or other spreadsheet processing software. Press Ctrl+V
inside the first text box and the rest will follow. Alternatively, click
Click
Clear to reset all fields back to zero.
Page 96 of 388
Paste button.
GCAS® Desktop Manual Guide rev. 14
8.5
Change Record Status (Single Record)
Similar to footprint and calibration data record, every mole composition record has a status bit
indicating either active or inactive. Similarly, inactive records will not appear in data analysis and will
not affect the calculation of mean and standard deviation, uncertainty calculation, ISO 6976 trend, and
many others. To change record status of the mole composition record currently loaded, do the
following:
1.
From an open Mole Composition form, go to Action menu > Set Status. If you do not see this
menu, your user account may not have the action permission for it. Contact your GCAS
administrator.
2.
This will show Set Status dialogue. Choose the appropriate record status then click OK.
3.
The form will reload the record and you should see the new status at the upper section.
Afterwards, the Comments tab opens automatically and it is recommended to write a
comment of why the record status was changed. Comments tab does not open in case your
GCAS user account doesn’t have the action permission to post comments.
Page 97 of 388
GCAS® Desktop Manual Guide rev. 14
8.6
Change Record Status (Multiple Records)
Mole composition records mostly came from a data capture operation. To make it worse, many users
set the data capture in unattended mode. If an error happened during unattended data capture, bad
records will still be committed into database. This may lead to numerous unusable records in the
database and it is a tedious work to set their status as inactive one by one. GCAS Desktop includes a
tool to set record status in bulk (batch) operation.
From an open Mole Composition form, open the Action menu and select Set Status (Bulk). If you do
not see this menu, your user account may not have the action permission for it. Contact your GCAS
administrator.
Page 98 of 388
GCAS® Desktop Manual Guide rev. 14
This menu brings the Set Status for Multiple Records dialogue. This window has two views, namely
simple view and advanced view. The first time this dialogue opens, it is on simple view.
8.6.1
Simple View
Using simple view, you set the desired record status (active or inactive) for all mole composition
records between the two date/time perimeters. This may or may not be filtered to a stream number.
The user interface in simple view is pretty straightforward. Depending on how many stream numbers
ever recorded into the database, stream number selection may look like this.
If you choose (all streams), that will change record status of all mole composition records within the
defined date boundaries regardless of stream numbers except spot samples. If you choose (spot
samples), the status change only applies to spot sample records within the date interval. All next
choices afterwards are the actual stream numbers available. You can also type the desired stream
number if it is not on this list. To confirm, click OK and GCAS Desktop begins the batch operation.
Note
GCAS Desktop does not add automatic comment such as "This record status was changed
to inactive at <current computer time>" for bulk status change in simple view. Use
advanced view if you want to attach comments to these records.
To switch into advanced view, click Advanced button.
Page 99 of 388
GCAS® Desktop Manual Guide rev. 14
8.6.2
Advanced View
Advanced view gives more flexibility to set record status for multiple records. In advanced view, GCAS
Desktop gives a list of mole composition records and you tick which ones to change status.
For the first time, GCAS Desktop lists all records within the last 24 hours. To change the date filter,
choose Filter by date/time and enter the desired interval. If you choose Show all records, this turns
off the date filter and you see all records ever exist for this GC device since the beginning. Click
Refresh at the top right corner to apply the new date filter and reload the list.
At the bottom left corner, there is a selection of available stream numbers. Change which stream
number to display on the record list, then click Refresh to apply the stream number filter and reload
the list.
Tick or untick records you want to have their status to change. The Current status column displays
current record status before the operation begins. To view the record content, click View record
button available at each row. That button opens a new Mole Composition form and loads that
particular record. In the example screenshot below, there are 6 records to be set as inactive when you
press OK button. The rest (those without check mark) are left untouched, thus their status remains
active.
Page 100 of 388
GCAS® Desktop Manual Guide rev. 14
Click on the column header of the check boxes (yes, that one with a boxed check mark symbol) to
quickly check all or uncheck all records in the list.
Click the column header to quickly tick all or untick all records.
Page 101 of 388
GCAS® Desktop Manual Guide rev. 14
You can also attach a comment to each record like what GCAS does in single record status change. To
do so, give a check mark at Add comment to each record. Then write your comment at the text box
under the check box. The same comment is applied to every ticked record when their statuses are
being changed.
The comment box recognises five keywords called macro(s) which it automatically highlights in red.
Macro identifier starts with the '@' symbol and is all-uppercase. GCAS Desktop replaces these macros
with actual values before writing them into database.
Macro keyword
Will be replaced with
@OLDSTATUS
Previous record status ("active" or "inactive")
@NEWSTATUS
New record status ("active" or "inactive")
@DATE
Current computer date, e.g. "15 September 2014".
@TIME
Current computer time in 24-hour format, e.g. "16:28:44".
@DATETIME
Current computer date and time, e.g. "15 September 2014
16:28:44".
For instance, this comment macro:
This record was set as @NEWSTATUS at @DATETIME. Calibration gas tank is
used up therefore the unnormalised total gradually declines.
will be replaced with actual values such as:
This record was set as inactive at 02 October 2014 14:24:01. Calibration
gas tank is used up therefore the unnormalised total gradually declines.
Which you can easily verify by visiting any record included in bulk operation, like this one.
Page 102 of 388
GCAS® Desktop Manual Guide rev. 14
To switch back into simple view, click Simple button at the left side of OK button.
8.7
Insert Comment
Like footprint and calibration records, users can also put comments on a mole composition record.
1.
To insert comment, open the Comments tab or go to Action menu > Add Comment.
2.
Write your comment on the text box at the lower section of the form, then click Submit.
3.
Make sure the comment is correct (e.g. free from spelling errors) because once inserted into
database, you will not be able to remove the comment.
If you do not see the textbox and the Submit button, i.e. the comment grid fills up the entire form,
your user account may not have action permission to write comments or your user role is Read-only.
Contact your GCAS administrator.
8.8
Automatic or Fixed Scale
Early versions of GCAS works only with percentage scale, but now it works with any scale up to parts
per billion (PPB). GCAS automatically determines which scale to use according to the unnormalised
total value. If the unnormalised total is around 100, then it is percentage. If it is around 1000, probably
it is permillage (‰).
Page 103 of 388
GCAS® Desktop Manual Guide rev. 14
The automatic scale may not work as you expect. For example, a problem on the GC or the pipeline
caused the unnormalised total to drop to 15%. This number is close to 10, therefore GCAS assumes
the scale is decimal (0 to 10). You know the GC reads the composition in percentage scale, hence the
decimal scale may hinder troubleshooting.
To override this automatic scaling, browse to the desired mole composition record then open the
Action menu. Under Normalisation Scale, select which scale to use. Mole Composition form is now
locked to the selected scale until it is closed.
8.9
Send to ISO 6976 Calculator
Users whose GCAS licence includes GCAS feature ISO 6976 Calculator shall see an additional action
menu called Send to ISO 6976 Calculator. This shortcut sends the mole composition record to ISO
6976 Calculator tool. It calculates the calorific value (CV) and other properties of this composition.
Page 104 of 388
GCAS® Desktop Manual Guide rev. 14
Users with ISO 10723 feature included in their licences shall see two submenus. One will send
normalised single-point composition, while the other will send normalised multilevel-calibrated
composition. Users without ISO 10723 see no submenus, the menu itself will send normalised singlepoint composition. For more information about ISO 6976 Calculator, visit chapter 19.
8.10
Multilevel-Calibrated MC (ISO 10723)
GCAS Desktop supports the traditional single-point mole compositions as well as multilevel-calibrated
(MLC) mole compositions.
Note
This feature requires ISO 10723 feature in your GCAS licence.
Users with ISO 10723 feature on their licences will see two columns when Mole Composition forms is
loaded for the first time. First is normalised single-point composition, second is normalised MLC
composition. Unlike multilevel-calibrated RF, multilevel-calibrated mole composition (MC) have values
close to its single-point counterpart. The difference between single-point and MLC mole composition
is usually called bias.
ISO 10723 conversion for mole composition requires:
Page 105 of 388
GCAS® Desktop Manual Guide rev. 14
1.
A multilevel calibration (MLC) coefficient set installed before the timestamp of the mole
composition record, and
2.
An active, MLC-convertible calibration data or footprint before the timestamp of the mole
composition record; which in turn requires:
3.
A multilevel calibration (MLC) coefficient set installed before the timestamp of this
footprint/calibration record, and finally
4.
An active calibration gas certificate installed before the timestamp of this footprint/calibration
record.
If one or more of these conditions are not met, the mole composition record is said to be not
convertible. GCAS Desktop displays a
warning icon at the bottom of the form, below the pie chart,
if:
1.
One or more of the four conditions above are not fulfilled, or
2.
The MLC coefficient set used by the mole composition record and coefficient set used by the
preceding footprint/calibration data are different. This can happen if there is a new coefficient
set installed between the timestamp of the calibration data and the timestamp of mole
composition record.
Click on the warning icon to see the detailed reason why the record is not convertible. Some items on
the warning dropdown are shortcuts. For example if it says the record is not preceeded by any MLC
coefficient sets, clicking on that item brings you the MLC Coefficients form in edit mode so you can
enter the coefficients straight away.
Non-convertible records display “N/A” in either single-point or MLC columns in both normalised and
unnormalised, depending on its MLC flag bit. Records having flag bit marked as single-point which is
not convertible into MLC will show “N/A” in MLC columns and vice versa. Additionally, the delta
column (through Show difference check box) will be empty.
Note
Spot samples are never convertible. Spot samples are always marked as single-point compositions.
To see the MLC coefficients associated with current record, open the Action menu, select ISO 10723,
then click View MLC Coefficients. This menu calls Multilevel Calibration Coefficients form and loads
the correct coefficient set associated with current mole composition record. To see the calibration
Page 106 of 388
GCAS® Desktop Manual Guide rev. 14
data or footprint which is used by current mole composition record, click View Associated RF in the
same ISO 10723 menu.
8.10.1
MLC Flag Bit
Similar to footprint and calibration data, all mole composition records have MLC flag bit to indicate
whether it is single-point or multilevel-calibrated. The easiest way to see MLC flag bit is to look at the
title of pie chart. It says the stream number, for example “Stream 2”, and if the MLC flag bit is
multilevel-calibrated then the title appends “(MLC)” after stream number. If there is no other text,
then it is single-point. Alternatively, open the Action menu and select ISO 10723. The first submenu is
not clickable but it states the MLC flag bit.
You can change MLC flag bit if necessary, however do this with caution. Because single-point
compositions and MLC compositions are similar in values unlike single-point RF versus MLC RF which
are completely different, it is easy to mistake which composition is single-point or MLC.
Page 107 of 388
GCAS® Desktop Manual Guide rev. 14
8.10.2
Mark As versus Convert To
Open Action menu, select ISO 10723, then select Mark As… or Convert To… and GCAS Desktop
shows this dialogue box.
Current flag bit is highlighted in yellow to clarify what the bit value is. Next, decide whether you need
to mark the flag bit or convert the whole record.
Mark As changes the flag bit only. The original numbers of all mole values are untouched. By contrast,
Convert To changes the flag bit and converts all mole values, thus changing the actual numbers
stored in database. Permanently.
Unlike Mark As, the Convert To operation requires action permission “MLC permanent conversion”. If
your GCAS administrator doesn’t give you this permission, GCAS Desktop displays a message saying
that you don’t have sufficient permission to perform conversion when you select Convert To in this
dialogue box.
Important
Be extra cautious when using Convert To. Performing permanent conversions on wrong record will
damage the record permanently. Furthermore because single-point compositions and MLC
compositions are similar in terms of numeric values, always double or triple check before using
Convert To.
8.10.3
Change MLC Flag Bit (Multiple Records)
Chapter 8.10.2 explained how to change flag bit for one record. Mole composition records usually
come from data capture operation, thus you may need to change flag bit of tens or even hundreds of
records. To save your time, open the Action menu, select ISO 10723 and then click Mark As… (Bulk).
The dialogue box is slightly different from Set Flag Bit for Multiple Records dialogue belonged to
footprint and calibration data. The Set Flag Bit for Multiple Records dialogue for mole compositions
lets you filter by stream number, and later (optionally) by date or specific selections of records.
Page 108 of 388
GCAS® Desktop Manual Guide rev. 14
Note
There is no Convert To feature for bulk operation because it may damage multiple records.
Page 109 of 388
GCAS® Desktop Manual Guide rev. 14
8.10.4
MLC Constraints
We moved the explanation about concepts and application of MLC constraints to chapter 22.2. Most
of the time, users need not to worry about MLC constraints. However there is a slim chance the
default MLC constraints generates silly unnormalised total such as in the screenshot below. The
ethane exceeds 150% which is nonsense. In those rare cases, you may need to override the MLC
constraints in order to get the correct result. Read more on chapter 22.2 about MLC constraints.
Page 110 of 388
GCAS® Desktop Manual Guide rev. 14
9
Calibration Gas Certificate
Calibration gas certificate is a record of composition and uncertainty of a certified calibration gas
package. These certificates usually come as a papers (hardcopies) or labels attached to the gas tank or
canister. Calibration certificate module is required by Uncertainty Calculation module.
Note
To use Calibration Gas Certificate module, you need GCAS feature either Calibration Gas Certificate or
Uncertainty Calculation, or Uncertainty Trend to be included in your licence.
GCAS feature Calibration Gas Certificate is given to customers who'd like to unlock Calibration Gas
Certificate module but do not want the full Uncertainty Calculation module. If you purchased
Uncertainty Calculation feature or Uncertainty Trend, you have access to Calibration Gas Certificate
module automatically.
9.1
The Calibration Gas Certificate Form
Calibration Gas Certificate form displays the content of a calibration certificate and its properties. To
open Calibration Gas Certificate form, select a device on your device panel and go to the View menu >
Calibration Certificate.
Page 111 of 388
GCAS® Desktop Manual Guide rev. 14
Calibration Gas Certificate form. Data in this screenshot is fictional, for illustration purpose only.
First tab is called Table; here you see all mole percentage values and their corresponding absolute
uncertainty (as written on your paper certificate). It also shows the relative uncertainty which is
calculated from your absolute uncertainty. This relative uncertainty is calculated at the k value
(coverage factor) that is embedded in the certificate record in GCAS database. To find out what is the
k value for this record, switch to the second tab. Relative uncertainty (also known as Ucal gas) is a part of
uncertainty calculation.
Second tab is Information where other properties of the certificate is listed. Third tab is Comments,
which like the other forms in GCAS Desktop, displays user comments for the certificate.
The "Information" tab. Data is fictional.
9.2
View Previous Certificates
To view other calibration certificates, Click
Change certificate. Select a different certificate, then
click OK or double click the list item.
Page 112 of 388
GCAS® Desktop Manual Guide rev. 14
Click
9.3
Load latest certificate to return to the most up-to-date certificate.
Input a New Certificate
As calibration certificates come as hardcopies, you need to enter the mole percentage and uncertainty
values meticulously by hand. Open the Action menu and select New Certificate. If you do not see this
menu, you may not have the action permission for it. Contact your GCAS Administrator.
The New Calibration Certificate entry form shall appear. Begin by entering certificate properties such
as certificate number, issue date, install date, expiry date, minimum storage and/or usage pressure,
minimum storage and/or usage temperature, cylinder/gas tank/canister serial number, and the k value
(coverage factor).
Page 113 of 388
GCAS® Desktop Manual Guide rev. 14
Afterwards, enter the mole percentage and absolute uncertainty value of each gas in the certificate. Be
alert for potential human error while typing. When you are confident with all entries, click Save to save
the certificate record into database.
Note
Certificate number, k number (coverage factor) and install date must be specified. Other properties
can have blank (null) data. Typically, the next calibration cycle after the certificate install date is a
footprint.
If the certificate does not specify minimum storage/usage pressure and temperature, set them blank.
If the cylinder number is not available, leave it blank too. If there is no info about issue date and expiry
date, untick the corresponding check box inside the date picker.
Unlike Mole Composition module which recognises any scale, calibration gas certificate must be
expressed in percentage.
Page 114 of 388
GCAS® Desktop Manual Guide rev. 14
Like any other text box series in GCAS Desktop interface, you can paste numbers from Microsoft Excel
or other spreadsheet processing software. Press Ctrl+V inside the first text box and the rest will
follow. Alternatively, click
9.4
Paste.
Edit a Certificate
Sometimes human errors happen. If you did a mistake when entering numbers in the previous
chapter, go to the Action menu and select Edit Certificate. If you do not see this menu, you may not
have the action permission for it. Contact your GCAS Administrator.
This menu brings forth Edit Calibration Certificate form which is the same form as New Calibration
Certificate but its function now is to correct mistakes in the numbers. Correct every wrong value and
then click Save.
Page 115 of 388
GCAS® Desktop Manual Guide rev. 14
Although you can use Edit Calibration Certificate form to change the certificate install date, this can
trigger unwanted side effect. If another certificate has already existed on the same date, GCAS
Desktop will use whichever stored first in the database.
9.5
Change Certificate Status
Every certificate record has a status bit indicating whether the certificate is active or inactive. GCAS
Desktop will not use inactive certificates in uncertainty calculation and ISO 10723 conversion.
To change certificate status, open the Action menu and select Set Status or k-Number. If you do not
see this menu, your GCAS user account does not have action permission for it.
This menu brings forth the Set Status and k-Number dialogue where you can flip records status from
active to inactive or the other way round.
After you change the status, Calibration Gas Certificate form will reload the record and displays the
new status at the top region of the form. It also switches to Comments and asks you to write a
comment of why the status was changed. Comments tab does not open in case your GCAS user
account doesn’t have action permission to post comments.
Page 116 of 388
GCAS® Desktop Manual Guide rev. 14
9.6
Change k Number (Coverage Factor)
Use the same Action menu as the previous subchapter, Set Status or k-Number. This menu calls the
Set Status and k-Number dialogue, then choose the new k value.
After you click OK, the form reloads the certificate and recalculates absolute uncertainty values
according to the new coverage factor.
Page 117 of 388
GCAS® Desktop Manual Guide rev. 14
Calibration certificate on k = 1 (left) and k = 2 (right). Data is fictional.
9.7
Insert Comment
If you need to put notes or other properties that were not supported by New Calibration Certificate
form, post them in comments.
1.
Open the Comments tab or go to Action menu > Add Comment.
2.
Write your comment on the text box at the lower section of the form, then click Submit.
3.
Make sure the comment is correct (e.g. free from spelling errors) because once inserted into
database, you will not be able to remove the comment.
If you do not see the textbox and the Submit button, i.e. the comment grid fills up the entire form,
your user account may not have action permission to write comments or your user role is Read-only.
Contact your GCAS administrator.
Page 118 of 388
GCAS® Desktop Manual Guide rev. 14
9.8
Send to ISO 6976 Calculator
Although this feature is rarely used, calibration certificates do have mole composition. This means
GCAS can calculate the calorific value and other properties of a calibration gas composition. Users
whose GCAS licence includes GCAS feature ISO 6976 Calculator shall see an additional action menu
Send to ISO 6976 Calculator.
Similar to ISO 6976 Calculation menu on mole composition, this menu sends the mole composition
part of the calibration certificate to ISO 6976 Calculator tool. Then it calculates the calorific value (CV)
and other properties automatically.
Page 119 of 388
GCAS® Desktop Manual Guide rev. 14
10 Data Analysis
Data Analysis is a tool to see trend of GC parameters over time in history.
Note
This module requires GCAS feature Data Analysis to be included in your GCAS licence.
Data Analysis works for one device as it displays trends of various data for one device. The
complement of Data Analysis is called Data Comparison, which for the time being is only implemented
as Mole Composition Comparison. Working at the opposite of Data Analysis, Mole Composition
Comparison displays mole composition trends of one data (gas) for various devices.
10.1
The Data Analysis Form
Select the desired GC device on the device panel, then go to the View menu > Data Analysis. The
form consists of three sections: parameters, chart, and comments.
Parameters section at the top is where you set everything in order to get the chart you want. Chart
section at the bottom graphs the chart. Comments tab is the place to write your comment.
10.2
Parameters, Chart Types, and Components
This chapter explains the contents of the parameter section of Data Analysis form.
Page 120 of 388
GCAS® Desktop Manual Guide rev. 14
10.2.1
Parameters
This is the main switch to select which parameter to be graphed on the chart. Users can graph the
following parameters:
1.
RF - Response factor
2.
RT - Retention time
3.
MC – Mole composition
4.
R2 - Correlation parameter
If you see the MC (mole composition) option is disabled, it means you do not have Live Data Analysis
feature in your GCAS licence.
10.2.2
Chart Types
Chart Types are more specialised options for the selected parameter. Available chart types vary,
depending on the selected parameter.
10.2.2.1 Selected parameter: RF (response factor)
These options show up when the selected parameter is response factor (RF).
1.
RF trend graphs the actual response factor values over time in history.
2.
RF deviation trend graphs the deviation (difference) of RF values against footprints in
percentage. This gives further options which are:
Page 121 of 388
GCAS® Desktop Manual Guide rev. 14
Each latest footprint: Each RF value is compared against its latest footprint.
This footprint only: All RF values are compared against a particular footprint value. The
footprint to set as the comparison base is configurable through Change footprint link.
10.2.2.2 Selected parameter: RT (retention time)
These options show up when the selected parameter is retention time (RT). They are very similar to RF
chart types.
Page 122 of 388
GCAS® Desktop Manual Guide rev. 14
1.
RT trend graphs the actual retention values over time in history. The unit of measurement is
second (s).
2.
RT deviation trend graphs the deviation (difference) of RT values against footprints, also in
seconds (s). This also gives two further options:
Each latest footprint: Each RT value is compared against its latest footprint similar to RF
deviation chart.
This footprint only: All RT values are compared against a particular footprint value. The
footprint to set as the comparison base is configurable through Change footprint link.
10.2.2.3 Selected parameter: R2 (correlation)
The chart will only show the actual value of R2 calculations. This parameter is not compared against
footprint values, but against a low alarm limit. The low alarm limit is configured in the Analysis
Parameter form. If it is not set, the default limit 0.995 is used.
10.2.2.4 Selected parameter: MC (mole composition)
The chart will graph mole composition values of the selected stream. Refer to the user manual of your
GC device to know which stream numbers deliver mole percentage data.
Available stream numbers are determined from data that has been existed in database and also the
mole composition stream definition in Register Mapping form. If you know there is a stream number
Page 123 of 388
GCAS® Desktop Manual Guide rev. 14
that is not on this dropdown list yet, simply type the stream number on the dropdown box manually
then click the
Refresh button or press F5.
You can also display spot sample records and/or calibration gas certificate alongside the regular mole
composition record on the chart. Spot samples are displayed as triangles, calibration certificates are
displayed as bigger triangles, while regular mole composition values appear as ordinary line charts.
Tick the corresponding check box to show or hide these special records.
Apply lag time is currently non-functional. In future version of GCAS Desktop where the device-level
lag time module has been developed, this check box will shift all spot sample dots to the right
according to the amount of calculated lag time. Thus, the triangle is closer to the regular mole
composition line chart or even co-incide. This way you can see if the spot sample dot and the line is
far apart in terms of Y-axis value, it indicates problems within your pressure letdown system.
Users with GCAS feature ISO 10723 included in their licences see an additional dropdown selection
ISO 10723 trend. This dropdown contains three options:
-
Single-point compositions converts any multilevel-calibrated records within the plot range
into single-point compositions before graphing them to the chart. Records already marked as
single-point are plotted as usual.
-
MLC compositions converts any single-point records within the plot range into multilevelcalibrated compositions before graphing them to the chart. Records already marked as
multilevel-calibrated are plotted as usual.
-
Don’t convert ignores the MLC flag bit and plots all records within the plot range as they are.
Use this if you have slow network connection to the database server and you are confident
that this GC device never have mixed MLC records and single-point records. Never select this
option if you are unsure whether the device has mixed MLC flag bit as it will produce invalid
MC trend chart.
Users with both GCAS feature ISO 10723 and Data Comparison included in their licences see a link
Compare both below the ISO 10723 trend dropdown. This link is available if only one gas is selected.
It calls Mole Composition Comparison form, sends the selected gas, date/time range, and stream
number, then instructs Mole Composition Comparison form to compare single-point versus MLC
compositions. If the single-point and MLC curves are overlap or very close to each other, your GC is
more likely in a good condition. If they drift too far, your GC has too much bias and it will increase the
uncertainty value.
10.2.3
Components
Components are selections of available gases to draw on the chart. In most use, usually only one gas is
selected. GCAS Desktop can display multiple gases on one chart as required.
Page 124 of 388
GCAS® Desktop Manual Guide rev. 14
10.2.3.1 Selected parameter: RF or RT
Components for C7-complete devices.
Depending on your GC device type, you would see between 10 to 15 gases. C6-without-neopentane
have ten gases, while C10-complete devices have fifteen.
10.2.3.2 Parameter selected: MC (mole composition)
You should see all gases as in RF or RT, with one additional component at the bottommost of the list:
Unnormalised total. GCAS Desktop always graphs normalised mole composition chart for gas
component — except for, obviously, the unnormalised total.
10.2.3.3 Parameter selected: R2 (correlation)
For R2 parameter, you should see two or three items. Depending on your GC device type, the wording
of these components may vary. These components graphs different R2 values calculated from their RFMW logarithm computation.
Device type
Available components
Daniel C6+ complete or C6+ without
C1-C2-C6
neopentane
C3-C4-C5
C1-C2-C3-C4-C5-C6
Daniel C7+ complete or C7+ without
C1-C2-C7
neopentane
C3-C4-C5-C6
C1-C2-C3-C4-C5-C6-C7
Daniel C9+ complete or C9+ without
C3-C4-C5
neopentane
C6-C7-C8-C9
Daniel C10+ complete or C10+ without
C3-C4-C5-C6
neopentane
C7-C8-C9-C10
Page 125 of 388
GCAS® Desktop Manual Guide rev. 14
ABB C6+ complete or C6+ without neopentane
C3-C4-C5
C4-C5-C6
C3-C4-C5-C6
ABB C7+ complete or C7+ without neopentane
C3-C4-C5-C6
C4-C5-C6-C7
C3-C4-C5-C6-C7
10.3
Date and Time Range (Plot Range)
When you open the Data Analysis form, it tries to load data from the last 30 days. To change this date
and time range, set the desired range using the two date pickers inside the options box. The time uses
24-hour format. Click
Refresh button to reload the chart.
When the chart is refreshed, chart data is cached in computer memory. So if you select or unselect
some components, the requested data is loaded from memory instead of database as long as date
and time range does not change. Everytime you push the refresh button, it also refreshes this cache.
Cache is cleared when the form is closed.
GCAS Desktop counts how many records are to be displayed, and displays this count under the date
picker input fields. Would there be too many records to load, GCAS Desktop alerts you that the loadand-draw process may take a prolonged time. Also, the dots of the line chart may clutter the chart
area thus makes it difficult to interpret. Alert limit is hardcoded to 150 records for RF, RT, and MC; and
100 records for R2.
Page 126 of 388
GCAS® Desktop Manual Guide rev. 14
10.4
Mean and Standard Deviations
On certain parameters, GCAS Desktop can calculate the mean (average) and twice the standard
deviations. The table below describes which parameter has this capability.
Parameter
RF
Mean & 2 std.dev enabled?
Yes
Available options
1. x records from footprint,
2. All records from footprint,
3. What being displayed
RT
Yes
1. x records from footprint,
2. All records from footprint,
3. What being displayed
MC
Yes
1. What being displayed
R2
No
None
Note
GCAS Desktop can only calculate mean and standard deviations if only one component is selected.
Mean and standard deviations cannot be computed for two or more active components on the chart.
Important
If you are working offline, computed mean and standard deviations may not be accurate because it
depends on how much data available on your temporary database. GCAS Desktop displays offline
warning icon to alert this potential source of inaccuracy. Try to stay in online mode as much as
possible while working with Data Analysis.
Page 127 of 388
GCAS® Desktop Manual Guide rev. 14
To show or hide the mean and twice standard deviations, use the checkbox Display mean and ± 2 ×
standard deviations.
There are three options for mean and standard deviation calculation.
a)
x records from footprint (default x = 25 records)
Mean and twice standard deviations are calculated from first x records (default is 25) after each
footprint.
Special case if you are drawing RF or RT deviation trend and you have chosen a particular
footprint as a comparison base, this option will calculate the mean and twice the standard
deviations from x records after that footprint only.
Page 128 of 388
GCAS® Desktop Manual Guide rev. 14
b) All records from footprint
Mean and twice standard deviations are calculated from all records between footprints.
Special case if you are drawing RF or RT deviation trend and you have chosen a particular
footprint as a comparison base, this option will calculate the mean and twice the standard
deviations from all records between the selected footprint and one next footprint thereafter.
c) What being displayed
The mean and twice standard deviations are simply calculated from all the data points which
have been drawn on the chart for your choice of date range. Unlike the other two options which
require database reload through the Refresh button, this option uses the data already there on
the chart area.
In addition, GCAS Desktop provides simple statistics when mean and standard deviation lines are on.
Click View summary link below the three radio buttons, then the Data Analysis form generates a
statistics summary for you.
Page 129 of 388
GCAS® Desktop Manual Guide rev. 14
10.5
Zoom Mode and Selection Mode
This switch controls whether the chart is in zoom mode or selection mode. Zoom mode lets you zoom
in to a particular area of the chart in case there are too many data points cramped on small area.
Selection mode allows you to drag a rectangle to select a pack of data points and manipulate them
using the available context menus.
In zoom mode, drag a rectangle on the region you would like to zoom.
Page 130 of 388
GCAS® Desktop Manual Guide rev. 14
Use the scroll bars to pan the zoomed chart. To zoom in further, drag another rectangle on the area
you would like to enlarge more.
Click on the circled minus button Θ on both scroll bars to zoom out one step. To zoom all-out, simply
press the Home button on your keyboard. Otherwise, right-click on the chart and select Zoom All Out
submenu.
In selection mode, drag a rectangle to select an area on the chart. Right click the selection to open
context menus and you see several menus available in selection mode. Chapter 10.9 will explain each
function of these menus. To cancel selection, right click the chart and choose
Area.
Page 131 of 388
Clear Selection
GCAS® Desktop Manual Guide rev. 14
10.6
Change Axes Scale
When zoom is not enough, you can enforce a custom range for both X-axis and Y-axis of the chart. To
do this, right click on the chart and select either Set X-axis Scale or Set Y-axis Scale.
For Y-axis, specify the desired numeric range. The input fields accept decimal values. For example, take
the chart screenshot above and let us enter this range:
Chart is then drawn within the new, confined range similar to the screenshot below. Notice that the
chart line is truncated because there are data points having values outside of this range.
Page 132 of 388
GCAS® Desktop Manual Guide rev. 14
To revert back to the automatic scale, right click the chart and select Reset Y-axis scale.
For X-axis, specify the desired date and time interval.
Similarly, to undo the scale you would right click on the chart and select Reset X-axis scale.
Depending on the custom date interval, the date mark on the X-axis may include the time. For more
detailed interval such as from 00:00 to 08:00 of the same day, the X-axis would display the date and
the time (hh:mm:ss) as well. When you reset X-axis scale but you notice the date/time marks on X-axis
do not reset, right click on the chart and choose Reset X-axis Tick Mark Format.
10.7
Save or Copy the Chart
To save the chart as image file, right click on the chart and select Save Chart as Picture.
Page 133 of 388
GCAS® Desktop Manual Guide rev. 14
To copy the chart, right click and select Copy Chart Image. Then you may paste the image into
Microsoft Paint, Microsoft Office, or any software that accepts bitmap image/picture data on
clipboard.
Tips before saving or copying
Enlarge the chart by maximising the Data Analysis form, collapsing the device panel, and expanding
the chart area through the
Expand button at the top of Data Analysis form.
To make the line chart black, use the toggle colour/black button
on the options box. This button
is available if only one component is ticked. Black line appears better on monochrome printers if the
saved file or copied image is about to be printed.
If you do not want the gridlines or chart legend to be included in the image file, right click on the
chart and uncheck Show Gridlines or Show Legend or both.
10.8
Colourblind Assistance
To aid users with colour blindness (protanopia and deuteranopia), GCAS Desktop provides an
alternative colour scheme for the chart. Use the
Colourblind assist button on the options box.
Page 134 of 388
GCAS® Desktop Manual Guide rev. 14
Normal colour scheme, colourblind assistance turned off.
Alternative colour scheme, colourblind assistance turned on.
Similar colours are distinguished by dash or dotted style.
Page 135 of 388
GCAS® Desktop Manual Guide rev. 14
10.9
Selection Mode Menus
These menus are available if Data Analysis chart is in selection mode and there is a selection rectangle
on the chart.
Menu
Which
Licence
parameter?
requirement
Zoom In Here
Any
-
Zooms in to the selection area.
Generate Summary
Any
-
Generates statistical summary for the
Here
Function
selected area (in contrast to View
summary link which generates summary
for the entire X-axis)
Frame This Selection
Any
-
Literally puts a rectangular frame around
the selection, for presentation purpose.
Page 136 of 388
GCAS® Desktop Manual Guide rev. 14
Remove Frames
Any
-
Deletes all frames created through Frame
This Selection menu.
Set These Records as
Any
-
Sets all records within the X-axis range of
Inactive
the selection area as inactive. If you are on
R2 trend chart, this sets the underlying
footprint/calibration records as inactive.
Mark These Records
RF, MC
ISO 10723
as Single-Point
Sets the MLC flag bit of all records within
the X-axis range of the selection area as
single-point RF or MC.
Mark These Records
RF, MC
ISO 10723
as MLC
Sets the MLC flag bit of all records within
the X-axis range of the selection area as
multilevel-calibrated RF or MC.
Send to ISO 6976
MC
Calculator (Averaged)
ISO 6976
Sends the averaged mole composition
Calculator
value of each gas of all records contained
inside the selection area to ISO 6976
Calculator.
The ISO 6976 output values may be
different from the next menu (sending to
ISO 6976 Trend and then activating the
mean and standard deviation lines).
Send to ISO 6976
MC
Trend
ISO 6976
Loads ISO 6976 Trend form and instructs it
Trend
to plot the ISO 6976 values for mole
composition records contained inside the
selection area.
Send to Correlation
RF trend;
-
Sends the averaged RF value of any gases
Calculator (Selection,
not RF error
that intersects with the selection area, to
Averaged)
trend
Correlation Calculator.
For example, if your selection area contains
methane and ethane line, only methane
and ethane are sent to Correlation
Calculator. Their RF values inside the
selection area are averaged and then sent.
Send to Correlation
RF trend;
-
Sends the averaged RF value of all gases of
Calculator (All Gases,
not RF error
all records contained inside the selection
Averaged)
trend
area to Correlation Calculator.
Page 137 of 388
GCAS® Desktop Manual Guide rev. 14
Send to Mole
MC;
ISO 10723
Sends mole composition values of the
Composition
requires only
and Data
selected gas of all records contained inside
Comparison
one gas
Comparison
the selection area to Mole Composition
selected
Comparison; then instructs the form to
compare the single-point versus MLC
composition of that gas.
10.10 Other Visual Cues
Enlarge chart area by hiding the parameters panel through the
parameters panel again, click
Collapse.
Hover your mouse cursor over a data point to see its value.
Page 138 of 388
Expand button. To show the
GCAS® Desktop Manual Guide rev. 14
Alternatively, use the
Show values button (or right click on the chart and choose Show Values).
We don’t recommend to show values on chart with many data points as the number labels may flood
the chart area — unless you have zoomed it in.
Page 139 of 388
GCAS® Desktop Manual Guide rev. 14
Crosshair cursors are the dotted lines appearing on the chart when you left-click on it or as a remnant
of zoom operation. These may act as a ruler or guide. To remove them, click
Hide crosshair cursor
button (or right-click on the chart then select Hide Crosshair Cursors).
To use black background, right click on the chart and click Toggle Light/Dark Background menu.
Use the same menu to revert back to white. The black background is permanent when you save the
chart as image file or copy chart image to clipboard.
10.11 Insert Comment
To view or write comment, open the Comments tab.
Page 140 of 388
GCAS® Desktop Manual Guide rev. 14
Write your comment and set the appropriate date of topic, then click Submit. Your comment will have
a yellow background to distinguish it from comments by other users. Date of topic is an additional
information of which calibration data/footprint/mole composition record you are writing your
comment for, thus other users know the correct data point to refer to.
Make sure that the comment is correct e.g. free from spelling errors, because once submitted you
would not be able to remove your comment. This is a part of audit trail requirements.
The main
Refresh button does also reload comments.
If you do not see the text box to write your comment, i.e. you only see the comment grid view, your
GCAS user account doesn't have the action permission to write comment in Data Analysis. Contact
your GCAS administrator.
Page 141 of 388
GCAS® Desktop Manual Guide rev. 14
11 Uncertainty Calculation
Uncertainty Calculation is a module to calculate the uncertainties of your GC device. This is related to
condition-based maintenance which allows early detection of GC failures. Method to calculate GC
uncertainties is described in the journal article
Sutan, A. and Daniel, P., "Gas Chromatography – Conditional Based Monitoring and Live Uncertainty
Calculation", North Sea Flow Measurement Workshop (2012)
and
Sutan, A and Daniel, P., "Gas Chromatography Maintenance using Uncertainty-Based CBM", The
Americas Flow Measurement Conference (2013).
Note
This module requires GCAS feature Uncertainty Calculation to be included in your GCAS licence.
Uncertainty calculation takes four input groups:
1.
Uncertainty from the calibration gas — a calibration gas certificate is mandatory;
2.
Uncertainty from GC repeatability and linearity,
3.
Uncertainty from GC reproducibility,
4.
ISO 6976:1995 inputs.
And it produces two output groups:
1.
Uncertainties of ISO 6976:1995 outputs,
2.
Uncertainties of GC for each gas component.
11.1
The Uncertainty Calculator Form
To calculate uncertainties of a particular GC device, select the device on your device panel or recent
device panel. Then, go to the View menu > Uncertainty Calculation.
The form behaves like a wizard although it is not. It has a collection of pages categorised into three
groups: inputs, calculation, and outputs. To navigate between pages, use the two buttons at the
bottom-right corner Next page or Previous page; or you can also jump to the desired page straight
away through the navigation tree on the left side.
Page 142 of 388
GCAS® Desktop Manual Guide rev. 14
Uncertainty Calculator form and its parts.
The form contains 23 pages as laid out in the navigation tree. Each terminal item links to its page
within the form. Click on any item below to read more about its part.
Inputs
o
Uncertainties to include
o
Uncertainty from the calibration gas
o
Uncertainty from GC repeatability and linearity
Repeatability
Linearity
Mole percentage range
o
Uncertainty from GC reproducibility
o
ISO 6976 inputs
Calculations (normally collapsed)
o
Uncertainty of calibration gas
o
WRM RF and standard deviation
o
Uncertainty of repeatability
o
Footprint and calibration data
o
Uncertainty of reproducibility
o
Standard relative uncertainty
o
Compressibility factor
o
ISO 6976 calculation
o
Sensitivity analysis for Ucalibration gas and Ureproducibility
Page 143 of 388
GCAS® Desktop Manual Guide rev. 14
o
Sensitivity analysis for Urepeatability
Outputs
o
Summary page
o
Uncertainty of CV (calorific value)
o
Uncertainty of MW composition
o
Uncertainty of Wobbe index
o
Uncertainty of relative density/specific gravity
o
Uncertainty of standard density
The navigation button Next page and Previous page change pages in sequential order. They may
skip some pages depending on the selection you made on the previous page.
At anytime you leave input pages, Uncertainty Calculator form should perform all calculations. Once
you are at intermediary calculation pages or output pages and you notice a mistake, you can always
go back to the input pages either by clicking Previous page button successively until the form arrives
at the desired page, or jump straight away using the navigation tree. After you make some changes in
the inputs and go forward to later page, the form shall perform automatic recalculation thus new
output values will update accordingly. If you notice the form does not recalculate, click Recalculate
button or press F5 key on your keyboard to force a recalculation.
11.2
Calculation Steps
The form calculates your GC uncertainty is using the sequence below.
1.
Calculate Ucal gas if selected.
2.
Calculate Urepeatability if selected.
3.
Calculate Ureproducibility if selected.
4.
Calculate UGC at k = 1 which is the standard relative uncertainty. (k is coverage factor.)
5.
Calculate Zmix (compressibility factor of mixture) and Zair based on the given base temperature
and combustion temperature.
6.
Perform all ISO 6976 calculations.
7.
Perform sensitivity analysis on ISO 6976 outputs.
8.
Calculate UCV, UMW, UWobbe, USG, and Uρs — all uncertainties of ISO 6976 outputs.
11.3
Input Pages
Input pages collect all required information before the form performs a calculation. Visit subchapters
below to get help about a specific page.
11.3.1
Uncertainties to Include
You can select which uncertainties to include in the calculation of standard relative uncertainty (UGC).
Page 144 of 388
GCAS® Desktop Manual Guide rev. 14
2
2
2
UGC = √ (Ucal gas ) + (Urepeatability ) + (Ureproducibility )
For example, if you decide not to include uncertainty from the calibration gas, U cal gas is replaced by
zero and the formula changes to
2
2
UGC = √ (Urepeatability ) + (Ureproducibility )
You must select at least one uncertainty component in order to proceed to the next page. If you don't,
UGC will be zero and all subsequent calculations afterwards will be meaningless.
Also in this page there is a check box to control whether to include ISO 6976 standard measurement
uncertainty of 0.05% at the end of calculation. In the standard, ISO 6976 uncertainty is 0.1% at k = 2.
Calculation of combined standard uncertainty uses k = 1, hence the ISO 6976 measurement
uncertainty becomes 0.05%. Every result of ISO 6976 calculation shall carry this 0.05% uncertainty. By
default this check box is ticked.
11.3.2
Uncertainty from the Calibration Gas
Select a calibration certificate in GCAS database. By default, GCAS Desktop loads the last installed
certificate. This certificate is used later on when calculating Ucal gas, Ureproducibility, and ISO 6976
calculations.
You can see all installed calibration certificates through Calibration Gas Certificate form. That form
also provides a way to submit a new certificate if the desired certificate has not been entered to the
database.
11.3.3
Uncertainty from GC Repeatability and Linearity
To calculate Urepeatability, GCAS Desktop requires three sets of information: repeatability coefficients,
response concentration coefficients, and mole percentage range.
11.3.3.1 GC Repeatability
2
𝑠𝑖 = 𝑎 + 𝑏𝑥𝑖∗ + 𝑐𝑥𝑖∗ + 𝑑𝑥𝑖∗
3
In this formula, si is the standard deviation of unnormalised component i. The letter i is a simplification
of enumeration from methane (e.g. from i = 0) to the highest carbon count. Four coefficients a, b, c,
and d are called repeatability coefficients or parameters of precision factors. Detailed explanation of
this formula is available on journal article Sutan, A. and Daniel, P., "Gas Chromatography – Conditional
Based Monitoring and Live Uncertainty Calculation", North Sea Flow Measurement Workshop (2012).
You need to enter these repeatability coefficients on the provided data grid. Double click the cell or
press F2 to invoke edit mode. Alternatively, you can paste from Microsoft Excel or other spreadsheet
Page 145 of 388
GCAS® Desktop Manual Guide rev. 14
processing software as long as there are 4 (four) columns and equal number of rows. Click the Paste
link above the grid to do so. The next link Reset all will reset all numbers back to zero.
Because these coefficients rarely change (about once a year), we suggest you to store these
coefficients in database and recall them the next time you open Uncertainty Calculator form. To store
a new coefficient set, click New set. This link opens a blank Uncertainty Coefficients form and you
type (or paste) the coefficient numbers there. Visit chapter 12 to get detailed explanation of
Uncertainty Coefficients form.
If GCAS Desktop detects there is at least one coefficient set in database, GCAS Desktop loads the
latest coefficient set automatically for you. However if this is not the coefficient set you want, you can
change which coefficient set in the database to load. Click Choose existing coefficient set, then
GCAS Desktop displays the familiar Select a coefficient set dialogue.
Page 146 of 388
GCAS® Desktop Manual Guide rev. 14
Hover your mouse over the list item, on its date column, to reveal a tooltip about the description of
the coefficient set. (Due to .NET Framework limitation, tooltip can only appear at the first column.)
Click OK or double click the list item to load the coefficient set.
You can edit the coefficients after you load them from database too. Just go to the cell, double click or
hit F2 to invoke edit mode, and enter the correct number. However, this change is only temporary as it
is only used in current session of uncertainty calculation. If you need a permanent edit, you have to use
Uncertainty Coefficients form then either create a new coefficient set or edit the existing one. Click
Edit this set to open Uncertainty Coefficients form and invoke its edit mode. This link is only available
if you haven't changed any numbers since the coefficient set is loaded from database. To undo all
changes and revert back to the original coefficients from database, click Reload set.
11.3.3.2 GC Linearity
Formula displayed on this wizard page is very similar to GC repeatability:
2
𝑠𝑖 = 𝑎 + 𝑏𝑥𝑖∗ + 𝑐𝑥𝑖∗ + 𝑑𝑥𝑖∗
3
However the s here is different from the previous s. This formula is used to calculate the standard
deviation of mixture gas and sample gas. The coefficients a, b, c, and d here are called response
concentration coefficients or parameters of true calibration functions.
Similarly, you need to enter these response concentration coefficients on the provided data grid.
Double click the cell or press F2 to enter edit mode. Alternatively, you can paste from Microsoft Excel
Page 147 of 388
GCAS® Desktop Manual Guide rev. 14
or other spreadsheet processing software as long as there are 4 (four) columns and equal number of
rows.
You can also load a coefficient set stored in database. If you already loaded a set for GC repeatability,
it also loads for GC linearity. Go to page 146 to read more about loading a coefficient set from
database.
Page 148 of 388
GCAS® Desktop Manual Guide rev. 14
11.3.3.3 Mole Percentage Range
Choose how the mole percentage plus-minus range be calculated. This plus-minus range will affect
the final Urepeatability value.
Assume universal range: Every gas (component) uses the same range. This is the most
inaccurate option but provides a fail-safe estimate if you do not have sufficient data in Mole
Composition module.
Set individual range: Each gas (component) has its own plus-minus range and is
independent from one another. This option has better accuracy compared to the universal
range.
Manual range: You will type the minimum mole percentage and maximum mole percentage
directly at WRM RF page later. Accuracy depends on these values. Use this option if you want
to test some unexpected numbers.
Use ±2 standard deviation of mole composition: The plus-minus range is taken from this
standard deviation:
of mole composition records within the given period. This option provides the best accuracy.
Page 149 of 388
GCAS® Desktop Manual Guide rev. 14
Balanced gas option keeps your mole percentage low limit and high limit at 100%. This option is
turned on by default and you can designate which one as the balanced gas. Typically, methane is the
balanced gas because it is the largest component in the mixture and outnumbers other gases many
times. To turn off this behaviour, untick Balanced gas check box.
Two tables below illustrate how the calculation will go if balanced gas option is turned off (top) and
turned on (bottom). In this example, balanced gas is methane and a universal plus-minus range 15% is
enforced.
Component
Mole percentages
Mole percentages
Mole percentages
as in certificate
− 15%
+ 15%
Methane
89.540070
76.1091
102.9711
Nitrogen
0.064110
0.0545
0.0737
CO2
0.131230
0.1115
0.1509
Ethane
0.061000
0.0519
0.0702
Propane
0.055400
0.0471
0.0637
i-Butane
0.049180
0.0418
0.0566
n-Butane
0.056100
0.0477
0.0645
Neopentane
0.065100
0.0553
0.0749
i-Pentane
1.665080
1.4153
1.9148
n-Pentane
2.202900
1.8725
2.5333
Hexane
5.548780
4.7165
6.3811
99.43895
84.5232
114.3548
Total
Balanced gas option is turned off.
Component
Mole percentages
Mole percentages
Mole percentages
as in certificate
− 15%
+ 15%
Methane*
89.540070
91.5860
88.6163
Nitrogen
0.064110
0.0545
0.0737
CO2
0.131230
0.1115
0.1509
Ethane
0.061000
0.0519
0.0702
Propane
0.055400
0.0470
0.0637
i-Butane
0.049180
0.0418
0.0566
n-Butane
0.056100
0.0477
0.0645
Neopentane
0.065100
0.0553
0.0749
i-Pentane
1.665080
1.4153
1.9148
n-Pentane
2.202900
1.8725
2.5333
Hexane
5.548780
4.7165
6.3811
99.43895
100.0000
100.0000
Total
Balanced gas option is turned on for methane. While other gases follow ±15% range, methane is
calculated by 100 – sum of the others.
However if you choose another gas which has relatively small percentage as the balanced gas and it
causes plus-minus range to fall onto negative number, GCAS Desktop replaces the negative
Page 150 of 388
GCAS® Desktop Manual Guide rev. 14
percentage with zero and thus their summation is not guaranteed to be 100%. Always choose the
component with largest percentage as the balanced gas.
11.3.4
Uncertainty from GC Reproducibility
Select a footprint as a reference. You can see all footprints through Footprint form. If you choose a
footprint that happens before the certificate installation date, GCAS Desktop displays a
warning
icon.
Next, decide how many calibration data to include in the calculation. GCAS Desktop offers three
choices:
Until GCAS bumps into next footprint: The selected footprint itself and all calibration data
up to one last calibration before next footprint are included in the calculation of U reproducibility.
Until today: The selected footprint itself and all calibration data including subsequent
footprints and all their calibration data afterwards, all the way to this very moment (i.e. current
computer time) are included in the calculation of Ureproducibility.
Custom range: You can choose from which calibration record exactly to which calibration
record that are included in the calculation of Ureproducibility. A
11.3.5
ISO 6976 Inputs
To be precise, ISO 6976 calculation requires four inputs:
Page 151 of 388
star indicates a footprint.
GCAS® Desktop Manual Guide rev. 14
1.
Mole composition to use — here GCAS Desktop uses the selected calibration certificate as the
mole composition,
2.
Base pressure. The default is 1 atmosphere (101325 Pa) absolute,
3.
Base temperature, and
4.
Combustion temperature.
Many constants depends on the pair of combustion temperature and base temperature. The set of
constants for 0°C is different from the set of constants for 15°C. In order to keep things simple, GCAS
Desktop supports six pairs of combustion-base temperature:
0°C / 0°C
15°C / 0°C (combustion temperature = 15°C, base temperature = 0°C)
25°C / 0°C
15°C / 15°C
20°C / 20°C
25°C / 20°C
Split numbers are a set of numbers to indicate the composition of components higher than the
device actually supports. For example, a C6+ device reads methane, ethane, propane, butane, pentane,
and hexane (denoted "C6+"). The plus sign at "C6+" here indicates that higher C numbers such as C7
and C8 are merged into C6 because the device cannot read them. Split numbers are obtained through
lab testing and are expressed using the format n/n[/n[/n]…] where n is a number. Sum of all numbers
should be 100. For example, a C6+ device has split numbers on hexane as 60/30/10. This means mole
percentage of hexane is actually 60% of the current hexane, heptane is 30% of hexane, and octane is
10% of hexane. Split numbers increase the accuracy of ISO 6976 outputs.
If you have these split numbers, enter them at the designated input text box. For C6+ devices you can
enter up to 5 splits—which are the division among C6/C7/C8/C9/C10. C7+ devices accept maximum 4
splits, and C9+ devices accept maximum two splits. C10+ devices cannot accept split numbers
because current version of GCAS Desktop supports up to C10 only.
The split numbers being entered should add up to 100. If they don't, GCAS Desktop will normalise
them before redistributing the certificate mole percentage. For example, 50/30 normalises to 62.5/37.5
so their sum becomes 100.
If you don't have split numbers, leave it blank. GCAS Desktop will treat hexane or heptane or whatever
the highest carbon count as a single entity throughout the calculation.
11.4
Calculation Pages
When you finished with ISO 6976 inputs, clicking Next page will take you directly to the output
summary page and skipping the calculation pages. They were skipped because most users are only
interested with the results. If you want to visit calculation pages, please check Show intermediary
calculations before clicking Next page. Alternatively, expand the "CALCULATIONS" node at the
navigation tree then pick an item to navigate.
Page 152 of 388
GCAS® Desktop Manual Guide rev. 14
Calculation pages consist of ten pages:
1.
Uncertainty of calibration gas
This is the result of Ucal gas calculation at k = 2.
To obtain Ucal gas at k = 1, divide these values by 2.
2.
WRM RF and standard deviation
This is the required calculation before we get Urepeatability. Here you see the mole percentage
low limit and high limit according to the mole percentage range defined during input page.
Also if you selected manual mole percentage range, you need to enter these low and high
limit in this page. Head to chapter 11.4.1 to get help on that topic.
3.
Uncertainty of repeatability
This is the result of Urepeatability calculation at k = 1.
4.
Footprint and calibration data
The form displays the response factor of the selected footprint and also average of all
calibration data included in this calculation. To see where the average calculation of the
calibration data came from, click on numbers that look like links. That will open another form
to show the data feed. If you notice weird or unusual numbers at the average columns, open
the detailed view to see if there are offending calibration records that should've been set as
inactive.
5.
Uncertainty of reproducibility
This is the result of Ureproducibility calculation at k = 1.
6.
Standard relative uncertainty
This is the result of UGC at k = 1. To this point, we are half way finished with the calculation.
7.
Compressibility factor
It shows the calculation of Zmix and Zair based on the base pressure and temperature specified
at ISO 6976 input page.
8.
ISO 6976 calculation
This page is probably worth visiting if you are interested with the calorific value, relative
density, or some other output of ISO 6976 calculation.
9.
Sensitivity analysis (calibration gas & GC reproducibility)
This page displays the relative sensitivity of all ISO 6976 outputs for Ucalibration gas and
Ureproducibility.
10. Sensitivity analysis (GC repeatability)
This page displays the relative sensitivity of all ISO 6976 outputs for U repeatability.
11.4.1
Manual Mole Percentage Range
If you selected manual mole percentage range for the calculation of Urepeatability, you need to enter
mole percentage range on the WRM RF and standard deviation page. The column turns white to
indicate that it is editable. Initial numbers on these columns are copied from your calibration gas
certificate. Enter a lower value for mole percentage low limit and higher value for the high limit. On all
options other than manual range, these columns appears yellow and is read-only.
Page 153 of 388
GCAS® Desktop Manual Guide rev. 14
Double click the cell or press F2 to enter edit mode. Type the minimum value or maximum value, then
press Enter to commit. After you press Enter, you should see all columns on current row to the
right side is recalculated. Urepeatability is recalculated, thus UGC and subsequent calculations also change.
Note
Manual mole percentage range is not balanced. The sum of low limit may be less than 100, and the
sum of high limit can be more than 100.
11.4.2
Regarding Sensitivity Analysis
Starting from GCAS Desktop version 1.3.1.0, GCAS Desktop calculates two sensitivity sets. One for U cal
gas
and Ureproducibility, and the other for Urepeatability. Sensitivity of calibration gas and GC reproducibility is
based on the mole percentages in your calibration certificate. Sensitivity of GC repeatability is based
on the average between mole percentage lower bound and upper bound range.
If you chose universal mole percentage range or individual mole percentage range during that input
page, the sensitivity of GC repeatability becomes the same as sensitivity of calibration gas and GC
reproducibility. The reason is mole range for GC repeatability is also taken from the calibration
certificate.
But if you selected manual mole percentage range or used ±2 standard deviations of mole
composition records, the lower and upper bound of mole percentage range do not correspond to the
calibration certificate anymore. Thus, GCAS Desktop calculates the correct sensitivity values and use
these values for Urepeatability.
Page 154 of 388
GCAS® Desktop Manual Guide rev. 14
11.5
Output Pages
Output pages display calculation results. The primary interests here are uncertainties of ISO 6976
outputs. There is one summary page and five detailed pages, one detail page for every uncertainty
result.
11.5.1
Summary Page
Summary page displays five uncertainties of ISO 6976 outputs and also expanded relative uncertainty
(UGC at k = 2). You can copy the report to clipboard, save it to a text file, or print it.
11.5.2
Detailed Pages
There are five detail output pages, which are uncertainty for CV, uncertainty for MW composition,
uncertainty for Wobbe index, uncertainty for relative density (specific gravity), and uncertainty of
standard density. These pages share the same layout and same logic for five ISO 6976 outputs.
Page 155 of 388
GCAS® Desktop Manual Guide rev. 14
Column names starting with U are uncertainties. U(repro) for example, is the uncertainty of GC
reproducibility at k = 1. Column names starting with S are sensitivities. As already explained in chapter
11.4.2, sensitivity for GC repeatability becomes identical to sensitivity of calibration gas and GC
reproducibility if the mole percentage range is set to universal or individual mode.
What may be the interest here are the cells coloured in green. For example, let's use the screenshot
above. The screenshot tells us uncertainty of calorific value, but the layout applies to other detail
pages as well.
The cell at bottom-right corner rendered in bold font is the CV absolute uncertainty, or UCV. It has a
unit megajoules per cubic metres (MJ/m3). If you want to see how much the CV itself is, visit the ISO
6976 calculation page. Note that not all ISO 6976 outputs have units—look for the unit at the title
label. Relative density and Wobbe index do not have unit.
Above the absolute uncertainty is the combined expanded uncertainty. This is UCV expressed in
percentage, not in MJ/m3. The percentage is measured against the CV (again, in the ISO 6976
calculation page). Expanded uncertainty implies k = 2. And there is also combined standard
uncertainty which indicates k = 1.
Standard uncertainty is calculated using this formula:
𝑆𝑡𝑎𝑛𝑑𝑎𝑟𝑑 𝑢𝑛𝑐𝑒𝑟𝑡𝑎𝑖𝑛𝑡𝑦
2
2
= √(𝑈𝑐𝑎𝑙 𝑔𝑎𝑠 × 𝑆𝑐𝑎𝑙 𝑔𝑎𝑠 ) + (𝑈𝑟𝑒𝑝𝑒𝑎𝑡𝑎𝑏𝑖𝑙𝑖𝑡𝑦 × 𝑆𝑟𝑒𝑝𝑒𝑎𝑡𝑎𝑏𝑖𝑙𝑖𝑡𝑦 ) + (𝑈𝑟𝑒𝑝𝑟𝑜𝑑𝑢𝑐𝑖𝑏𝑖𝑙𝑖𝑡𝑦 × 𝑆𝑟𝑒𝑝𝑟𝑜𝑑𝑢𝑐𝑖𝑏𝑖𝑙𝑖𝑡𝑦 )
2
where U and S are uncertainty and sensitivity respectively, given that all uncertainties are included. If
you opt out the Ucal gas for instance, the column U(cal gas) will be overlaid with a diagonal strokes
Page 156 of 388
GCAS® Desktop Manual Guide rev. 14
indicating the values are disregarded. Ucal gas is treated as zero, so the formula above only contains
Urepeatability and Ureproducibility.
The Uncertainty Calculator form when Ucal gas is excluded. Notice the CV absolute uncertainty is different
from the previous screenshot (0.044011 versus 0.045389 MJ/m 3).
There is a precision control at the top right region of these pages. This slider/trackbar controls how
many decimal digits to display on the grid. By default, GCAS Desktop displays six digits after the
decimal point.
Page 157 of 388
GCAS® Desktop Manual Guide rev. 14
12 Uncertainty Coefficients
Uncertainty Coefficients (capitalised C) is a tool to store uncertainty coefficients (repeatability
coefficients and response concentration coefficients) in GCAS database so that you don’t have to reenter the same set of coefficients over and over again as they rarely change.
Note
This module requires GCAS feature either Uncertainty Calculation or Uncertainty Trend to be included
in your licence.
As seen at chapter 11.3.3, the coefficient input page on Uncertainty Calculator form has several links
related to Uncertainty Coefficients. This chapter explains about Uncertainty Coefficients form which is
the place to enter the uncertainty coefficient set.
The term coefficient set refers to collection of uncertainty coefficients (a, b, c, d), two packages of them
(repeatability and response concentration), of all gases. Every gas has their own coefficients and these
coefficients are bundled together into one coefficient set record in GCAS database.
12.1
The Uncertainty Coefficients Form
Uncertainty Coefficients form is accessible from the View menu > Uncertainty Coefficients. But
before that, you need to select the correct GC device from the device panel or recent device panel.
Page 158 of 388
GCAS® Desktop Manual Guide rev. 14
Page 159 of 388
GCAS® Desktop Manual Guide rev. 14
Uncertainty Coefficients form has two tabs, one for repeatability coefficients and the other for
response concentration coefficients. Repeatability coefficients are used to calculate standard deviation
of GC repeatability, and response concentration coefficients are used to calculate standard deviation
of GC linearity. At the bottom there is a text box to display additional note or description about the
coefficient set.
Each coefficient set consists of four coefficients, namely a, b, c, and d on both repeatability and
response concentration. These are the coefficients of this formula:
2
𝑠𝑖 = 𝑎 + 𝑏𝑥𝑖∗ + 𝑐𝑥𝑖∗ + 𝑑𝑥𝑖∗
3
Where s is the standard deviation of one gas/component used in the part of calculation, and xi is mole
fraction of this component.
12.2
View Previous Coefficient Sets
To view other uncertainty coefficient sets, click
Browse another set. Select a different coefficient
set, then click OK or double click the list item.
Page 160 of 388
GCAS® Desktop Manual Guide rev. 14
“Select a coefficient set” dialogue (Windows 10 doesn’t render form border)
Click
12.3
Load latest set to return to the most up-to-date uncertainty coefficient set.
Edit Mode
In order to edit the coefficients or the description, you need to put Uncertainty Coefficients form in
edit mode. Open the Action menu and select Edit Mode. You know the form is on edit mode when
you see
pencil icon, some labels are coloured orange, and there is a Save button at the top region
of the form.
Page 161 of 388
GCAS® Desktop Manual Guide rev. 14
The Uncertainty Coefficients form in edit mode.
During edit mode, you can edit the numbers in both grids (repeatability coefficient grid and response
concentration coefficient grid). Date of test field at the top and Description text box at the bottom of
the form also become editable.
Note
Edit mode is mainly intended for editing the description or correcting minor mistakes. If there are too
many coefficients to edit, we suggest you to create a new set and set this record to inactive instead.
Uncertainty coefficients do not have comment feature. Put short comments in the description text box
if you like.
You can paste the coefficient numbers from Microsoft Excel or other spreadsheet editing software, as
long as there are 4 columns and equal number of rows. Click Paste link above the grid to paste the
numbers. The Reset link resets all numbers in the grid back to zero. Both Repeatability Coefficients tab
and Response Concentration Coefficients tab have their own Paste and Reset command link.
When you finished editing the numbers and the description, click Save button or go to Action menu >
Save Changes to commit the change. The form exits its edit mode and becomes read-only again.
Page 162 of 388
GCAS® Desktop Manual Guide rev. 14
Otherwise to cancel editing and discard all of your changes, open Action menu and select Edit Mode
again to remove its tick mark. This will exit edit mode and reload the coefficient set from the database.
12.4
Create New Coefficient Set
Creating a new set instead of editing an existing set over and over again provides some advantages,
such as
-
You have a historical record of coefficient sets. When the annual multilevel calibration is
conducted, it generates a new set and this should be entered as a new set too.
-
You can test several sets with minor differences in the Uncertainty Calculator form. Make sure
to write the correct description for the uncertainty set in order to avoid confusion when
selecting the coefficient record in Uncertainty Calculator.
From an open Uncertainty Coefficients form, open the Action menu and select New Coefficient Set.
This menu creates a blank coefficient set (all zeroes) with the timestamp set to current computer time.
Page 163 of 388
GCAS® Desktop Manual Guide rev. 14
Begin entering the coefficient numbers one by one. Be watchful for potential human error.
Alternatively, you can paste the coefficients from Microsoft Excel or other spreadsheet editing
software as long as there are 4 columns and equal number of rows. Click Paste to do so.
Enter both coefficient sets. Switch tab to move from repeatability coefficients to response
concentration coefficients or vice versa. If you forget to enter coefficients for the other tab, GCAS
Desktop will alert you if one tab has all zeroes upon save.
Don’t forget to set the date of test. This is the date information of when the multilevel calibration
was conducted, not the date of when these coefficient sets was entered.
Write the description. It is a good practice to provide a description about this coefficient set.
When you are finished, click Save button or go to the Action menu > Save Changes to save these
coefficients into database. Otherwise to cancel all of these, go to the Action menu > Edit Mode to
remove its tick mark. The form will revert to the last record viewed.
12.5
Change Record Status
Like other types of record in GCAS database, uncertainty coefficient set has a status bit indicating
whether the record is active or inactive.
Page 164 of 388
GCAS® Desktop Manual Guide rev. 14
To change status, open the Action menu and select Set Status. This menu brings the Set Status
dialogue where you can flip the status bit from active to inactive or vice versa.
Click OK and GCAS Desktop instructs the Uncertainty Coefficients form to reload the set with the new
status.
We believe it is a good practice to provide a short note of why the set was made inactive or active. To
write this note, invoke edit mode from the Action menu, write the note on the description box, and
finally click Save.
Page 165 of 388
GCAS® Desktop Manual Guide rev. 14
13 Uncertainty Trend
Uncertainty Trend is a module to graph uncertainties of a GC device over time. It is equivalent to
running many individual uncertainty calculations, with the same configuration, for an increasing range
of calibration data, and finally plotting result numbers on a graph.
The chart has a threshold line. When uncertainty line crosses the threshold line, it is time to perform a
preventive maintenance of the GC.
Note
This module requires Uncertainty Trend to be included in your GCAS licence.
13.1
The Uncertainty Trend Form
Select a device on your device panel or recent device panel, then go to the View menu > Uncertainty
Trend.
This form has three pages: Parameter page, chart page, and comment page. The buttons at the
bottom of the form do the navigation between these pages.
When Uncertainty Trend form is opened, it shows the parameter page. This page configures all
parameters required to perform uncertainty calculation. These parameters are
Page 166 of 388
GCAS® Desktop Manual Guide rev. 14
Uncertainties to include,
Calibration certificate,
Footprint reference,
Uncertainty coefficients*,
Mole percentage range*,
ISO 6976 parameters,
Direction,
Plot range.
*available if Uncertainty of GC repeatability is ticked.
Each parameter is explained in chapter 13.2. After all parameters are set correctly, click Start graphing
and GCAS Desktop will start the calculation.
Note
Uncertainty calculation is slow because it loads many different data from database. Moreover,
uncertainty trend calculation is a sequence of many uncertainty calculations. Depending on how wide
your plot range and how many calibration records inside the plot range, one trend calculation may
take from few seconds to ten minutes or even more. Fast CPU and good network connection between
your computer and the database server help reducing the calculation time.
13.2
Uncertainty Trend Parameters
This chapter explains each uncertainty trend parameter.
13.2.1
Uncertainties to Include
As explained in chapter 11, uncertainty calculation takes up to three components: Uncertainty of
calibration gas (Ucal gas), uncertainty of GC repeatability+linearity (Urepeatability), and uncertainty of GC
reproducibility (Ureproducibility). These components may be included or excluded, which turns their values
to zero if excluded.
However in uncertainty trend, Ureproducibility must be included. You see an asterisk (*) indicating that it
has to be checked. The other two can be unchecked or checked.
Note
The GC device must have a calibration gas certificate. Uncertainty Trend form cannot graph your chart
if there are no certificates installed.
Page 167 of 388
GCAS® Desktop Manual Guide rev. 14
You cannot tick Uncertainty of GC repeatability if your GC device has no uncertainty coefficients
stored in database. Uncertainty coefficient selection field and mole percentage range options will be
disabled. To create a new coefficient set, rewind to chapter 12.4.
13.2.2
Calibration Certificate
This section controls which certificates to use. There are two options: Reset calculation at each
certificate, or pin a certificate for everything. The default is reset calculation at each certificate.
On first option, whenever a new calibration certificate installed, all data after the certificate are
calculated using the new certificate.
On the other hand, the second option forces the Uncertainty Trend form to use a particular calibration
certificate for all data within the plot range. Click Change to display the Select Certificate dialogue and
select the desired certificate.
Page 168 of 388
GCAS® Desktop Manual Guide rev. 14
13.2.3
Footprint Reference
This section controls which footprints to use while calculating Ureproducibility. Similar to calibration
certificate parameter, there are two options here: Reset reference at each footprint, or pin a particular
footprint for all data. The default is reset reference at each footprint, as illustrated by the timeline
below.
Page 169 of 388
GCAS® Desktop Manual Guide rev. 14
Sometimes users want to test how the uncertainty trend would turn out using several different
footprints. Select the second option, then click Change to select the footprint.
The footprint selected through this dialogue box is used to calculate Ureproducibility of all data in the plot
range, regardless of the timestamp of the footprint—even if the footprint occurs after the plot range
ends.
Page 170 of 388
GCAS® Desktop Manual Guide rev. 14
13.2.4
Uncertainty Coefficients and Mole Percentage Range
This section is available if uncertainty of GC reproducibility is checked on the first section. Your GC
device must have uncertainty coefficients stored in database, otherwise you cannot tick uncertainty of
GC reproducibility.
Select which coefficient set to use through Change button.
Next, choose one of the mole percentage range options.
Page 171 of 388
GCAS® Desktop Manual Guide rev. 14
1.
Universal: Every component has the same plus-minus range. The default is ±20%.
2.
Individual: Every component has its own plus-minus range. Click Set range to enter these
individual ranges.
3.
Manual: You need to explicitly set the value of lower bound and upper bound of each
component. For comparison, the mole composition from the calibration gas certificate is
displayed in the second column.
4.
Use plus-minus twice standard deviations: The range is taken from twice of standard
deviation of mole composition records over the specified period of time, filtered to the
Page 172 of 388
GCAS® Desktop Manual Guide rev. 14
specified stream.
Finally, the last check box controls whether to treat the component having largest percentage as the
balanced gas. Balanced component means its composition is not taken from the calibration certificate,
but from 100% minus the others instead. Balanced gas keeps the mole percentage sum at 100%, while
without balanced gas it may go over 100% and below 100%.
Unlike Uncertainty Calculator form which you can choose which one to become the balanced gas,
Uncertainty Trend always selects the gas with largest mole percentage as balanced. For a rare
occasion where there are multiple gases sharing the same largest percentage (e.g. two gases have
40% each), GCAS Desktop selects the first gas as the balanced one. Gases are sorted using RF sort
order.
13.2.5
ISO 6976 Parameters
This section contains the base pressure and combustion-metering temperature pairs. These
parameters are used for all data within the plot range.
Default base pressure is one atmosphere, or 1.01325 bar. GCAS Desktop supports six combustion and
metering temperature pairs, which are:
0°C / 0°C
15°C / 0°C (combustion temperature = 15°C, base temperature = 0°C)
25°C / 0°C
15°C / 15°C
20°C / 20°C
25°C / 20°C
Page 173 of 388
GCAS® Desktop Manual Guide rev. 14
13.2.6
Direction
Direction of calculation determines which calibration records to include in the calculation. Uncertainty
calculation may go forward or backward.
On forward direction, list of calibration data to include is counted from footprint. For every calibration
data in the plot range, calculation of Ureproducibility at that point will include all calibration data from the
last footprint (including the last footprint itself) and accumulatively go forward up to that point.
(This picture is animated in the HTML version of GCAS Desktop Manual.)
Do not confuse "the last footprint" in the previous paragraph with the "reference footprint". Reference
footprint is set on this section. The last footprint only marks where the collection of calibration data
begins. Reference footprint and "last" footprint may co-incide, but that is not always the case. You can
pin any footprint as a reference, but uncertainty calculation in forward direction uses one last footprint
before every single dot on the chart. Actually it uses the timestamp of last footprint, in order to query
calibration records from the timestamp of last footprint to the timestamp of the current dot being
calculated.
There is a minimum limit to start calculation. The default is one (1), which means forward calculation
can start at one calibration data after every footprint within the plot range. You can set the minimum
Page 174 of 388
GCAS® Desktop Manual Guide rev. 14
for example, ten, so the calculation starts after 10 calibrations following every footprint. You will see a
gap on the chart after every footprint indicating the number of dots within those gaps is below the
minimum limit, therefore calculation could not start.
On backward direction, list of calibration data to include is counted from the calibration data being
calculated. For every calibration data in the plot range, calculation of Ureproducibility at that point will
include all calibration data from that point and go backward to the last x days or last x record before
that point.
(This picture is animated in the HTML version of GCAS Desktop Manual.)
Set how many days or how many records to travel backwards. The default is 30 days. You can go
backward to as far as 2 years (730 days). At some occasions the GC devices has 30 data in one day;
you might consider to go backward 30 records, not days.
When GCAS Desktop travels backward, it may find a footprint before it fulfils the specified x days or x
records. Decide what GCAS Desktop should do when it bumps into a footprint, whether to stop or to
continue. The default is stop at footprint (trim at footprint). By stopping at footprint, the number of
calibration data included in the calculation is less than x days or x records, but GCAS Desktop does not
include data before the footprint which are usually calibrated under different configuration.
13.2.7
Plot Range
Set the plot range start and end date. GCAS Desktop displays a warning label if the footprint reference
is a pinned footprint and that footprint occurs within this plot range or after this plot range.
Page 175 of 388
GCAS® Desktop Manual Guide rev. 14
13.2.8
Miscellaneous
This section sets the threshold line on the chart. The default is 0.2%. When the uncertainty chart line
crosses the threshold line, it is recommended to perform a preventive maintenance on your GC.
The checkbox include standard calculation uncertainty 0.05% controls whether ISO 6976 standard
measurement error of 0.05% (or 0.1% at k = 2) should be included in the final calculation of each data
point in the chart. By default, this check box is ticked.
13.3
Uncertainty Trend Chart
Once you set all the required parameters, click Start graphing at the bottom of the form. Uncertainty
Trend form switches to chart page and begins the calculation.
Calculation in progress.
Note
Uncertainty calculation is slow because it loads many different data from database. Moreover,
uncertainty trend calculation is a sequence of many uncertainty calculations. Depending on how wide
your plot range and how many calibration records inside the plot range, one trend calculation may
Page 176 of 388
GCAS® Desktop Manual Guide rev. 14
take from few seconds to ten minutes or even more. Fast CPU and good network connection between
your computer and the database server help reducing the calculation time.
Because uncertainty trend calculation is slow, GCAS Desktop provides Pause button to temporarily
halt the calculation and Stop button to abort the calculation. The keyboard shortcut F7 is designated
for Pause button and Esc for Stop button. While calculation is in progress, you cannot use other
modules or they will run slower than usual. This is because the database server is busy serving the
data required for uncertainty calculation.
This is how the form looks like after the calculation is finished.
This is an example of a healthy GC. The blue uncertainty line is below the red threshold line. Actually,
there are five lines:
Uncertainty of calorific value – U(CV)
Uncertainty of molecular weight composition – U(MW)
Uncertainty of Wobbe index – U(IW)
Uncertainty of relative density or specific gravity – U(SG)
Uncertainty of standard density – U(ρ)
The five check boxes at the top of the form control whether to show or hide the corresponding line
chart. By default, GCAS Desktop only displays the uncertainty of calorific value because it is the most
interesting property.
Page 177 of 388
GCAS® Desktop Manual Guide rev. 14
Below is the same chart with the threshold line hidden from view. The Y-axis scale adjusts itself
accordingly so the variations of the uncertainty values become more clear. To show or hide the
threshold line, click
Show threshold line or right click the chart and select Show Threshold Line.
To go back to the parameter page, click Back to parameters at the bottom of the form. To read or
write comments instead, click View comments.
Note
If you went back to the parameter page but didn't change anything then clicked Start graphing, the
form quickly returns to the chart view. However if you changed one thing on the parameters, Start
graphing button will clear the chart and initiate a recalculation.
13.3.1
Comparing Previous Chart
Uncertainty Trend form remembers one last set of charts everytime it performs a complete calculation.
Once the calculation completes, you can compare the current chart to the previous chart. A typical
scenario is first you graph a chart, go back to the parameters page, change one or two things, and
finally graph a new chart.
Show previous chart button displays current chart (of current parameters) on top of previous
chart (of previous parameters). Previous charts have the same colour, only lighter. All five line charts
have their "previous" line charts.
Page 178 of 388
GCAS® Desktop Manual Guide rev. 14
In the example screenshot above, previous UCV (light blue) is forward calculation with minimum 2 data
to start calculation. Current UCV (dark blue) is backward calculation, going backward 30 records and
trim at footprint. They co-incide until the 30th dot then they start to diverge.
Be aware that
13.3.2
Refresh button will erase previous chart prior to the recalculation.
Zoom and Scroll
Drag a rectangle over the area you want to zoom in. Pan around the chart using the provided scroll
bars. Drag another rectangle to zoom in further.
Page 179 of 388
GCAS® Desktop Manual Guide rev. 14
To zoom out, click the circled minus button Θ on both scroll bars. Press Home on your keyboard or
right click the chart and select Zoom All-Out to undo all zoom-in operations.
13.3.3
Save or Copy the Chart
To save the chart as image file, right click on the chart and select Save Chart as Picture.
Similarly to copy the chart into clipboard, right click and select Copy Chart Image. Then you may
paste the image onto Microsoft Paint, Microsoft Word, or any software that accepts bitmap image.
13.3.4
Other Visual Cues
Hover your mouse pointer over a data point on the chart to reveal a tooltip about that point. Typically
the tooltip displays the X-axis value (the date and time value), Y-axis value, and the N (number of
calibration data used to calculate the uncertainty at this point). For backward calculation, the tooltip
has additional info whether GCAS Desktop bumped into footprint, and if so, whether the backward
iteration stopped at footprint or continued through.
Page 180 of 388
GCAS® Desktop Manual Guide rev. 14
Press
Show values or right click the chart and select Show Values to display the uncertainty
values. Be aware that too many data points on the chart will clutter the chart view.
GCAS Desktop displays four digits after decimal points. Should you need a higher precision, right click
the chart and select Use 8-Decimal Precision on Labels. Now the labels display 8 digits after decimal
points.
These dotted lines are called cursors. Cursors appear when you (left )click on a chart or as a remnant of
zoom operation. Cursor may act as a guide to compare Y-axis values of two data points. Click
Hide
crosshair cursors or right click on a chart and select Hide Crosshair Cursors.
In several occasions when you are comparing current chart to previous chart, the two lines come so
close that the current line chart obscures the previous line chart. Click
Use thin lines in order to
make all line charts be one pixel wide, making it easier to see two lines that are too close to each
other.
Page 181 of 388
GCAS® Desktop Manual Guide rev. 14
13.3.5
Colourblind Assistance
To aid users with colour blindness (protanopia and deuteranopia), GCAS Desktop provides an
alternative colour scheme for the chart. Use the
Colourblind assist button to switch colour
scheme.
13.3.6
Uncertainty Trend Diagnostic
Should you notice the uncertainty trend chart has some erroneous data points, the calculation at that
point might have included too few or too many calibration data. To see exactly which records were
included in the calculation of a data point, run GCAS Desktop with additional /UTdiagnostic
parameter. (UT = Uncertainty Trend)
With uncertainty trend diagnostic mode activated, click on any dot on the chart. GCAS Desktop
displays the Uncertainty Trend Diagnostic form that lists the calibration records used to calculate the
uncertainties of this dot.
Page 182 of 388
GCAS® Desktop Manual Guide rev. 14
Forward calculation must include the last footprint before this data point. Hence this is what we meant
by "last footprint" in chapter 13.2.6, not the "reference footprint". This footprint should be at the first
row on this grid.
Backward calculation may or may not have footprints in this grid view. For example, you are graphing
uncertainty trend with backward calculation for 30 days. If the footprint was 40 days ago, that
footprint won't be included in the calculation. On another data point where the footprint was 25 days
before; this footprint should be at the last row if you set the form to trim at footprint. If you set to
continue through (i.e. include data before footprint) there may be more records preceding this
footprint.
Had the records on the displayed grid do not conform to the two paragraphs above, this indicates a
bug. Kindly please report the bug to [email protected].
13.4
Insert Comment
Click View comments button at the bottom of the Uncertainty Trend form. This button brings you to
the comment page. Comments on this form is similar to comments on Data Analysis; the comments
aren't bound to a particular record. Instead, you need to provide the date of topic so other users
know the background or context of your comment.
Page 183 of 388
GCAS® Desktop Manual Guide rev. 14
Write your comment with the appropriate date of topic, then click Submit. Your comment will have a
yellow background to distinguish it from comments by other users.
Make sure that the comment is correct e.g. free from spelling errors, because once submitted you
would not be able to remove your comment. This is a part of audit trail requirements.
Click
Refresh comments to reload comments.
If you do not see the text box to write your comment, i.e. you only see the comment grid view, your
GCAS user account doesn't have the action permission to write comment in Uncertainty Trend.
Contact your GCAS administrator.
Page 184 of 388
GCAS® Desktop Manual Guide rev. 14
14 Uncertainty Trend Comparison
Under construction
Uncertainty Trend Comparison is a planned module to compare uncertainty trends across devices.
When this module becomes available, this chapter will be updated. Stay tuned for future releases of
GCAS Desktop.
Note
This module requires two GCAS features to be included in GCAS licence: Uncertainty Trend and Data
Comparison.
Page 185 of 388
GCAS® Desktop Manual Guide rev. 14
15 Comments
All user comments, e.g. on Footprint form, Calibration Data form, Mole Composition form, Calibration
Gas Certificate form, Data Analysis form, Repeatability Test module (only on GCAS Web), Uncertainty
Trend form, and ISO 6976 Trend form, are consolidated in the Comments form.
15.1
The Comments Form
To view user comments of a certain device, select that device on your device panel and go to the View
menu > Comments.
Leftmost column is the comment type, which contains information of what the comment was written
for. Clicking any link inside this column will take you to the corresponding form and load that
particular record.
The
15.2
Refresh button on the toolbar reloads comments for the selected date filter and type filter.
Filter Comments by Type
You can hide or show certain types of comments. For example, you can hide all comments for
footprint records. Use the seven toggle buttons on the Filter section of the toolbar.
Page 186 of 388
GCAS® Desktop Manual Guide rev. 14
: Show or hide comments for footprint records.
: Show or hide comments for calibration data.
: Show or hide comments for mole composition records.
: Show or hide comments for calibration gas certificates.
: Show or hide comments for data analysis module.
: Show or hide comments for ISO 6976 trends.
: Show or hide comments for uncertainty trends.
15.3
Filter Comments by Date
When you open the Comments form for the first time, it loads comments from the last three months.
You can change the date filter by selecting the desired filter on the dropdown, or choose "Custom
Range" and enter the desired date interval on subsequent dialogue box.
15.4
Search Comments
Type the search term in search box and then click
Search. The search box accepts any of the
following:
Words in user comments
Usernames,
Full date in British English format (e.g. "07 February 2014") — this will search for any matches
in both Date of Topic and Date Posted column.
Any match will be highlighted in yellow. If you do not see any results while you know there should be
some, make sure the active filter does not hide some comment types or try changing the date range.
To finish searching, click
15.5
Clear search results.
Delete Comments
In order to maintain auditability, GCAS users are not allowed to remove any comments. Not even
GCAS administrator can erase comments.
Some scenarios tolerate comment deletion. For example, you post comment in a wrong record. Or
you double-post the same comment. The only way to delete your comments is to contact your
database administrator (DBA) and ask him/her to remove your comments at database-level. Include
Page 187 of 388
GCAS® Desktop Manual Guide rev. 14
your username, the date and time when your comment was posted, timestamp of the record for which
the comment was written, and the content of your comment in your enquiry.
Page 188 of 388
GCAS® Desktop Manual Guide rev. 14
16 Dashboard
Dashboard is a place to see health status of all your GC devices in one place. This helps if you have
numerous GC devices across different workspaces like one in the screenshot below. Health status of
each GC device is represented by a small "LED light" on its dashboard tile.
To access dashboard, go to the View menu > Dashboard.
Each tile displays GC tag name, light indicator, and maximum 4 (four) health statuses. Choose between
1 to 4 out of 8 available health statuses to display.
Below are available GC health statuses to display. To customise which ones to display, visit Dashboard
settings. Chapter 16.1.1 provides detailed explanation on each item.
No.
Health status
GCAS licence feature requirement
1
Lowest correlation (R ) of last calibration
None
2
Uncertainty of calorific value
Uncertainty Calculation
3
Uncertainty of molecular weight composition
Uncertainty Calculation
2
Page 189 of 388
GCAS® Desktop Manual Guide rev. 14
4
Uncertainty of Wobbe index
Uncertainty Calculation
5
Uncertainty of relative density (specific gravity)
Uncertainty Calculation
6
Uncertainty of standard density
Uncertainty Calculation
7
Date of last calibration record
None
8
Date of last mole composition record
Live Data Analysis
GCAS Desktop on its default setting displays only two health statuses, lowest correlation (R2) and date
of last calibration. Many users with Uncertainty Calculation feature in their licences add uncertainty of
calorific value (CV) in addition to the default two.
Date of last calibration is useful to find out which GC device has not been calibrated for a long time.
Date of last mole composition record is useful to detect connection problems during unattended data
capture.
The health status indicator may display one of the following:
Appearance
Colour
Meaning
Black
- GCAS Desktop is loading or calculating the data, or
- Calculation was aborted through
Stop calculation button on the
toolbar, or
- All rules are turned off. This should not happen (no users should ever
turn off every rule).
Red
GC is not healthy. At least one health status fails.
Yellow
Yellow represents "error" state, which is probably caused by
- One or more health statuses cannot be determined because some data
was missing, or
- Network connection to GCAS database server goes down or interrupted
while calculation was in progress.
Green
GC is healthy. All health statuses pass.
White
GC has no data. All health statuses have no data.
Users with colour blindness
Simulated black, red, yellow, green, and white indicator in protanopia vision
GCAS Dashboard does not include alternative colour scheme for users with colour blindness. We
apologise if this affects you.
Page 190 of 388
GCAS® Desktop Manual Guide rev. 14
Click
Refresh to recalculate GC health status of all devices. During refresh, the Dashboard form
displays a progress bar. On slow network connection, calculation of GC uncertainties may take longer
time, like half or one second per device. You may abort this calculation via
Stop calculation
button.
A healthy GC has a green tile and all health statuses are displayed using a green font. If one health
status (or several) fails, the tile turns red and the offending health status(es) is displayed using red
font.
Example of a healthy GC and unhealthy GC.
When you find a health status displayed using black font, it indicates the rule for that health status is
turned off. Should a rule be turned off, it does not affect the final decision whether the dashboard tile
becomes green or red regardless of the health status itself passes or fails. More details about rules is
on chapter 16.1.2.
Example tile when rules for date of last calibration
and date of last mole composition are turned off.
Dashboard window displays the time of last refresh on the toolbar. This information may help if you
leave Dashboard open to monitor all your devices continuously. Moreover if you leave Dashboard
open for a prolonged time, we recommend to turn off the idle timer in order to prevent automatic
logout on inactivity. On a different topic, there is an auto-refresh timer which is configurable through
Dashboard Settings dialogue.
Page 191 of 388
GCAS® Desktop Manual Guide rev. 14
16.1
Dashboard Settings
From an open Dashboard window, click Dashboard settings on the toolbar. Alternatively, return to
GCAS Desktop main window and go to the View menu > Dashboard Settings. This shall bring forth
the Dashboard Settings dialogue.
Dashboard Settings dialogue has five tabs, and each of them is explained in its own subchapters
below. A preview tile is available at the left region reflecting new appearance as soon as you change a
setting.
16.1.1
Health Status to Display
List box on the left contains all available GC health statuses to display. If you see some items missing,
the missing items may require a GCAS feature in your GCAS licence.
No.
Health status
GCAS licence requirement
1
Lowest correlation (R2) of last calibration
None
2
Uncertainty of calorific value
Uncertainty Calculation
3
Uncertainty of molecular weight composition
Uncertainty Calculation
4
Uncertainty of Wobbe index
Uncertainty Calculation
5
Uncertainty of relative density (specific gravity)
Uncertainty Calculation
6
Uncertainty of standard density
Uncertainty Calculation
7
Date of last calibration record
None
8
Date of last mole composition record
Live Data Analysis
Click an item and click Show to display the health status on the dashboard tile. Dashboard tiles hold
maximum 4 items as laid out in list box on the right. Click an item on the right-hand list and click Hide
to remove this health status out of dashboard tiles. The list box on the right also determines the
Page 192 of 388
GCAS® Desktop Manual Guide rev. 14
order/sequence of displayed health statuses. Reorder the items through Move up or Move down
button.
16.1.1.1 Lowest correlation (R2) of last calibration
Depending on the device type, the table below summarises how the lowest R 2 is determined.
Device type
Lowest R2 is the lowest among these R2 values
Daniel C6+
C1-C2-C6
C3-C4-C5
Daniel C7+
C1-C2-C7
C3-C4-C5-C6
Daniel C9+
C3-C4-C5
C6-C7-C8-C9
Daniel C10+
C3-C4-C5-C6
C7-C8-C9-C10
ABB C6+
C3-C4-C5
C4-C5-C6
C3-C4-C5-C6
ABB C7+
C3-C4-C5-C6
C4-C5-C6-C7
C3-C4-C5-C6-C7
Notice that lowest R2 for Daniel C6+ and C7+ devices is determined only by first two correlations. The
third correlation (C1-C2-C3-C4-C5-C6 or C1-C2-C3-C4-C5-C6-C7) is ignored. If the lowest R2 falls
below the R2 threshold defined in the Analysis Parameter of a device (typically 0.995), the tile for that
device turns red.
16.1.1.2 Uncertainties
There are five uncertainty health statuses to display. Uncertainty of calorific value (CV) is probably the
most used among the others. The calculation uses these inputs:
Calibration certificate: Configurable through uncertainty calculation settings tab. If a device
doesn’t have any calibration certificates, GCAS Desktop aborts uncertainty calculation for this
device, uncertainty health status on its dashboard tile turns grey, and displays "no
certificate".
Uncertainty coefficients: This always follows last uncertainty calculation configuration. If last
configuration is not available, GCAS Desktop tries to find the latest coefficient set. If no
coefficient sets are available, Urepeatability is not included in the uncertainty calculation.
Mole percentage range: This always follows last uncertainty calculation configuration. If last
configuration is not available, GCAS Desktop assumes a range of ±20% universal.
Footprint: Configurable through uncertainty calculation settings tab with fallback/default to
use latest footprint. If a device doesn't have any footprints, Ureproducibility is not included in the
uncertainty calculation.
Calibration data: Configurable through uncertainty calculation settings tab with
fallback/default to all calibration records from the footprint to today.
ISO 6976 calculation: This always follows last uncertainty calculation configuration. If last
configuration is not available, GCAS Desktop assumes base pressure of 1 atmosphere
(101,325 Pa), combustion temperature 0°C and metering temperature 0°C.
Last uncertainty calculation configuration is the configuration on the input pages the last time you
opened Uncertainty Calculator form. Each device has its own last uncertainty configuration.
Page 193 of 388
GCAS® Desktop Manual Guide rev. 14
Complete uncertainty calculation—all three Ucal gas, Urepeatability, and Ureproducibility are present—is
indicated by no asterisk symbol on dashboard tile. Incomplete uncertainty calculation has asterisk
symbol on it. For example, the dashboard tile displays U(CV)* = 0.1206%.
By default, dashboard tiles turn red if their combined expanded uncertainty exceeds 0.2%. You can
change this threshold or the uncertainty type (absolute or combined expanded) at the rules tab.
16.1.1.3 Date of last calibration
Date of last calibration record indicates how long time has passed since GC was last calibrated. On
dashboard tiles, date of last calibration has
footprint, it has
calibration data icon. If last calibration was marked as
footprint icon.
By default, the dashboard tile should've turned red if date of last calibration is older than 3 days.
However due to various calibration policy among groups or platforms, this rule is turned off. To
change the threshold (i.e. how many days to make it red) and turn on the rule, go to rules tab.
Furthermore you can override the rule for date of last calibration at per-workspace and per-device
level. Visit chapter 16.2 Overriding Rules for more information.
16.1.1.4 Date of last mole composition
Date of last mole composition shows the timestamp of latest mole composition record (among all
streams). On dashboard tiles, date of last mole composition has
mole composition icon.
Date of last mole composition is useful to monitor the connectivity between your GC device and GCAS
Desktop running in another computer next to the GC device. Should a problem occurred and the data
capture terminated, mole composition records stop coming and you notice the timestamp of last
mole composition record is stationary after several dashboard refreshes.
Default setting dictates that dashboard tiles should turn red if date of last mole composition record is
older than three hours. You can change the threshold, the time unit (minutes, hours, days), or turn off
the rule at the rules tab. Do not put unrealistic threshold for instance, 1 minute, because mole
composition records usually come every 4~7 minutes. Specifying the threshold to a value lower than
GC cycle time will cause the dashboard tile to become everlasting red.
Rules for date of last mole composition is also overridable at per-workspace and per-device level. Visit
chapter 16.2 Overriding Rules for more information.
Page 194 of 388
GCAS® Desktop Manual Guide rev. 14
16.1.2
Rules
Simply put, rules are definitions of conditions causing a dashboard tile to become red. Every GC health
status displayed on dashboard tiles has its own rules to define above what value or below what value
the health status should make the dashboard tile red. For example, uncertainty of CV has a rule that if
a device has combined expanded CV uncertainty more than 0.2%, it is unhealthy.
Rules can be turned on or off. When a rule is turned off, it doesn't affect the decision whether the
dashboard tile should become green or red. For example, a user decided to display three health
status: lowest R2, uncertainty of CV, and date of last calibration. The rule for R 2 is turned on, rule for
uncertainty of CV is turned on, but the rule for date of last calibration is turned off. After next refresh,
it turned out that minimum R2 is 0.9974, combined expanded uncertainty of CV is 0.1250%, and date
of last calibration is seven days ago. Rule for R2 makes the tile green, rule for U(CV) makes the tile
green, but the rule for date of last calibration makes the tile red. We expect the tile to become red by
now. However as the rule for date of last calibration was turned off, the tile is only affected by the rule
of R2 and U(CV). Green meets green becomes green, hence the tile stays green. To turn off a rule,
uncheck the corresponding check box on this tab.
Rule for lowest R2 (correlation) is the most simple rule of all: if a device has lowest R 2 below the
threshold defined in its Analysis Parameter, it is unhealthy.
Rules for uncertainty has two configurable fields: the uncertainty type (absolute or combined
expanded), and the threshold value. Absolute uncertainty changes the unit to the absolute unit
such as MJ/m3 for uncertainty of CV, while expanded uncertainty changes the unit to percentage.
Rules for date of last calibration has one configurable field, which is how many days to make the
tile red. This field accepts decimal number. For example, 3.25 days means 3 days and 6 hours.
Rules for date of last mole composition has two fields, the threshold limit and its time unit. This
field accepts decimal number too.
Page 195 of 388
GCAS® Desktop Manual Guide rev. 14
Date rules, consisting of rule for date of last calibration and rule for date of last mole composition
record, are overridable. More information about overriding a rule is on chapter 16.2. To delete all
overriding rules in one go, click Clear all overriding rules on this tab.
16.1.3
Uncertainty Calculation Settings
This tab configures several inputs used by uncertainty calculation of all devices. If your GCAS licence
doesn't include Uncertainty Calculation, this tab only displays a text your GCAS licence does
not include uncertainty calculation.
Some uncertainty calculation inputs always follow last uncertainty configuration, like uncertainty
coefficients and ISO 6976 settings. Last uncertainty configuration is the configuration you have set on
the input pages the last time you opened Uncertainty Calculation form. Every device has its own last
uncertainty configuration.
Which calibration certificate to use: Choose whether to use latest certificate of each device, or to
follow last uncertainty configuration of each device.
Which footprint to use: There are three choices. Use latest footprint, use first footprint found after
the certificate timestamp, or follow last uncertainty configuration. If you selected first footprint after
certificate but there are no actual footprints after certificate timestamp, GCAS Desktop falls back to
the latest footprint. If a device doesn't have any footprints, Ureproducibility won't be included in the
uncertainty calculation and uncertainty health statuses shall bear an asterisk symbol on them.
How many calibration data to include: Pick one of the choices.
From footprint to today (the default) takes the footprint itself, all calibration data afterwards,
all subsequent footprints, and all subsequent calibration data after them, all the way until
current computer time.
Page 196 of 388
GCAS® Desktop Manual Guide rev. 14
Latest x days (default x = 30) takes all calibration data counted down from today to today
minus x days. Nevertheless if GCAS Desktop bumps into a footprint within these x days, GCAS
Desktop stop travelling backward and instead takes that footprint plus all calibration data
until today.
Follow last uncertainty configuration causes GCAS Desktop to follow last uncertainty
configuration of each device—including custom calibration data range if you have set them
through Uncertainty Calculator form beforehand.
16.1.4
Display Style
Display style tab configures the appearance of dashboard tiles.
Precision: Select how many decimal digits to display on numeric health status (lowest R 2 and
uncertainties). The default precision is 4 digits. However if you opt to show both types of uncertainties
(i.e. expanded and absolute), GCAS Desktop can only display 2 digits.
For uncertainties, show me: Select which type of uncertainties to display. This setting applies to
uncertainty health statuses. Most users prefer combined expanded uncertainty (expressed in
percentage) over absolute uncertainty (expressed in units such as MJ/m3 for CV). There is also a choice
to display both, however GCAS Desktop can only fit 2 decimal digits due to space limitation.
For date information, show me: Select date format to display. This setting applies to date of last
calibration and date of last mole composition record. The default is absolute date which shows the
exact date-month-year (and also hour-minutes for last mole composition record). The other choice is
rough relative timespan like "3 days ago" or "5 hours ago".
Bold font on the device name makes the device tag name on dashboard tiles use bold face. Look at
the preview tile at the left side of this dialogue box to see if you fancy the bold font.
Page 197 of 388
GCAS® Desktop Manual Guide rev. 14
16.1.5
Miscellaneous
The misc tab configures other behaviours which are not categorised into the other four tabs.
Play sound when all calculations completed makes GCAS Desktop play a ding sound after all
calculations completed. On slow connection, a dashboard refresh may take minutes to complete so
GCAS Desktop can notify you that dashboard refresh is finished.
Auto refresh causes the Dashboard form to refresh itself once every the defined interval. The default
is 12 hours, but you can change it between half an hour (30 minutes) and 72 hours (3 days). By default,
auto-refresh is turned off. If you turn auto-refresh on and leave Dashboard open for a long time, we
recommend to turn off automatic logout on inactivity.
Open Dashboard window as soon as I log in instructs GCAS Desktop to open Dashboard
immediately after all workspaces and devices have been loaded. This only works after GCAS login, not
after changing database or refreshing device panel.
When I click a tile, select the action you want GCAS Desktop to do. There are four options.
Do nothing.
Open Footprint/Calibration Data form: This action opens the footprint or calibration record
who has the lowest R2 displayed on the dashboard tile.
Open Mole Composition form: This action opens the latest mole composition record,
assuming that the date of latest mole composition record is displayed on the dashboard tile.
If your GCAS licence doesn't have Live Data Analysis, this option is not available.
Open Uncertainty Calculator form: This action opens Uncertainty Calculator form for the
device represented by the dashboard tile, but that's it. The settings at the Uncertainty
Calculator form may be different from the settings defined by the uncertainty calculation
settings tab, hence may produce different uncertainty values. Both dashboard tile and the
Uncertainty Calculator form should produce the same values if everything on uncertainty
Page 198 of 388
GCAS® Desktop Manual Guide rev. 14
settings tab was set to "follow last uncertainty configuration". If your GCAS licence doesn’t
have Uncertainty Calculation feature, this option is not available.
16.2
Overriding Rules
Rules for date of last calibration and date of last mole composition record are overridable at device
level or workspace level. Rules for R2 and uncertainty are not, however. Overriding at device level
causes the dashboard tile of this device to ignore the general date rules and use the overridden date
rules instead. Overriding at workspace level causes all dashboard tiles under this workspace to use the
overridden date rules.
For example, you have set the general rule for date of last calibration stating all devices who were
calibrated past 3 days ago shall be red. However, there's this one platform called Workspace X which
enforces a different calibration policy, for instance, once every 7 days. This causes the dashboard tiles
under Workspace X to become red if their last calibration date is, let's say, 5 days ago. By overriding
calibration date rule for Workspace X, we can specify that all devices under Workspace X uses 7-day
rule, not three.
Device-specific override has priority over workspace-specific override. For instance, Workspace X has
five GC devices named X1, X2, X3, X4, and X5. These five devices were calibrated 9 days ago. Your
general rule state 3-day calibration rule, but those under Workspace X are overridden to use 7-day
calibration rule. Now let's override the date rule for device X4 to be 14 days. As a result, device X1, X2,
X3, and X5 become red while device X4 is still green.
You can even override the on/off status of a date rule. For example, the general rule for last calibration
date is turned on, but this particular device is overridden as turned-off. You shall see other devices
have green or red font on their dashboard tiles, while this device has black text for its last calibration
date. The same applies for the other way round, if the general rule is turned off but you wish to turn
on date rules for several devices or workspaces.
16.2.1
Per-Device Override
To override date rules at device level, right click the dashboard tile.
Page 199 of 388
GCAS® Desktop Manual Guide rev. 14
The menu brings us to the Override Date Rules dialogue box.
Tick Override date rules for this device. This is the main device override switch for this device. If you
remove this tick, you are effectively revoking its override—causing the device to fall one level down
(per-workspace override) if defined, or return to the general rules already set at the rules tab.
Inside the frame there are two check boxes. One is for date of last calibration, the other is for date of
last mole composition. These check boxes control the on/off status of the overriding rules. In the
screenshot above, the check box for date of last mole composition record is greyed out because date
of last mole composition is not displayed on the dashboard tile. (Screenshot for illustrational purpose
only.)
Set the new threshold value for this device. For example, let's use 15 days as in the screenshot above.
Page 200 of 388
GCAS® Desktop Manual Guide rev. 14
Main device
General
General rule
Device
Device
Result: Dashboard tile
override
rule
threshold
override
override
becomes red if last
switch
active?
active?
threshold
calibration is older than
ON
Don't care
3 days
ON
15 days
15 days
ON
Don't care
3 days
OFF
15 days
Rule is turned off
OFF
ON
3 days
Don't care
15 days
3 days
OFF
OFF
3 days
Don't care
15 days
Rule is turned off
Click OK to close the dialogue box and you shall see the Dashboard applies your new rules. For
example, we overrode Device 2 to turn off its calibration date rule in the screenshot below.
16.2.2
Per-Workspace Override
To override date rules at workspace level, right click the heading text or click the
gear icon.
This also brings the Override Date Rules dialoge box. However this time, it applies to all devices within
this workspace.
Page 201 of 388
GCAS® Desktop Manual Guide rev. 14
Tick Override date rules for all devices in this workspace. Similarly, this is the main workspace
override switch. The two check boxes operate at similar fashion as per-device override. Nonetheless be
reminded that device-specific overrides take priority over workspace-specific overrides.
Main
Main
General
General
Workspace
Workspace
Device
Device
Result: Dashboard
workspace
device
rule
rule
override
override
override
override
tile turns red if date
override
override
active?
threshold
active?
threshold
active?
threshold
of last calibration is
switch
switch
older than
(<!>
takes
priority)
ON
ON<!>
DC
3 days
DC
10 days
ON
15 days
15 days
ON
ON<!>
DC
3 days
DC
10 days
OFF
15 days
Rule is turned off
ON
OFF
DC
3 days
ON
10 days
DC
15 days
10 days
ON
OFF
DC
3 days
OFF
10 days
DC
15 days
Rule is turned off
OFF
ON
DC
3 days
DC
10 days
ON
15 days
15 days
OFF
ON
DC
3 days
DC
10 days
OFF
15 days
Rule is turned off
OFF
OFF
ON
3 days
DC
10 days
DC
15 days
3 days
OFF
OFF
OFF
3 days
DC
10 days
DC
15 days
Rule is turned off
DC = don't care.
16.2.3
Revoking (Cancelling) an Override
Revoking an override causes the device (or all devices in a workspace) to return to the general rules
defined at the rules tab.
To revoke device-specific overriding rules, bring the Override Date Rules dialogue and untick Override
date rules for this device. Click OK to commit the change and the Dashboard window shall update
itself.
To revoke workspace-specific overriding rules, bring the Override Date Rules dialogue and untick
Override date rules for all devices in this workspace. Click OK to commit the change.
To revoke all device-specific and workspace-specific overrides, open Dashboard Settings then go to
the rules tab. Click Clear all overriding rules button at the bottom and finally finish it by clicking OK.
Page 202 of 388
GCAS® Desktop Manual Guide rev. 14
17 Mole Composition Comparison
Mole Composition Comparison is a tool to compare trends of mole composition across different
devices. This module complements the Data Analysis module. Through Data Analysis you see mole
composition trend of various gases for one device, now on Mole Composition Comparison you see
mole composition trend of one gas for various devices.
Note
This module requires two GCAS features to be included in your GCAS licence: Live Data Analysis and
Data Comparison.
17.1
The Mole Composition Comparison Form
To open Mole Composition Comparison form, go to the Tools menu > Mole Composition
Comparison.
Mole Composition Comparison form has two resizable sections. Parameters and device list are at the
top, while the comparison chart is at the bottom.
Page 203 of 388
GCAS® Desktop Manual Guide rev. 14
17.2
Parameters and Device List
The top section of the form has a linear flow. Select the gas and comparison date range (under section
❶), browse the devices to compare (❷) and add them to the comparison list (❸), select which
stream of these devices (❸) and finally click Go (❹) to start graphing.
17.2.1
Gas and Date Range
GCAS Desktop supports 15 gases to compare across different devices. This dropdown also includes
neopentane and higher alkanes such as heptane, octane, nonane, and decane. Please note that not all
devices have a complete range of gases, for some do not have neopentane and some others do not
have heptane and higher. When you set the gas octane to compare then tick a device which doesn't
include octane for example, its line will lie on the X-axis because its Y-values are all zeroes.
17.2.2
Devices and Comparison List
On the left you see the device tree view. It lists all your workspaces and devices within each workspace.
The grid on the right is known as comparison list.
Hover your mouse pointer over a device to view more information about data availability and stream
numbers. In the screenshot below, the device 370XA DEMO has stream 1 and stream 4. Devices which
Page 204 of 388
GCAS® Desktop Manual Guide rev. 14
don't have mole composition records at all are displayed as semi-transparent and cannot be added to
the comparison list.
To compare devices, add the devices from the device tree view to the comparison list. Either select the
device then click Add, or double click the device, or drag the device and drop it onto comparison list.
Note
A Mole Composition Comparison form which was opened through Send to shortcut from Data
Analysis’ Send to Mole Composition Comparison menu or Compare both link, is locked to one particular
device and one particular stream number. Device tree view is empty and you cannot add another
device into comparison list. The text above the chart should clearly indicate the form is locked. Click
Reset and reload device list next to this text in order to unlock Mole Composition Comparison form
back into normal mode.
Once the device has been added to the comparison list, select the stream number to compare. You
can compare different streams of the same device too. To do so, add the device to the comparison list
twice, then select different stream number for each of them. Moreover if you have ISO 10723 feature
in your GCAS licence which we will explain very soon, this tool can also compare the single-point
composition vs. multilevel-calibrated composition of the same device, same stream number.
Example of comparison list for users without ISO 10723 (left) and with ISO 10723 (right).
Page 205 of 388
GCAS® Desktop Manual Guide rev. 14
The column Show? contains check boxes which is used to hide or show the line chart of
corresponding comparison entry after the chart has been rendered completely.
Users having GCAS feature ISO 10723 in their GCAS licences see an additional column named MLC?
which also contains check boxes. This is the single-point/MLC switch. Tick the check box to graph
multilevel-calibrated composition, otherwise leave it unticked to graph single-point composition.
To remove an entry from the comparison list, highlight its row on the grid and then click Remove or
press Delete on your keyboard. Everytime a comparison entry is removed from the comparison list,
its line chart is also removed. However if you add it back, you need to redraw the chart because its
data in the cache has already gone. This is the difference between removing an entry versus
temporarily hiding it (by unticking the check box inside the Show? column). In addition, click Remove
all to empty the comparison list and start over.
Note
Maximum number of entries in comparison list is 15 entries.
GCAS Desktop will alert you if there are duplicate comparison entries. A duplicate means same GC
device + same stream number [+ same MLC/single-point switch if you have ISO 10723].
17.2.3
Start Graphing
When everything else are correct, simply click Go. GCAS Desktop loads the required mole composition
data and renders the chart. The Go button turns into Refresh button unless you change the selected
gas, comparison date range, devices, stream numbers, or single-point/MLC switch.
Equal scaling, if ticked, forces all comparison entries to use the same normalisation scale. Tick this
option if you are comparing multiple devices having different scales, such as this GC uses fraction and
that GC uses percentage. More about scaling equalisation on chapter 17.3.2.
Users with ISO 10723 feature in their licences see an additional command link Clear MLC cache. This
clears the cache used by ISO 10723 conversion. The cache contains MLC coefficients, calibration
Page 206 of 388
GCAS® Desktop Manual Guide rev. 14
certificates, single-point RF, MLC RF, and MLC constraints. Click this link if you notice the multilevelcalibrated streams are graphed incorrectly. Once the MLC cache is emptied, refresh the chart.
The chart legend lists the device tag name and the stream numbers. Multilevel-calibrated streams are
indicated with asterisk (*) after stream number similar to the green line in this screenshot example.
17.3
Comparison Chart
The chart graphs the historical mole composition of the selected gas over time, limited by your plot
range, device, stream number (and single-point or MLC selection for ISO 10723) at a time. This chart
has maximum capacity of 15 comparison entries. The legend at right side tells what gas it is, the
devices, and their stream numbers. Multilevel-calibrated streams (ISO 10723) are indicated with
asterisk (*) after their stream numbers.
Page 207 of 388
GCAS® Desktop Manual Guide rev. 14
By default, GCAS Desktop draws the chart using thin lines, unlike all other charts in GCAS Desktop
which use 2-pixel width. Line charts having data points less than 100 have small dot markers along its
body. Line charts with more than 100 dots are presented without markers.
17.3.1
Show or Hide Some Devices
Untick the checkbox at the column Show? inside the comparison list to temporarily hide a device (a
line) on the chart. Check the checkbox to bring the line visible.
If you remove a device from this list, its line chart is also removed. After you add the device back, you
need a full refresh to redraw the lost line.
17.3.2
Scaling Equalisation
GCAS Desktop stores mole composition records as-they-are in the database. There is no information
about its scale stored in database. Most devices use percentage scale (0 to 100). Some others output
fraction scale (0 to 1). GCAS Desktop determines scaling by the unnormalised total. For example if the
unnormalised sum is near 1, the device uses fraction scale. If the sum is near 100, it is percentage. If
near 1000, it is permillage (‰).
GCAS Desktop supports fraction scale (0 to 1) up to PPB scale (0 to 1,000,000,000) officially. This
becomes a problem in mole composition comparison: What happens when you compare device A
with percentage scale and device B with fraction scale?
The answer, GCAS Desktop plots mole composition records as they are. The two line charts will appear
far apart as device A has methane composition about 70 (percentage scale) while device B has around
0.7 (fraction scale). Thus the line chart of device A flies high up there while device B lies low near the
X-axis.
To circumvent this problem, Mole Comparison Composition form is equipped with scaling
equalisation. However it is not enabled by default. The reason is most users have all GC devices
Page 208 of 388
GCAS® Desktop Manual Guide rev. 14
generating mole composition records on the same scale, or at least configured to output on the same
scale. Therefore scaling problems rarely affect GCAS users.
If you do compare devices with different scaling, be sure to tick Equal scaling before you click Go.
Select one of four available scales: fraction, percentage, permillage, or parts-per-million (PPM).
Continuing our example about device A and B, with mole fraction scaling equalisation, you are
downscaling device A to fraction (0 to 1) while device B remains in fraction scale. If you select
percentage on this dropdown, you are upscaling device B to percentage (0 to 100) instead.
17.3.3
Zoom Mode and Selection Mode
This toggle button controls whether the comparison chart is in zoom mode or selection mode.
Page 209 of 388
GCAS® Desktop Manual Guide rev. 14
Toggle button to switch between zoom or selection mode.
Zoom mode lets you zoom to a specific area of the chart. Drag a rectangle over the area you want to
zoom in. Pan around the chart using the provided scroll bars. Drag another rectangle to zoom in
further. To zoom out, click the circled minus button Θ on both scroll bars. Press Home on your
keyboard or right click the chart and select Zoom All Out to undo all zoom-in operations.
Selection mode enables you to create selection area on the chart, then you can manipulate the
records contained inside the selection rectangle using available context menu. Chapter 17.3.8 explains
the function of each menu. To clear selection area, right click the chart and select
Area.
Page 210 of 388
Clear Selection
GCAS® Desktop Manual Guide rev. 14
17.3.4
Save or Copy the Chart
To save the chart as image file, right click on the chart and select Save Chart as Picture.
Page 211 of 388
GCAS® Desktop Manual Guide rev. 14
Similarly to copy the chart into clipboard, right click and select Copy Chart Image. Then you may
paste the image onto Microsoft Paint, Microsoft Word, or any software that accepts bitmap image.
17.3.5
Export Values to Microsoft Excel
Once the chart has been graphed completely, click
Copy to Microsoft Excel. This button opens a
new Excel worksheet. Then GCAS Desktop writes all data point of all line charts available onto this
worksheet.
Note
This feature requires Microsoft Excel 2010, 2013, 2016, or later, to be installed.
GCAS Desktop prevents you from exporting to Excel if there are duplicate comparison entries.
Every device or stream in comparison list has its own column and the rows are timestamps. If there are
two or more data points from different devices or streams sharing the exact same timestamp, they are
merged into one row in Excel worksheet.
17.3.6
Comparison of Averages
When you click Go or Refresh, GCAS Desktop renders the chart and at the same time computes the
average of each line. These average values are presented on a secondary column chart. Click Show
average chart button (having icon 𝑥̅ ) to bring the average chart visible.
Page 212 of 388
GCAS® Desktop Manual Guide rev. 14
Each comparison entry has its own average bar (or technically ‘column’ as it is a column chart).
Showing or hiding a line chart through the Show? check box in the comparison list also displays or
conceals its average bar. You can also zoom the average chart in case all bars are of the same height
thus making it difficult to see the difference among them, provided that the chart is in zoom mode.
17.3.7
Send to ISO 6976 Trend Comparison
Now that you have the mole composition trend of various devices or streams, ever wondered how
much calorific value each stream would stack against one another? If you have the GCAS feature ISO
6976 Trend included in your licence, you see the button Send to ISO 6976 Trend Comparison is
enabled next to Copy to Microsoft Excel button.
This button calls ISO 6976 Trend Comparison form and communicates the necessary information such
as the plot range and content of the comparison list. Then ISO 6976 Trend Comparison form handles
the rest. Because this "Send to" shortcut bypasses some of the ISO 6976 Trend Comparison's standard
startup routines, the ISO 6976 Trend Comparison form is locked to your comparison list only. To reset
the form, click Reset and reload device list.
Page 213 of 388
GCAS® Desktop Manual Guide rev. 14
Send to ISO 6976 Trend Comparison button transmits the entire plot range. To compare ISO
6976 trends for a limited range, switch Mole Composition Comparison form to selection mode and
use the right-click menu Send to ISO 6976 Trend Comparison as illustrated in chapter 17.3.8.
Page 214 of 388
GCAS® Desktop Manual Guide rev. 14
17.3.8
Selection Mode Menus
These menus are available if the form is in selection mode and there is a selection area. Unlike Data
Analysis, Mole Composition Comparison requires the selection area to be contiguous, that is, no
record (dots on chart) jumping out from selection rectangle then return back inside. If your selection
area is not contiguous, GCAS Desktop will alert you and propose a corrected selection area.
Nonetheless if you disagree with the new selection area, click Cancel on the message box.
Menu
Function
Zoom In Here
Zooms in to the selection area.
Generate Summary Here
Generates statistical summary for the selected area.
Frame This Selection
Literally puts a rectangular frame around the selection, for
presentation purpose.
This works on the average chart too.
Remove Frames
Deletes all frames created through Frame This Selection menu.
Set These Records as Inactive
Sets all records within the X-axis range of the selection area as
inactive. GCAS Desktop displays an additional dialogue if your
selection area covers several devices/stream numbers.
Send to ISO 6976 Calculator
This menu requires ISO 6976 Calculator in GCAS licence. It sends the
(Selection Averaged)
averaged mole composition value of all gases of all records
contained inside the selection area to ISO 6976 Calculator. As the
chart has only one gas, the entire data table is reloaded from the
Page 215 of 388
GCAS® Desktop Manual Guide rev. 14
database. GCAS Desktop displays an additional dialogue if your
selection area covers several devices/stream numbers.
Send to ISO 6976 Calculator
This menu requires ISO 6976 Calculator in GCAS licence. It sends the
(Entire X-axis Averaged)
averaged mole composition value of all gases of all records in the
entire X-axis. Actually it doesn’t even need a selection area. GCAS
Desktop displays an additional dialogue if you have more than one
comparison entry in the comparison list.
Send to ISO 6976 Trend
This menu requires ISO 6976 Trend in GCAS licence. It loads the ISO
Comparison
6976 Trend Comparison form and instructs the form to compare ISO
6976 values based on the mole composition records contained
inside the selection area. Contrast to Send to ISO 6976 Trend
Comparison button, this menu transmits the X-axis range of
selection area rather than the entire plot range.
These three menus Set These Records as Inactive, Send to ISO 6976 Calculator, and Send to ISO
6976 Trend Comparison may trigger a further confirmation if your selection area covers more than
one device or one stream. Please confirm which device(s)/stream number(s) to have their records set
as inactive or be sent to ISO 6976 Calculator or to ISO 6976 Trend Comparison tool. Setting as inactive
merges two comparison entries having same device, same stream number, but different singlepoint/MLC switch value. MLC capabilities require ISO 10723 in GCAS licence.
Confirmation dialogue boxes. Tick which device(s)/stream(s) then click Continue.
GCAS Desktop opens as many ISO 6976 Calculator forms as necessary and sets their descriptions
accordingly, so you know which is which.
17.3.9
Click
Other Visual Cues
Show values or right click the chart and select Show Values to display the mole composition
values.
Page 216 of 388
GCAS® Desktop Manual Guide rev. 14
GCAS Desktop prompts a warning if one or more devices have over 100 dots on the chart. We do not
recommend to display value labels on line charts with over 100 dots because it will clutter the chart
area. Nevertheless you can choose to continue displaying labels despite the 100+ dots, just be
informed that GCAS Desktop may appear 'not responding' for a while because the layout engine of
the chart is busy.
These dashed lines are called cursors. Cursors appear when you click on a chart or as a remnant of
zoom operation. Cursor may act as a guide to compare Y-axis values of two data points. Click
Hide
crosshair cursors or right click on a chart and select Hide Crosshair Cursors to hide these lines from
view.
By default, GCAS Desktop draws the chart using a thin line. The toggle button
Use thin line is
pressed by default. If you prefer the usual thick lines, click this button to raise it from its pressed state.
Page 217 of 388
GCAS® Desktop Manual Guide rev. 14
17.3.10
Colourblind Assistance
To aid users with colour blindness (protanopia and deuteranopia), GCAS Desktop provides an
alternative colour scheme for the chart. Use the
Colourblind assist button to switch colour
scheme.
Alternative colour scheme when colourblind assist is turend on.
Colourblind assistance works better with thick lines like in this screenshot.
Page 218 of 388
GCAS® Desktop Manual Guide rev. 14
18 Correlation Calculator
Correlation Calculator is a tool to find the R2 (correlation) value for arbitrary number of data. Footprint
and Calibration Data already calculated R2 value of the calibration record, however they follow a
certain order of components/gases for each GC device type. If you need to calculate the correlation
value without following those rules, use this Correlation Calculator tool instead. This tool does not
only calculate RF-MW correlation like those in Footprint or Calibration Data, but also calculates
correlation of any x and y number pair.
18.1
The Correlation Calculator Form
To open Correlation Calculator, go to the Tools menu > Correlation Calculator. Correlation
Calculator can also be opened through Send to shortcut, such as from Footprint or Calibration Data or
from Data Analysis. This Correlation Calculator form has three sections which are data input section,
data table section, and chart section.
This calculator has two modes, named RF-MW Calculator and Any X-Y Calculator. The first mode
calculates the correlation value for the given pairs of RF (response factor) and MW (molecular weight).
On the other side, Any X-Y Calculator computes the correlation value for the given pairs of arbitrary X
and Y values. Use this mode if you need the X-axis to be something other than the logarithm of
molecular weight.
The active tab on the data table section indicates current active mode. Switch tab to change mode.
Page 219 of 388
GCAS® Desktop Manual Guide rev. 14
18.2
RF-MW Calculator
Switch to RF-MW Calculator tab on the data table section. This would change the data entry section to
the screenshot below.
Add a new entry by selecting the desired gas from the MW (molecular weight) dropdown, and type its
response factor value in the RF text box. Click
Add to insert this entry into data table. This entry is
also graphed on the chart immediately.
Note
You cannot add the same gas more than once. Should the selected gas has existed in the data table
section, GCAS Desktop presents a warning message.
You cannot put negative number in response factor entry field because logarithm of negative
numbers are undefined.
To remove one or more entries, click row header(s) to highlight data row(s) you wish to delete. Next,
press Delete on your keyboard. The corresponding dot(s) on the chart will disappear as well.
You can edit the response factor value should a mistake happened. Double click the response factor
cell, enter the correct value, then press Enter to commit. The corresponding dot on the chart shall
move upwards or downwards according to the new response factor value.
Page 220 of 388
GCAS® Desktop Manual Guide rev. 14
Whenever there are minimum three entries in data table, GCAS Desktop computes the regression line
and calculates their correlation. The R2 value is displayed at the top of the chart. Regression line and
R2 value are also updated after changes of existing RF values are committed. If you remove several
entries leaving less than three in data table, both regression line and R2 value disappear from the
chart.
Note
Correlation data sent from Data Analysis’ context menu Send to Correlation Calculator may include
gases with unrelatable correlation such as i-butane, i-pentane, nitrogen, and carbon dioxide. GCAS
Desktop display these gases as red dot in the R2 chart, indicating they should be removed.
Page 221 of 388
GCAS® Desktop Manual Guide rev. 14
18.3
Any X-Y Calculator
Switch to Any X-Y Calculator tab on the data table section. This would change the data entry section
to the screenshot below.
Unlike RF-MW calculator, here you can enter literally any real numbers for X and Y values. Click
Add to insert this entry into data table. This entry is also graphed on the chart immediately.
Note
If you need to find the correlation of the logarithm of X and Y instead of just X and Y, visit the next
chapter Any log(X)-log(Y) calculator.
Similar to RF-MW Calculator, to delete one or more entries you need to highlight the row(s) and then
press Delete on your keyboard. In addition, to edit the X value or Y value, double click on the
corresponding cell to enter edit mode. Press Enter on your keyboard to commit the change and to
update the chart.
As soon as there are three entries or more, GCAS Desktop calculates the regression line and
correlation value. This chart updates automatically if there are entries removed or edited.
Page 222 of 388
GCAS® Desktop Manual Guide rev. 14
18.4
Any log(X)-log(Y) Calculator
Any X-Y Calculator has another option calculate the correlation of
log X (base-ten logarithm of X)
10
against log Y, instead of just X against Y. To use this option, switch the Correlation Calculator to Any
10
X-Y Calculator mode, then begin entering pairs of X and Y values as usual.
When you are done, tick the check box Take base-10 logarithm before calculating R 2. GCAS
Desktop computes the logarithm of both X and Y value in each pair, updates the chart, and finally
recalculates the regression line and the correlation (R2 value).
Note
This time, do not enter zero or negative numbers in any X values or any Y values. Logarithm of 0 yields
negative infinity and is not graphable. Logarithm of negative numbers are undefined. If GCAS Desktop
encounters zero, it will change it to one (1). If GCAS Desktop finds a negative number, GCAS Desktop
replaces it with the absolute value of that number.
Unticking the check box will revert this calculator tool to the regular Any X-Y Calculator mode.
Page 223 of 388
GCAS® Desktop Manual Guide rev. 14
Difference between regular X-Y correlation (top) and logarithmic X-Y correlation (bottom).
Page 224 of 388
GCAS® Desktop Manual Guide rev. 14
19 ISO 6976 Calculator
ISO 6976 Calculator is a tool to calculate the calorific value (CV), molar mass composition, Wobbe
index, relative density, and standard density of any given mole composition, as defined by ISO
6976:1995 standard.
Note
To use ISO 6976 Calculator, you need the GCAS feature ISO 6976 Calculator in your GCAS licence.
ISO 6976 calculation takes four inputs:
1.
Mole composition,
2.
Base pressure,
3.
Combustion temperature,
4.
Metering (base) temperature.
Mole composition input may come from a manual input or an existing record. Base pressure is
typically the atmospheric pressure (1 atm or 101,325 Pa). Combustion and metering temperature
affects the constants used in the calculation, therefore GCAS Desktop limits the available selection of
combustion-metering temperature pair into six pairs:
0°C / 0°C
15°C / 0°C (combustion temperature = 15°C, base temperature = 0°C)
25°C / 0°C
15°C / 15°C (the default)
20°C / 20°C
25°C / 20°C
19.1
The ISO 6976 Calculator Form
There are multiple ways to open ISO 6976 Calculator form:
1.
For one-time offline calculation: Go to the Tools menu on GCAS Desktop main window and
then select ISO 6976 Calculator. Through this menu, you will enter the mole composition by
hand (manual input) or through copy-and-paste.
2.
Sent by Mole Composition form. Open the desired mole composition record, go to the Action
menu, and select Send to ISO 6976 Calculator. If you have GCAS feature ISO 10723 as well,
choose which one to send either the single-point or the MLC. Through this method, ISO 6976
Calculator form uses the selected mole composition record.
3.
Sent by Calibration Gas Certificate. Open the desired calibration gas certificate, go to the
Action menu, and select Send to ISO 6976 Calculator. By this way, ISO 6976 Calculator form
uses the mole percentage portion of the selected calibration certificate.
4.
Sent by Data Analysis. Graph some mole composition trend, put the Data Analysis form in
selection mode, drag a selection rectangle, then right click the chart and select Send to ISO
Page 225 of 388
GCAS® Desktop Manual Guide rev. 14
6976 Calculator. Records inside the selection area are averaged and then sent to ISO 6976
Calculator form.
5.
Sent by Mole Composition Comparison. Load a range of records, then right click the
comparison chart and select either Send to ISO 6976 Calculator (Selection) or Send to ISO
6976 Calculator (Entire X-axis). The former requires a selection area while the latter doesn’t.
You may need to confirm which device(s)/stream(s) to be sent to ISO 6976 Calculator.
The grid on the left is the mole composition input. Grey cells are not editable. This grid contains all 15
gases from methane to decane, including neopentane. If you are to enter the composition manually,
be careful if your GC device does not read several gases (such as C6+ devices do not have heptane
through decane). Some GC devices do not read neopentane as well. In such cases, set the composition
of unavailable gases to zero. More details about inputting composition are on chapter 19.2.
At the top centre region of the form, set the base pressure and combustion-metering temperature
pair. When all inputs are correct, click Calculate.
Calculation results are displayed on the grid at the bottom region. In addition of five properties of ISO
6976 standard, the calculator also displays the compressibility factor (Z) of the input composition.
19.2
Ways to Enter Composition
Input composition can come from a manual input, copy-and-paste, or an existing record.
Page 226 of 388
GCAS® Desktop Manual Guide rev. 14
19.2.1
Manual Input
Go to the input composition grid. Press F2 or double click the cell to invoke edit mode. Then, type the
numbers. There is total row at the bottom of the grid. You might need to scroll the grid or resize the
form. This total row is updated everytime you finished editing a cell.
Take extra care about the gases your GC device doesn't read. For example, a C7+ device has no
octane, nonane, and decane. Some GC devices do not read neopentane too. Set the composition of
these unavailable gases to zero.
Click Reset to reset all numbers back to zero.
19.2.2
Normal Paste and Smart Paste
Copy a block of cells from Microsoft Excel or your favourite spreadsheet processing software, then
click Paste at ISO 6976 Calculator form. If your block of cells has one column, GCAS processes a
normal paste. If it has two, GCAS processes a smart paste.
Normal paste is like the Paste button on Microsoft Excel; it pastes the cells sequentially. Some
safeguards are cells containing non-number like alphabets will translate into zero, and negative
numbers are converted into positive.
Page 227 of 388
GCAS® Desktop Manual Guide rev. 14
Smart paste works for two-column data. First column must be the gas name. Second column is the
value. The good thing is, you don't have to worry about gas order as GCAS Desktop will reorder the
gases into the correct sequence. GCAS Desktop recognises the standard gas names (e.g. "Methane",
"Ethane", "i-Butane") as well as some well-known names (e.g. "Isobutane", "Pentane"—translated as
normal pentane or n-Pentane), and even their C-number notation. Gas names are not case-sensitive.
Having said that, these three blocks of cells below will work.
Page 228 of 388
GCAS® Desktop Manual Guide rev. 14
19.2.3
Load a Mole Composition Record
To use a mole composition record, we have two methods. Both require Live Data Analysis feature in
your GCAS licence.
First method as already described in chapter 8.9: Open a Mole Composition form, go to the Action
menu, and select Send to ISO 6976 Calculator.
Second method is described below.
1.
Go to the Tools menu > ISO 6976 Calculator on GCAS Desktop main window.
2.
While ISO 6976 Calculator window is open, select the device from your device panel or recent
device panel.
3.
Look under the input grid. Click Use a mole composition record of <device name>. The
<device name> follows the actual device you are selecting, and is updated whenever you
change the selected device on main window.
4.
19.2.4
That link opens a Select Record dialogue. Pick a record and click OK.
Load a Calibration Certificate
Open a Calibration Gas Certificate form, browse to the desired certificate, the go to the Action menu
and select Send to ISO 6976 Calculator. The ISO 6976 Calculator form shall load the mole
percentage portion of the calibration certificate.
Page 229 of 388
GCAS® Desktop Manual Guide rev. 14
19.3
Add Description
Description is an optional text for presentation purpose only. When there are multiple ISO 6976
Calculators open at the same time, add a text description to each of them hence you can easily
identify which is which.
Open the Action menu and select Show Description Box. This reveals a text box above the output
section of the form. Enter any description to this text box. To hide this text box, open the Action menu
and clear the check mark on Show Description Box.
Description text is used when you are switching windows through the Window menu on the main
menu bar, and when you are comparing two ISO 6976 Calculators. GCAS Desktop automatically fills
the description text for cases where ISO 6976 Calculator is opened through a Send to shortcut from
Data Analysis or Mole Composition Comparison.
19.4
Compare Two ISO 6976 Calculators
Ever wondered how much is the difference of CV between two ISO 6976 Calculators? Wonder no
more. Starting from GCAS Desktop version 1.7.3.0, ISO 6976 Calculator has been equipped with a
Page 230 of 388
GCAS® Desktop Manual Guide rev. 14
comparison tool. Probably the most common use for comparing two ISO 6976 results is when you are
calculating how much the CV difference is between single-point mole composition stream and its
multilevel-calibration counterpart.
To make a comparison, first add description to each ISO 6976 Calculator form you wish to compare.
Next, go to the Action menu and select Compare To, then choose the target ISO 6976 Calculator form
which appeared on the submenu. If you didn’t add description, the submenu simply says “(no
description)”. It will become problematic if there are three or more ISO 6976 Calculators open and
none of them has description.
This is the ISO 6976 Comparison form. It compares all ISO 6976 outputs between the two calculator
forms. Left column is the ISO 6976 Calculatorwhich initiated comparison, let’s call it A. The right
column is the ISO 6976 Calculator selected as comparison target, let’s call it B. Then you get the delta
(difference) which is A minus B, and finally the delta expressed in percentage relative to A. Units in ISO
6976 Comparison form follows the ISO 6976 Calculator, like the CV is still in MJ/m 3.
Page 231 of 388
GCAS® Desktop Manual Guide rev. 14
GCAS Desktop displays a warning if the two ISO 6976 Calculators did not have the same base pressure
and combustion-metering temperature pair. Correct the mistake in the ISO 6976 Calculator (parent)
form, click Calculate on the parent form to recalculate using the new pressure or temperature value,
and finally click Refresh on ISO 6976 Comparison to re-compare.
Page 232 of 388
GCAS® Desktop Manual Guide rev. 14
20 ISO 6976 Trend
ISO 6976 Trend is a module to plot historical ISO 6976 output values over time. This module should
not be confused with Uncertainty Trend which graphs the uncertainty of ISO 6976 outputs. ISO 6976
Trend takes a collection of mole composition records and performs ISO 6976 calculation on each of
them using the same parameters, and finally displays the trend on a line chart.
Note
This module will require GCAS feature ISO 6976 Trend to be included in your GCAS licence.
20.1
The ISO 6976 Trend Form
Select the desired GC device on device panel or recent device panel, and then go to the View menu >
ISO 6976 Trend. Similar to Data Analysis, ISO 6976 Trend form has three sections: parameters, chart,
and comments.
20.2
ISO 6976 Properties
Page 233 of 388
GCAS® Desktop Manual Guide rev. 14
Check boxes on this list controls which ISO 6976 outputs to show. Typically only one output is
displayed because values of one ISO 6976 output are far apart from other ISO 6976 outputs.
Set the base pressure and the combustion-metering temperature pair. These properties are used to
calculate ISO 6976 outputs throughout the entire plot range. Default base pressure is one atmospheric
pressure. There are six combustion-metering temperature pairs supported:
-
0°C / 0°C,
-
15°C / 0°C,
-
25°C / 0°C,
-
15°C / 15°C,
-
20°C / 20°C,
-
25°C / 20°C.
20.3
Plot Range and ISO 10723 Conversion
These options control which data source to feed into ISO 6976 calculator inside ISO 6976 Trend. Set
the date and time range as well as the stream number and finally click
may take a while to plot the complete chart. GCAS Desktop provides
halt the operation (or press F7) and
Refresh to start graphing. It
Pause button to temporarily
Stop button (or press Esc) to abort the calculation.
Page 234 of 388
GCAS® Desktop Manual Guide rev. 14
ISO 6976 Trend form, calculation in progress. Dots disappear after 100 data points.
GCAS Desktop determines which stream numbers available based on the existing mole composition
records and mole composition streams configuration in Modbus register mappings. Nevertheless if
the desired stream number is not listed on this dropdown, just type the number manually and hit
Refresh.
If you have ISO 10723 feature included in your GCAS licence, you shall see an additional dropdown for
ISO 10723 conversion. This dropdown controls whether the underlying mole composition records
should be converted to single-point or to multilevel-calibrated values prior to ISO 6976 calculation.
Note that non-convertible records will produce gaps on the ISO 6976 trend chart. In addition, you can
select Don’t convert if you have a slow connection and you are confident that the mole composition
records are all-single-point or all-MLC. Choosing this option will bypass all ISO 10723 prerequisites
which usually takes a long time to load over a slow network.
Under the ISO 10723 dropdown, there is a link named Compare both. This link calls ISO 6976 Trend
Comparison tool and tells it to compare ISO 6976 trend based on single-point mole composition
records versus the trend based on multilevel-calibrated mole composition records. It requires an
additional GCAS feature Data Comparison.
Page 235 of 388
GCAS® Desktop Manual Guide rev. 14
20.4
Mean and Standard Deviations
Mean and standard deviations are calculated based on all data points currently appearing on current
ISO 6976 trend chart. Tick this check box to reveal the mean and twice the standard deviation lines.
GCAS Desktop cannot show mean and standard deviation lines for previous chart, they are for current
chart only. Mean and standard deviations will not show if there are multiple ISO 6976 output trends in
the chart.
Next to the check box, you see a link called View summary. This link generates statistical summary for
the entire X-axis. To generate summary on a certain portion of X-axis, switch to selection mode and
use the right-click menu instead.
Page 236 of 388
GCAS® Desktop Manual Guide rev. 14
Note if you opted to show previous chart as well, this summary includes the difference between
current chart and previous chart.
20.5
Save or Copy the Chart
To save the chart as image file, right click on the chart and select Save Chart as Picture.
Page 237 of 388
GCAS® Desktop Manual Guide rev. 14
Similarly to copy the chart into clipboard, right click and select Copy Chart Image. Then you may
paste the image onto Microsoft Paint, Microsoft Word, or any software that accepts bitmap image.
20.6
Comparing Previous Chart
ISO 6976 Trend form remembers the last ISO 6976 trend chart before you changed something. By this
way, you can quickly compare current ISO 6976 trend versus the one before parameter change.
Typical use of previous chart is to compare calorific value (CV) based on single-point mole
compositions versus CV based on multilevel-calibrated mole compositions. To do so, first graph ISO
6976 trend with ISO 10723 dropdown set to single-point. Next, change the ISO 10723 option to
multilevel-calibrated and hit
Refresh to graph the ISO 6976 trend on MLC. Finally, click
Show
previous chart button. Current chart (dark blue) is the CV based on MLC compositions, while previous
chart (light blue) is the CV based on single-point compositions.
Page 238 of 388
GCAS® Desktop Manual Guide rev. 14
Example of a bad GC. Current CV (dark blue) is based on multilevel-calibrated compositions, while
previous CV (light blue) is based on single-point compositions. If these two drift too far apart, this
indicates problems within the GC. A good GC should have these two be really close or even co-incide.
Be reminded that only one previous chart is cached. If you change a parameter the third time, first
chart graphed is lost when you click
20.7
Refresh.
Zoom Mode and Selection Mode
These radio buttons control whether ISO 6976 Trend form is in zoom mode or in selection mode.
In zoom mode, drag a rectangle on a region you would like to zoom.
Page 239 of 388
GCAS® Desktop Manual Guide rev. 14
Pan the chart using the provided scroll bars. Drag another rectangle to zoom in further. To zoom out
one step, click on the circled minus button Θ on both scroll bars. To zoom all-out, simply press the
Home button on your keyboard or right-click on the chart and select Zoom All Out submenu.
In selection mode, drag a rectangle to create a selection area. Right click the chart and you see several
menus are now available. Chapter 20.8 Selection Mode Menus will explain the function of each menu.
To clear selection area, right click the chart and select
Clear Selection Area.
Page 240 of 388
GCAS® Desktop Manual Guide rev. 14
20.8
Selection Mode Menus
Assuming the chart is on selection mode and you have a selection rectangle, these menus are
available.
Menu
What it does
Zoom In Here
Zooms in to the selection rectangle.
Generate Summary Here
Generates statistical summary for all data points inside the
selection rectangle.
-
If you activate previous chart alongside current ISO 6976 trend
chart, the summary also includes differences between the two.
-
GCAS Desktop looks at the X-axis range only. Data points
excluded by the selection rectangle (having Y-axis values
outside of selection rectangle) are also included for statistical
calculation.
Frame This Selection
Literally puts a rectangular frame around the selection area, for
presentation purpose only.
Remove Frames
Removes all rectangular frames created through Frame This
Selection menu.
Set Underlying Mole
As it says, this menu sets all underlying mole composition records
Composition Records as
within the selection area as inactive. Once it's done, the ISO 6976
Inactive
trend chart will have a gap on it and the mean/standard deviation
values are invalidated. Refresh the chart to get the correct values.
Page 241 of 388
GCAS® Desktop Manual Guide rev. 14
20.9
Other Visual Cues
Set the chart to zoom mode. Click anywhere on the chart to place these crosshair cursors. These
dotted pair of line acts as a ruler to compare Y-axis values between several data points. To remove
them, click
Hide crosshair cursors.
Hover your mouse pointer over a data point to show a tooltip about its value.
Or click
Show values to display values on labels.
Page 242 of 388
GCAS® Desktop Manual Guide rev. 14
If you need higher precision, right click the chart and tick Use 8-Decimal Precision on Labels. Untick
this menu to revert back to 4-digit decimals.
In case of current ISO 6976 line and previous ISO 6976 line are so close together, click
Use thin
lines to draw the chart using 1-pixel width lines.
20.10 Export Values to Microsoft Excel
Once the chart has been graphed completely, click
Copy to Microsoft Excel. This button opens a
new Excel worksheet. Then GCAS Desktop writes all data points of all line charts onto this worksheet.
Page 243 of 388
GCAS® Desktop Manual Guide rev. 14
Note
This feature requires Microsoft Excel 2010, 2013, 2016 or later, to be installed.
GCAS Desktop writes all five ISO 6976 outputs to Microsoft Excel worksheet—both current ISO 6976
trend and previous ISO 6976 trend values. If there is no previous chart graphed before, previous ISO
6976 trend values are all blanks. No worries, you can export to Microsoft Excel even if current ISO
6976 trend chart has a different date/time range than the previous chart.
20.11 Insert Comment
To view or write comments, open the Comments tab.
Write your comment and set the appropriate date of topic, then click Submit. Your comment will have
a yellow background to distinguish it from comments by other users. Date of topic is an additional
information of which mole composition record you are writing your comment for, thus other users
know the correct data point to refer to.
Page 244 of 388
GCAS® Desktop Manual Guide rev. 14
Make sure that the comment is correct e.g. free from spelling errors, because once submitted you
would not be able to edit nor remove your comment.
To refresh comments, click the same
Refresh button.
If you do not see the text box to write your comment, i.e. you only see the comment grid, your GCAS
user account doesn't have the action permission to write comment in ISO 6976 trend. Contact your
GCAS administrator.
Page 245 of 388
GCAS® Desktop Manual Guide rev. 14
21 ISO 6976 Trend Comparison
ISO 6976 Trend Comparison is a tool to compare ISO 6976 trends across devices. It is a part of Data
Comparison feature, which stands in line after Mole Composition Comparison. Do not confuse ISO
6976 trend comparison with ISO 6976 comparison. The former is what we are going to talk in this
chapter, while the latter is a bonus feature of ISO 6976 Calculator.
Note
This module requires two GCAS features to be included in GCAS licence: ISO 6976 Trend and Data
Comparison.
21.1
The ISO 6976 Trend Comparison Form
To open ISO 6976 Trend Comparison form, go to the Tools menu > ISO 6976 Trend Comparison.
Similar to Mole Composition Comparison form, ISO 6976 Trend Comparison form has two resizable
sections. Parameters are at the top, chart is at the bottom. This form is designed with similar UI
experience with Mole Composition Comparison therefore users can use it straight away without
reading this chapter further.
Page 246 of 388
GCAS® Desktop Manual Guide rev. 14
21.2
Parameters and Device List
The top section of the form has a linear flow. Select what ISO 6976 output you need, the comparison
date range, and ISO 6976 properties (❶), then browse the devices to compare (❷) and add them to
the comparison list (❸), select which stream of these devices (❸) and finally click Go (❹) to start
graphing.
21.2.1
Plot Range and ISO 6976 Properties
First thing first, select which ISO 6976 output to compare. The default selection is calorific value (CV),
but other options are molar mass sum, Wobbe index, relative density, and standard density. Going
down, there are date and time pickers to set the plot range. Scroll down once more and you see the
ISO 6976 properties (base pressure and combustion-metering temperature pair).
Default base pressure is the atmospheric pressure (1 atm). GCAS Desktop supports six combustionmetering temperature pairs, which are
0°C / 0°C
15°C / 0°C (combustion temperature = 15°C, base temperature = 0°C)
25°C / 0°C
15°C / 15°C (the default)
20°C / 20°C
25°C / 20°C
Page 247 of 388
GCAS® Desktop Manual Guide rev. 14
21.2.2
Devices and Comparison List
Device tree view is on the left. It lists all your workspaces and devices within each workspace. The grid
on the right is known as comparison list.
Hover your mouse pointer over a device to view more information about data availability and stream
numbers. In the screenshot below, the device Test6 has only one stream number: stream 1. ISO 6976
calculation is based on mole composition records, hence devices which don't have mole composition
records at all are displayed as semi-transparent and cannot be added to the comparison list.
To compare devices, add the devices from the device tree view to the comparison list. Either select the
device then click Add, or double click the device, or drag the device and drop it onto comparison list.
Note
An ISO 6976 Trend Comparison form which was opened via Send to shortcut from Mole Composition
Comparison's Send to ISO 6976 Trend Comparison button or right-click menu, as well as through the
Compare both link on ISO 6976 Trend form; is locked to a certain number of comparison entries.
Device tree view is empty and you cannot add another device into comparison list. The text above the
Page 248 of 388
GCAS® Desktop Manual Guide rev. 14
chart should clearly indicate the form is locked. Click Reset and reload device list next to this text in
order to unlock ISO 6976 Trend Comparison form back into normal mode.
Once the device has been added to the comparison list, select the stream number. ISO 6976 Trend
Comparison form reads the mole composition records for this stream number. You can compare ISO
6976 trend values coming from different streams of the same device too. To do so, add the device to
the comparison list twice, then select different stream number for each of them. Moreover if you have
ISO 10723 feature in your GCAS licence, this tool can also compare the ISO 6976 trend values based
on single-point composition vs. multilevel-calibrated composition of the same device, same stream
number.
Example of comparison list for users without ISO 10723 (left) and with ISO 10723 (right).
The column Show? contains check boxes which is used to hide or show the line chart of
corresponding comparison entry after the chart has been rendered completely. Before you click Go,
these check boxes have no effect.
Users with GCAS feature ISO 10723 in their GCAS licences see an additional column named MLC?
which also contains check boxes. This is the single-point/MLC switch. Tick the check box to graph ISO
6976 trend based on multilevel-calibrated composition, otherwise leave it unticked to graph ISO 6976
trend based on single-point composition.
To remove an entry from the comparison list, highlight its row on the grid and then click Remove or
press Delete on your keyboard. Everytime a comparison entry is removed from the comparison list,
its line chart is also removed. However if you add it back, you need to redraw the chart because its
data in the cache has already gone. This is the difference between removing an entry versus
temporarily hiding it (by unticking the check box inside the Show? column). In addition, click Remove
all to empty the comparison list and start over.
Note
Maximum number of entries in comparison list is 15 entries.
Page 249 of 388
GCAS® Desktop Manual Guide rev. 14
GCAS Desktop will alert you if there are duplicate comparison entries. A duplicate means same GC
device + same stream number [+ same MLC/single-point switch if you have ISO 10723].
21.2.3
Start Graphing
When you are ready, click Go. GCAS Desktop loads the required mole composition data, calculates
their ISO 6976 values, and renders the chart. The Go button turns into Refresh button unless you
change the selected ISO 6976 output, ISO 6976 properties, comparison date range, devices, stream
numbers, or single-point/MLC switch.
Users with ISO 10723 feature in their licences see an additional command link Clear MLC cache. This
clears the cache used by ISO 10723 conversion. The cache contains MLC coefficients, calibration
certificates, single-point RF, MLC RF, and MLC constraints. Click this link if you notice the ISO 6976
trends based on multilevel-calibrated streams are not correct. Once the MLC cache is emptied, refresh
the chart.
The chart legend lists the device tag name and the stream numbers. Multilevel-calibrated streams are
indicated with asterisk (*) after stream number similar to the green line in this screenshot example.
Page 250 of 388
GCAS® Desktop Manual Guide rev. 14
21.3
Comparison Chart
The chart graphs ISO 6976 output values based on mole composition records over time. This chart has
maximum capacity of 15 comparison entries. The legend at your right hand side tells the devices and
their stream numbers. Multilevel-calibrated streams (ISO 10723) are indicated with asterisk (*) after
their stream numbers.
By default, GCAS Desktop draws the chart using thin lines, unlike all other charts in GCAS Desktop
which use 2-pixel width. Line charts having data points less than 100 have small dot markers along its
body. Line charts with more than 100 dots are presented without markers like similar to screenshot
above.
Page 251 of 388
GCAS® Desktop Manual Guide rev. 14
21.3.1
Show or Hide Some Devices
To temporarily take a comparison entry off the chart, untick its check box at the column Show? inside
the comparison list. Check the check box to bring the line visible.
If you remove a device or stream from this list, its line chart is also removed. After you add the device
or stream back, you need a full refresh to redraw the lost line.
21.3.2
Zoom Mode and Selection Mode
Click this button to switch between zoom mode and selection mode.
Page 252 of 388
GCAS® Desktop Manual Guide rev. 14
Toggle button to switch between zoom or selection mode.
Zoom mode enables zooming to a specific area of the chart. Drag a rectangle over the area you want
to zoom in. Pan around the chart using the provided scroll bars. Drag another rectangle to zoom in
further. To zoom out, click the circled minus button Θ on both scroll bars. Press Home on your
keyboard or right click the chart and select Zoom All Out to undo all zoom-in operations.
Selection mode lets you create a selection area on the chart, then makes some context menu
available to manipulate the data inside this selection area. Chapter 21.3.5 explains the function of each
menu. To clear selection area, right click the chart and select
21.3.3
Clear Selection Area.
Save or Copy the Chart
To save the chart as image file, right click the chart and select Save Chart as Picture. Or if you prefer
copying the image directly onto Microsoft Power Point for example (or any software accepting bitmap
image), right click the chart and select Copy Chart Image.
Page 253 of 388
GCAS® Desktop Manual Guide rev. 14
21.3.4
Export Values to Microsoft Excel
Above the chart, located at the rightmost button, click
Copy to Microsoft Excel. This button
opens a new Excel worksheet. Then GCAS Desktop writes all data points of all line charts available
onto this worksheet.
Note
This feature requires Microsoft Excel 2010, 2013, 2016 or later, to be installed.
GCAS Desktop prevents you from exporting to Excel if there are duplicate comparison entries.
Every device or stream in comparison list has its own column and the rows are timestamps. If there are
two or more data points from different devices or streams sharing the exact same timestamp, they are
merged into one row in Excel worksheet.
Page 254 of 388
GCAS® Desktop Manual Guide rev. 14
21.3.5
Selection Mode Menus
These menus are available if ISO 6976 Trend Comparison form is in selection mode and there is a valid
selection rectangle on the chart. Similar to Mole Composition Comparison, ISO 6976 Trend
Comparison requires a contiguous selection area. If there are several data points leaking out of your
selection rectangle, GCAS Desktop alerts you while proposing a new selection area.
Page 255 of 388
GCAS® Desktop Manual Guide rev. 14
Menu
Function
Zoom In Here
Zooms in to the selection area.
Generate Summary Here
Generates statistical summary for the selected area.
Compare Averages
Prompts you to select two comparison entries out of whichever
(Selection)
available inside the selection area; then compares the average of the
two, giving you the delta and difference in percentage. See chapter
21.3.6 for details.
Compare Averages (Entire X-
Prompts you to select two comparison entries out of all lines
axis)
available on the chart; then compares the average of the two, giving
you the delta and difference in percentage. This menu does not even
need a selection area. See chapter 21.3.6 for details.
Frame This Selection
Literally puts a rectangular frame around the selection, for
presentation purpose.
This works on the average chart too.
Remove Frames
Deletes all frames created through Frame This Selection menu.
Set Underlying Mole
As ISO 6976 calculation is based on mole composition records, this
Composition Records as
menu sets the underlying mole composition records contained
Inactive
inside the selection area as inactive. You need to refresh the chart
afterwards. If your selection rectangle covers more than one line
chart, GCAS Desktop prompts you to select which ones to set as
inactive.
These menus Compare Averages (both of them) and Set Underlying Mole Composition Records as
Inactive may display a confirmation dialogue like the ones below. Setting mole composition records
as inactive should merge a pair of single-point and MLC entries of the same device same stream
number into one entity. Average comparison requires you to select exactly two entries.
Confirmation dialogue boxes. (Windows 10 does not render form border for small dialogues)
21.3.6
Comparison of Averages
21.3.6.1 The 'Average' Chart
For a rough visual comparison, ISO 6976 Trend Comparison form provides an additional bar chart that
shows the average value of every comparison entry. Click Show average button (the one having 𝑥̅
Page 256 of 388
GCAS® Desktop Manual Guide rev. 14
symbol) to reveal this chart. The average value of each bar is displayed on the label sitting at the top
end of the bar.
21.3.6.2 'Compare Averages' Menu
Sometimes users need a more detailed information of how two comparison entries differ to each
other. To do this, switch the chart to selection mode. Afterwards, either make a selection rectangle
and right click then choose Compare Averages (Selection), or right click without a selection and
select Compare Averages (Entire X-axis). If your chart or selection rectangle contains more than two
lines, you are prompted to select two among them.
Page 257 of 388
GCAS® Desktop Manual Guide rev. 14
Next, GCAS Desktop builds a comparison and displays them on a text viewer window similar to this
one below.
First row is the comparison. First column is the first comparison entry which was selected on the
previous dialogue box, let's call it A. Next column is the second comparison entry, let's call it B. Then
the delta is A minus B, and finally you get absolute difference in percentage relative to A.
Page 258 of 388
GCAS® Desktop Manual Guide rev. 14
Second row contains number of data (N) used to calculate the average. The reason is ISO 6976 Trend
Comparison form can compare ISO 6976 trends between devices, and each GC device may not have
the same number of data.
21.3.7
Other Visual Cues
By default, GCAS Desktop draws the chart using a thin line. The toggle button
Use thin lines is
pressed by default. If you prefer the usual thick lines, click this button to raise it from its pressed state.
Click
Show values or right click the chart and select Show Values to display the ISO 6976 values.
GCAS Desktop presents a warning if one or more devices have over 100 dots on the chart. We do not
recommend to display value labels on line charts with over 100 dots because it will clutter the chart
area.
This is how the chart would look like if the user clicked Yes anyway.
These dashed lines are called cursors. Cursors appear when you click on a chart or as a remnant of
zoom operation. Cursor may act as a ruler line to compare Y-axis values of two data points. Click
Hide crosshair cursors or right click the chart and select Hide Crosshair Cursors to hide these lines
from view.
Page 259 of 388
GCAS® Desktop Manual Guide rev. 14
21.3.8
Colourblind Assistance
To aid users with colour blindness (protanopia and deuteranopia), GCAS Desktop provides an
alternative colour scheme for the chart. Use the
Colourblind assist button to switch colour
scheme.
ISO 6976 trend comparison chart with colourblind assist turned on.
Colourblind assistance works better if you use
thick lines because thick lines have subtle shadow to
aid the user distinguishing the yellow line and white background.
Page 260 of 388
GCAS® Desktop Manual Guide rev. 14
22 ISO 10723
ISO 10723:2012 is a standard method used to adjust values in non-linear GC devices. Support for ISO
10723 first came in GCAS Desktop version 1.6.0.0. We gradually added more features and modules
and finally full support of ISO 10723 was completed in version 1.7.3.0. With ISO 10723, GCAS Desktop
makes a differentiation between single-point and multilevel-calibrated (MLC) response factor and mole
composition.
All subchapters in this chapter assume you have GCAS feature ISO 10723 included in your licence.
22.1
MLC Coefficients (Concept)
Multilevel calibration coefficients (abbreviated MLC coefficients) are the coefficients of the analysis
function as described in ISO 10723 standard. Similar to uncertainty coefficents, although not about the
same meaning, MLC coefficients consist of four coefficients. These four come from the equation
𝑦 = 𝑎 + 𝑏𝑥 + 𝑐𝑥 2 + 𝑑𝑥 3
where y is multilevel-calibrated peak area, x is single-point peak area, and a, b, c, d are the MLC
coefficents. Coefficient a and b are mandatory, and also b must not equal to zero. Coefficient c and d
are not always present in the analysis function, depending on the GC.
The term coefficient set refers to collection of MLC coefficients for all gases. Every gas has their own
analysis function/equation, thus has their own coefficents. These coefficients are bundled together
into one record of MLC coefficient set in GCAS database.
22.2
MLC Constraints (Concept)
Multilevel calibration constraints (abbreviated MLC constraints) are a set of rules to determine which
root to use in polynomial MLC to single-point conversion. The opposite direction, single-point to MLC
conversion, doesn’t need constraints. MLC constraints consist of linear constraint, quadratic constraint,
and cubic constraint. Recall the equation of analysis function:
𝑦 = 𝑎 + 𝑏𝑥 + 𝑐𝑥 2 + 𝑑𝑥 3
During MLC to single-point conversion, the task is “given this y value, find x that satisfies this
equation”. A polynomial function may have several roots (solutions) therefore MLC to single-point
conversion require constraints to select the correct root. On the other hand, single-point to MLC
conversion is much easier. “Find y, given this x value” means GCAS Desktop simply subtitues the x and
evaluate the function to get y.
Page 261 of 388
GCAS® Desktop Manual Guide rev. 14
Linear constraint
If the coefficient c and d are zero, the equation becomes
y = a + bx which is linear. Linear functions are guaranteed to
have one root, however it can be negative.
Linear constraint tells GCAS Desktop to disregard the negative
root (then set x into zero), or to take absolute value in order to
make the x positive. The default is to reject (disregard) negative
root.
Quadratic constraint
If the coefficient d is zero, the equation becomes
y = a + bx + cx2 which is quadratic. Quadratic functions may
have two real roots, one real root, or no real roots at all
(solution is imaginary root).
GCAS Desktop always disregards imaginary root and sets x to
zero, as well as any real roots which are negative. But in cases
of one or two positive roots, quadratic constraint tells GCAS
Desktop to use either the smallest positive or largest positive.
The default is to use the smallest positive.
Cubic constraint
If all the coefficients are non-zero, the equation is cubic. Cubic
functions may have one real root (+ 2 imaginaries), two real
roots, or three real roots. Even though every possibility
contains real roots, the roots may be negative. GCAS Desktop
always rejects negative real roots. That leaves the positive ones,
which are subject to the constraints described below. One
exception: if all roots are negative, GCAS Desktop sets the x
into zero.
GCAS Desktop has different cubic constraint depending what
type of record is being converted. For response factor, GCAS
Desktop offers four choices:
1.
Use the smallest positive,
2.
Use the largest positive,
3.
Use the one which yields a single-point RF value inside a
range, or
4.
Use the one which yields a single-point RF value inside or
closest to a range.
Page 262 of 388
GCAS® Desktop Manual Guide rev. 14
If you choose option 3 or 4, you have to set the range’s lower
and upper bound. The default is between 500,000 and
15,000,000 because typical single-point RF values fall between
that range.
For mole composition, GCAS Desktop offers another four
choices:
1.
Use the smallest positive,
2.
Use the middle one if there are 3 roots, or smallest one if
there are 2 roots,
3.
Use the middle one if there are 3 roots, or largest one if
there are 2 roots, or
4.
Use the largest positive.
In both cases, the default cubic constraint is option 1.
Most of the time, you don’t have to worry about MLC constraints. As far as we tested, the default
constraint has worked for vast, vast majority of RF and mole composition records. There is a tiny tiny
chance the default constraints do not produce the expected result, which in this case you need to
override the MLC constraints. Visit chapter 22.3 to read more about levels of MLC constraints override,
or chapter 22.5 for how to actually override the MLC constraints.
22.3
MLC Constraints Override Level (Concept)
MLC constraints have a scope. From the most generic
to the most specific, the order of scopes are global,
device, coefficient, and record.
Global constraints are hardcoded inside your GCAS
database. The factory values are reject negative root
for linear functions, use smallest positive for quadratic
functions, and use smallest positive for cubic
functions—although you can change these global
constraints if required. Second level of override is device-level. All ISO 10723 conversions on this
device will use these MLC constraints instead of global constraints. Third level of override is
coefficient-level. All records using a particular MLC coefficient set shall use these constraints instead
of the device-level constraints. But records using another MLC coefficient set will use another
coefficient-level constraints if that coefficient set has one, or fall back onto device-level if not. Fourth
level is record-level. On this level, the MLC constraints apply to that record only. Other records may
have either their own record-level constraints, or fall back onto coefficient-level.
While GCAS Desktop is converting from MLC records to single-point, GCAS Desktop loads MLC
constraints from the most specific which is at record-level. If current record has no record-level
Page 263 of 388
GCAS® Desktop Manual Guide rev. 14
override, GCAS Desktop moves down one step and look for coefficient-level override. If the MLC
coefficients used by this record has no overridden MLC constraints, GCAS Desktop moves down one
step again and look for device-level override. If current GC device has no MLC constraints defined
either, then GCAS Desktop falls back to the global MLC constraints.
22.4
The Multilevel Calibration Coefficients Form
Multilevel Calibration Coefficients form, abbreviated as MLC Coefficients form, is a form to enter or edit
MLC coefficients of a GC device. Select the desired device from your device panel or recent device
panel, then go to View menu > Multilevel Calibration Coefficients.
22.4.1
Click
View Previous Coefficient Sets
Browse another set at the top of the form. This button shows the Select a coefficient set
dialogue. Select the desired coefficient set then click OK or double click on the list item.
Page 264 of 388
GCAS® Desktop Manual Guide rev. 14
You can always return to the latest coefficient set through
22.4.2
Load latest set button.
Edit Mode
In order to edit the coefficients or the description, you need to put MLC Coefficients form in edit
mode. Open the Action menu and select Edit Mode. You know the form is on edit mode when you
see
pencil icon, some labels are coloured orange, and there is a Save button at the top region of
the form.
Page 265 of 388
GCAS® Desktop Manual Guide rev. 14
During edit mode, you can edit the numbers in the grid. Date of test field at the top and Description
text box at the bottom of the form also become editable.
Note
Edit mode is mainly intended for editing the description or correcting minor mistakes. If there are too
many coefficients to edit, we suggest you to create a new set and set this record to inactive instead.
MLC Coefficients form does not have comment feature. Put short comments in the description text
box if you like.
You can paste the coefficient numbers from Microsoft Excel or other spreadsheet editing software, as
long as there are 4 columns and equal number of rows. Click Paste link above the grid to paste the
numbers. The Reset link resets all numbers in the grid back to zero.
When you finished editing the numbers and the description, click Save button or go to Action menu >
Save Changes to commit the change. The form exits its edit mode and becomes read-only again.
Page 266 of 388
GCAS® Desktop Manual Guide rev. 14
Otherwise to cancel editing and discard all of your changes, open Action menu and select Edit Mode
again to remove its tick mark. This will exit edit mode and reload the coefficient set from the database.
22.4.3
Create New Coefficient Set
From an open MLC Coefficients form, open the Action menu and select New Coefficient Set. This
menu creates a blank coefficient set (all zeroes) with the timestamp set to current computer time.
Begin entering the coefficient values one by one. Be alert for potential human error. Alternatively, you
can paste the coefficients from Microsoft Excel or other spreadsheet editing software as long as there
are 4 columns and equal number of rows. Click Paste to do so.
Page 267 of 388
GCAS® Desktop Manual Guide rev. 14
Don’t forget to set the date of test. This is the date information of when the multilevel calibration
was conducted, not the date of when the coefficients were entered.
Write the description. It is a good practice to provide a description about this coefficient set.
When you are finished, click Save button or go to the Action menu > Save Changes to save these
coefficients into database. Otherwise to cancel all of these, go to the Action menu > Edit Mode to
remove its tick mark. The form will revert to the last record viewed.
22.4.4
Change Record Status
Like other types of record in GCAS database, MLC coefficient set has a status bit indicating whether
the record is active or inactive. Inactive coefficient sets are not used for MLC conversions, thus GCAS
Desktop will look further backward to find the previous active coefficient set.
To change status, open the Action menu and select Set Status. This menu brings the Set Status
dialogue where you can flip the status bit from active to inactive or vice versa.
Page 268 of 388
GCAS® Desktop Manual Guide rev. 14
Click OK and GCAS Desktop will update the new status which then instructs the MLC Coefficients form
to reload the set with the new status.
22.5
Overriding MLC Constraints
Chapter 22.2 already explained what MLC constraints are, and chapter 22.3 explained four levels of
MLC constraints. This chapter explains how to actually override MLC constraints if the global or
predefined constraints produce nonsensical RF or mole composition values.
22.5.1
Overriding Constraints for Footprint/Calibration Data
From an open Footprint form or Calibration Data, open the Action menu, select ISO 10723, then select
Change MLC Constraints. The MLC Conversion Constraints (RF) dialogue appears.
Page 269 of 388
GCAS® Desktop Manual Guide rev. 14
Make changes as necessary. In this screenshot example, we are changing the cubic constraint as well
as changing the target RF value range. When you click OK, GCAS Desktop presents you another
dialogue asking which override level these new constraints are about to be applied.
From top to bottom, each radio button corresponds to global constraints, device-level, coefficientlevel, and finally record-level. Make a decision then click OK. The Footprint or Calibration Data form
will reload the record and you may see the RF chart is now different from the previous one. If not, try
another constraint values.
Page 270 of 388
GCAS® Desktop Manual Guide rev. 14
Note
Each option in this dialogue box requires its own action permission. The GCAS administrator has
authority to assign which user roles can change global constraints, device-level, coefficient-level, or
record-level. For example, an administrator may prohibit regular users to change global and devicelevel constraints, but permit them to change coefficient-level and record-level constraints. If your
administrator didn’t grant you permission for a specific override level, its radio button will be disabled.
Ultimately if no permissions are given, you will not see Change MLC Constraints in the Action menu
from the beginning.
Which override level should I apply to?
Be careful with the first option in Apply Constraints dialogue box. Yes, that option means you are
changing the value of global constraints. All other devices in the same GCAS database will use the new
constraint values you just specified.
Condition
Recommended override level
You are unsure whether the new constraints would
Record-level
produce unwanted side-effects on other records.
Some records are broken, while some others are
Coefficient-level if those broken records use
not.
the same MLC coefficients, otherwise apply
record-level override to each of those one by
one.
All records are broken, but records on other GC
Device-level
devices are not.
All records are broken, regardless of what GC device
Global
they belong to. (A very ultra-rare case)
(Also check all MLC coefficient values for potential
22.5.2
mistakes.)
Overriding Constraints for Mole Compositions
Many operations involving multilevel-calibrated mole compositions such as Data Analysis (MC value
trending), uncertainty calculation, and ISO 6976 calculation, automatically load MLC constraints. Their
MLC constraint overrides are set through Mole Composition form.
Open Mole Composition form, then browse to the desired record. Or if you plan to apply coefficientlevel override, browse to any record which is using the MLC coefficient set in question. Then open
Action menu, select ISO 10723 and then Change MLC Constraints. The menu brings the MLC
Conversion Constraints (MC) dialogue.
Page 271 of 388
GCAS® Desktop Manual Guide rev. 14
Change the constraints as necessary by paying attention to which gas that causes silly values followed
by which degree of polynom the MLC coefficients of that gas is. Click OK and GCAS Desktop presents
the familiar Apply Constraints dialogue box. Select an override level and hit OK again to commit.
Page 272 of 388
GCAS® Desktop Manual Guide rev. 14
Note
Each option in this dialogue box requires its own action permission. The GCAS administrator has
authority to assign which user roles can change global constraints, device-level, coefficient-level, or
record-level. For example, an administrator may prohibit regular users to change global and devicelevel constraints, but permit them to change coefficient-level and record-level constraints. If your
administrator didn’t grant you permission for a specific override level, its radio button will be disabled.
Ultimately if no permissions are given, you will not see Change MLC Constraints in the Action menu
from the beginning.
Which override level should I apply to?
Be careful with the first option in Apply Constraints dialogue box. Yes, that option means you are
changing the value of global constraints. All other devices in the same GCAS database will use the new
constraint values you just specified.
Condition
Recommended override level
You are unsure whether the new constraints would
Record-level
produce unwanted side-effects on other records.
Some records are broken, while some others are
Coefficient-level if those broken records use
not.
the same MLC coefficients, otherwise apply
record-level override to each of those one by
one.
All records are broken, but records on other GC
Device-level
devices are not.
All records are broken, regardless of what GC device
Global
they belong to. (A very ultra-rare case)
(Also check all MLC coefficient values for potential
mistakes.)
Page 273 of 388
GCAS® Desktop Manual Guide rev. 14
22.5.3
Revoking (Cancelling) an Override
Open MLC Conversion Constraints dialogue again through Change MLC Constraints submenu in ISO
10723 in the Action menu. Next to the blue info badge
you shall see what override level the record
is using. If no text is displayed, then the record is still on global MLC constraints.
As an example, the screenshot above tells the calibration record is using record-level override. Now
click Revoke this override to revoke it. Confirm the message box and then the dialogue will reload
the MLC constraints from one level lower. Eventually it falls back to the global MLC constraints if there
are no more overridden MLC constraints found. You know it’s already on global MLC constraints when
there is no text next to the blue icon badge.
Finally click Cancel (yes, Cancel button) to dismiss the dialogue. Clicking OK instead of Cancel button
will show another Apply Constraints dialogue which you don’t want anymore.
22.6
Offline Converter Tools
Offline converters are intended for one-time conversion of bulk records such as those in CSV files. The
term ‘offline’ means it is not associated to any GC devices in GCAS database, which implies you can
test any arbitrary MLC coefficents, calibration certificates, RF values, and custom constraints as
conversion prerequisites without affecting any records in GCAS database.
Page 274 of 388
GCAS® Desktop Manual Guide rev. 14
GCAS Desktop ships two converter tools. They can be found inside the Tools menu. Select MLC ↔
Single-Point RF Offline Converter to convert response factor values of footprint/calibration data, or
MLC ↔ Single-Point MC Offline Converter to convert mole composition values.
Converter tools have a wizard-like appearance. To get help about specific converter tool, read the
following two chapters.
22.6.1
MLC ↔ Single-Point RF Offline Converter
This is an ISO 10723 converter tool for response factors. First, select a conversion direction whether
from MLC to single-point or single-point to MLC.
Page 275 of 388
GCAS® Desktop Manual Guide rev. 14
Next, enter the MLC coefficients. This page has similar layout to MLC Coefficients form. You can paste
from Microsoft Excel or other spreadsheet processing software as long as the data has 4 columns and
15 rows (for 15 gases); click Paste to do so. If the footprints/calibration data to convert don’t have
gases such as octane, nonane, decane, or neopentane, leave the coefficients of those gases to allzeroes.
Click Next. Depending on conversion direction, the third page may be skipped. For MLC to singlepoint conversion, you are prompted to choose MLC constraints. Single-point to MLC conversion
doesn’t require constraints therefore this page is skipped.
Most of the time you don’t have to worry about MLC constraints and you can click Next straight
away. However in case of the conversion results having weird values, go back to this page and change
the constraints to test whether the new constraints have corrected the conversion results.
Page 276 of 388
GCAS® Desktop Manual Guide rev. 14
Afterwards, enter the mole composition part of the calibration gas certificate. You can paste from
Microsoft Excel or other spreadsheet software, click Paste to do so. If the footprints/calibration data to
convert do not have gases such as neopentane, octane, nonane, or decane, leave their values to zero.
Page 277 of 388
GCAS® Desktop Manual Guide rev. 14
Next page is where you put the response factor values to convert. In this example, we are converting
MLC RF into single-point RF. There are several ways to input RF values:
1.
Orthodox method – typing them manually, row by row.
2.
Copy and paste from Microsoft Excel or other spreadsheet processing software. Make sure the
column ordering is correct as you may end up with wrong RF values in wrong gas. Click Paste
append to paste from clipboard into new rows. Existing rows are not affected.
3.
Import from CSV – please specify whether the CSV file follows standard GCAS CSV template or
a custom template. More about this later.
4.
Import from GC device in database – select a GC device and date range, then RF offline
converter will load all active footprints and calibration data of that device between that date
range.
Above the grid there is a check box called Add the ‘average’ row. This check box inserts a special row
at the very top, which contains the averaged value of all rows below it. Average row will be converted
to MLC or single-point too, depending on selected direction during the first page. If you delete some
rows or edit some rows or append new rows into this grid, the average values are updated
automatically.
For CSV import, select whether the CSV file follows the standard template or you are using your own
CSV file. Select the second radio button for CSV files with additional columns before the first gas, or
with additional header rows before the first row, or with different gas ordering, or combination of
these. Define at which column and which row the actual data start. If necessary, change the gas order
definition to match your CSV file.
Page 278 of 388
GCAS® Desktop Manual Guide rev. 14
Reorder those gases using drag-and-drop operation inside the green area. Had there any gases not
present in your CSV such as octane/C8, nonane/C9, or decane/C10, drag them to the trash bin icon
and they will move to the unused gases (pink) area. Drag gases out of the pink area back into the
green area to reuse them if necessary.
Finally, click Import. GCAS Desktop reads your CSV file and appends data into new rows. Existing rows
are not affected. Also the converter form reveals an additional column named Notes and writes the
CSV file name followed by row number.
If you import data from a device (second tab of the tab pages below the grid), the converter form
reveals the Notes column and writes device tag name followed by record timestamps. These notes
help you differentiate which rows belong to which device in case you are converting bulk records from
multiple GC devices, or converting mixed data coming from manual entry, CSV file, and device.
GCAS Desktop runs a validity check for invalid values such as negative RF. Should it find errors, the
problematic rows will display red exclamation mark on their headers and are highlighted in light red.
GCAS Desktop also refuses to move onto next page unless the errors are fixed.
Ultimately, click Next to move onto next page and you shall see GCAS Desktop is doing its job
performing ISO 10723 conversion. It may take a while if you are converting hundreds or thousands of
records. When the conversion is finished, you have options to Save as CSV, Export to Excel, or Copy
to Clipboard. The average row, if ticked in previous page, also appears in the conversion result at the
very top. However it is not the actual average of conversion results you see right now, it is simply the
MLC or single-point conversion of the average value of all input rows before.
Page 279 of 388
GCAS® Desktop Manual Guide rev. 14
The leftmost column, Graph, provides a quick glance of how these converted records would look like
in an RF chart. It generates a mini RF chart similar to the screenshot below. By default the chart omits
zero values especially if the records don’t have gases like C8, C9, or C10. You can override this
behaviour by ticking Draw zeroes.
When you get a nice ascending chart for single-point RF or nice flat chart for MLC RF, most likely the
three prerequisites (coefficients, certificate, and constraints) are correct. However if you get a bad
chart such as one or two dots skyrocket to hundreds of millions, it may indicate one or more among
the three prerequisites are wrong.
Page 280 of 388
GCAS® Desktop Manual Guide rev. 14
22.6.2
MLC ↔ Single-Point MC Offline Converter
This is an ISO 10723 converter tool for mole compositions. First, select a conversion direction whether
from MLC to single-point or single-point to MLC.
Next, enter the MLC coefficients. This page has similar layout to MLC Coefficients form. You can paste
from Microsoft Excel or other spreadsheet processing software as long as the data has 4 columns and
15 rows (for 15 gases); click Paste to do so. If the mole composition data to convert don’t have gases
such as octane, nonane, decane, or neopentane, leave the coefficients of those gases to all-zeroes.
Page 281 of 388
GCAS® Desktop Manual Guide rev. 14
Click Next. Depending on conversion direction, the third page may be skipped. For MLC to singlepoint conversion, you are prompted to choose MLC constraints. Single-point to MLC conversion
doesn’t require constraints therefore this page is skipped.
The third constraint (cubic constraint) has two parts: One for mole composition conversion, and the
other for RF conversion. Mole composition conversion involves a set of RF values. These RF values
must be convertible therefore they require their own MLC constraints and a calibration certificate
(we’ll see in the next step).
Most of the time you don’t have to worry about MLC constraints and you can click Next straight
away. However in case of the conversion results having weird values, go back to this page and change
the constraints to test whether the new constraints have corrected the conversion results.
Page 282 of 388
GCAS® Desktop Manual Guide rev. 14
After MLC constraints, enter the mole composition part of the calibration gas certificate used by RF
values followed by the RF values themselves. Save your time by copying and pasting from Microsoft
Excel or other spreadsheet software. Click Paste if the copied data has 2 columns and 15 rows, click
Paste/paste transpose certificate to paste calibration certificate only, or click Paste/paste transpose
RF to paste RF values only. If the mole composition records to convert do not have gases such as
neopentane, octane, nonane, or decane, leave both their certificate composition and RF values to zero.
Don’t forget to specify whether the RF values are single-point or multilevel-calibrated. Under the grid,
next to These RF values are [single-point or MLC], tick the correct radio button.
Page 283 of 388
GCAS® Desktop Manual Guide rev. 14
Click Next and you arrive at the input page. In this example, we are converting MLC composition into
single-point composition. There are several ways to input mole composition (MC) values:
1.
Orthodox method – typing them manually, row by row.
2.
Copy and paste from Microsoft Excel or other spreadsheet processing software. Make sure the
column ordering is correct as you may end up with wrong composition values in wrong gas.
Click Paste append to paste from clipboard into new rows. Existing rows are not affected.
3.
Import from CSV – please specify whether the CSV file follows standard GCAS CSV template or
a custom template. Keep reading after the screenshot below.
4.
Import from GC device in database – select a GC device, date range, and the stream number
too. More about this later.
Page 284 of 388
GCAS® Desktop Manual Guide rev. 14
Above the grid there is a check box called Add the ‘average’ row. This check box inserts a special row
at the very top, which contains the averaged value of all rows below it. Average row will be converted
to MLC or single-point too, depending on selected direction during the first page. If you delete some
rows or edit some rows or append new rows into this grid, the average values are updated
automatically.
All numbers in this grid are treated as unnormalised. GCAS Desktop normalises them before
performing ISO 10723 conversion.
For CSV import, select whether the CSV file follows the standard template or you are using your own
CSV file. Select the second radio button for CSV files with additional columns before the first gas, or
with additional header rows before the first row, or with different gas ordering, or combination of
these. Define at which column and which row do the actual data start. If necessary, change the gas
order definition to match your CSV file.
Reorder those gases using drag-and-drop operation inside the green area. Had there any gases not
present in your CSV such as octane/C8, nonane/C9, or decane/C10, drag them to the trash bin icon
and they will move to the unused gases (pink) area. Drag gases out of the pink area back into the
green area to reuse them if necessary.
Page 285 of 388
GCAS® Desktop Manual Guide rev. 14
Finally, click Import. GCAS Desktop reads your CSV file and appends data into new rows. Existing rows
are not affected. Also the converter form reveals an additional column named Notes and writes the
CSV file name followed by row number.
For data import from a GC device, select the device followed by the desired date/time range and the
stream number. Click Import and GCAS Desktop will query GCAS database to get these records.
The converter form reveals the Notes column and writes device tag name followed by record
timestamps. These notes helps you differentiate which rows belong to which device in case you are
converting bulk records from multiple GC devices, or converting mixed data coming from manual
entry, CSV file, and device.
GCAS Desktop runs a validity check for invalid values such as negative composition. However, there is
no check if sum of a composition record exceeds 100 because the record may be on a different scale,
not percentage. If GCAS Desktop finds errors, the problematic rows will display red exclamation mark
on their headers and are highlighted in light red. GCAS Desktop also refuses to move onto next page
unless the errors are fixed.
Ultimately, click Next to move onto next page and you shall see GCAS Desktop is doing its job
performing ISO 10723 conversion. It may take a while if you are converting hundreds or thousands of
records. When the conversion is finished, you have options to Save as CSV, Export to Excel, or Copy
to Clipboard. The average row, if ticked in previous page, also appears in the conversion result at the
Page 286 of 388
GCAS® Desktop Manual Guide rev. 14
very top. However it is not the actual average of conversion results you see right now, it is simply the
MLC or single-point conversion of the average value of all input rows before.
By default, the displayed result is normalised. Check Show unnormalised total to reveal the
unnormalised total column (after decane). Select the radio button Unnormalised or Normalised to
flip all numbers between the two.
Unlike RF converter, MC converter provides Compare column which contains buttons to compare
normalised input (before conversion) versus normalised output (after conversion). These buttons call
the Compare tool window similar to the screenshot below. Check Show difference to reveal the
absolute delta column, which is the absolute value of difference/bias between input composition and
conversion result.
Page 287 of 388
GCAS® Desktop Manual Guide rev. 14
22.7
Low-Level ISO 10723 Implementation
Provided the GCAS feature ISO 10723 is included in your licence, you already have ISO 10723 features
in relevant modules such as Footprint, Calibration Data, Mole Composition, Data Analysis, Dashboard,
and pretty much everything that uses response factor values or mole composition values. GCAS
Desktop always checks the MLC flag bit of calibration or mole composition records and performs
necessary actions before those modules use these records. For example, you cannot get a valid
uncertainty of reproducibility from a collection of multilevel-calibrated RF. Therefore, in order to
calculate Ureproducibility GCAS Desktop needs to convert the RF records into single-point first. This is
done on-the-spot and behind the screen. You didn’t notice the Dashboard always gives correct R2
value even though all calibration data are marked as MLC, did you?
Visit the appropriate chapter on the module to get help about ISO 10723 features. Footprint and
calibration data are on chapter 7, Mole Composition is on chapter 8, Data Analysis is on chapter 10,
and Mole Composition Comparison is on chapter 17.
Page 288 of 388
GCAS® Desktop Manual Guide rev. 14
23 Lag Time
Lag time is the total time of gas stream measured from the time it is sampled at the main pipeline to
the time it exits the detector of your GC. After leaving the sample probe, the gas enters pressure
letdown system to have its pressure reduced in order to be safe for the GC. The pressure letdown
system is series of regulators, heating elements, and pipes with different diameter and length, which
affect the travel time. Not to mention the GC device itself has a predefined cycle time and analysis
time. Therefore when the gas finally reaches the detector within GC, it is not the same gas travelling
inside main pipeline at the same exact moment. It can range from several minutes to few hours
behind the pipeline.
Typical pressure letdown systems.
Lag time is used by spot samples. Its main purpose is to shift the date and time of the spot sample
record. Spot sample values are then compared to the nearest mole composition data at the
timestamp of spot sample plus lag time. Without lag time taken into account, spot sample will
precede the mole composition record by several minutes to few hours ahead, making the spot sample
values stay afar from the mole composition record. Hence, you cannot use it (or it becomes more
difficult) to determine the health status of your pressure letdown system.
Lag time is calculated per-stage and summed together at the end. One stage is one configuration of
pipes and regulators. Typical pressure letdown system may have three to four stages, which in turn
makes typical lag time calculation has five or six stages in total.
Note
This module requires GCAS feature Lag Time Calculator to be included in GCAS licence.
Page 289 of 388
GCAS® Desktop Manual Guide rev. 14
23.1
The Lag Time Calculator Form
Lag Time Calculator form takes your stage data as input then calculates the lag time as output. Lag
Time Calculator form is designed for two uses, offline calculation and device-bound calculation. Yet, in
current version of GCAS Desktop at the time this document is written (version 1.8.1.0) the devicebound calculation is not yet implemented. For the time being, Lag Time Calculator handles offline
calculation only. Offline calculation is one-time calculation that is not tied to any devices in GCAS
database.
Go to the Tools menu and select Lag Time Calculator.
Left side of the form are the inputs, while right side is the output. The input section consists of three
tabs: Global parameters, pressure letdown stages, and GC time.
Global parameters have four inputs: Base temperature, base pressure, base compressibility, and
sample flow. Base temperature is set at 0°C and base pressure is typically set at the atmospheric
pressure (1 atm or 1.01325 bar). You need to provide the base compressibility factor (Z) and sample
flow. When it’s done, click Next: Pressure letdown stages to move onto the next tab.
Pressure letdown stages are the collection of stage data. A stage data consists of 7 inputs: stage
name, line temperature, line pressure, line compressibility, tube inner diameter, tube length, and
bypass flow.
Page 290 of 388
GCAS® Desktop Manual Guide rev. 14
Stage name: Enter a name as an identifier to distinguish this stage from other stages. This
name will appear in the first column of the output list.
Line temperature: Temperature at this pipe.
Line pressure: Pressure at this pipe as conditioned by the regulator.
Line compressibility: The compressibility factor (Z) of the gas at this stage.
Tube inner diameter: Inside-diameter of this pipe.
Tube length: Total length of the pipe.
Bypass flow: How much gas being discarded before entering the next stage.
One stage data is contained in one tab. To add more stage, open the last tab (Add stage) then the
form automatically creates a new tab for you. To remove a stage, click Remove this stage at bottomleft corner of a tab.
Note
You can add up to 32 stages maximum.
When you finished entering all stage data, click Next: GC time to move onto next tab.
Page 291 of 388
GCAS® Desktop Manual Guide rev. 14
GC time is cycle time plus analysis time of the GC device. This time value is added to the total lag time
so far, but you have the option not to include GC analysis time if desired.
The second radio button is disabled because Lag Time Calculator form is in offline calculation mode.
This option is intended for device-bound calculation mode which is not yet available in GCAS Desktop
version 1.8.1.0
Pay attention to units of measurement as wrong unit will produce wrong result. When you are ready,
click Calculate at the bottom-left corner of the form. Lag Time Calculator computes the lag time and
displays the calculation result in the list view on the right hand side. Total lag time is displayed in bold
face.
Click Clear calculation results to empty the list and start over.
Page 292 of 388
GCAS® Desktop Manual Guide rev. 14
23.2
The Lag Time Form
Under construction.
Lag Time form is a planned record viewer form of lag time records tied to GC devices. Because devicebound lag time calculation is not yet finished, Lag Time form is not yet available. When this feature is
implemented, Lag Time form will be accessible from the View menu.
One lag time record may survive for years because users need to calculate lag time when they change
the piping or the design of pressure letdown systems, or when they replace the GC device.
The only module using lag time data is Data Analysis. It is used when the user wants a mole
composition trend, then ticked Include spot samples. By subsequently ticking Apply lag time, all
spot sample dots on the chart will shift to the right by the amount of total lag time.
Page 293 of 388
GCAS® Desktop Manual Guide rev. 14
24 Device Management
A device is a representation of an actual, physical GC device. Device in GCAS database has several
properties for example device name (also known as device tag), device type, and device date format
(whether American or rest-of-the-world format). These properties should match the actual
configuration of your physical GC device. Managing devices are conducted through the Devices form.
Default installation of GCAS specifies only GCAS administrator and super users have access to this
form.
One group has several workspaces.
Workspaces are a way to separate devices in the same group. This has been covered in
chapter 3.2 Groups and workspaces.
24.1
One device must belong to one workspace.
The Devices Form
Page 294 of 388
GCAS® Desktop Manual Guide rev. 14
Go to the Subscription menu > Devices. This form lists all GC devices from all groups assigned to your
user account.
Note
Default installation of GCAS Desktop specifies that you have to be at least a super user to access this
form.
24.1.1
Create, Edit, Delete Devices
24.1.1.1 Create a New Device
Click New on the toolbar to create a new device.
Note
Your GCAS licence specifies how many devices you can create. You cannot create more devices than
this limit, and also if you try to open a GCAS database containing number of devices exceeding this
limit, you need to choose devices to be accessible during that session.
Important
If you use the old GCAS licence version 2, the limit of GC devices you can have is 10 (ten).
Using the tree view on the left side, choose the group and workspace where the new device will
belong to. Expand a
group node to see workspaces within this group, and click a
select it. The new device will be created under this workspace.
Page 295 of 388
workspace to
GCAS® Desktop Manual Guide rev. 14
On the right side, there are three main properties of the new device.
Device tag name is device name that will appear on the device panel on the main user interface. It is
a good practice to keep the tag name unique for each device.
Device type: Select one from the list that matches your physical GC devices (applies to both Daniel
and ABB).
Device type
C6+
complete
C6+ without
neopentane
C7+
complete
C7+ without
neopentane
C9+
complete
C9+ without
neopentane
C10+
complete
C10+ without
neopentane
C1
C2
C3
IC4
NC4
NEO
IC5
NC5
C6
•
•
•
C7
C8
C9
C10
N2
CO2
•
•
•
•
•
•
•
•
•
•
•
•
•
•
•
•
•
•
•
•
•
•
•
•
•
•
•
•
•
•
•
•
•
•
•
•
•
•
•
•
•
•
•
•
•
•
•
•
•
•
•
•
•
C5
•
•
•
•
•
•
•
•
•
•
•
•
•
•
•
•
•
•
•
•
•
•
•
•
•
•
•
•
•
•
•
•
•
•
•
•
•
•
•
•
•
•
•
•
Help on abbreviations: go to chapter 6. C-number glossary
Additional glossary: N2 = nitrogen, CO2 = carbon dioxide.
Device date format: Select one of the list, or type a custom date format. This date format follows
MySQL convention. We recommend to select from the dropdown list.
%m/%d/%y %H:%M = USA format. For instance, 01/12/2013 07:55 is interpreted as 12
January 2013 07:55 AM.
%d/%m/%y %H:%M = rest-of-the-world format. For example, 01/12/2013 07:55 translates to
1 December 2013 07:55 AM.
Custom format specifier
Date/time element
%d
date (2 digits)
%m
month (2 digits)
%y
year (4 digits)
%H
hour (2 digits, 24h format)
%M
minute (2 digits)
Page 296 of 388
GCAS® Desktop Manual Guide rev. 14
When you are finished, click Save or Save and add another to set up the new device inside GCAS
database.
24.1.1.2 Edit an Existing Device
To edit a device, tick the device on the grid then click the Edit button. Make the change as required
and finally click Save. Visit previous section if you need help about how to edit a particular field. You
might need to click
Refresh Devices on the main interface for the change to take effect.
If you change the workspace, the device will be moved into new workspace, or even new group. This is
one way to reorganise devices, however it moves only one device at a time. To move multiple devices
more efficiently, visit chapter 24.1.2 Reorganise Multiple Devices.
Important
You need to reconfigure modbus register mappings of this device, if there’s one defined for it, when
you change the device type. Not doing so will cause many modules to display values under wrong gas
names.
24.1.1.3 Delete Devices
Tick the device(s) you would like to delete. You can tick multiple devices together for bulk deletion.
Next, click Delete button on the toolbar.
Important
Deleting devices will erase:
• All footprints and calibration data of these devices,
• All mole composition data of these devices,
Page 297 of 388
GCAS® Desktop Manual Guide rev. 14
• All calibration gas certificates of these devices,
• Analysis parameter record for these devices,
• All uncertainty coefficients for these devices,
• All multilevel calibration coefficients for these devices,
• All multilevel calibration constraints for these devices,
• All lag time data for these devices,
• All comments made for these devices, and
• All repeatability test data of these devices (for i-Vigilant central database and GCAS Web users).
The deletion is permanent and cannot be undone. Make sure you no longer use the existing data
when you delete these devices. Otherwise, export their data as a backup.
24.1.2
Reorganise Multiple Devices
To move multiple GC devices between workspaces within the same group or to another workspace
belong to other group, open the Devices form and notice the Action menu on the menu bar.
Open the Action menu and select Reorganise Devices. This will show the Reorganise Devices
dialogue. Drag the device you would like to move to the new workspace. Changes are committed
automatically to the database. This method is faster than editing multiple devices one by one only to
change their assigned workspaces. Click OK and the main window shall reload its device list.
Page 298 of 388
GCAS® Desktop Manual Guide rev. 14
Page 299 of 388
GCAS® Desktop Manual Guide rev. 14
25 Data Capture
Instead of relying on CSV or text file import, GCAS Desktop has the ability to connect to your physical
GC device via Modbus® protocol in order to get live data. GCAS Desktop captures response factor,
retention time, and mole composition data.
Note
To use this feature, you need the GCAS feature either Modbus over Serial or Modbus over TCP (or both)
to be included in your GCAS licence. Additionally, to capture mole composition data you need another
GCAS feature Live Data Analysis in your GCAS licence.
25.1
Configure Register Mappings
Before GCAS Desktop captures live data, you need to configure the Modbus registers. Register is small,
volatile memory storage where your GC device outputs the data to. GCAS Desktop reads holding
registers on your GC device, therefore please configure your GC device to write the data to Modbus
register 4xxxx. On GCAS side, configure GCAS Desktop to match those register addresses. This is
administered through Register Mappings form.
25.1.1
The Register Mappings Form
Select the device you would like to configure on your device panel on the main interface. Then, click
the Comms menu > Register Mappings.
Page 300 of 388
GCAS® Desktop Manual Guide rev. 14
When the form opens, it tries to find the device configuration if you have ever configured it before.
The configuration is stored in an XML file in [Installation directory]\MappingsDeviceSpecific\ folder. If the corresponding XML file does not exist—implies that the device has
never been configured, the form loads the appropriate template. The template being used depends
on your GC device type.
Now you are ready to configure the register addresses for calibration data and for mole analysis data.
25.1.2
Bit Length and Byte Ordering
A standard Modbus register is 16 bits long, or 2 bytes. However, a standard single-precision IEEE-754
floating point representation requires 32 bits, or 4 bytes. Two Modbus registers are then used to
output a single floating-point datum. The floating point standard dictates how the bytes in these two
register be arranged to construct a 4-byte floating point value.
Several GC devices such as Daniel and Enron implement a non-standard Modbus protocol extension
which uses 32-bit Modbus registers, or 4 bytes for each register. GCAS Desktop supports these 32-bit
registers as well. Choose 16-bit to use standard 16-bit Modbus registers or 32-bit to use nonstandard 32-bit registers.
Depending on how your GC device is configured, you need to match the byte ordering configuration
on GCAS Desktop. Select one of four byte ordering options:
Swap bytes, also known as Modicon standard, swaps the bytes within each word (ABCD →
BADC).
Swap words swaps low and high word but not bytes inside each word (ABCD → CDBA).
Swap all swaps both words and bytes inside words (ABCD → DCBA).
Don't swap preserves the original byte order (ABCD → ABCD).
25.1.3
Calibration Parameter Registers
Calibration parameter refers to response factor and retention time. On Register Mappings form, set
the registers for RF and RT data to match those on your physical GC device. Register address starts
from 0 (zero). Address 0 translates to Modbus holding register 40001. Address 1 translates to 40002,
and so on.
Change the gas order by selecting the correct gas names from the dropdown list. Depending on your
GC device type, one to five bottommost input fields may be disabled. For instance, a GC device of C7+
without neopentane only reads 11 gases. Therefore, twelfth to fifteenth input fields would be greyed
out.
Page 301 of 388
GCAS® Desktop Manual Guide rev. 14
Ignore a part of incoming data
You can make GCAS Desktop ignore incoming RF data, for example, if you want to capture retention
time only or mole composition streams only. To ignore response factor data, untick Read response
factor. The same applies for RT data, which you can control using Read retention time tick box.
On standard 16-bit Modbus, one gas requires two Modbus registers. For instance in the screenshot
below, methane RF is set to use register address 7300. In practice, it uses register address 7300 and
7301 altogether. Set the next gas/nitrogen RF register to address 7302.
However in 32-bit Modbus, one gas requires only one register. There is no need to skip register
address once every two like in the prior example.
Users with GCAS feature ISO 10723 included in their licences see an additional check box at the
header of response factor fields called Mark MLC. This controls whether the incoming response factor
data should be marked as multilevel-calibrated or not. Rewind to chapter 7.11 to read more about
multilevel-calibrated RF.
Tip
To quickly define sequential Modbus registers, enter the first register address then click
For example, type 110 in methane response factor, click
Flash fill.
Flash fill, and GCAS Desktop shall assign
112 for nitrogen response factor, 114 for carbon dioxide, 116 for ethane, and so on. If you are on 32bit Modbus then GCAS Desktop assigns 111 for nitrogen, 112 for carbon dioxide, 113 for ethane, and
so on.
You can also copy Modbus register addresses from Microsoft Excel or other spreadsheet processing
software. Press Ctrl+V inside the first text box and the rest will follow. Alternatively, click
Page 302 of 388
Paste.
GCAS® Desktop Manual Guide rev. 14
The
Copy button does the opposite—it copies register addresses from GCAS Desktop so you can
paste onto Microsoft Excel spreadsheet.
25.1.4
Mole Composition Streams
GCAS Desktop supports multiple streams of mole composition data, provided that each stream has its
own unique set of register addresses and there are no address collisions between streams.
Note
You need the GCAS feature Live Data Analysis to be included in your licence in order to capture mole
composition data.
Page 303 of 388
GCAS® Desktop Manual Guide rev. 14
Click Add stream button to define a new
stream. This brings forth another dialogue (see
left) where you can define gas names and their
register addresses. Also remember that each gas
consumes two Modbus registers on 16-bit
mode, but only one for each on 32-bit mode.
The last register address is reserved for
unnormalised total. This is the sum of raw data
read by GC device; for some devices may
automatically normalise mole composition
values so they add up to exact 100%.
Does your GC device not provide unnormalised
total data? Visit chapter 25.1.5 for a workaround.
Users with GCAS feature ISO 10723 in their
licences shall see an additional check box near
the top-right corner named Mark as MLC. This
check box controls whether the incoming
composition data on this stream should be
marked as multilevel-calibrated or not. Rewind
to chapter 8.10 to read more about multilevelcalibrated composition.
Page 304 of 388
GCAS® Desktop Manual Guide rev. 14
After you click OK, the new stream appears on the list. In this
example, it displays 40-65 because we use standard 16-bit
Modbus thus register 64 (unnormalised total) actually uses address
64 and 65. Next register available for subsequent stream is 66. If
you use 32-bit Modbus, it will display 40-52 instead, because each
component only uses one Modbus register.
To edit a stream, click on the desired stream then click Edit
stream. Likewise, to delete one, highlight the stream then the
Delete stream button.
Tip
To quickly define sequential Modbus registers, enter the first register address then click
For example, type 40 in heptane, click
Flash fill.
Flash fill, and GCAS Desktop shall assign 42 for propane, 44
for i-butane, 46 for n-butane, and so on. If you are on 32-bit Modbus then GCAS Desktop assigns 41
for propane, 42 for i-butane, 43 for n-butane, and so on.
However, if the register address for unnormalised total is not on sequential series as the other
components. Do not forget to edit the register address for the unnormalised total after clicking Flash
fill. We emphasise this because many Daniel GCs are configured like this.
You can also copy Modbus register addresses from Microsoft Excel or other spreadsheet processing
software. Press Ctrl+V inside the first text box and the rest will follow, skipping the greyed out
fields. Alternatively, click
Paste.
Page 305 of 388
GCAS® Desktop Manual Guide rev. 14
The
Copy button does the opposite—it copies register addresses from GCAS Desktop so you can
paste it onto Microsoft Excel spreadsheet. The greyed out fields, if any, are also included in the copy
operation.
25.1.5
What if my GC device cannot provide data for some gas?
Depending on the make, model, and configuration of your GC device, the device may not be able to
provide some data. For example, a GC device does not provide data for unnormalised total of mole
composition.
25.1.5.1 GC device does not provide retention time data
Simply untick Read retention time as described in chapter 25.1.3. The same applies if the GC device
does not provide whole set of response factor data, you would untick Read response factor.
Page 306 of 388
GCAS® Desktop Manual Guide rev. 14
25.1.5.2 GC device does not provide response factor data, but it provides peak area
Unfortunately GCAS Desktop does not have the tool to calculate response factor from peak area and
mole composition right on the GC Connect form. We suggest two workarounds:
1.
Do not capture live data through GCAS Desktop, but obtain the data of peak area through other
means (e.g. via the bundled software or report output). Later, go to Footprint form or Calibration
Data form, open the Action menu and choose Import Data - Manual Entry. Select the third
option ("Response factor values are calculated from peak area") and enter the data. Have the
component data table or calibration gas certificate ready because you will also need to input the
mole percentage values. Click Save and GCAS Desktop will calculate the response factor values.
Unfortunately, this workaround is effective only for one single record. Inputting multiple records
through manual entry is a tedious work and very error-prone.
2.
Designate the RF register addresses for peak area and run the data capture as usual. But never
send the incoming data directly to database, use the option Save to CSVs instead. After the data
capture session ended, you can convert the peak area to RF values in the CSV file using your
favourite spreadsheet editing software. Afterwards, import the CSV.
25.1.5.3 GC device does not provide unnormalised total for mole composition streams
Define a special register on your physical GC device and hard-code its value to 100 (or any scale you
like, 100 is for percentage). Use two sequential registers if you are on 16-bit Modbus. On GCAS
Desktop, set the register address for unnormalised total to the address of this special register. Repeat
this step for every defined stream.
25.1.5.4 GC device does not provide RF or RT data of one or several particular gases
Define a special register on your physical GC device and hardwire its value to −1 (negative one). Use
two sequential registers if you are on 16-bit Modbus. On GCAS Desktop, set the register address of
the offending component(s) to the address of this special register. By this way, GCAS Desktop will
record the value −1, thus will not display the component on RF or RT chart. The chart will have gap(s)
at the offending component(s).
25.1.6
Backup and Restore Configuration
To back up your configuration, click on the Export current mappings to a file link. This will show the
save file dialogue to save the XML file.
Page 307 of 388
GCAS® Desktop Manual Guide rev. 14
To restore your configuration, click Browse button and load that XML file. Next, click Import button
and GCAS Desktop should read the content and display register addresses accordingly. Click Save
Mappings at the bottom of the form to commit the change.
Note
Backup and restore facility is not intended for copying settings from one device to another because
we cannot guarantee that the other device is the same type of the current device. You cannot use the
XML file indended for one device on a different device. If you need to do this and you are sure that
both devices are of the same type, a workaround is available in chapter 25.1.9 Troubleshooting.
25.1.7
Reset to Default
This section is only available if you have ever configured a device. For first-time configuration, this box
does not appear.
Your register configuration is stored in an XML file in [installation directory]\MappingsDeviceSpecific\ directory. Reset to default button will revert all register addresses back to the
default definition as defined in template file. When you click Save Mappings button at the bottom of
the form, your XML file is overwritten.
If you first tick Permanently before clicking Reset to default button, not only GCAS Desktop restores
all register addresses to the default definition as defined in template file, but also it deletes your XML
file. Permanent reset will put your GC device in GCAS database into unconfigured state.
25.1.8
Tools/Shortcuts
Instead of retyping all register addresses of RF and RT, use this section to shift registers addresses in
one click. Choose which one to shift (RF or RT), enter the amount of address shift between −10,000 to
+10,000, and then click Shift registers.
Page 308 of 388
GCAS® Desktop Manual Guide rev. 14
You can also swap mole composition stream numbers without changing their register addresses. Enter
two existing stream numbers to switch place, then click Swap stream number.
25.1.9
Troubleshooting
a) Q: I see an error message "This file is not a valid configuration file".
A: There is a problem within the XML file. Open File explorer (Windows explorer), navigate to
[installation directory]\Mappings-DeviceSpecific\. Default installation
directory is C:\GCAS. Find the file of your device tag name.xml, then delete the file. This will
reset the configuration of your device to follow template.
b) Q: I see an error message "Erroneous RF/RT entries" similar to this screenshot.
A: Again, there is a problem within the XML file. Open File explorer, navigate to
[installation directory]\Mappings-DeviceSpecific\. Find the file of your
device tag name.xml, then delete the file. This will reset the configuration of your device to
follow template.
c)
Q: I see an error message "Device type not supported".
A: GCAS Desktop cannot find the template file. Open File explorer, navigate to
[installation directory]\Mappings-Template\. If the template file for your device
type does not exist, either the device type is not yet supported by current version of GCAS
Desktop or otherwise you might need to reinstall GCAS Desktop.
d) Q: When I import a configuration (XML) file, it says that the file belongs to other device.
A: The export configuration command link is not intended to copy settings among devices
because we cannot guarantee that the other device is the same type as the device you are
configuring. Their number of gases may differ. Therefore, we designed that the XML file
belongs to a certain GC can only be used by that GC exclusively.
Nevertheless if you are very sure that both this GC device and the other device are of the
same type, you would need to edit the XML file using Notepad or any text editor. Open the
XML file, and find the <devices> element. It should be near the beginning of the file. Inside
<devices>, find the <tagname> element. Change the device tag name between
<tagname> and </tagname> to match the name of the device you are configuring. Save the
file, and then try to import the XML file again.
Page 309 of 388
GCAS® Desktop Manual Guide rev. 14
25.2
Capture Data
As the Modbus register configuration is ready, GCAS Desktop is ready to get some data from the GC
device.
25.2.1
The GC Connect Form
Select the device you would like to get data for, then go to the Comms menu > Connect to Device.
Page 310 of 388
GCAS® Desktop Manual Guide rev. 14
GC Connect form has two main parts, the options panel at the top and grid views at the bottom.
Options panel consists of four parts, which are connection settings, device settings, data retrieval
options, and unattended mode. If you see only three, resize the form so that it becomes larger to the
right side. Unattended mode options may not be visible if your screen resolution is 1024×768.
There are two grids at the lower part of the form, one for calibration parameters and one for mole
composition. If you only see the grid for calibration parameters, it means you do not have GCAS
feature Live Data Analysis included in your licence.
To expand the grids and hide the options panel, click the
restore the options panel you would click
25.2.2
Expand button. On the opposite, to
Collapse button.
Connection Settings
This section configures the connection medium between your computer and your GC device. GCAS
Desktop supports two media, serial cable/RS-232 and Ethernet (or Wi-Fi, if your GC device supports it).
Page 311 of 388
GCAS® Desktop Manual Guide rev. 14
To use serial cable connection, you need a GCAS feature Modbus over serial to be included in your
GCAS licence. Similarly to use Ethernet cable, you need a GCAS feature Modbus over TCP.
For serial cable connection, enter the appropriate COM port where the cable plugs to, followed by the
baud rate, data bits, stop bit(s), and parity bit. These configuration should match the same
configuration as your GC device (except the COM number).
For Ethernet or Wi-Fi connection, enter the IP address of your GC device and the TCP port. Refer to
your GC device about the TCP port it listens. Modicon standard recommends 501, 502, or 1100
depending of the Modbus protocol set in the device settings.
25.2.3
Device Settings
This sections configures the Modbus protocol to communicate with GC device. Available Modbus
protocol depends on the connection medium set in connection settings.
Connection medium
Serial cable
Ethernet or Wi-Fi
Available protocol
1.
ASCII (plain text)
2.
RTU (remote terminal unit)
1.
Modbus/TCP
2.
RTU over TCP
Slave ID is the Modbus device identifier that ranges from 1 to 255. In a typical one device to one
computer configuration, usually the slave ID is 1 (one). Refer to the configuration on your GC device to
get the slave ID.
Page 312 of 388
GCAS® Desktop Manual Guide rev. 14
Timeout is the period GCAS Desktop should wait after a Modbus command has been issued to the
Device. Default value is 1000 milliseconds (one second) for serial cable and 5000 ms (5 seconds) for
Ethernet or Wi-Fi. Note for RTU protocol (serial cable), this timeout starts counting after the standard
3.5-second wait as specified in the RTU protocol specification itself. Minimum value is 10 ms.
Poll delay is the period GCAS Desktop should wait after a timeout occurs before it retries to issue the
same Modbus command to GC device. Default value is 1000 ms, but you can set it to zero if you don't
want to wait.
25.2.4
Data Retrieval Options
You can set the poll interval at "poll every" input field starting from as frequent as every 5 seconds up
to every 90 days. Typically, the poll interval is between 10 to 20 seconds. You can also match poll
interval to the cycle time of your GC device, however please make sure time difference between the
poll and the end of cycle is not too far apart.
Data destination: Choose where the captured data is being uploaded to.
Push to database: Data is uploaded to GCAS database.
Save to CSVs: Data is saved as two CSV files.
For CSV option, GCAS Desktop creates two CSV files: One for RF and RT data, another for mole
composition. If you do not have GCAS feature Live Data Analysis in your licence, the latter CSV is not
created — GCAS writes only the RF and RT data into one CSV file.
The file for RF and RT data follows i-Vigilant CSV format so that it is usable for CSV import on
Footprint or Calibration Data form. Similarly, CSV file for mole composition follows the format
recognisable by CSV import on Mole Composition form.
Mole composition values are left unnormalised when GCAS Desktop writes to the CSV. When you
import this CSV through the Mole Composition form, the values will be automatically normalised. If
you choose to push to database however, GCAS Desktop always normalises all mole composition
values before they are committed to database.
Page 313 of 388
GCAS® Desktop Manual Guide rev. 14
When you select Save to CSVs option, GCAS Desktop shows a dialogue. Here you set the CSV file
names and their desired location. To change these later, click on the Change destination files link.
25.2.5
Start Capture
As the Modbus register mappings, connection settings, device settings, poll interval and data
destination have been all configured, apparently now you are ready to get some data!
Hit the
Start button to start the operation. GC Connect form will expand the grid view and poll the
device for the first time after three seconds. After first poll, GC Connect form polls the device once
every poll interval.
By default, response factor and retention time are given equal priority in calibration data. New
incoming calibration data having same response factors as the previous row but with different
retention time is still treated as new data. If you prioritise response factors over retention time, tick the
check box Detect changes on RF only. By this way, incoming record having same RF but different RT
from the previous one will not trigger a new row.
Page 314 of 388
GCAS® Desktop Manual Guide rev. 14
You can open multiple GC Connect forms and run multiple data capture sessions simultaneously,
provided that no two GC Connect forms accessing the same device, through the same COM port or
same IP address. GCAS Desktop suspends the idle timer if there is at least one active connection to GC
device.
To stop capture, hit the
Stop button.
If you accidentally closed the GC Connect form during an active data capture session, either by
pressing Ctrl+F4 or the close (×) button on its tile bar, the form is still running in background. The
main interface displays a panel notification at the bottom region, thus you can bring the GC Connect
form back into view or stop its capture operation instead. Nevertheless, if you deliberately log out while
a data capture is running in background, the form will be stopped, closed, and its pending records are
discarded.
Page 315 of 388
GCAS® Desktop Manual Guide rev. 14
When multiple data capture operations are running in background, these two buttons become Show
all and Stop all.
25.2.6
Click the
Stop Capture and Commit Data
Stop button to stop the operation.
Note
If you click Stop button when GCAS Desktop is in the middle of polling GC device, GCAS Desktop
waits two seconds in order to allow the poll to finish before terminating the connection. If the poll
takes very long (e.g. on an extremely slow network or over VPN connection), GCAS Desktop waits for
additional two seconds, up to five times (10 seconds) maximum.
Untick records to ignore them, see green rectangle on the screenshot above. Ignored records will not
be written to database or CSV files. For calibration parameters, you can change its flag in the "Flag as"
column whether to mark a record as a footprint or a regular calibration data. (See orange rectangle on
the screenshot above.)
Page 316 of 388
GCAS® Desktop Manual Guide rev. 14
To commit (write) the data into database or CSV files, click either
CSVs button. Otherwise,
Commit button or
Save to
Clear grid button removes all committed, pending, ignored, and failed
rows from display. Alternatively, click the
Start button again to resume capturing data.
The Status column may display any of the following:
No text/blank: The record is ignored and will not be committed to database nor CSV files.
Pending (black): The record is awaiting commit or save operation.
Committed (green): The record has been successfully written to database or CSV files. Click
Clear grid button to clear all committed rows from both grid views.
Failed (red): The record could not be written to database or CSV files.
Usually the
Error log button appears on the bottom-left corner of the form and you
click that button to see why the record failed to commit. Otherwise, open the Action menu
and select View Error Log.
(Note if you are in unattended mode, first click
Collapse button then deactivate
unattended mode to see Error log button).
25.2.7
Unattended Mode
Unattended data capture is a data capture operation where all incoming data are committed to
database or CSV files automatically. It is intended for remote sites where engineers rarely present insitu while GCAS Desktop continuously captures data. You can then leave the computer on and come
back later to stop the operation.
The regular way to capture data as described in chapter 25.2.5 Start Capture and 25.2.6 Stop Capture
is known as attended mode. The table below summarises difference between attended and
unattended mode.
Attended mode
Unattended mode
Incoming records await your decision whether
Incoming records are committed immediately.
to commit or ignore.
You need to click Commit button or Save to
Commit button, Save to CSVs button, and
CSVs button in order to commit the records.
Clear grid button are not available in
unattended mode.
You can review RF and RT records, giving you a
All records are automatically marked as
time to change their flag either to footprint or
calibration data.
calibration data.
Click the Stop button to stop operation.
Click the Stop button to stop operation, or
choose one of three available automatic stop
triggers.
Page 317 of 388
GCAS® Desktop Manual Guide rev. 14
To activate unattended mode, first tick the check box Enable unattended mode.
Notice that the Commit button/Save to CSVs button and Clear grid button disappear from the
bottom of the form. We don't need these buttons as the records would be committed automatically.
Choose one of the following automatic stop triggers.
1. After x records collected (default x = 20)
GCAS Desktop stops the data capture operation after x new records have been collected.
Operation stops whichever record type reaches x first, whether calibration parameter records
or mole composition records.
2. After x period of time
GCAS Desktop stops the data capture operation after x period of time, whether it is x seconds,
x minutes, x hours, or x days. You can choose from as short as 15 seconds to as long as 90
days.
Note
To prevent GCAS Desktop consumes too much memory (RAM), GCAS Desktop only display
the last 25 committed records. Old committed records are removed from the grid view. (They
are not deleted from database or CSV files, though.) Failed records are never removed from
view.
3. At specific time
GCAS Desktop stops the data capture operation at the defined time.
Note
To prevent GCAS Desktop consumes too much memory (RAM), GCAS Desktop only display
the last 25 committed records. Old committed records are removed from the grid view. (They
are not deleted from database or CSV files, though.) Failed records are never removed from
view.
4. Never stop
GCAS Desktop does not stop data capture operation. Someone must come back to the
computer later and stop the operation manually through the
Note
Page 318 of 388
Stop button.
GCAS® Desktop Manual Guide rev. 14
To prevent GCAS Desktop consumes too much memory (RAM), GCAS Desktop only display
the last 25 committed records. Old committed records are removed from the grid view. (They
are not deleted from database or CSV files, though.) Failed records are never removed from
view.
And finally, hit the
Start button to start capturing data in unattended mode.
To deactivate unattended mode, stop the data capture operation and untick the check box Enable
unattended mode.
25.2.8
Data Capture Error Log
In case of records failing to commit, the Error log button usually appears at the bottom-left corner of
the form.
If you are on unattended mode, first stop data capture operation, show the options panel via
Collapse button and then deactivate the unattended mode to see this button. Alternatively, simply
open Action menu and select View Error Log.
Error log shows you the error messages why the record could not commit on every occasion of failed
record. In this example, Unauthorised access exception means either the CSV file was marked
as read-only, or your Windows user account do not have write permission on the folder where the
CSV file resides.
Page 319 of 388
GCAS® Desktop Manual Guide rev. 14
25.2.9
Data Capture Connection Log
The connection log records several types of event during data capture operation. For example, when
the connection is started, connection is stopped, poll results, whether the record successfully
committed (unattended mode only), and error codes.
One device has one connection log and error log. If you run multiple data capture operations
simultaneously, each GC Connect form has its own error log and connection log. Both logs are cleared
when you close the GC Connect form.
To view the connection log, open the Action menu and select View Connection Log.
Page 320 of 388
GCAS® Desktop Manual Guide rev. 14
Click Show/hide to filter which types of event to display on the connection log window. Clicking a
dropdown menu will toggle that filter to on or off. If you tick Hide successful polls with no new
data, all polling events having 0x00000000 error code (which indicates "no error" or a successful poll)
without new data will be hidden.
To save the error log, click
Save. Connection log is saved in a CSV format. However, this button will
save the filtered log, as only displayed items are saved. To save the entire log inclucing those hidden
items, open the small drop down menu near the Save button and select Save Entire Log.
Page 321 of 388
GCAS® Desktop Manual Guide rev. 14
In order to preserve computer memory, the connection log only retains the last 40,000 log items.
When the connection log has reached 40,000 items, the oldest log items are discarded one by one.
Click
Clear log to empty the entire connection log immediately.
Type the search word in the search box and hit
Search to find the word in the connection log.
Before clicking Search, you can change the search filter dropdown to limit the searching area. Notice
that searching a term in connection log will search the entire log, not only the filtered log. Click
Finish searching to end the search mode.
Page 322 of 388
GCAS® Desktop Manual Guide rev. 14
25.3
Modbus Error Codes and Handling
Bad things happen during data capture. Source of problems might be bad cables, aging hubs,
overloaded router, Wi-Fi interference, and so forth. When GCAS Desktop does not get a proper
response from the GC device, it raises an error code.
We make a distinction between error codes and exceptions. Error code indicates an error in the
Modbus protocol communication. The cause may be the computer, the GC device, or the medium
between computer and GC device. Exception, by definition in technical term, is an error caused by
problems inside GCAS Desktop itself and not your GC device. Both error codes and exceptions are
logged in the connection log.
25.3.1
About Error Codes
If there was error in Modbus protocol communication during data capture, the GC Connect form will
display the error code above the countdown. For example, the most common error is 0x00000044
TCP/IP connection error. This error happens only in TCP connection — not in serial cable connection
— and indicates problem such as congestion, corrupted TCP packet, wrong TCP checksum, or Wi-Fi
connection between your computer and GC (if your GC supports Wi-Fi) is experiencing problems.
Another common error code is 0x00000045 TCP/IP connection was closed by remote peer. This
error code indicates problems like the Ethernet cable is unplugged or the main power to GC was cut.
Some error codes are temporary, such as 0x00000084 Reply time out. By temporary it means the
error may vanish by the next poll. However some error codes are persistent, which means the error
code will be repeated during next poll and next poll and next poll until you stop the connection. This
is particularly bad for unattended mode. In order to avoid that, GCAS Desktop introduced automatic
connection restart and automatic connection termination. This feature is turned on by default, and
you will go to the Advanced GC Connection Preferences dialogue in order to configure which error
codes trigger the automatic restart or termination.
25.3.2
Advanced GC Connection Preferences
Go to the Comms menu > Advanced Preferences. This menu brings the Advanced GC Connection
Preferences dialogue.
Page 323 of 388
GCAS® Desktop Manual Guide rev. 14
This dialoge configures the automatic connection restart and automatic connection termination. To
get help on automatic connection restart, go to chapter 25.3.3. To read more about automatic
connection termination, head to chapter 25.3.4.
25.3.3
Automatic Connection Restart
Automatic connection restart is a feature to stop GC connection temporarily and restart it immediately
or with delay when GCAS Desktop encounters certain error codes. To turn on this feature, give a check
mark on Restart GC connection if these errors are encountered during poll. This feature is already
turned on by default for error codes 0x00000002 Illegal state error, 0x00000044 TCP/IP connection
error, and 0x00000045 TCP/IP connection was closed by remote peer. When GCAS Desktop encounters
any of these three error codes, it will trigger a connection restart.
Page 324 of 388
GCAS® Desktop Manual Guide rev. 14
To remove an error code from the trigger list, highlight the error code and click Remove from list.
The next link Clear selection deselects any selected items.
To add an error code to this trigger list, choose one from the dropdown or type the error code in
hexadecimal number (for example 0x00000084) then click Add.
When GCAS Desktop restarts a connection, it stops the connection and restarts it immediately.
However, there are chances that the first restart will still fail. If you want GCAS Desktop to keep
retrying, give a tick mark on If connection restart failed, wait x minute(s) and set how much the
delay GCAS Desktop should wait before another attempt of reconnection. During this wait time, you
can abort the process by clicking
Stop button on GC Connect form and the restart attempt will be
cancelled. If this is not ticked, the GC Connect form will stay stopped after first restart attempt failed.
Set how many retries GCAS Desktop should try. The default is 30 attempts, which means GCAS
Desktop will give up after 30 times of unsuccessful reconnection. Pick one from the drop down or type
a number. Choose infinite to make GCAS Desktop keeps retrying forever.
Note
Automatic restart only works for the enlisted error codes during poll. It will not work if you get the
error code at the start of connection.
For example, if you get 0x00000044 TCP/IP connection error when you click
Start button, it means
the IP address of your GC is wrong or the destination IP address does not listen to port 502 (or the
defined port). Restarting GC connection for wrong IP address is useless, therefore GCAS Desktop will
not attempt to reconnect to your GC.
It's a different story if you get 0x00000044 at a regular poll, it means there is network problem
between your computer and your GC. This error code can be solved by restarting TCP connection.
25.3.4
Automatic Connection Termination
Automatic connection termination is a feature to stop GC connection permanently when GCAS
Desktop encounters certain error codes. Typically the error codes in the auto-terminate list represent
fatal errors. To turn on this feature, give a check mark on Terminate GC connection if these errors
are encountered during poll. This feature is already turned on by default for error codes 0x00000046
Socket library error and 0x00000086 Invalid MBAP pointer. When GCAS Desktop encounters any of
these two error codes, it will stop GC connection.
Page 325 of 388
GCAS® Desktop Manual Guide rev. 14
The error code 0x00000046 Socket library error indicates a problem within Microsoft Windows Socket
(winsock). The way to fix this error is you need to open an elevated command prompt (run as
administrator), enter this command:
netsh int ip reset
and restart the computer. It is not something GCAS Desktop can fix with a simple reconnection.
The error code 0x00000086 Invalid MBAP pointer may happen to a very limited number of GC devices
(usually GC with old firmwares) on ethernet connection. It has something to do with the way GC
respond back to the command issued by the computer.
Simply explained, MBAP stands for Modbus Application Protocol. When a computer issues a Modbus
command to a machine (the GC), there is a "transaction ID", a number at the beginning of every data
packet travelling along the network. When your GC device finished executing the command and ready
to send back a response, it must echo the same transaction ID at the beginning of response. This is
how Modbus protocol works as already defined in the Modbus protocol standard. However, some GC
devices do not follow this standard. Instead of echoing back the transaction ID, they set the
transaction ID to zero. Because GCAS Desktop follows Modbus standard, GCAS Desktop rejects this
response and issues 0x00000086 error code. To fix this problem you might have to upgrade the
firmware of GC device. Restarting GC connection won't help, therefore it is better for GCAS Desktop to
terminate connection.
Similar to automatic restart configuration, highlight an error code and click Remove from list to
remove the error code from auto-terminate trigger list. To add an error code, select one from the
dropdown list or type the error code in hexadecimal number and then click Add.
25.4
Controlling Multiple Data Captures
The Comms menu on the main user interface provides two shortcuts to control multiple data capture
operations.
Start All Connections menu is a way to start multiple data captures simultaneously or with delay.
Stop All Connections menu will attempt to stop all data capture operations and abort any GC
Connect form in reconnecting state. If there are some GC Connect forms being hidden, the Comms
menu displays another menu called Reveal Hidden GC Connect Forms which pretty straightforwardly
will unhide all hidden GC Connect forms.
Page 326 of 388
GCAS® Desktop Manual Guide rev. 14
25.4.1
Start Multiple Data Captures with Delay
This menu is accessible if you open multiple GC Connect forms but haven’t started some or all of them.
Configure every GC Connect form to the correct parameters such as IP address or serial port, poll
interval, data destination, and so on. However, leave them and do not start any data capture
operation. Next, go to the Comms menu > Start All Connections > With Delay. This menu displays
the GC Connect Delay Start form.
On the left side, there is a list of idle GC Connect forms. Those with check mark will be queued for
delay start. Reorder this queue by selecting one item and click Move up or Move down. GC Connect
form at the top will be started first, and subsequently so according to the order of this queue.
If you tick Delay the start of first GC Connect form, the start capture operation of first GC Connect
form in the queue will be delayed by the specified amount of time.
If you tick Delay the start of subsequent GC Connect forms, the start capture operation of the
second, third, and the rest of the queue will be delayed by specified amount of time one after another.
Furthermore if you tick Randomise within, the delay between GC Connect forms is randomised within
the specified delay. For example, let's use 1 minute delay. Without randomisation, GCAS Desktop will
start GC Connect forms in the given order exactly 1 minute one after another. With radomisation, the
delay is randomised between immediate (0 second) to 1 minute. As an example, GCAS Desktop may
start the second GC Connect form after 27 seconds, the third GC Connect form 56 seconds afterwards,
and the fourth GC Connect form 43 seconds after the third.
Hit
Start timer to begin the delay start. While the timer is running, a command link Cancel will
appear to the right side of Start timer button. Click Cancel to stop the timer and abort the delay start.
Delay first GC
Delay subsequent
Connect form
GC Connect forms
check box is…
check box is…
Checked, 10
Checked, 1 minute
minutes
What would happen
1. GCAS Desktop waits 10 minutes then starts the first
GC Connect form.
2. GCAS Desktop waits 1 minute then starts the second
GC Connect form.
Page 327 of 388
GCAS® Desktop Manual Guide rev. 14
3. GCAS Desktop waits 1 minute then starts the third GC
Connect form, and similarly for the rest of queue.
Checked, 10
Unchecked
minutes
Unchecked
GCAS Desktop waits 10 minutes then start all GC
Connect forms in the queue simultaneously.
Checked, 1 minute
1. GCAS Desktop starts the first GC Connect form
immediately.
2. GCAS Desktop waits 1 minute then starts the second
GC Connect form.
3. GCAS Desktop waits 1 minute then starts the third GC
Connect form, and similarly for the rest of queue.
Unchecked
Unchecked
GCAS Desktop starts all GC Connect forms in the queue
simultaneously and immediately.
This configuration is the same as Comms menu > Start
All Connections > Now.
If any of GC Connect forms in the queue is started manually or is closed before the timer countdown
reaches zero, it is automatically removed from the queue. The GC Connect Delay Start form shall skip
to the next GC Connect form in the queue. When this queue becomes empty, the timer stops.
Page 328 of 388
GCAS® Desktop Manual Guide rev. 14
26 Report
Under construction
Report is a planned module for printed report generation. A simple report typically contains latest
calibration data, latest footprint, historical RF trend, RF error trend, RT trend, and RT error trend.
Another type of reports include ISO 6976 trend and uncertainty trend.
Report module is not yet developed, but we reserved chapter 26 for report module. Our estimate is on
GCAS Desktop version 1.9 or later, because development of ISO 6976 Trend takes priority. Stay tuned
for future releases of GCAS Desktop.
Page 329 of 388
GCAS® Desktop Manual Guide rev. 14
27 Administrator Menu
Administrator menu is available to GCAS administrators. Look for the "Administrator" menu on the
menu bar of main user interface. Through this menu, GCAS administrators manage GCAS users,
groups, and access control list.
Note
If your GCAS user account has a custom user type and your GCAS administrator granted the menu
permission for "Options" for this user type, you would see Administrator menu as well. This implies
you can manage users, groups, and optionally the access control list too.
27.1
Manage Users
Go to Administrator menu > Users. This menu displays the Users form which lists all GCAS users
registered in this GCAS database.
27.1.1
Create a New User
Click New button on the toolbar. Define the new username and initial password. Choose a user type
and user role, and finally enter the information for his or her user profile. Finally, click Save.
Page 330 of 388
GCAS® Desktop Manual Guide rev. 14
Note
1. Username cannot contain spaces.
2. Empty time zone information is replaced by the default Europe/London time zone.
27.1.2
Edit an Existing User
To edit a user, tick the user on the list and click the Edit button on the toolbar. Make changes as
required then click Save. Otherwise click Reset to roll back to the previous user profile.
Page 331 of 388
GCAS® Desktop Manual Guide rev. 14
About reset password
You cannot alter the user's password directly, but you can rather reset it to the default password
"password" (all lowercase). Do this on an explicit request from the user himself to reset his password.
To set user as inactive, edit the user and set his status as
on the list then click
Inactive. Alternatively, tick multiple users
Set as Inactive button on the toolbar. Inactive users cannot log in to GCAS.
To set the user back as active again, edit the user then set her status as
multiple users on the list then click
27.1.3
Active. Alternatively, tick
Set as Active button on the toolbar.
Delete Users
To delete one or more users, tick the user(s) you want to delete on the list then click Delete button on
the toolbar.
Page 332 of 388
GCAS® Desktop Manual Guide rev. 14
Note
You cannot delete yourself. Ask another GCAS administrator to delete your user account to do so.
Warning
If the user being deleted is still logged in on another computer, deleting her account will cause errors
on her computer. Make sure she has logged out beforehand.
Deleting users will also delete all their comments in any footprint, calibration data, mole composition,
calibration gas certificate, data analysis, uncertainty trend, and repeatability test* records. If you need
to preserve their comments, set them as inactive instead.
*available only on GCAS Web version.
27.2
Define New User Types and Roles
Default installation of GCAS Desktop sets up three user types and six user roles. Should you need to
create another user type or user role, you would go to the Administrator menu > User Type and Role
Definition.
Click New to create one. Click an existing user type or role and you can rename it via Rename button
or delete it through the Delete button.
Note
You cannot delete "System Administrator" user type and user role.
You cannot delete a user type or role if there are users of this type or role. Change the user type or
role of these users before deleting the type or role.
Do not forget to assign menu permission for the new user type or action permission for the new user
role, later.
Page 333 of 388
GCAS® Desktop Manual Guide rev. 14
27.3
Manage Groups
Go to the Administrator menu > Groups and Workspaces to manage groups. This menu displays the
Groups form which lists all groups registered in the GCAS database. Note that your GCAS user account
may not have been assigned to all these groups even though you are a GCAS administrator. Click
Show my groups on the toolbar to highlight which groups are assigned to your user account.
Note
The last column, Agreements, lists the number of agreements linked to the group. Agreements are no
longer part of GCAS Desktop. However, the last column is preserved to maintain compatibility with
older GCAS local-offline databases which were used before GCAS Desktop version 1.4 . It will be gone
in GCAS Desktop version 2 where the database uses a completely new schema, and won’t be
compatible with any GCAS 1.x databases.
Agreement column should contain 1 (one) for every row. If any other number appears here, that
indicates your offline database must be upgraded. Otherwise, you won't be able to delete the group.
Contact i-Vigilant customer support to upgrade your offline database or use the supplied GCAS
database upgrade tool.
27.3.1
Create, Edit, Delete Groups
To create a new Group, click New on the toolbar. Enter the group name, followed by business
information of the company that is being represented by this new group. Finally, click Save. To edit a
group, highlight the group on the list and then click Edit button on the toolbar. Similarly, to delete a
group, highlight the group then click Delete.
Page 334 of 388
GCAS® Desktop Manual Guide rev. 14
Note
Creating a group also creates one workspace within that group. The workspace has initially a same
name as the group.
After a new group has been created, your user account is automatically assigned to the new group.
Head to chapter 27.4 Assign Users into Groups if you don’t like this assignment and to remove
yourself from this group.
27.3.2
Add, Edit, Delete Workspace within Groups
To edit workspaces within a group, click on the workspace count of that group.
Page 335 of 388
GCAS® Desktop Manual Guide rev. 14
That button brings you to the Workspaces dialogue where you can manage workspaces for this group.
To define a new workspace, click Add. Enter the name of this new workspace then click the
arrow to commit.
Page 336 of 388
red
GCAS® Desktop Manual Guide rev. 14
Similarly, to rename a workspace you need to select the corresponding workspace on the list and then
click Rename. Type the new name and press Enter on your keyboard to commit the change.
To delete a workspace, click the corresponding workspace on the list and then click Delete.
Note
You cannot delete a workspace if there are devices assigned to this workspace. Move them into a
different workspace or delete the devices before deleting a workspace.
27.4
Assign Users into Groups
To assign users into groups or remove users from groups, go to the Administrator menu > UserGroup Relationship. The menu takes you to the User-Group Relationship window.
This form has two views: user view, and group view. Both carry the same information, but under
different focus. Switch to user view if you want to focus on the users, i.e. how many groups one user
has. Switch to group view if you want to focus on the groups, that is, how many users one group has.
Assigning and removing users or groups are conducted through drag-and-drop operations. Go to one
of the subchapter below to use the form using a particular view.
27.4.1
User View
User view focuses on the users. You see how many groups each user has.
Assign a group to a user: Drag the group from left pane to the user.
Page 337 of 388
GCAS® Desktop Manual Guide rev. 14
Remove a group from a user: Drag the group under a user and put it on the trash bin.
27.4.2
Group View
Group view focuses on the groups. You see how many users each group has.
Page 338 of 388
GCAS® Desktop Manual Guide rev. 14
Move a user to a new group: Drag a user to the new group. In this example, we are moving User D
to a new group. User D loses access to One group but is given access to Another another group.
Assign a user to a new group while retaining the previous one:
If you want to assign User D to both groups instead, hold the Ctrl key on your keyboard while
dragging her to the new group. User D retains access to One group while is also being assigned to
Another another group.
Page 339 of 388
GCAS® Desktop Manual Guide rev. 14
Remove a user from a group: Drag the user under a group and put him on the trash bin icon.
Unassigned users: If you remove the same user from every group she had, she will appear on the list
of unassigned users.
Page 340 of 388
GCAS® Desktop Manual Guide rev. 14
Reassign an unassigned user to a group: To reassign an unassigned user back to a group, drag her
to the desired group.
27.5
Menu Permissions
Menu permissions are a part of access control list (ACL) that controls which menu is available to each
user type. Go to the Administrator menu > Menu Permissions to show the Menu Permissions form.
Page 341 of 388
GCAS® Desktop Manual Guide rev. 14
To grant or revoke permissions, tick or untick the corresponding check box. Administrator always has
access to all menus. Click Save to enforce the change. If other GCAS users are currently logged in to
GCAS database on other computers, the change will take effect on their user accounts after they log
out or exit GCAS Desktop.
Information
Many menus such as Comms menu, File menu > Export Data, Tools menu could be included in this
menu permission list. However, if you use i-Vigilant central database, the database is shared between
GCAS Desktop and GCAS Web. Unfortunately, adding new entries to this menu permission list would
break GCAS Web.
27.6
Action Permissions
In tandem with menu permissions, action permissions constitutes the access control list (ACL). Action
permissions control which action menus — and in some cases, actions in literal meaning itself —
available to each user role. Go to Administrator menu > Action Permissions to bring forth the Action
Permissions form.
Similar to menu permissions, tick the check box to grant permission or untick to revoke. Click Save to
enforce the change. If other GCAS users are currently logged in to GCAS database on other
computers, the change will take effect on their user accounts after they log out or exit GCAS Desktop.
Page 342 of 388
GCAS® Desktop Manual Guide rev. 14
28 Export Data
GCAS Desktop can export a portion of GCAS database into several file formats for further analysis. Go
to the File menu > Export Data and the Export Wizard window shall appear. If you don't see this
menu, that means you do not have any GCAS feature related to data export in your GCAS licence.
The Export Wizard.
Note
If you are working offline, only the data available in your temporary database—which is a subset of
GCAS database—can be exported. If you choose to synchronise your data for the latest 6 months for
instance, you cannot export data beyond 6 months ago.
Page 343 of 388
GCAS® Desktop Manual Guide rev. 14
28.1
Export to CSV
This exporter module exports GCAS data into a standard comma-separated value (CSV) spreadsheet.
Choose Export to CSV to begin.
Note
You need the GCAS feature Export to CSV to be included in your GCAS licence in order to use this
feature.
Tick all GC devices you would like to have their data exported.
Page 344 of 388
GCAS® Desktop Manual Guide rev. 14
Choose the data kind and a date range to export. If you tick Also include records marked as
inactive, inactive footprints, calibration data, mole composition data, calibration certificates,
uncertainty coefficients, MLC coefficients, and lag time data, including comments for them (if selected)
within the defined date range will also be included in the export.
Page 345 of 388
GCAS® Desktop Manual Guide rev. 14
Set the destination CSV file.
Review the export settings, and click Next to begin the export process.
GCAS Desktop commences the export operation. For CSV export, this step is typically very fast —
unless the number of records to export is way too many.
Page 346 of 388
GCAS® Desktop Manual Guide rev. 14
This wizard page confirms that the export has been successful. You can now open the CSV file.
A quick note if you open the CSV file using Microsoft Excel. Excel tends to truncate large number into
scientific notation up to 2 decimal place (the number of decimal place follows the regional settings on
your Windows Control Panel). This truncation may lead to large rounding error and is permanent.
As soon as you notice this Excel evildoing, change the number format for the selected cells to general
numeric format before you save the file.
Page 347 of 388
GCAS® Desktop Manual Guide rev. 14
28.2
Copy to Microsoft Excel
This exporter module opens a new Microsoft Excel worksheet, formats the worksheet, and writes data
to it. The process is much slower compared to other exporter module, so it is suitable for small
number of records. Choose Copy to Excel to begin.
Note
You need the GCAS feature Export to Microsoft Office to be included in your GCAS licence in order to
use this feature.
Moreover, this exporter also requires Microsoft Excel 2010, 2013, 2016, or later to be installed on your
computer. Running this export module without Excel installed will raise an error.
Page 348 of 388
GCAS® Desktop Manual Guide rev. 14
Tick all GC devices you would like to have their data exported.
Page 349 of 388
GCAS® Desktop Manual Guide rev. 14
Choose the data kind and a date range to export. If you tick Also include records marked as
inactive, inactive footprints, calibration data, mole composition data, calibration certificates,
uncertainty coefficients, MLC coefficients, and lag time data, including comments for them (if selected)
within the defined date range will also be included in the export.
Unlike other export modules, you don't set the destination file. Review the export parameters and click
Next to continue.
Page 350 of 388
GCAS® Desktop Manual Guide rev. 14
GCAS Desktop commences the export operation. On this screen you should see a new window of
Microsoft Excel opens (possibly minimised in background). If you switch to that Microsoft Excel
window, you see GCAS data is being written to the worksheet.
For large number of records, the process may take a prolonged time. Do not close Microsoft Excel
until GCAS Desktop displays the final wizard page:
Page 351 of 388
GCAS® Desktop Manual Guide rev. 14
This is an example Microsoft Excel worksheet after export process is finished.
28.3
Export to Microsoft Access
This exporter module exports GCAS data to Microsoft Access database file (.accdb). Unlike the SQL
Compact export, the export result is not a GCAS database thus you cannot use it as "local offline"
database. The export result is a simple Microsoft Access database intended for further analysis.
Note
You need the GCAS feature Export to Microsoft Office to be included in your GCAS licence in order to
use this feature. Additionally, this exporter also requires just one of these…
- Microsoft Access 2010,
- Microsoft Access Database Engine 2010,
- Microsoft Access 2013 32-bit, or
- Microsoft Access Runtime 2013 32-bit (the 64-bit won’t work)
…to be installed on your computer.
Choose Export to MS Access to begin.
Page 352 of 388
GCAS® Desktop Manual Guide rev. 14
Tick all GC devices you would like to have their data exported.
Page 353 of 388
GCAS® Desktop Manual Guide rev. 14
Choose the data kind and a date range to export. If you tick Also include records marked as
inactive, inactive footprints, calibration data, mole composition data, calibration certificates,
uncertainty coefficients, MLC coefficients, and lag time data, including comments for them (if selected)
within the defined date range will also be included in the export.
Set the destination Access database file.
Page 354 of 388
GCAS® Desktop Manual Guide rev. 14
Review the export settings, then click Next to begin the export process.
GCAS Desktop commences the export operation.
Page 355 of 388
GCAS® Desktop Manual Guide rev. 14
This wizard page confirms that the export has been successful. You can now open the ACCDB file.
If you chose to export mole composition data and there were spot samples within selected range,
these spot samples are represented by stream number negative one (−1) in the Access database.
Here is an example of export result Microsoft Access database file.
Page 356 of 388
GCAS® Desktop Manual Guide rev. 14
Note
If you opted to export uncertainty coefficients or MLC coefficients, the coefficients are stored in two
separate tables: UncertaintyCoefficients and UncertaintyCoefficients_Details for uncertainty, or
MultilevelCoefficients and MultilevelCoefficients_Details for multilevel calibration.
The table UncertaintyCoefficients and MultilevelCoefficients store the principal metadata of the
coefficient sets while UncertaintyCoefficients_Details and MultilevelCoefficients_Detail table contain the
actual coefficients.
You only need to open UncertaintyCoefficients table because UncertaintyCoefficients_Details is already
linked to this table. Rep stands for repeatability coefficient, while Rcc means response concentration
coefficient. Similarly you need to open MultilevelCoefficients, not the _Details one.
28.4
Export to Microsoft SQL Server Compact Database
This exporter module exports GCAS data to Microsoft SQL Server Compact Edition database file (.sdf).
The export result is a complete GCAS database thus you can use it as a "local offline" database.
Note
You need the GCAS feature Export to Microsoft SQL Server Compact Edition to be included in your
GCAS licence in order to use this feature. Additionally, make sure that Microsoft SQL Server Compact
Edition v4.0 has been installed on your computer (it is already a pre-requisite anyway). Otherwise, the
Export Wizard will raise an error.
What included in the export result will be:
1.
The information about of the selected devices in wizard step 1,
2.
The agreement records for these devices,
3.
Analysis parameter of these devices,
4.
Footprint and calibration data of these devices (if selected in wizard step 2)*,
5.
Mole composition data of these devices (if selected in wizard step 2)*,
6.
Calibration gas certificates of these devices (if selected in wizard step 2)*,
Page 357 of 388
GCAS® Desktop Manual Guide rev. 14
7.
Uncertainty coefficients of these devices (if selected in wizard step 2)*,
8.
Multilevel calibration coefficients of these devices (if selected in wizard step 2)*,
9.
Lag time records of these devices (if selected in wizard step 2)*,
10. Comments for these devices (if selected in wizard step 2)*,
11. The groups to which these devices belong,
12. The workspaces belong to these groups,
13. Login data of all users who joined these groups (yes, they can log in to the exported database
file too),
14. User profile data of all users who joined these groups,
15. All user types and roles including custom ones,
16. All menu permissions and action permissions.
*within the selected date range.
Choose Export to SQL Compact to begin. You cannot export to SQL Compact when you are working
offline because database structure of full database and temporary database are different.
Tick all GC devices you would like to have their data exported.
Page 358 of 388
GCAS® Desktop Manual Guide rev. 14
Choose the data kind and a date range to export. If you tick Also include records marked as
inactive, inactive footprints, calibration data, mole composition data, calibration certificates,
uncertainty coefficients, MLC coefficients, and lag time data, including comments for them (if selected)
within the defined date range will also be included in the export.
Page 359 of 388
GCAS® Desktop Manual Guide rev. 14
Set the destination database file.
Review the export settings, and click Next to begin the export process.
Page 360 of 388
GCAS® Desktop Manual Guide rev. 14
GCAS Desktop commences the export operation.
This wizard page confirms that the export has been successful. Click Finish to close the wizard.
In order to verify the export result, try changing database to the SDF file. Use local offline option,
choose Microsoft SQL Server Compact and point to the export file.
Page 361 of 388
GCAS® Desktop Manual Guide rev. 14
Note
If the option Local offline database as in the screenshot below is greyed out, it means you do not
have GCAS feature Local Offline Database in your GCAS licence.
You should see the file name on your device panel and use GCAS Desktop as usual. However, you
would notice several differences:
This offline database file contains only the devices you have selected in wizard step 1,
This offline database file contains data for the limited date range you have set in wizard step
2,
Users who can log in to this offline database file are only you and those who joined the same
groups as you.
Page 362 of 388
GCAS® Desktop Manual Guide rev. 14
Page 363 of 388
GCAS® Desktop Manual Guide rev. 14
29 Work Offline
GCAS Desktop supports offline mode which might be useful in certain scenarios, such as your network
connection is disrupted or when you need to take the laptop away to a remote site where internet
connection is a luxury. To work offline, you need to set up your own temporary database. GCAS
Desktop uses this temporary database while in offline mode.
Note
To use this feature, you need the GCAS feature Work-offline Capability to be included in your GCAS
licence.
Work-offline is available if your main database server is i-Vigilant central database or your local
corporate database. Offline working is not available for local offline database because it is already
offline.
Some features are not available in offline mode. For instance, you cannot change database, edit your
profile, edit your password, or use the Administrator menu while working offline.
29.1
Set Up Temporary Database
You can either create new temporary database or reuse an existing backup.
29.1.1
Create New Temporary Database
Close all open forms to make sure GCAS Desktop is not performing any operations to the GCAS
database. Then, go to the File menu > Work Offline > Initialise Temporary Database.
Do not open any forms or dialogue box while initialisation is in progress.
Page 364 of 388
GCAS® Desktop Manual Guide rev. 14
GCAS Desktop creates your temporary database located in the [installation directory]\DBWorkOffline\your username.sdf. GCAS Desktop then synchronises all data from the main
database server since last month to your temporary database. That is, all data having timestamp
greater than today minus one month. On completion, the progress window displays the confirmation
message.
To change how much data to synchronise into temporary database, go to the File menu > Work
Offline > Work Offline Preferences. Change how many months of data to store on your temporary
database between 1 month and 24 months (2 years), then do a manual sync to enforce the change.
Page 365 of 388
GCAS® Desktop Manual Guide rev. 14
29.1.2
Restore a Backup
Open the File menu > Work Offline > Use Existing Temporary Database. A file dialogue should
appear and you can point GCAS Desktop to your backup.
29.2
Synchronise Temporary Database
To initiate a manual sync between your temporary database and your main database server, first you
need to work online. Look at the work-offline indicator on the status bar of main user interface, it
should display Online. If not, follow chapter 29.3 to switch into online mode.
Go to the File menu > Work Offline > Sync Now.
Page 366 of 388
GCAS® Desktop Manual Guide rev. 14
Any changes made on the temporary database are committed to the main database server, then your
temporary database is refreshed with new data from server. Sync process may take a prolonged time
if you have ten thousands of unsynchronised records, especially mole composition data.
Should the progress bar turns red and you see an error message, click on the Error message button
to see the error log. Or if it turns yellow and you see conflicts, click Resolve conflicts to resolve them.
Note
Some cases of stale condition bug (the progress bar halts and the computer does nothing) have been
reported. Now we introduce stale prevention mechanism. If for any reason you clicked Abort in the
middle of sync operation, GCAS Desktop tries to stop the sync sequence within 10 seconds. If the
operation couldn't abort after 10 seconds, the form displays the Force abort button. Use this button
to terminate background threads immediately.
29.3
Going Offline, Going Online
Manual switch between online and offline mode requires all open forms to be closed. This is to make
sure that GCAS Desktop is not doing any operation on GCAS database.
Switch into offline mode: Go to the File menu > Work Offline > Go Offline to switch immediately.
Alternatively, choose the second menu (Sync then Go Offline). The second menu will initiate a sync
and afterwards switches GCAS Desktop to offline mode.
On successful switchover, the work-offline indicator displays “Offline” and there will be a
notification that you are now working offline.
Page 367 of 388
GCAS® Desktop Manual Guide rev. 14
Switch into online mode: Similarly, go to the File menu > Work Offline > Go Online.
On successful switchover, the work-offline indicator on the status bar displays “Online” and also
there will be a notification that you are now working online. If automatic sync on switchover is turned
on, GCAS Desktop initiates a database sync automatically.
Page 368 of 388
GCAS® Desktop Manual Guide rev. 14
29.4
Automatic Sync when Returning Online
GCAS Desktop can start an automatic database sync when you go online. To enable this feature, open
the Work Offline Preferences dialogue by opening the File menu > Work Offline > Work Offline
Preferences.
Tick Automatically sync to central/online database server when I go online to turn on this feature.
Next time you work offline and is about to switch into online mode, GCAS Desktop synchronise the
temporary database and the main database server as soon as it enters online mode.
29.5
Automatic Switchover on Network Problem
GCAS Desktop switches to your temporary database if the network connection between your
computer and GCAS database server gets interrupted. To enable this feature, open Work Offline
Preferences through the File menu > Work Offline > Work Offline Preferences. Give a tick mark on
Automatically switch to temporary database if network connection is lost.
Page 369 of 388
GCAS® Desktop Manual Guide rev. 14
In case of network disturbance, GCAS Desktop displays an overlay notification telling you that GCAS
has switched to offline mode. Click anywhere on the overlay to dismiss the notification.
We strongly recommend to close and reopen all open forms. This is because each form retains a
connection to GCAS database server but the disruption cut this connection. Attempting to continue
working on open forms may raise an error especially when there is a task to load or reload data from
the database.
Page 370 of 388
GCAS® Desktop Manual Guide rev. 14
Please do not attempt to go back online should your network connection had not recovered.
Attempting to do so would make GCAS Desktop tries to connect to your main database server, finds it
failing, and switches back to your temporary database.
29.6
Automatic Resumption of Data Capture
GCAS Desktop stops all data capture operations immediately after it detects network connectivity
problem. This is because the connection between GC Connect form and GCAS database server was cut
during this disruption, thus an attempt to commit an incoming new record to database server would
yield an error.
If you don't have GCAS feature Work-offline Capability in your GCAS licence, or if you never set up a
temporary database beforehand, all GC Connect forms remain stopped after the disruption. This is
particularly bad if you used unattended mode, as no one knows that the operation terminated until
someone visits the computer.
With work-offline capability, GCAS Desktop can safely resume all data capture operations after
switching to temporary database. To enable this feature, open Work Offline Preferences dialogue
through the File menu > Work Offline > Work Offline Preferences.
Page 371 of 388
GCAS® Desktop Manual Guide rev. 14
First, automatic switch on network problem must be checked. Then, give a check mark on Resume all
Modbus operations after a successful switchover. Through this way, all unattended data capture
operations stop temporarily and continue soon after GCAS Desktop enters offline mode. Records
committed before network disruption are still available on your main database server but records
committed after network disruption will be stored on your temporary database. You can synchronise
records between these two databases later after the network connectivity is up again.
29.7
Automatic Detection of Online Connectivity
After all the fuss of automatic switchover on network problem, GCAS Desktop may ping the database
server from time to time in order to see if you can return online. To activate this feature, open Work
Offline Preferences dialogue through the File menu > Work Offline > Work Offline Preferences.
Note
This feature works only for offline mode caused by network disruption. GCAS Desktop will never ping
the database server if you intentionally switched into offline mode as described in chapter 29.3 Going
Offline.
Page 372 of 388
GCAS® Desktop Manual Guide rev. 14
First, automatic switch on network problem must be checked. Next, tick Do a periodic check if GCAS
can return online and set the desired interval. You can choose ping interval from every single minute
to every one hour.
And if GCAS Desktop can return online, choose one of the available sub options.
a.
Notify me: GCAS displays a panel notification at the bottom of the main user interface saying
you can return online. Pick the appropriate decision whether to go online or stay offline.
As a reminder, when you choose to go online, make sure that all open forms have been closed.
You can reopen these forms later after the switchover.
b. Automatically switch back to central/online database: GCAS performs another automatic
switchover to online mode when possible. This is particularly useful for unattended data capture.
If you choose this option, all data capture operations will once again be stopped during the
switchover. Tick Resume all Modbus operations after a successful switchover to make GCAS
Desktop resumes all data capture operations after entering online mode. Special case if you also
enabled automatic sync when returning online, the sequence is temporary database sync comes
first then data capture resumption takes place afterwards.
Page 373 of 388
GCAS® Desktop Manual Guide rev. 14
29.8
Sync Error Log
During a database sync, the process may stop when GCAS Desktop encounters errors. Red progress
bar indicates serious errors, while yellow progress bar indicates less severe errors. Click the Error
message button to see more details about the error.
Error messages can be as simple (yet fatal) as one message box like this one…
…or more complicated that the errors are displayed in a dedicated window.
Page 374 of 388
GCAS® Desktop Manual Guide rev. 14
These kinds of error are usually related to database. For example, the message in first example
"Column name is not valid" means the database structure is incomplete. This indicates the file
[installation directory]\DB-Template\WorkOffline.sdf is corrupt (or outdated) and
you need to upgrade the GCAS database file. In the second example, "Cannot add or update a
child row: a foreign key constrain fails" means there are some records missing in
another table inside the database, but GCAS needs these records in order to write current record.
If you use i-Vigilant central database and see Database Sync Error Log such as in the second example,
click Save error log button and send the file to our support team so that we can look for the cause of
error. If you use local corporate database, your database administrator (DBA) might help you solve the
problem.
GCAS Desktop tries to create a backup file of your temporary database before sync process begins.
You can find the backup in the same directory as your temporary database. Some scenarios might
prevent GCAS Desktop to create this backup though, such as if your hard disk is full. The file resides
on [installation directory]\DB-WorkOffline\your username.sdf.backup. Should
these sync errors render your temporary database unusable, follow these steps.
1.
Go online and cancel automatic sync (if any; by pressing the Abort button).
2.
Open the File Explorer (“Windows Explorer” on Windows Vista and 7) and navigate to
[installation directory]\DB-WorkOffline\ directory.
3.
Delete your temporary database (your username.sdf)
4.
Rename your username.sdf.backup into your username.sdf
A better solution is available if you have ever made a proper backup of your temporary database.
1.
Copy your current temporary database file to somewhere else.
2.
Go online and stop any automatic sync by pressing the Abort button.
3.
Open the File menu > Work Offline > Delete Temporary Database. This will delete the
problematic temp database file.
4.
Open the File menu > Work Offline > Use Existing Temporary Database.
5.
Point to your backup .sdf file.
6.
Do a manual sync to refresh the temporary database file.
Should all the steps above did not provide remedy to the problem, you might need to delete your
temporary database and recreate a new one. You may lose data which has not been synchronised to
the main database server.
29.9
Conflict Resolution
A conflict is a mismatch between database record on your main database server and the
corresponding record on your temporary database so that GCAS Desktop cannot determine which
one to keep. GCAS Desktop keeps track of when a record was changed and uses this information to
determine which one is the most recent. When a conflict happens, this last-modified information is
either equal (meaning that both records were updated at the same time) or unavailable. The
probability you would find a record conflict is quite rare, nevertheless a slim chance is not zero chance.
Page 375 of 388
GCAS® Desktop Manual Guide rev. 14
When conflicts arise, the sync progress bar turns yellow. Click Resolve conflicts to see what records
are conflicting. The button brings the Resolve Conflicts dialogue similar to the screenshot below.
Conflicting fields are highlighted in yellow.
To resolve one conflict, click the appropriate button whether to Use online record or Use offline
record. Using online record wins the record on your main database server and replaces the conflicting
record on your temporary database. On the opposite side, using offline record wins the record on
your temporary database and replaces the offending record on your main database server.
Once you clicked the appropriate button, GCAS Desktop applies change to both databases and moves
on to the next conflict if any. To repeat your action whether using online record or offline record for a
particular database table, first tick Repeat my action for all conflicts on the same table and then
click the appropriate decision whether to Use online record or Use offline record. GCAS Desktop
applies the same action for all conflicts on the same database table in the queue. Eventually GCAS
Desktop may load a conflict of a different database table; GCAS Desktop will display both records and
ask you to review and decide an action again. At the end, when all the conflicts have been resolved,
the dialogue closes automatically.
Page 376 of 388
GCAS® Desktop Manual Guide rev. 14
Note
To leave all conflicts as they are, i.e. to let the records be different between your main database and
your temporary database, close the Resolve Conflicts dialogue using the close (×) button on the title
bar. GCAS Desktop will ask you to resolve them later upon next sync operation.
29.10 Login Form in Offline Mode
When you are working offline, you can also log out from GCAS as usual (or be automatically logged
out for inactivity). However please notice that the login form is in offline mode now. A warning icon
appears on the right side of Quit button.
During offline mode, only users who already set up their temporary databases can log in.
Login form in offline mode behaves differently compared to normal (online) mode. As in online mode,
GCAS Desktop is continuously connected to GCAS database server so that any login attempt is
immediately verified against user credential in the database server. However in offline mode, the login
form first checks if the user has his temporary database available, then verifies the login attempt
against credential stored inside his temporary database. This is why users without temporary
databases (i.e. never set them up before) cannot log in to GCAS.
Page 377 of 388
GCAS® Desktop Manual Guide rev. 14
In an unfortunate scenario where you have never set up your temporary database, you would not be
able to log in during offline mode. You can force GCAS to return online and here are the steps to do
so.
1.
Verify that your network or internet connection is working.
2.
Exit GCAS Desktop through the Quit button on the login form.
3.
Run GCAS Desktop with an additional /online parameter.
4.
GCAS is now back in online mode.
5.
Log in as usual, and now is the chance to set up your temporary database.
29.11 Online/Offline Mode Persistence
By default, GCAS Desktop assumes online mode every time it is launched. If you choose to work
offline, GCAS Desktop enters offline mode until you exit the software but returns to online mode on
the next time you run the software again.
You can make GCAS Desktop stay in offline mode even after you exit GCAS. To do so, open Work
Offline Preferences dialogue through the File menu > Work Offline > Work Offline Preferences. Give
a tick on Remember current state (offline/online) for the next time GCAS is launched.
Page 378 of 388
GCAS® Desktop Manual Guide rev. 14
When you switch to offline mode and exit GCAS Desktop, the login form will stay in offline mode
upon next time you launch GCAS Desktop.
Warning
Only users who have set up their temporary database can log in during offline mode.
To override the initial mode, run GCAS Desktop with one of the following parameters:
/online
: Forces online mode.
/offline
: Forces offline mode.
29.12 Maintenance of Temporary Database
To perform maintenance, you need to go online. Then open the File menu > Work Offline > Maintain
Temporary Database. It contains all submenus to perform database maintenance.
Page 379 of 388
GCAS® Desktop Manual Guide rev. 14
Menu
What it does
Information
Displays the size of your temporary database file, how much data stored in it
(i.e. the timestamp of the earliest data available), and also the date and time of
last sync operation.
Compact
Tries to shrink the size of your temporary database file by consolidating sparse
free spaces similar to defragmenting a hard disk.
Verify
Uses the built-in verification feature on Microsoft SQL Server Compact Edition
in order to check that all tables and indexes are not corrupt. If verification
result says the database is corrupted, try the Repair menu.
Repair
Should the Verify menu reported a problem on your temporary database, this
menu attempts to repair the file.
Backup
Makes a backup copy of your temporary database. To restore from this
backup, use the Restore menu. Otherwise if you have deleted your temporary
database, go to chapter 29.1.2 Restore a Backup to reuse this backup file.
Restore
Replaces your current temporary database with a backup.
29.13 Deactivate Offline Working
To deactivate this work-offline feature, you need to go online. It is a good idea to synchronise your
main database server with your temporary database for the last time, in order to make sure there are
no pending data in your temporary database which have not been synchronised to your database
server. Then, open the File menu > Work Offline > Delete Temporary Database.
Page 380 of 388
GCAS® Desktop Manual Guide rev. 14
This will delete your temporary database file. You cannot work offline until you set up a new
temporary database or open an existing backup.
Page 381 of 388
GCAS® Desktop Manual Guide rev. 14
30 Diagnostic and Maintenance
This chapter attempts to assist you in case of errors and malfunctions of GCAS Desktop.
30.1
Diagnostic Mode
On a rare occasions of malfunctions such as exceptions, unhandled exceptions, crashes, or wrong
calculations, you can run GCAS Desktop in diagnostic mode to collect additional information about the
reason for the malfunction to happen. On diagnostic mode, GCAS Desktop displays an additional
window that acts like a debugger output window. When you report a bug to us, this diagnostic log
helps us a lot in order to resolve the problem.
Start GCAS Desktop with an additional parameter /enablediagnostic to activate diagnostic mode.
Formerly it was "/enablediagnostics" (with an incorrect "s" at the end of word), now it is
"/enablediagnostic".
The diagnostic window looks like a console. GCAS Desktop runs normally alongside this window and
you can use the software as usual.
Page 382 of 388
GCAS® Desktop Manual Guide rev. 14
You can minimise or close the diagnostic window at any time. The diagnostic window continues to
output debug information even after it is closed. To show the window again, go to the Diagnostics
menu > View Log Window.
To save the diagnostic information, use the
the contents through the
Save button on the toolbar. Alternatively you can copy
Copy button then paste it onto notepad or any text editor.
Info
If GCAS Desktop crashed, it might not be possible to use the Save or Copy button on the toolbar
because the user interface is frozen (white-shadowed) by Windows operating system. A screenshot of
this frozen diagnostic window should suffice to help us understanding what the reason and at which
point the error happened.
30.2
What Happened to Bug Report Wizard?
Unfortunately we disabled Bug Report Wizard due to policy changes of our mail provider. In the past,
Bug Report Wizard worked by sending your report and all additional attachments (diagnostic log and
Page 383 of 388
GCAS® Desktop Manual Guide rev. 14
optional screenshots) via email to our development team behind the screen. However our mail
provider didn’t seem happy and made few changes in their terms of use. For that reason, we need to
temporarily disable the Bug Report Wizard until we developed a new reporting mechanism which
doesn’t involve SMTP (email). Bug Report Wizard has disappeared since GCAS Desktop version 1.7.2.0.
For the time being, please send your bug report with any additional attachments such as diagnostic
log, stack trace, or screenshots to [email protected].
Page 384 of 388
GCAS® Desktop Manual Guide rev. 14
31 GCAS Startup Parameters
Startup parameters are optional arguments used to run GCAS Desktop or GCAS Activator, with the
intention to enable or disable some advanced functionality.
Below are the list of additional start up parameters for GCAS Desktop (GCASMain.exe).
/changedatabase
:
Displays the Change Database dialogue only. GCAS Desktop
terminates immediately after you click the OK button. This
parameter cannot be combined with any other parameters.
/online
:
Forces online mode. Cannot be combined with /offline switch.
/offline
:
Forces offline mode. Cannot be combined with /online switch.
Only users who have set up their temporary database can log in
to GCAS.
/disablefilecheck
:
Disables the integrity check during startup. GCAS Desktop will
not check the files inside the installation directory for any
unauthorised changes.
/disablekeepalive
:
Turns off the database ping timer. Database ping timer sends a
ping to your database server once every 30 seconds. This is
because some database servers disconnect the client if there
were no activity for a certain interval. By running GCAS Desktop
with this parameter, ping timer will not run and GCAS database
server may terminate your connection for extended period of
inactivity.
/disableexcel
:
Disables the Microsoft Office interop module. That is, Export
Data to Excel won't be available, Copy to Excel button on the
Comments form will be greyed out, Export Values to Excel button
on the Mole Composition Comparison form will be disabled,
Export to Excel button on MLC offline converter tools will be
unavailable, and pretty much everything that exports directly to
Microsoft Excel. Use this switch if you see "COM exception"
continuously every time you use features related to Microsoft
Excel.
/enablediagnostic
:
Activates the diagnostic mode.
/confirmimport
:
Causes GCAS Desktop to display a confirmation dialog whenever
you import a footprint or calibration data from a text file.
Clicking Cancel on the confirmation dialog will abort the import
process.
Page 385 of 388
GCAS® Desktop Manual Guide rev. 14
/modbusbase:X
:
Translates the base register address from the default 0 (zero) to
any number you have specified. There is a colon (:) between
“modbusbase” and the number, but there must not be any
spaces between modbusbase, the colon, and the number.
For example, /modbusbase:40000 specifies base address
40000 instead of 0. This switch is only used for certain GC
devices and on specific circumstances.
/disablecalibrationcache
:
By default, whenever you open GC Connect form, the latest RF
and RT data for that device is cached. If the first poll returns the
exact same RF and RT data, this incoming record is not regarded
as a new data, thus GCAS Desktop avoids duplicated RF/RT data.
This switch disables the caching behaviour. If you run GCAS
Desktop with /disablecalibrationcache, latest RF/RT data is not
cached during the launch of GC Connect form.
/drawincompleteRFRT
:
If GCAS Desktop was instructed to ignore RF or RT data during
data capture, GCAS Desktop assigns a special value −1 to all RF
or RT values. This −1 value is not drawn on Data Analysis form.
Using this switch overrides the behaviour; −1 values are always
graphed.
/disabledoublebuffering
:
Disables double buffering on your graphic card when rendering
GCAS Desktop main form. Use this switch if you experience
display problem or performance drop when using GCAS
Desktop.
/drawemptyUT
:
Forces GCAS to reveal empty points in Uncertainty Trend chart.
Empty points are data points that only has X value, without Y
value or its Y value is undefined. Example of empty points is
when you set the uncertainty trend in forward direction and the
minimum number of data is 10, then the first 9 calibration data
after a footprint are marked as empty (hence is not drawn on the
chart and you see a gap).
With /drawemptyUT, GCAS Desktop draws grey dots for empty
points. The X values of these grey dots are valid (correspond to
dates and times on X-axis correctly), but their Y values are
meaningless.
/disableUTcache
:
Disables cache in the Uncertainty Trend module. GCAS Desktop
caches the calibration certificate and footprint reference while
calculating uncertainty values. Disabling the cache means GCAS
Desktop will always retrieve the footprint and certificate values
from database. This makes calculation time becomes longer.
Page 386 of 388
GCAS® Desktop Manual Guide rev. 14
/excludefootprintUT
:
Forces GCAS Desktop to exclude the last footprint while
calculating uncertainty values in Uncertainty Trend module.
On normal forward calculation, the data included to calculate the
uncertainty at one point is taken from the last footprint
(including the footprint itself) up to this point. This switch causes
GCAS to exclude that last footprint, so data range starts from
one calibration after the footprint.
On normal backward calculation, the data included to calculate
the uncertainty at one point is taken from that point and travels
backward. If you set GCAS to trim at footprint, the last footprint
is included in the calculation but it stops (hence the footprint is
the last data). With /excludefootprintUT, GCAS stops at one
calibration after the footprint. Nevertheless, if you set GCAS to
continue through (include data before footprint) then this switch
has no effect.
/UTdiagnostic
:
Activates the Uncertainty Trend diagnostic.
Additionally, these are a list of advanced start-up parameters for GCAS Activator
(GCASActivate.exe).
/?
:
Displays a quick help in a console window or a message box.
/info
:
Displays the details of the licence and registration key installed on
your computer.
/compcode
:
Displays the computer code of your computer.
/install <licence string>
:
Installs the specified GCAS licence, or replaces currently installed
licence with a new one. Cannot be combined with /revoke
parameter. Recommended to combine /install with /regkey
parameter so that you install the licence and registration key in one
go.
/regkey <6-digit
:
registration key>
/revoke
Installs the specified registration key, or replaces current registration
key with a new one. Cannot be combined with /revoke parameter.
:
Uninstalls the current licence and registration key from your
computer. Cannot be combined with /install nor /regkey.
Deactivating your GCAS Desktop software does not automatically
increase your activation count in case you bought licences for
multiple computers. Contact us to migrate your licence along with
Page 387 of 388
GCAS® Desktop Manual Guide rev. 14
attaching the screenshot of command prompt window as a proof of
deactivation.
/silent
:
Do not display any message boxes or confirmation messages.
Combine this switch with /install, /regkey, or /revoke.
Note
GCAS Activator (GCASActivate.exe) requires elevation. Run GCASActivate.exe on an elevated
command prompt (run as administrator) to use the commands above.
**End of Document**
Page 388 of 388