1
User’s Manual
Smart-Accredit CLOSO
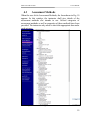
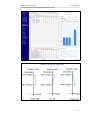
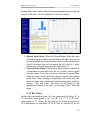
Fig. 29: CLO Satisfaction Data
7.2
SO Satisfaction
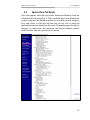
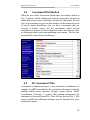
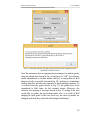
When the instructor clicks “SO Satisfaction”, the SO Satisfaction
window shown in Fig. 30 appears. It displays the final results after
converting the CLO based data to SO based data.
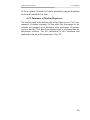
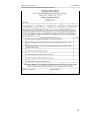
Fig. 30: SO Satisfaction Data
The window shows, for all assessments, the marks associated with each
SO under the header labeled “M” and the percentage of students
attaining the program satisfaction criterion for each SO under the
header labeled “P”. The first column lists the names of the assessments.
Two columns for each SO list the values of M and P. The last row
displays a weighted average of the program satisfaction for each SO
42