Download INST 260 (Data Acquisition systems), section 1 Lab Data

Transcript
INST 260 (Data Acquisition systems), section 1
Lab
Data acquisition and transport over Ethernet: Question 91, completed objectives due by the end of
day 6, section 3
Exam
Day 6 of section 3 – only a simple calculator may be used!
Specific objectives for the “mastery” exam:
• Electricity Review: Calculate voltages and currents in a DC series-parallel resistor circuit given source
and resistor values
• Sketch proper wire connections for a data acquisition unit to measure an analog sensor signal
• Convert between different numeration systems (decimal, binary, hexadecimal, octal)
• Calculate ADC (analog-digital converter) input and output values given calibrated ranges
• Solve for a specified variable in an algebraic formula
• Determine the possibility of suggested faults in a simple circuit given measured values (voltage, current),
a schematic diagram, and reported symptoms
• INST230 Review: Determine status of a relay logic circuit given a schematic diagram and switch stimulus
conditions
• INST241 Review: Identify (American) wire colors for different thermocouple types
• INST250 Review: Convert between different pressure units (PSI, ”W.C., bar, etc.) showing proper
mathematical cancellation of units (i.e. the “unity fraction” technique)
Recommended daily schedule
Day 1
Theory session topic: Signal coupling, shielding, and wiring practices
Questions 1 through 20; answer questions 1-12 in preparation for discussion (remainder for practice)
Day 2
Theory session topic: Digital data representation and analog/digital converters
Questions 21 through 40; answer questions 21-28 in preparation for discussion (remainder for practice)
Day 3
Theory session topic: Data acquisition hardware
Questions 41 through 60; answer questions 41-48 in preparation for discussion (remainder for practice)
Day 4
Theory session topic: Serial communication principles
Questions 61 through 80; answer questions 61-69 in preparation for discussion (remainder for practice)
Feedback questions (81 through 90) are optional and may be submitted for review at the end of the day
1
Introduction to Spring Quarter
This quarter focuses on the use of digital computer systems for measurement and control. Ideas to
keep in mind for special projects (alternatives to standard lab as well as extra-credit) include long-range
measurement systems using wireless (radio) communication, as well as advanced process-control systems
(beyond single-loop PID). For those who have studied programmable logic controllers (PLCs), there will be
application to use your PLCs again when we build safety instrumented systems (SIS) later this quarter!
For those who have not yet taken the Summer-quarter PLC courses (INST23X), now is a good time
to place orders for your PLC hardware or purchase used from classmates who have already finished those
courses. See the INST231 or INST232 worksheets and syllabi for a list of required hardware and software!
2
How To . . .
Access the worksheets and textbook: go to the Socratic Instrumentation website located at
http://www.ibiblio.org/kuphaldt/socratic/sinst to find worksheets for every 2nd-year course section
organized by quarter, as well as both the latest “stable” and “development” versions of the Lessons In
Industrial Instrumentation textbook. Download and save these documents to your computer.
Maximize your learning: come to school prepared each and every day – this means completing all your
homework before class starts. Use every minute of class and lab time productively. Follow all the tips
outlined in “Question 0” (in every course worksheet) as well as your instructor’s advice. Don’t ask anyone
to help you solve a problem until you have made every reasonable effort to solve it on your own.
Identify upcoming assignments and deadlines: read the first page of each course worksheet.
Relate course days to calendar dates: reference the calendar spreadsheet file (calendar.xlsx), found
on the BTC campus Y: network drive. A printed copy is posted in the Instrumentation classroom.
Locate industry documents assigned for reading: use the Instrumentation Reference provided by
your instructor (on CD-ROM and on the BTC campus Y: network drive). There you will find a file named
00 index OPEN THIS FILE.html readable with any internet browser. Click on the “Quick-Start Links” to
access assigned reading documents, organized per course, in the order they are assigned.
Study for the exams: Mastery exams assess specific skills critically important to your success, listed near
the top of the front page of each course worksheet for your review. Familiarize yourself with this list and pay
close attention when those topics appear in homework and practice problems. Proportional exams feature
problems you haven’t seen before that are solvable using general principles learned throughout the current and
previous courses, for which the only adequate preparation is independent problem-solving practice every day.
Answer the “feedback questions” (practice exams) in each course section to hone your problem-solving skills,
as these are similar in scope and complexity to proportional exams. Answer these feedback independently
(i.e. no help from classmates) in order to most accurately assess your readiness.
Calculate course grades: download the “Course Grading Spreadsheet” (grades template.xlsx) from
the Socratic Instrumentation website, or from the BTC campus Y: network drive. Enter your quiz scores,
test scores, lab scores, and attendance data into this Excel spreadsheet and it will calculate your course
grade. You may compare your calculated grades against your instructors’ records at any time.
Identify courses to register for: read the “Sequence” page found in each worksheet.
Identify scholarship opportunities: check your BTC email in-box daily.
Identify job openings: regularly monitor job-search websites. Set up informational interviews at
workplaces you are interested in. Participate in jobshadows and internships. Apply to jobs long before
graduation, as some employers take months to respond! Check your BTC email account daily, because your
instructor broadcast-emails job postings to all students as employers submit them to BTC.
Impress employers: sign the FERPA release form granting your instructors permission to share academic
records, then make sure your performance is worth sharing. Document your project and problem-solving
experiences for reference during interviews. Honor all your commitments.
Begin your career: participate in jobshadows and internships while in school to gain experience and
references. Take the first Instrumentation job that pays the bills, and give that employer at least two years
of good work to pay them back for the investment they have made in you. Employers look at delayed
employment, as well as short employment spans, very negatively. Failure to pass a drug test is an immediate
disqualifier, as is falsifying any information. Criminal records may also be a problem.
file howto
3
General Values and Expectations
Success in this career requires: professional integrity, resourcefulness, persistence, close attention to
detail, and intellectual curiosity. Poor judgment spells disaster in this career, which is why employer
background checks (including social media and criminal records) and drug testing are common. The good
news is that character and clear thinking are malleable traits: unlike intelligence, these qualities can be
acquired and improved with effort. This is what you are in school to do – increase your “human capital”
which is the sum of all knowledge, skills, and traits valuable in the marketplace.
Mastery: You must master the fundamentals of your chosen profession. “Mastery” assessments challenge
you to demonstrate 100% competence (with multiple opportunities to re-try). Failure to complete any
mastery objective(s) by the deadline date caps your grade at a C−. Failure to complete by the end of the
next school day results in a failing (F) grade.
Punctuality and Attendance: You are expected to arrive on time and be “on-task” all day just as you
would for a job. Each student has 12 hours of “sick time” per quarter applicable to absences not verifiably
employment-related, school-related, weather-related, or required by law. Each student must confer with the
instructor to apply these hours to any missed time – this is not done automatically. Students may donate
unused “sick time” to whomever they specifically choose. You must contact your instructor and lab team
members immediately if you know you will be late or absent or must leave early. Absence on an exam day
will result in a zero score for that exam, unless due to a documented emergency.
Time Management: You are expected to budget and prioritize your time, just as you will be on the job.
You will need to reserve enough time outside of school to complete homework, and strategically apply your
time during school hours toward limited resources (e.g. lab equipment). Frivolous activities (e.g. games,
social networking, internet surfing) are unacceptable when work is unfinished. Trips to the cafeteria for food
or coffee, smoke breaks, etc. must not interfere with team participation.
Independent Study: This career is marked by continuous technological development and ongoing change,
which is why self-directed learning is ultimately more important to your future success than specific
knowledge. To acquire and hone this skill, all second-year Instrumentation courses follow an “inverted”
model where lecture is replaced by independent study, and class time is devoted to addressing your questions
and demonstrating your learning. Most students require a minimum of 3 hours daily study time outside of
school. Arriving unprepared (e.g. homework incomplete) is unprofessional and counter-productive. Question
0 of every worksheet lists practical study tips.
Independent Problem-Solving: The best instrument technicians are versatile problem-solvers. General
problem-solving is arguably the most valuable skill you can possess for this career, and it can only be built
through persistent effort. This is why you must take every reasonable measure to solve problems on your own
before seeking help. It is okay to be perplexed by an assignment, but you are expected to apply problemsolving strategies given to you (see Question 0) and to precisely identify where you are confused so your
instructor will be able to offer targeted help. Asking classmates to solve problems for you is folly – this
includes having others break the problem down into simple steps. The point is to learn how to think on your
own. When troubleshooting systems in lab you are expected to run diagnostic tests (e.g. using a multimeter
instead of visually seeking circuit faults), as well as consult the equipment manual(s) before seeking help.
Initiative: No single habit predicts your success or failure in this career better than personal initiative, which
is why your instructor will demand you do for yourself rather than rely on others to do for you. Examples
include setting up and using your BTC email account to communicate with your instructor(s), consulting
manuals for technical information before asking for help, regularly checking the course calendar and
assignment deadlines, avoiding procrastination, fixing small problems before they become larger problems,
etc. If you find your performance compromised by poor understanding of prior course subjects, re-read those
textbook sections and use the practice materials made available to you on the Socratic Instrumentation
website – don’t wait for anyone else to diagnose your need and offer help.
4
General Values and Expectations (continued)
Safety: You are expected to work safely in the lab just as you will be on the job. This includes wearing
proper attire (safety glasses and closed-toed shoes in the lab at all times), implementing lock-out/tag-out
procedures when working on circuits with exposed conductors over 30 volts, using ladders to access elevated
locations, and correctly using all tools. If you need to use an unfamiliar tool, see the instructor for directions.
Orderliness: You are expected to keep your work area clean and orderly just as you will be on the job.
This includes discarding trash and returning tools at the end of every lab session, and participating in all
scheduled lab clean-up sessions. If you identify failed equipment in the lab, label that equipment with a
detailed description of its symptoms.
Teamwork: You will work in instructor-assigned teams to complete lab assignments, just as you will work
in teams to complete complex assignments on the job. As part of a team, you must keep your teammates
informed of your whereabouts in the event you must step away from the lab or will be absent for any reason.
Any student regularly compromising team performance through lack of participation, absence, tardiness,
disrespect, or other disruptive behavior(s) will be removed from the team and required to complete all
labwork individually for the remainder of the quarter. The same is true for students found relying on
teammates to do their work for them.
Cooperation: The structure of these courses naturally lends itself to cooperation between students. Working
together, students significantly impact each others’ learning. You are expected to take this role seriously,
offering real help when needed and not absolving classmates of their responsibility to think for themselves or
to do their own work. Solving problems for classmates and/or explaining to them what they can easily read
on their own is unacceptable because these actions circumvent learning. The best form of help you can give
to your struggling classmates is to share with them your tips on independent learning and problem-solving,
for example asking questions leading to solutions rather than simply providing solutions for them.
Grades: Employers prize trustworthy, hard working, knowledgeable, resourceful problem-solvers. The grade
you receive in any course is but a partial measure of these traits. What matters most are the traits
themselves, which is why your instructor maintains detailed student records (including individual exam
scores, attendance, tardiness, and behavioral comments) and will share these records with employers if
you have signed the FERPA release form. You are welcome to see your records at any time, and to
compare calculated grades with your own records (i.e. the grade spreadsheet available to all students).
You should expect employers to scrutinize your records on attendance and character, and also challenge you
with technical questions when considering you for employment.
Representation: You are an ambassador for this program. Your actions, whether on tours, during a
jobshadow or internship, or while employed, can open or shut doors of opportunity for other students. Most
of the job opportunities open to you as a BTC graduate were earned by the good work of previous graduates,
and as such you owe them a debt of gratitude. Future graduates depend on you to do the same.
Responsibility For Actions: If you lose or damage college property (e.g. lab equipment), you must find,
repair, or help replace it. If you represent BTC poorly to employers (e.g. during a tour or an internship),
you must make amends. The general rule here is this: “If you break it, you fix it!”
Non-negotiable terms: disciplinary action, up to and including immediate failure of a course, will
result from academic dishonesty (e.g. cheating, plagiarism), willful safety violations, theft, harassment,
intoxication, destruction of property, or willful disruption of the learning (work) environment. Such offenses
are grounds for immediate termination in this career, and as such will not be tolerated here.
file expectations
5
Course Syllabus
INSTRUCTOR CONTACT INFORMATION:
Tony Kuphaldt
(360)-752-8477 [office phone]
(360)-752-7277 [fax]
[email protected]
DEPT/COURSE #: INST 260
CREDITS: 4
Lecture Hours: 20
Lab Hours: 52
Work-based Hours: 0
COURSE TITLE: Data Acquisition Systems
COURSE DESCRIPTION: This course reviews digital theory learned in the first year (Core Electronics)
courses, building upon that foundation to explore industrial data busses (including Ethernet) and indicating,
datalogging, and SCADA systems. Pre/Corequisite course: INST 200 (Introduction to Instrumentation)
Prerequisite course: MATH&141 (Precalculus 1) with a minimum grade of “C”
COURSE OUTCOMES: Commission, analyze, and efficiently diagnose instrumented systems using data
acquisition units and industry-standard protocols to transport process data over wired and wireless networks.
COURSE OUTCOME ASSESSMENT: Data acquisition system commissioning, analysis, and diagnosis
outcomes are ensured by measuring student performance against mastery standards, as documented in the
Student Performance Objectives. Failure to meet all mastery standards by the next scheduled exam day will
result in a failing grade for the course.
6
STUDENT PERFORMANCE OBJECTIVES:
• Without references or notes, within a limited time (3 hours total for each exam session), independently
perform the following tasks. Multiple re-tries are allowed on mastery (100% accuracy) objectives, each
with a different set of problems:
→ Calculate voltages and currents in a DC series-parallel resistor circuit given source and resistor values,
with 100% accuracy (mastery)
→ Sketch proper wire connections for a data acquisition unit to measure an analog sensor signal, with
100% accuracy (mastery)
→ Convert between different numeration systems (decimal, binary, hexadecimal, octal), with 100%
accuracy (mastery)
→ Calculate ADC (analog-digital converter) input and output values given calibrated ranges, with 100%
accuracy (mastery)
→ Solve for specified variables in algebraic formulae, with 100% accuracy (mastery)
→ Determine the possibility of suggested faults in simple circuits given measured values (voltage,
current), schematic diagrams, and reported symptoms, with 100% accuracy (mastery)
→ Predict the response of networked instrumentation systems to component faults and changes in
process conditions, given pictorial and/or schematic illustrations
→ Sketch proper power and signal connections between individual instruments to fulfill specified control
system functions, given pictorial and/or schematic illustrations of those instruments
• In a team environment and with full access to references, notes, and instructor assistance, perform the
following tasks:
→ Demonstrate proper use of safety equipment and application of safe procedures while using power
tools, and working on live systems
→ Communicate effectively with teammates to plan work, arrange for absences, and share responsibilities
in completing all labwork
→ Construct and commission a working data acquisition system consisting of a DAQ unit, signal wiring,
Ethernet wiring and components, and a personal computer running DAQ software
→ Generate accurate schematic diagrams documenting your team’s DAQ system
• Independently perform the following tasks with 100% accuracy (mastery). Multiple re-tries are allowed
with different specifications/conditions each time):
→ Design and build a circuit responding to changes in either light intensity or ambient temperature
→ Diagnose a random fault placed in another team’s data acquisition system by the instructor within
a limited time using no test equipment except a multimeter and network diagnostic utilities on the
personal computer, logically justifying your steps in the instructor’s direct presence
COURSE OUTLINE: A course calendar in electronic format (Excel spreadsheet) resides on the Y:
network drive, and also in printed paper format in classroom DMC130, for convenient student access. This
calendar is updated to reflect schedule changes resulting from employer recruiting visits, interviews, and
other impromptu events. Course worksheets provide comprehensive lists of all course assignments and
activities, with the first page outlining the schedule and sequencing of topics and assignment due dates.
These worksheets are available in PDF format at http://www.ibiblio.org/kuphaldt/socratic/sinst
• INST260 Section 1 (Digital data acquisition and serial communication): 4 days theory and labwork
• INST260 Section 2 (Serial network standards): 4 days theory and labwork
• INST260 Section 3 (Industrial networking): 5 days theory and labwork + 1 day for proportional Exam
7
METHODS OF INSTRUCTION: Course structure and methods are intentionally designed to develop
critical-thinking and life-long learning abilities, continually placing the student in an active rather than a
passive role.
• Independent study: daily worksheet questions specify reading assignments, problems to solve, and
experiments to perform in preparation (before) classroom theory sessions. Open-note quizzes and work
inspections ensure accountability for this essential preparatory work. The purpose of this is to convey
information and basic concepts, so valuable class time isn’t wasted transmitting bare facts, and also to
foster the independent research ability necessary for self-directed learning in your career.
• Classroom sessions: a combination of Socratic discussion, short lectures, small-group problem-solving,
and hands-on demonstrations/experiments review and illuminate concepts covered in the preparatory
questions. The purpose of this is to develop problem-solving skills, strengthen conceptual understanding,
and practice both quantitative and qualitative analysis techniques.
• Lab activities: an emphasis on constructing and documenting working projects (real instrumentation
and control systems) to illuminate theoretical knowledge with practical contexts. Special projects
off-campus or in different areas of campus (e.g. BTC’s Fish Hatchery) are encouraged. Hands-on
troubleshooting exercises build diagnostic skills.
• Feedback questions: sets of practice problems at the end of each course section challenge your
knowledge and problem-solving ability in current as as well as first year (Electronics) subjects. These
are optional assignments, counting neither for nor against your grade. Their purpose is to provide you
and your instructor with direct feedback on what you have learned.
• Tours and guest speakers: quarterly tours of local industry and guest speakers on technical topics
add breadth and additional context to the learning experience.
STUDENT ASSIGNMENTS/REQUIREMENTS: All assignments for this course are thoroughly
documented in the following course worksheets located at:
http://www.ibiblio.org/kuphaldt/socratic/sinst/index.html
• INST260 sec1.pdf
• INST260 sec2.pdf
• INST260 sec3.pdf
8
EVALUATION AND GRADING STANDARDS: (out of 100% for the course grade)
• Completion of all mastery objectives = 50%
• Mastery exam score (first attempt) = 10%
• Proportional exam score = 30%
• Lab questions = 10%
• Quiz penalty = -1% per failed quiz
• Tardiness penalty = -1% per incident (1 “free” tardy per course)
• Attendance penalty = -1% per hour (12 hours “sick time” per quarter)
• Extra credit = +5% per project (assigned by instructor based on individual learning needs)
All grades are criterion-referenced (i.e. no grading on a “curve”)
100% ≥ A ≥ 95%
90% > B+ ≥ 86%
80% > C+ ≥ 76%
70% > D+ ≥ 66%
95% > A- ≥ 90%
86% > B ≥ 83%
76% > C ≥ 73%
66% > D ≥ 63%
83% > B- ≥ 80%
73% > C- ≥ 70% (minimum passing course grade)
63% > D- ≥ 60%
60% > F
A graded “preparatory” quiz at the start of each classroom session gauges your independent learning
prior to the session. A graded “summary” quiz at the conclusion of each classroom session gauges your
comprehension of important concepts covered during that session. If absent during part or all of a classroom
session, you may receive credit by passing comparable quizzes afterward or by having your preparatory work
(reading outlines, work done answering questions) thoroughly reviewed prior to the absence.
Absence on a scheduled exam day will result in a 0% score for the proportional exam unless you provide
documented evidence of an unavoidable emergency.
If you fail a mastery exam, you must re-take a different version of that mastery exam on a different
day. Multiple re-tries are allowed, on a different version of the exam each re-try. There is no penalty levied
on your course grade for re-taking mastery exams, but failure to successfully pass a mastery exam by the
due date (i.e. by the date of the next exam in the course sequence) will result in a failing grade (F) for the
course.
If any other “mastery” objectives are not completed by their specified deadlines, your overall grade
for the course will be capped at 70% (C- grade), and you will have one more school day to complete the
unfinished objectives. Failure to complete those mastery objectives by the end of that extra day (except in
the case of documented, unavoidable emergencies) will result in a failing grade (F) for the course.
“Lab questions” are assessed by individual questioning, at any date after the respective lab objective
(mastery) has been completed by your team. These questions serve to guide your completion of each lab
exercise and confirm participation of each individual student. Grading is as follows: full credit for thorough,
correct answers; half credit for partially correct answers; and zero credit for major conceptual errors. All
lab questions must be answered by the due date of the lab exercise.
Extra credit opportunities exist for each course, and may be assigned to students upon request. The
student and the instructor will first review the student’s performance on feedback questions, homework,
exams, and any other relevant indicators in order to identify areas of conceptual or practical weakness. Then,
both will work together to select an appropriate extra credit activity focusing on those identified weaknesses,
for the purpose of strengthening the student’s competence. A due date will be assigned (typically two weeks
following the request), which must be honored in order for any credit to be earned from the activity. Extra
credit may be denied at the instructor’s discretion if the student has not invested the necessary preparatory
effort to perform well (e.g. lack of preparation for daily class sessions, poor attendance, no feedback questions
submitted, etc.).
9
REQUIRED STUDENT SUPPLIES AND MATERIALS:
• Course worksheets available for download in PDF format
• Lessons in Industrial Instrumentation textbook, available for download in PDF format
→ Access worksheets and book at: http://www.ibiblio.org/kuphaldt/socratic/sinst
• Spiral-bound notebook for reading annotation, homework documentation, and note-taking.
• Laptop computer with Ethernet port (and ideally with a USB-to-serial RS-232 converter) for performing
network experiments.
• Instrumentation reference CD-ROM (free, from instructor). This disk contains many tutorials and
datasheets in PDF format to supplement your textbook(s).
• Tool kit (see detailed list)
• Simple scientific calculator (non-programmable, non-graphing, no unit conversions, no numeration
system conversions), TI-30Xa or TI-30XIIS recommended
ADDITIONAL INSTRUCTIONAL RESOURCES:
• The BTC Library hosts a substantial collection of textbooks and references on the subject of
Instrumentation, as well as links in its online catalog to free Instrumentation e-book resources available
on the Internet.
• “BTCInstrumentation” channel on YouTube (http://www.youtube.com/BTCInstrumentation), hosts
a variety of short video tutorials and demonstrations on instrumentation.
• Webster’s New World Telecom Dictionary, written by Ray Horak, published by Wiley Publishing; ISBN13: 978-0471774570.
• Ethernet: the definitive guide, written by Charles E. Spurgeon, published by O’Reilly ; ISBN-10:
1565926609 ; ISBN-13: 978-1565926608.
• ISA Student Section at BTC meets regularly to set up industry tours, raise funds for scholarships,
and serve as a general resource for Instrumentation students. Membership in the ISA is $10 per year,
payable to the national ISA organization. Membership includes a complementary subscription to InTech
magazine.
• ISA website (http://www.isa.org) provides all of its standards in electronic format, many of which
are freely available to ISA members.
• Purdy’s Instrument Handbook, by Ralph Dewey. ISBN-10: 1-880215-26-8. A pocket-sized field reference
on basic measurement and control.
• Cad Standard (CadStd) or similar AutoCAD-like drafting software (useful for sketching loop and
wiring diagrams). Cad Standard is a simplified clone of AutoCAD, and is freely available at:
http://www.cadstd.com
CAMPUS EMERGENCIES: If an emergency arises, your instructor may inform you of actions to
follow. You are responsible for knowing emergency evacuation routes from your classroom. If police or
university officials order you to evacuate, do so calmly and assist those needing help. You may receive
emergency information alerts via the building enunciation system, text message, email, or BTC’s webpage
(http://www.btc.ctc.edu), Facebook or Twitter. Refer to the emergency flipchart in the lab room (located
on the main control panel) for more information on specific types of emergencies.
ACCOMMODATIONS: If you think you could benefit from classroom accommodations for a disability
(physical, mental, emotional, or learning), please contact our Accessibility Resources office. Call (360)-7528345, email [email protected], or stop by the AR Office in the Admissions and Student Resource Center
(ASRC), Room 106, College Services Building
file INST260syllabus
10
Sequence of second-year Instrumentation courses
Core Electronics -- 3 qtrs
including MATH 141 (Precalculus 1)
(Only if 4th quarter was Summer: INST23x)
INST 200 -- 1 wk
Intro. to Instrumentation
Prerequisite for all INST24x,
INST25x, and INST26x courses
Summer quarter
Fall quarter
Winter quarter
Offered 1st week of
Fall, Winter, and
Spring quarters
Spring quarter
INST 230 -- 3 cr
INST 240 -- 6 cr
INST 250 -- 5 cr
INST 260 -- 4 cr
Motor Controls
Pressure/Level Measurement
Final Control Elements
Data Acquisition Systems
INST 231 -- 3 cr
INST 241 -- 6 cr
INST 251 -- 5 cr
INST 262 -- 5 cr
PLC Programming
Temp./Flow Measurement
PID Control
DCS and Fieldbus
INST 232 -- 3 cr
INST 242 -- 5 cr
INST 252 -- 4 cr
INST 263 -- 5 cr
Loop Tuning
Control Strategies
PLC Systems
Analytical Measurement
INST 233 -- 3 cr
CHEM&161 -- 5 cr
Protective Relays (elective)
Chemistry
ENGT 134 -- 5 cr
CAD 1: Basics
Prerequisite for INST206
All courses
completed?
Yes
INST 205 -- 1 cr
Job Prep I
No
INST 206 -- 1 cr
Job Prep II
Graduate!!!
11
Offered 1st week of
Fall, Winter, and
Spring quarters
The particular sequence of courses you take during the second year depends on when you complete all
first-year courses and enter the second year. Since students enter the second year of Instrumentation at four
different times (beginnings of Summer, Fall, Winter, and Spring quarters), the particular course sequence
for any student will likely be different from the course sequence of classmates.
Some second-year courses are only offered in particular quarters with those quarters not having to be
in sequence, while others are offered three out of the four quarters and must be taken in sequence. The
following layout shows four typical course sequences for second-year Instrumentation students, depending on
when they first enter the second year of the program:
Possible course schedules depending on date of entry into 2nd year
Beginning in Summer
July
Summer quarter
Beginning in Fall
Sept.
Intro. to Instrumentation
INST 231 -- 3 cr
INST 240 -- 6 cr
INST 250 -- 5 cr
INST 260 -- 4 cr
PLC Programming
Pressure/Level Measurement
Final Control Elements
Data Acquisition Systems
Protective Relays (elective)
Fall quarter
Dec.
Jan.
INST 251 -- 5 cr
INST 262 -- 5 cr
PID Control
DCS and Fieldbus
INST 242 -- 5 cr
INST 252 -- 4 cr
INST 263 -- 5 cr
Loop Tuning
Control Strategies
Analytical Measurement
CHEM&161 -- 5 cr
Winter quarter
Intro. to Instrumentation
INST 240 -- 6 cr
INST 250 -- 5 cr
Pressure/Level Measurement
INST 241 -- 6 cr
Mar.
April
Chemistry
Spring quarter
ENGT 134 -- 5 cr
June
July
CAD 1: Basics
Summer quarter
INST 230 -- 3 cr
Final Control Elements
INST 205 -- 1 cr
Job Prep I
INST 251 -- 5 cr
INST 260 -- 4 cr
INST 231 -- 3 cr
Temp./Flow Measurement
PID Control
Data Acquisition Systems
PLC Programming
INST 242 -- 5 cr
INST 252 -- 4 cr
INST 262 -- 5 cr
INST 232 -- 3 cr
Loop Tuning
DCS and Fieldbus
CHEM&161 -- 5 cr
INST 263 -- 5 cr
Chemistry
Control Strategies
Analytical Measurement
Winter quarter
Mar.
April
ENGT 134 -- 5 cr
Spring quarter
June
CAD 1: Basics
Motor Controls
PLC Systems
INST 233 -- 3 cr
Aug.
Sept.
Protective Relays (elective)
Fall quarter
Final Control Elements
INST 206 -- 1 cr
Job Prep II
INST 251 -- 5 cr
INST 260 -- 4 cr
INST 230 -- 3 cr
INST 240 -- 6 cr
PID Control
Data Acquisition Systems
Motor Controls
Pressure/Level Measurement
INST 252 -- 4 cr
INST 262 -- 5 cr
INST 231 -- 3 cr
INST 241 -- 6 cr
Loop Tuning
DCS and Fieldbus
PLC Programming
Temp./Flow Measurement
CHEM&161 -- 5 cr
INST 263 -- 5 cr
INST 232 -- 3 cr
Chemistry
Control Strategies
Spring quarter
INST 206 -- 1 cr
Job Prep II
July
Summer quarter
INST 230 -- 3 cr
Data Acquisition Systems
Motor Controls
INST 262 -- 5 cr
DCS and Fieldbus
INST 263 -- 5 cr
INST 232 -- 3 cr
Sept.
Jan.
Analytical Measurement
Winter quarter
INST 206 -- 1 cr
Job Prep II
Fall quarter
INST 250 -- 5 cr
INST 231 -- 3 cr
INST 240 -- 6 cr
INST 251 -- 5 cr
PLC Programming
Pressure/Level Measurement
PID Control
INST 241 -- 6 cr
INST 252 -- 4 cr
Temp./Flow Measurement
Loop Tuning
INST 233 -- 3 cr
Aug.
Protective Relays (elective)
INST 242 -- 5 cr
Dec.
INST 206 -- 1 cr
Job Prep II
PLC Systems
ENGT 134 -- 5 cr
Graduation!
INST 233 -- 3 cr
Aug.
INST 205 -- 1 cr
Job Prep I
Summer quarter
PLC Systems
CAD 1: Basics
INST 260 -- 4 cr
CAD 1: Basics
July
ENGT 134 -- 5 cr
June
Control Strategies
June
INST 241 -- 6 cr
Temp./Flow Measurement
INST 205 -- 1 cr
Job Prep I
INST 250 -- 5 cr
April
Spring quarter
Motor Controls
INST 205 -- 1 cr
Job Prep I
Mar.
April
INST 200 -- 1 wk
INST 200 -- 1 wk
Jan.
Winter quarter
INST 200 -- 1 wk
INST 233 -- 3 cr
Dec.
Jan.
INST 200 -- 1 wk
PLC Systems
Sept.
Fall quarter
Beginning in Spring
INST 230 -- 3 cr
INST 232 -- 3 cr
Aug.
Beginning in Winter
Final Control Elements
INST 242 -- 5 cr
Protective Relays (elective)
Dec.
Graduation!
Analytical Measurement
Graduation!
file sequence
12
CHEM&161 -- 5 cr
Mar.
Chemistry
Graduation!
General tool and supply list
Wrenches
• Combination (box- and open-end) wrench set, 1/4” to 3/4” – the most important wrench sizes are 7/16”,
1/2”, 9/16”, and 5/8”; get these immediately!
• Adjustable wrench, 6” handle (sometimes called “Crescent” wrench)
• Hex wrench (“Allen” wrench) set, fractional – 1/16” to 3/8”
• Optional: Hex wrench (“Allen” wrench) set, metric – 1.5 mm to 10 mm
• Optional: Miniature combination wrench set, 3/32” to 1/4” (sometimes called an “ignition wrench” set)
Note: when turning any threaded fastener, one should choose a tool engaging the maximum amount of
surface area on the fastener’s head in order to reduce stress on that fastener. (e.g. Using box-end wrenches
instead of adjustable wrenches; using the proper size and type of screwdriver; never using any tool that mars
the fastener such as pliers or vise-grips unless absolutely necessary.)
Pliers
• Needle-nose pliers
• Tongue-and-groove pliers (sometimes called “Channel-lock” pliers)
• Diagonal wire cutters (sometimes called “dikes”)
Screwdrivers
• Slotted, 1/8” and 1/4” shaft
• Phillips, #1 and #2
• Jeweler’s screwdriver set
• Optional: Magnetic multi-bit screwdriver (e.g. Klein Tools model 70035)
Electrical
• Multimeter, Fluke model 87-IV or better
• Alligator-clip jumper wires
• Soldering iron (10 to 40 watt) and rosin-core solder
• Resistor, potentiometer, diode assortments (from first-year lab kits)
• Package of insulated compression-style fork terminals (14 to 18 AWG wire size, #10 stud size)
• Wire strippers/terminal crimpers for 10 AWG to 18 AWG wire and insulated terminals
• Optional: ratcheting terminal crimp tool (e.g. Paladin 1305, Ferrules Direct FDT10011, or equivalent)
Safety
• Safety glasses or goggles (available at BTC bookstore)
• Earplugs (available at BTC bookstore)
Miscellaneous
• Simple scientific calculator (non-programmable, non-graphing, no conversions), TI-30Xa or TI-30XIIS
recommended. Required for some exams!
• Masking tape (for making temporary labels)
• Permanent marker pen
• Teflon pipe tape
• Utility knife
• Tape measure, 12 feet minimum
• Flashlight
An inexpensive source of tools is your local pawn shop. Look for tools with unlimited lifetime guarantees
(e.g. Sears “Craftsman” brand). Check for BTC student discounts as well!
file tools
13
Methods of instruction
This course develops self-instructional and diagnostic skills by placing students in situations where they
are required to research and think independently. In all portions of the curriculum, the goal is to avoid a
passive learning environment, favoring instead active engagement of the learner through reading, reflection,
problem-solving, and experimental activities. The curriculum may be roughly divided into two portions:
theory and practical.
Theory
In the theory portion of each course, students independently research subjects prior to entering the
classroom for discussion. This means working through all the day’s assigned questions as completely as
possible. This usually requires a fair amount of technical reading, and may also require setting up and
running simple experiments. At the start of the classroom session, the instructor will check each student’s
preparation with a quiz. Students then spend the rest of the classroom time working in groups and directly
with the instructor to thoroughly answer all questions assigned for that day, articulate problem-solving
strategies, and to approach the questions from multiple perspectives. To put it simply: fact-gathering
happens outside of class and is the individual responsibility of each student, so that class time may be
devoted to the more complex tasks of critical thinking and problem solving where the instructor’s attention
is best applied.
Classroom theory sessions usually begin with either a brief Q&A discussion or with a “Virtual
Troubleshooting” session where the instructor shows one of the day’s diagnostic question diagrams while
students propose diagnostic tests and the instructor tells those students what the test results would be
given some imagined (“virtual”) fault scenario, writing the test results on the board where all can see. The
students then attempt to identify the nature and location of the fault, based on the test results.
Each student is free to leave the classroom when they have completely worked through all problems and
have answered a “summary” quiz designed to gauge their learning during the theory session. If a student
finishes ahead of time, they are free to leave, or may help tutor classmates who need extra help.
The express goal of this “inverted classroom” teaching methodology is to help each student cultivate
critical-thinking and problem-solving skills, and to sharpen their abilities as independent learners. While
this approach may be very new to you, it is more realistic and beneficial to the type of work done in
instrumentation, where critical thinking, problem-solving, and independent learning are “must-have” skills.
14
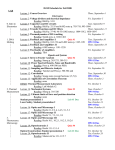
Lab
In the lab portion of each course, students work in teams to install, configure, document, calibrate, and
troubleshoot working instrument loop systems. Each lab exercise focuses on a different type of instrument,
with a eight-day period typically allotted for completion. An ordinary lab session might look like this:
(1) Start of practical (lab) session: announcements and planning
(a) The instructor makes general announcements to all students
(b) The instructor works with team to plan that day’s goals, making sure each team member has a
clear idea of what they should accomplish
(2) Teams work on lab unit completion according to recommended schedule:
(First day) Select and bench-test instrument(s)
(One day) Connect instrument(s) into a complete loop
(One day) Each team member drafts their own loop documentation, inspection done as a team (with
instructor)
(One or two days) Each team member calibrates/configures the instrument(s)
(Remaining days, up to last) Each team member troubleshoots the instrument loop
(3) End of practical (lab) session: debriefing where each team reports on their work to the whole class
Troubleshooting assessments must meet the following guidelines:
• Troubleshooting must be performed on a system the student did not build themselves. This forces
students to rely on another team’s documentation rather than their own memory of how the system was
built.
• Each student must individually demonstrate proper troubleshooting technique.
• Simply finding the fault is not good enough. Each student must consistently demonstrate sound
reasoning while troubleshooting.
• If a student fails to properly diagnose the system fault, they must attempt (as many times as necessary)
with different scenarios until they do, reviewing any mistakes with the instructor after each failed
attempt.
file instructional
15
Distance delivery methods
Sometimes the demands of life prevent students from attending college 6 hours per day. In such cases,
there exist alternatives to the normal 8:00 AM to 3:00 PM class/lab schedule, allowing students to complete
coursework in non-traditional ways, at a “distance” from the college campus proper.
For such “distance” students, the same worksheets, lab activities, exams, and academic standards still
apply. Instead of working in small groups and in teams to complete theory and lab sections, though, students
participating in an alternative fashion must do all the work themselves. Participation via teleconferencing,
video- or audio-recorded small-group sessions, and such is encouraged and supported.
There is no recording of hours attended or tardiness for students participating in this manner. The pace
of the course is likewise determined by the “distance” student. Experience has shown that it is a benefit for
“distance” students to maintain the same pace as their on-campus classmates whenever possible.
In lieu of small-group activities and class discussions, comprehension of the theory portion of each course
will be ensured by completing and submitting detailed answers for all worksheet questions, not just passing
daily quizzes as is the standard for conventional students. The instructor will discuss any incomplete and/or
incorrect worksheet answers with the student, and ask that those questions be re-answered by the student
to correct any misunderstandings before moving on.
Labwork is perhaps the most difficult portion of the curriculum for a “distance” student to complete,
since the equipment used in Instrumentation is typically too large and expensive to leave the school lab
facility. “Distance” students must find a way to complete the required lab activities, either by arranging
time in the school lab facility and/or completing activities on equivalent equipment outside of school (e.g.
at their place of employment, if applicable). Labwork completed outside of school must be validated by a
supervisor and/or documented via photograph or videorecording.
Conventional students may opt to switch to “distance” mode at any time. This has proven to be a
benefit to students whose lives are disrupted by catastrophic events. Likewise, “distance” students may
switch back to conventional mode if and when their schedules permit. Although the existence of alternative
modes of student participation is a great benefit for students with challenging schedules, it requires a greater
investment of time and a greater level of self-discipline than the traditional mode where the student attends
school for 6 hours every day. No student should consider the “distance” mode of learning a way to have
more free time to themselves, because they will actually spend more time engaged in the coursework than
if they attend school on a regular schedule. It exists merely for the sake of those who cannot attend during
regular school hours, as an alternative to course withdrawal.
file distance
16
Metric prefixes and conversion constants
•
•
•
•
•
•
•
•
•
•
•
•
•
•
•
•
•
•
•
•
•
Metric prefixes
Yotta = 1024 Symbol: Y
Zeta = 1021 Symbol: Z
Exa = 1018 Symbol: E
Peta = 1015 Symbol: P
Tera = 1012 Symbol: T
Giga = 109 Symbol: G
Mega = 106 Symbol: M
Kilo = 103 Symbol: k
Hecto = 102 Symbol: h
Deca = 101 Symbol: da
Deci = 10−1 Symbol: d
Centi = 10−2 Symbol: c
Milli = 10−3 Symbol: m
Micro = 10−6 Symbol: µ
Nano = 10−9 Symbol: n
Pico = 10−12 Symbol: p
Femto = 10−15 Symbol: f
Atto = 10−18 Symbol: a
Zepto = 10−21 Symbol: z
Yocto = 10−24 Symbol: y
METRIC PREFIX SCALE
T
tera
1012
G
M
giga mega
109
106
k
kilo
103
(none)
100
m
µ
milli micro
10-3 10-6
102 101 10-1 10-2
hecto deca deci centi
h
da
d
c
•
•
•
•
•
Conversion formulae for temperature
F = (o C)(9/5) + 32
o
C = (o F - 32)(5/9)
o
R = o F + 459.67
K = o C + 273.15
o
Conversion equivalencies for distance
1 inch (in) = 2.540000 centimeter (cm)
1 foot (ft) = 12 inches (in)
1 yard (yd) = 3 feet (ft)
1 mile (mi) = 5280 feet (ft)
17
n
nano
10-9
p
pico
10-12
Conversion equivalencies for volume
1 gallon (gal) = 231.0 cubic inches (in3 ) = 4 quarts (qt) = 8 pints (pt) = 128 fluid ounces (fl. oz.)
= 3.7854 liters (l)
1 milliliter (ml) = 1 cubic centimeter (cm3 )
Conversion equivalencies for velocity
1 mile per hour (mi/h) = 88 feet per minute (ft/m) = 1.46667 feet per second (ft/s) = 1.60934
kilometer per hour (km/h) = 0.44704 meter per second (m/s) = 0.868976 knot (knot – international)
Conversion equivalencies for mass
1 pound (lbm) = 0.45359 kilogram (kg) = 0.031081 slugs
Conversion equivalencies for force
1 pound-force (lbf) = 4.44822 newton (N)
Conversion equivalencies for area
1 acre = 43560 square feet (ft2 ) = 4840 square yards (yd2 ) = 4046.86 square meters (m2 )
Conversion equivalencies for common pressure units (either all gauge or all absolute)
1 pound per square inch (PSI) = 2.03602 inches of mercury (in. Hg) = 27.6799 inches of water (in.
W.C.) = 6.894757 kilo-pascals (kPa) = 0.06894757 bar
1 bar = 100 kilo-pascals (kPa) = 14.504 pounds per square inch (PSI)
Conversion equivalencies for absolute pressure units (only)
1 atmosphere (Atm) = 14.7 pounds per square inch absolute (PSIA) = 101.325 kilo-pascals absolute
(kPaA) = 1.01325 bar (bar) = 760 millimeters of mercury absolute (mmHgA) = 760 torr (torr)
Conversion equivalencies for energy or work
1 british thermal unit (Btu – “International Table”) = 251.996 calories (cal – “International Table”)
= 1055.06 joules (J) = 1055.06 watt-seconds (W-s) = 0.293071 watt-hour (W-hr) = 1.05506 x 10¹⁰
ergs (erg) = 778.169 foot-pound-force (ft-lbf)
Conversion equivalencies for power
1 horsepower (hp – 550 ft-lbf/s) = 745.7 watts (W) = 2544.43 british thermal units per hour
(Btu/hr) = 0.0760181 boiler horsepower (hp – boiler)
Acceleration of gravity (free fall), Earth standard
9.806650 meters per second per second (m/s2 ) = 32.1740 feet per second per second (ft/s2 )
18
Physical constants
Speed of light in a vacuum (c) = 2.9979 × 10⁸ meters per second (m/s) = 186,281 miles per second
(mi/s)
Avogadro’s number (NA ) = 6.022 × 10²³ per mole (mol−1 )
Electronic charge (e) = 1.602 × 10⁻¹⁹ Coulomb (C)
Boltzmann’s constant (k) = 1.38 × 10⁻²³ Joules per Kelvin (J/K)
Stefan-Boltzmann constant (σ) = 5.67 × 10⁻⁸ Watts per square meter-Kelvin4 (W/m2 ·K4 )
Molar gas constant (R) = 8.314 Joules per mole-Kelvin (J/mol-K)
Properties of Water
Freezing point at sea level = 32o F = 0o C
Boiling point at sea level = 212o F = 100o C
Density of water at 4o C = 1000 kg/m3 = 1 g/cm3 = 1 kg/liter = 62.428 lb/ft3 = 1.94 slugs/ft3
Specific heat of water at 14o C = 1.00002 calories/g·o C = 1 BTU/lb·o F = 4.1869 Joules/g·o C
Specific heat of ice ≈ 0.5 calories/g·o C
Specific heat of steam ≈ 0.48 calories/g·o C
Absolute viscosity of water at 20o C = 1.0019 centipoise (cp) = 0.0010019 Pascal-seconds (Pa·s)
Surface tension of water (in contact with air) at 18o C = 73.05 dynes/cm
pH of pure water at 25o C = 7.0 (pH scale = 0 to 14)
Properties of Dry Air at sea level
Density of dry air at 20o C and 760 torr = 1.204 mg/cm3 = 1.204 kg/m3 = 0.075 lb/ft3 = 0.00235
slugs/ft3
Absolute viscosity of dry air at 20o C and 760 torr = 0.018 centipoise (cp) = 1.8 × 10⁻⁵ Pascalseconds (Pa·s)
file conversion constants
19
Question 0
How to get the most out of academic reading:
• Articulate your thoughts as you read (i.e. “have a conversation” with the author). This will develop
metacognition: active supervision of your own thoughts. Write your thoughts as you read, noting
points of agreement, disagreement, confusion, epiphanies, and connections between different concepts
or applications. These notes should also document important math formulae, explaining in your own
words what each formula means and the proper units of measurement used.
• Outline, don’t highlight! Writing your own summary or outline is a far more effective way to comprehend
a text than simply underlining and highlighting key words. A suggested ratio is one sentence of your
own thoughts per paragraph of text read. Note points of disagreement or confusion to explore later.
• Work through all mathematical exercises shown within the text, to ensure you understand all the steps.
• Imagine explaining concepts you’ve just learned to someone else. Teaching forces you to distill concepts
to their essence, thereby clarifying those concepts, revealing assumptions, and exposing misconceptions.
Your goal is to create the simplest explanation that is still technically accurate.
• Write your own questions based on what you read, as though you are a teacher preparing to test
students’ comprehension of the subject matter.
How to effectively problem-solve and troubleshoot:
• Study principles, not procedures. Don’t be satisfied with merely knowing how to compute solutions –
learn why those solutions work. In mathematical problem-solving this means being able to identify the
practical meaning (and units of measurement) of every intermediate calculation. In other words, every
step of your solution should make logical sense.
• Sketch a diagram to help visualize the problem. When building a real system, always prototype it on
paper and analyze its function before constructing it.
• Identify what it is you need to solve, identify all relevant data, identify all units of measurement, identify
any general principles or formulae linking the given information to the solution, and then identify any
“missing pieces” to a solution. Annotate all diagrams with this data.
• Perform “thought experiments” to explore the effects of different conditions for theoretical problems.
When troubleshooting real systems, perform diagnostic tests rather than visually inspecting for faults.
• Simplify the problem and solve that simplified problem to identify strategies applicable to the original
problem (e.g. change quantitative to qualitative, or visa-versa; substitute easier numerical values;
eliminate confusing details; add details to eliminate unknowns; consider simple limiting cases; apply an
analogy). Often you can add or remove components in a malfunctioning system to simplify it as well
and better identify the nature and location of the problem.
• Work “backward” from a hypothetical solution to a new set of given conditions.
How to create more time for study:
• Kill your television and video games. Seriously – these are incredible wastes of time.
distractions (e.g. cell phone, internet, socializing) in your place and time of study.
Eliminate
• Use your “in between” time productively. Don’t leave campus for lunch. Arrive to school early. If you
finish your assigned work early, begin studying the next day’s material.
Above all, cultivate persistence. Persistent effort is necessary to master anything non-trivial. The keys
to persistence are (1) having the desire to achieve that mastery, and (2) realizing challenges are normal and
not an indication of something gone wrong. A common error is to equate easy with effective: students often
believe learning should be easy if everything is done right. The truth is that mastery never comes easy!
file question0
20
Creative Commons License
This worksheet is licensed under the Creative Commons Attribution License, version 1.0. To view
a copy of this license, visit http://creativecommons.org/licenses/by/1.0/ or send a letter to Creative
Commons, 559 Nathan Abbott Way, Stanford, California 94305, USA. The terms and conditions of this
license allow for free copying, distribution, and/or modification of all licensed works by the general public.
Simple explanation of Attribution License:
The licensor (Tony Kuphaldt) permits others to copy, distribute, display, and otherwise use this
work. In return, licensees must give the original author(s) credit. For the full license text, please visit
http://creativecommons.org/licenses/by/1.0/ on the internet.
More detailed explanation of Attribution License:
Under the terms and conditions of the Creative Commons Attribution License, you may make freely
use, make copies, and even modify these worksheets (and the individual “source” files comprising them)
without having to ask me (the author and licensor) for permission. The one thing you must do is properly
credit my original authorship. Basically, this protects my efforts against plagiarism without hindering the
end-user as would normally be the case under full copyright protection. This gives educators a great deal
of freedom in how they might adapt my learning materials to their unique needs, removing all financial and
legal barriers which would normally hinder if not prevent creative use.
Nothing in the License prohibits the sale of original or adapted materials by others. You are free to
copy what I have created, modify them if you please (or not), and then sell them at any price. Once again,
the only catch is that you must give proper credit to myself as the original author and licensor. Given that
these worksheets will be continually made available on the internet for free download, though, few people
will pay for what you are selling unless you have somehow added value.
Nothing in the License prohibits the application of a more restrictive license (or no license at all) to
derivative works. This means you can add your own content to that which I have made, and then exercise
full copyright restriction over the new (derivative) work, choosing not to release your additions under the
same free and open terms. An example of where you might wish to do this is if you are a teacher who desires
to add a detailed “answer key” for your own benefit but not to make this answer key available to anyone
else (e.g. students).
Note: the text on this page is not a license. It is simply a handy reference for understanding the Legal
Code (the full license) - it is a human-readable expression of some of its key terms. Think of it as the
user-friendly interface to the Legal Code beneath. This simple explanation itself has no legal value, and its
contents do not appear in the actual license.
file license
21
Questions
Question 1
Read and outline the “Signal Coupling and Cable Separation” subsection of the “Electrical Signal
and Control Wiring” section of the “Instrument Connections” chapter in your Lessons In Industrial
Instrumentation textbook. Note the page numbers where important illustrations, photographs, equations,
tables, and other relevant details are found. Prepare to thoughtfully discuss with your instructor and
classmates the concepts and examples explored in this reading.
A note-taking technique you will find far more productive in your academic reading than mere
highlighting or underlining is to write your own outline of the text you read. A section of your Lessons
In Industrial Instrumentation textbook called “Marking Versus Outlining a Text” describes the technique
and the learning benefits that come from practicing it. This approach is especially useful when the text
in question is dense with facts and/or challenging to grasp. Ask your instructor for help if you would like
assistance in applying this proven technique to your own reading.
file i04412
22
Question 2
A common way to route wires and cables inside of electrical control panels is inside of special plastic
tracking called wire duct. A common brand-name of wire duct is Panduit. The duct is bolted to the back
wall of the enclosure, wires and cables threaded through the side slots and down the length of the duct, and
everything covered up with a snap-on plastic cover. Wire duct is often placed to either side of terminal block
sections, for easy routing (and re-routing) of wires to the terminals:
Enclosure
wire duct
wire duct
terminal blocks
wire duct
wires
Suppose you are running a new wire to a terminal on this terminal strip. You could cut the wire so that
its length is just right to reach the intended terminal, but there is a better way to do it:
Enclosure
new wire
How long to cut
this new wire?
Identify the more practical wire length for this new wire, and explain why it is generally good to do this
when adding wires to an existing system within an enclosure with wire duct.
file i02279
23
Question 3
Suppose you must run two signal cables from field-mounted instruments to a central room where the
control system is located. Two different electrical conduits stretch from the field location to the control
system room: one with 480 VAC power wiring in it, and another with low-level control signal wiring in it.
The two cables you must run through these conduits are as follows:
• One twisted-pair cable carrying a 4-20 mA analog DC signal
• One twisted-pair cable carrying a Modbus digital signal (RS-485 physical layer)
At first, you plan to run both these cables through the signal wire conduit. However, you soon discover
this signal conduit only has room to accommodate one cable but not both. The power wire conduit, however,
has plenty of available room.
Which cable would you run through which conduit, and why?
Suggestions for Socratic discussion
• Explain why it is best to run all signal cables in conduit completely separate from power cables.
file i02281
Question 4
Read and outline the “Electric Field (Capacitive) De-coupling” subsection of the “Electrical Signal
and Control Wiring” section of the “Instrument Connections” chapter in your Lessons In Industrial
Instrumentation textbook. Note the page numbers where important illustrations, photographs, equations,
tables, and other relevant details are found. Prepare to thoughtfully discuss with your instructor and
classmates the concepts and examples explored in this reading.
file i04413
24
Question 5
Shielded cables are necessary for protecting small electrical signals from external interference in the form
of electric fields, but one must be careful how to connect the shield wire. Examine the following illustration,
and determine which of the three installations is wired incorrectly, and why:
Panel instrument
Field instrument
Single-pair cable
Chassis or
earth ground
Panel instrument
Field instrument
Single-pair cable
Chassis or
earth ground
Chassis or
earth ground
Panel instrument
Field instrument
Single-pair cable
Chassis or
earth ground
Of the two remaining installations, which of them do you think would be preferred over the other, and
why?
Suggestions for Socratic discussion
• A principle to bear in mind here is that the earth is not a perfect conductor of electricity, and as such
it is possible to develop significant voltage drops between different locations on the earth. Propose at
least one mechanism by which such a voltage drop might develop between different locations on the
25
earth. The fact that the earth is not a perfect conductor is not sufficient in itself to guarantee a voltage
will exist between different locations – rather, it merely permits such a phenomenon – so there must be
something else at work to actually generate the potential differences. What might this “something else”
be?
file i02226
Question 6
Read and outline the “Magnetic Field (Inductive) De-coupling” subsection of the “Electrical Signal
and Control Wiring” section of the “Instrument Connections” chapter in your Lessons In Industrial
Instrumentation textbook. Note the page numbers where important illustrations, photographs, equations,
tables, and other relevant details are found. Prepare to thoughtfully discuss with your instructor and
classmates the concepts and examples explored in this reading.
file i04414
Question 7
Read and outline the “High-Frequency Signal Cables” subsection of the “Electrical Signal and Control
Wiring” section of the “Instrument Connections” chapter in your Lessons In Industrial Instrumentation
textbook. Note the page numbers where important illustrations, photographs, equations, tables, and other
relevant details are found. Prepare to thoughtfully discuss with your instructor and classmates the concepts
and examples explored in this reading.
file i04415
26
Question 8
Suppose the lamp refuses to light up. A voltmeter registers 24 volts between test points C and D:
A
C
E
volts
+ 24
(0.25
amps
−
current-limited)
B
F
D
First, list all the possible (single) faults that could account for all measurements and symptoms in this
circuit, including failed wires as well as failed components:
Now, determine the diagnostic value of each of the following tests, based on the faults you listed above.
If a proposed test could provide new information to help you identify the location and/or nature of the one
fault, mark “yes.” Otherwise, if a proposed test would not reveal anything relevant to identifying the fault
(already discernible from the measurements and symptoms given so far), mark “no.”
Diagnostic test
Measure VCF
Measure VED
Measure VAB
Measure VAD
Measure VCB
Measure VEF
Measure current through wire connecting A and C
Jumper A and C together
Jumper B and D together
Jumper A and B together
Yes
No
Finally, develop a rule you may use when assessing the value of each proposed test, based on a
comprehensive list of possible faults.
Suggestions for Socratic discussion
• Identify which fundamental principles of electric circuits apply to each step of your analysis of this
circuit. In other words, be prepared to explain the reason(s) “why” for every step of your analysis,
rather than merely describing those steps.
• Suppose the fault were intermittent: sometimes the lamp lights up, and other times it goes out. Explain
how you could use a digital multimeter (DMM) set to record voltage as a troubleshooting tool to
determine where the fault is located in the circuit over a span of time too long for you to personally
observe the circuit.
file i01746
27
Question 9
The National Electrical Code, or NEC – otherwise known as NFPA 70 – is a standard published by the
National Fire Protection Agency. Among (many!) other things, it specifies the following maximum “fill”
percentages for electrical conduit, given the number of conductors contained within:
1 conductor: 53%
2 conductors: 31%
3 or more conductor: 40%
Explain the rationale behind these figures. Why be worried about how “full” a conduit is at all?
Additionally, why should the most conservative rating be for a condition where there are only two conductors
in a conduit?
file i02413
Question 10
In the United States, electrical enclosures are usually rated for different environmental services by a
NEMA Type Designation. Research what this type designation means, in general, as well as in particular
for the following NEMA types:
• NEMA 1:
• NEMA 4:
• NEMA 4X:
• NEMA 6:
• NEMA 7:
• NEMA 8:
Suggestions for Socratic discussion
• Identify your source of information on NEMA panel designations.
file i02286
28
Question 11
Read selected portions of the Fluke “Series 80 Series V Multimeters users manual” (May 2004 revision
2, 11/08) and answer the following questions:
Pages 32-33 describe the MIN/MAX measuring mode. Explain what this does, in your own words,
identifying a practical application for using this mode.
Suppose you trying to measure a 60 Hz AC voltage signal that you suspected was being corrupted by
high-frequency noise voltage. Explain how the Low Pass Filter mode available in the model 87 multimeter
(described on page 15) could be useful to you in this situation.
Page 31 describes the HiRes measuring mode available on the model 87. Explain what this does, in
your own words, identifying a practical application for using this mode.
Page 34 describes the Relative measuring mode available on the model 87. Explain what this does, in
your own words, identifying a practical application for using this mode.
Suggestions for Socratic discussion
• Suppose you attempted to measure the voltage of an AC+DC “mixed” signal (i.e. a signal with an AC
component as well as a DC bias, like what you might encounter at the base terminal of the transistor in
a class-A audio amplifier). It would be good to know how well your mulitmeter discriminates between
AC and DC in both measurement modes. Devise a test by which you could determine how well your
multimeter is able to selectively measure just the AC or just the DC portion of a “mixed” signal voltage.
• Is the MIN/MAX mode of your multimeter fast enough to capture the peak voltage value of a 60 Hz
sine-wave? Demonstrate this if you can.
• Demonstrate some of the other special features of your multimeter, describing practical applications of
these features.
• For those who have studied variable frequency motor drives (VFDs), explain why the Low Pass Filter
mode is useful for taking AC voltage and current measurements on VFD power conductors.
file i02407
29
Question 12
A technician is installing two pressure alarm switches on a new liquid pipeline pumping station. The
station is still being constructed, with the pipeline empty of all liquid and vented to atmosphere. One switch
detects improper high-pressure conditions on the discharge side of the pump, while the other switch detects
improper low-pressure conditions on the suction side of the pump:
Com
NC
NO
Discharge-side
PSH
Pump
Com
NC
Motor
NO
Suction-side
250 feet of
PSL
conduit
25
26
27
28
Fuse
L1
N
To 120 VAC source
G
Using a digital multimeter (DMM), the technician first measures 118 VAC between terminals “L1” and
“N” (to check the meter for proper operation). Next, he measures 118 VAC as expected between terminal
25 and terminal “N”. For the last test, the technician measures 41 volts between terminal 27 and “N”. This
last result was very unexpected! Thinking perhaps the PSL switch is faulty, he walks to the field location
and measures resistance between the “Com” and “NO” terminals on that switch, measuring infinite (“OL”)
resistance with his multimeter.
A fellow technician says to the first technician, “Oh, that 41 volt measurement is just a phantom voltage.
Ignore it!” Explain what this technician means by the phrase “phantom voltage” and comment on whether
or not you think it should be ignored.
Suggestions for Socratic discussion
• Explain why these two pressure switches are wired as they are (PSH wired NC and PSL wired NO). In
each case, what will an improper pressure do to the status of each switch?
• How could the DMM be altered so as to not be fooled by “phantom” voltages again?
file i02542
30
Question 13
An important component used in conjunction with electrical conduit connectors is a bushing. It looks
like a sort of locknut, designed to fit over the threaded end of a conduit connector inside of an enclosure.
Although bushings do not necessarily add mechanical integrity to the conduit fitting, they do serve an
important protective role. What is this role, and what might happen if the bushing were not in place?
file i02410
Question 14
Electrical conduit is important for safe and durable electrical wiring in outside environments. Conduit
is manufactured in both plastic (PVC) and metal (steel, aluminum) forms. Determine which type of conduit
is preferable for each of the following priorities:
•
•
•
•
•
•
Ease of assembly
Resistance to corrosive gases/liquids
Minimal material cost (assuming other factors do not take precedence)
Best shielding from electromagnetic interference
Maximum physical strength
Tightest sealing against vapor/liquid intrusion
Suggestions for Socratic discussion
• Considering the type of conduit providing the better electrical shielding, is it better with regard to
electric field shielding, to magnetic field shielding, or to both? Explain why.
file i02409
31
Question 15
The following photograph (showing the back side of a control panel) contains so many examples of bad
wiring practice that it is difficult to know where to begin criticism:
Identify some of the poor wiring practices in this photograph, trying not to laugh too loudly as you do.
file i02283
32
Question 16
The metal case of this appliance is grounded by means of a third conductor:
120 VAC
Fuse
Circuit
Explain how this grounding connection makes the appliance safer for anyone touching its metal case.
Also, explain why both the fuse and the power switch are intentionally placed in series with the ungrounded
(“hot”) power conductor.
file i02411
33
Question 17
Suppose an instrument technician needs to connect a loop-powered 4-20 mA pressure transmitter to the
input of a loop controller, and does so like this:
Honeywell model UDC2500 controller
Rosemount model 1151
loop-powered pressure transmitter
L1
Output
relay #1
L2/N
H
Alarm
relay #2
Alarm
relay #1
Analog
input #2
L
250 Ω
3-valve isolation
manifold
Analog
input #1
250 Ω
Explain what is wrong with this circuit, and what is needed to fix the problem.
file i02282
Question 18
Question 19
Question 20
Question 21
Read and outline the introduction to the “Digital Data Acquisition and Networks” chapter in your
Lessons In Industrial Instrumentation textbook. Note the page numbers where important illustrations,
photographs, equations, tables, and other relevant details are found. Prepare to thoughtfully discuss with
your instructor and classmates the concepts and examples explored in this reading.
file i04394
Question 22
Read and outline the “Digital Representation of Numerical Data” section of the “Digital Data
Acquisition and Network” chapter in your Lessons In Industrial Instrumentation textbook. Note the page
numbers where important illustrations, photographs, equations, tables, and other relevant details are found.
Prepare to thoughtfully discuss with your instructor and classmates the concepts and examples explored in
this reading.
file i04395
34
Question 23
Convert the following 16-bit unsigned integer values into decimal (note the use of hexadecimal notation
rather than direct binary):
• 5A24 (hexadecimal) =
(decimal)
• FFFF (hexadecimal) =
• E109 (hexadecimal) =
(decimal)
(decimal)
Convert the following 16-bit signed integer values into decimal (note the use of hexadecimal notation
rather than direct binary):
• 3B11 (hexadecimal) =
(decimal)
• C9D0 (hexadecimal) =
(decimal)
• FFFF (hexadecimal) =
(decimal)
Suggestions for Socratic discussion
• Outline the procedure(s) you used to perform these conversions.
• Is there any way to tell if any of the signed values is positive or negative just by examining the
hexadecimal characters (i.e. without translating into binary first)?
• A powerful problem-solving technique is to simplify the problem so that it is easier to solve, then use
that solution as a starting point for the final solution of the given (complex) problem. Try laying out
the place-weights for a 4-bit signed integer binary number and then figuring out the bit combinations
that would give you the greatest possible positive value, the greatest possible negative value, 0, −1, and
any other arbitrary values between. Seeing how a short (4-bit) signed integer works helps you see how
larger (e.g. 16-bit) signed integers are constructed from 1 and 0 bits.
file i04405
Question 24
Read and outline the “Analog-Digital Conversion” section of the “Digital Data Acquisition and Network”
chapter in your Lessons In Industrial Instrumentation textbook. Note the page numbers where important
illustrations, photographs, equations, tables, and other relevant details are found. Prepare to thoughtfully
discuss with your instructor and classmates the concepts and examples explored in this reading.
file i04396
35
Question 25
Every instrument has at least one input and at least one output. For instruments responding linearly,
the correspondence between input and output is proportional:
x
URVin
LRVin
URVout
LRVout
Instrument
Input
Output
x - LRVin
y
y - LRVout
=
URVin - LRVin
URVout - LRVout
A practical example of this is a pressure transmitter, in this case one with an input range of 0 to 1023
PSI and an output of 4-20 mA:
URVin = 1023 PSI
LRVin = 0 PSI
x
Input
URVout = 20 mA
LRVout = 4 mA
y
Output
H
x - 0 PSI
L
=
1023 PSI
y - 4 mA
16 mA
If you happened to measure an output current of 14.7 mA from this pressure transmitter, it would be
a simple matter for you to calculate the corresponding input pressure to be 684.13 PSI.
However, students are often taken by surprise when they encounter an analog-to-digital converter (ADC)
or digital-to-analog converter (DAC) and are asked to correlate input and output for such devices. What
might seem a daunting task at first, though, soon reveals itself to be the same input-to-output correspondence
calculations they’ve seen all along in the guise of analog sensors and other instruments.
Take for example this analog-to-digital converter, with a 10-bit output (a “count” range of 0 to 1023)
and a 4-20 mA input:
URVin = 20 mA
LRVin = 4 mA
10-bit ADC
x
Input
Output
URVout = 1023
LRVout = 0
y
Calculate the corresponding “count” output of this ADC circuit given a 6.82 mA input signal.
file i04545
36
Question 26
The ADC0804 is an example of an integrated circuit analog-to-digital converter (ADC), converting an
analog input voltage signal into an 8-bit binary output:
+V
ADC0804
Vin
DB7
Clk in
DB0
Digital data output lines
When operated from a 5.0 volt DC power supply in its simplest mode, the ADC0804 converts any DC
input voltage between 0.0 volts and 5.0 volts into an 8-bit number at the command of a clock pulse. A 0.0
volt input yields a binary output (or “count”) of 00000000, of course, while a 5.0 volt input yields a count
of 11111111.
Complete this table of numbers, relating various DC input voltages with count values (expressed in
binary, hex, and decimal) for an ADC0804 having an input range of 0.0 to 5.0 volts DC:
DC input voltage
0.0 volts
Binary count
00000000
00110011
2.2 volts
5.0 volts
Hex count
51
70
B3
CC
11001100
11111111
file i03270
37
Decimal count
179
Question 27
A Programmable Logic Controller or PLC is an industrial control computer designed to input and output
many types of signals. To handle different signal types (on/off, analog, digital networking), large-scale PLCs
use different “cards” that plug into a common frame to provide I/O capacity to the processor:
Rack-style PLC with multiple plug-in "cards" for different I/O types
Power
supply
L1
L2/N
Gnd
Processor
Input
0
1
2
3
Input
4
5
6
7
0
1
2
3
Output
4
5
6
7
0
1
2
3
IN0
IN0
VDC
IN1
IN1
OUT0
IN2
IN2
OUT1
IN3
IN3
OUT2
4
5
6
7
Input
Input
Output
Output
Analog
Analog
Analog
Analog
IN 0+
IN 0-
IN 0+
IN 0-
ANL COM
ANL COM
+24 VDC
DC COM
+24 VDC
DC COM
I OUT 0
I OUT 0
IN 1+
IN 1-
IN 1+
IN 1-
ANL COM
ANL COM
ANL COM
ANL COM
IN 2+
IN 2-
I OUT 1
I OUT 1
IN4
IN4
OUT3
IN5
IN5
OUT4
IN 2+
IN 2-
ANL COM
ANL COM
IN6
IN6
OUT5
ANL COM
ANL COM
I OUT 2
I OUT 2
IN 3+
IN 3-
IN 3+
IN 3-
ANL COM
ANL COM
I OUT 3
I OUT 3
ANL COM
ANL COM
ANL COM
ANL COM
IN7
IN7
OUT6
COM
COM
OUT7
COM
COM
COM
Discrete I/O
Analog I/O
Read selected portions of the Allen-Bradley PLC “1756 ControlLogix I/O Modules” publication
(document 1756-TD002A-EN-E, May 2009), and answer the following questions:
Locate the sample 4-20 mA device wiring diagrams for the 1756-IF6CIS “sourcing current loop analog
input module”, identifying the different types of 4-20 mA field devices supported.
Identify the rated input current range for this analog card, and also the “count” values associated with
the low and high signal values.
Calculate the number of counts per milliamp of signal with this analog input card, and also the resolution
(mA per count).
Calculate the “User counts” value for a 8.51 mA signal value input to this analog card.
Calculate the mA current signal value at a “User counts” value of +4592.
Suggestions for Socratic discussion
• A problem-solving technique useful for making proper connections in pictorial circuit diagrams is to
first identify the directions of all DC currents entering and exiting component terminals, as well as the
respective voltage polarity marks (+,−) for those terminals, based on your knowledge of each component
acting either as an electrical source or an electrical load. Discuss and compare how these arrows and
polarity marks help make sense of the sample wiring diagrams shown in this manual.
• Examine the sample diagrams shown in the Rockwell manual, showing connections between 4-20 mA
transmitters and the analog input channels. Then, identify the consequences of the shielded cable in
each diagram either failing open or failing shorted.
• Sketch what you think are the internal components between terminals VOUT, IN, and RTN for one of
the channels on the 1756-IF6CIS sourcing analog input modules, based on the recommended connections
to different kinds of 4-20 mA transmitters shown in the manual.
file i02271
38
Question 28
Once upon a time, your instructor was asked to troubleshoot a flow control system where a PLC
(Programmable Logic Controller) received a flow measurement signal from a 4-20 mA flow transmitter and
sent a 4-20 mA command signal to a variable-frequency motor drive (VFD) turning a pump. The PLC’s job
was to turn the pump at the speed necessary to deliver a flow rate at a specified setpoint value:
Motor
Pump
VFD
PLC
Analog
out
Analog
in
Flow
transmitter
The operator pressed the “Start” button, but the pump refused to turn. Upon examining the PLC’s
live program, it was found that the analog input value (a 16 bit binary number) was $FFFF. The measured
current signal from the flow transmitter was 3.99 mA: just a little bit below 0% of range, which was reasonable
for a no-flow condition.
Your instructor was able to fix this problem by adjusting the “zero” screw on the flow transmitter until
it output a current signal of exactly 4.00 mA at zero flow. As soon as this was done, the analog input in
the PLC’s program registered a value of $0000, and the pump started up as it was supposed to when the
operator pressed the “Start” button.
Explain why this simple transmitter calibration adjustment was able to allow the system to run again,
and why the real problem was a design flaw in the PLC.
Hint: The key to understanding what the problem was in this system is the difference between signed
and unsigned integers, and how an under-ranged ADC circuit can “underflow.”
file i04406
39
Question 29
Complete this table, performing all necessary conversions between numeration systems:
Binary
Octal
Decimal
Hexadecimal
10010
92
1A
67
1100101
122
1000
336
1011010110
file i02161
Question 30
Convert the following numbers from binary (base-two) to decimal (base-ten):
• 102 =
• 10102 =
• 100112 =
• 111002 =
• 101112 =
• 1010112 =
• 111001102 =
• 100011010112 =
Describe a general, step-by-step procedure for converting binary numbers into decimal numbers.
file i02164
40
Question 31
Convert the following numbers from decimal (base-ten) to binary (base-two):
• 710 =
• 1010 =
• 1910 =
• 25010 =
• 51110 =
• 82410 =
• 104410 =
• 924110 =
Describe a general, step-by-step procedure for converting decimal numbers into binary numbers.
file i02165
Question 32
A numeration system often used as a “shorthand” way of writing large binary numbers is the octal,
or base-eight, system. Based on what you know of place-weighted numeration systems, describe how many
valid ciphers exist in the octal system, and the respective “weights” of each place in an octal number.
Also, perform the following conversions:
• 358 into decimal:
• 1610 into octal:
• 1100102 into octal:
• 518 into binary:
Suggestions for Socratic discussion
• If binary is the “natural language” of digital electronic circuits, why do we even bother with other
numeration systems such as hex and octal?
• Why is octal considered a “shorthand” notation for binary numbers?
file i02166
Question 33
A numeration system often used as a “shorthand” way of writing large binary numbers is the
hexadecimal, or base-sixteen, system.
Based on what you know of place-weighted numeration systems, describe how many valid ciphers exist
in the hexadecimal system, and the respective “weights” of each place in a hexadecimal number.
Also, perform the following conversions:
• 3516 into decimal:
• 3410 into hexadecimal:
• 111000102 into hexadecimal:
• 9316 into binary:
file i02167
41
Question 34
Digital computers communicate with external devices through ports: sets of terminals usually arranged
in groups of 4, 8, 16, or more (4 bits = 1 nybble, 8 bits = 1 byte, 16 bits = 2 bytes). These terminals may
be set to high or low logic states by writing a program for the computer that sends a numerical value to
the port. For example, here is an illustration of a microcontroller being instructed to send the hexadecimal
number F3 to port A and 2C to port B:
Microcontroller
($F3)
Port A
7
6
5
4
3
2 1
($2C)
Port B
0
7
1 1 1 1 0 0 1 1
6
5
4
3
2 1
0
0 0 1 0 1 1 0 0
Suppose we wished to use the upper four bits of port A (pins 7, 6, 5, and 4) to drive the coils of a
stepper motor in this eight-step sequence:
Step
Step
Step
Step
Step
Step
Step
Step
1:
2:
3:
4:
5:
6:
7:
8:
0001
0011
0010
0110
0100
1100
1000
1001
As each pin goes high, it drives a power MOSFET on, which sends current through that respective coil
of the stepper motor. By following a ”shift” sequence as shown, the motor will rotate a small amount for
each cycle.
Write the necessary sequence of numbers to be sent to port A to generate this specific order of bit shifts,
in hexadecimal. Leave the lower four bit of port A all in the low logic state.
file i02168
42
Question 35
When representing non-whole numbers, we extend the “places” of our decimal numeration system past
the right of the decimal point, like this:
Decimal place-weights
2
5
9
6
103
102
101
100
3
8
0
4
10-1 10-2 10-3 10-4
2 × 103 = 2000
3 × 10-1 = 3/10
5 × 102 = 500
8 × 10-2 = 8/100
9 × 101 = 90
0 × 10-3 = 0/1000
6 × 100 = 6
4 × 10-4 = 4/10000
How do you suppose we represent non-whole numbers in a numeration system with a base (or “radix”)
other than ten? In the following examples, write the place-weight values underneath each place, and then
determine the decimal equivalent of each example number:
Binary place-weights
1
0
0
1
1
0
1
1
1
2
Octal place-weights
4
0
2
7
3
6
Hexadecimal place-weights
C
1
A
6
3
43
2
B
9
file i02169
Question 36
Complete this table, performing all necessary conversions between numeration systems on these fixedpoint number values. Truncate all answers to three characters past the point:
Binary
Octal
Decimal
Hexadecimal
101.011
25.2
4.B
72.52
1011.101
AC.11
934.79
641.7
101100.1
file i02170
Question 37
In digital computer systems, binary numbers are often represented by a fixed number of bits, such as
8, or 16, or 32. Such bit groupings are often given special names, because they are so common in digital
systems:
• byte
• nybble
• word
How many binary bits is represented by each of the above terms?
And, for those looking for more challenge, try defining these terms:
•
•
•
•
•
nickle
deckle
chawmp
playte
dynner
file i02171
44
Question 38
The IEEE 754-1985 standard for representing floating-point numbers uses 32 bits for single-precision
numbers. The first bit is the sign, the next eight bits are the exponent, and the last 23 bits are the mantissa:
Sign
0
Exponent (E)
00000000
Mantissa (m)
00000000000000000000000
±0.m × 2E−127
Single-precision, when exponent bits are all zero
±1.m × 2E−127
Single-precision, when exponent bits are not all zero
Based on this standard, determine the values of the following single-precision IEEE 754 floating-point
numbers:
Sign
1
0
0
Exponent (E)
00101100
11001100
00000000
Mantissa (m)
00001110000001100000000
11010110000000000000000
11111100000110001000000
Finally, how do you represent the number 1 (1.0 × 20 ) in this floating-point format?
file i01851
45
Question 39
An essential component of any digital control system is an analog-to-digital converter, or ADC. This is
necessary to convert the analog process variable measurement into a digital number for the control algorithm
to process. Another essential component is a digital-to-analog converter, or DAC, which does the exact
opposite.
In a system using 4-20 mA analog currents to relay instrument signals, there is an ADC located at the
process variable input of the controller, and a DAC located at the output of the controller:
Transmitter
Controller
4-20 mA
4-20 mA
ADC
I
DAC
/P
Transducer
Control valve
In digital “Fieldbus” systems, the communication is all digital, which places the ADC at the transmitter
and the DAC at the transducer:
Transmitter
Controller
Fieldbus
Fieldbus
ADC
DAC
Transducer
Control valve
46
In either case, we need to “scale” the binary count of the ADC and DAC to their respective analog
variable values. Consider a flow control system, with a flow transmitter ranged from 0 to 200 GPM and a
pneumatic control valve operating on a pressure range of 3 to 15 PSI (instrument air). Assuming the ADC
has a resolution of 16 bits (a digital conversion range of $0000 to $FFFF) and the DAC has a resolution of
14 bits (a digital conversion range of $0000 to $3FFF), determine the digital values corresponding to a 50%
PV signal (100 GPM flow rate) and a 50% valve position (9 PSI pneumatic signal). Write these hexadecimal
number values in the following tables:
Calibration table for process variable signal (ADC)
Measurement
0 GPM
100 GPM
200 GPM
Digital output
$0000
$FFFF
Calibration table for output signal (DAC)
Measurement
$0000
Digital output
0 PSI
9 PSI
15 PSI
$3FFF
Note that the DAC output does not correspond to a live zero scale. In other words, a digital input value
of $0000 will output no pressure to the valve (0 PSI), rather than a standard pneumatic “zero” signal of 3
PSI.
file i01498
Question 40
Question 41
Read and outline the “Instrumentation Amplifiers” subsection and introduction to the “Analog Signal
Conditioning and Referencing” section of the “Digital Data Acquisition and Networks” chapter in your
Lessons In Industrial Instrumentation textbook. Note the page numbers where important illustrations,
photographs, equations, tables, and other relevant details are found. Prepare to thoughtfully discuss with
your instructor and classmates the concepts and examples explored in this reading.
file i00882
47
Question 42
Read portions of the Burr-Brown (Texas Instruments) datasheet for the INA111 high-speed
instrumentation amplifier and answer the following questions:
Calculate the necessary gain resistor value (RG ) to give the amplifier a gain of 30. Also, express this
gain value in decibels.
Manipulate the given gain formula to solve for RG provided any arbitrary gain value desired.
Identify the typical input resistance of this instrumentation amplifier, as well as the typical bias current
value. Describe what will happen if there are no “return paths” provided for the amplifier’s input bias
currents.
This datasheet recommends the use of clamping diodes to protect the amplifier’s inputs from gross overvoltages. Examine the schematic diagram shown in figure 5 and explain how these clamping diodes work to
protect the amplifier. Note that there is actually a mistake in this schematic – can you find it?
Suggestions for Socratic discussion
• Identify which fundamental principles of electric circuits apply to each step of your analysis of this
circuit. In other words, be prepared to explain the reason(s) “why” for every step of your analysis,
rather than merely describing those steps.
• The datasheet recommends that only one bias current return resistor need be used if the differential
source resistance is low. Explain why the resistance of the voltage signal source matters at all to the
bias currents.
• Referring to the internal schematic diagram of the INA111 shown on the first page of the datasheet,
calculate VO given Vin(+) = +3.5 volts, Vin(−) = +1.5 volts, and RG = 50 kΩ by applying Ohm’s Law
and Kirchhoff’s Voltage and Current Laws to the three-opamp circuit.
file i00887
48
Question 43
Read the section entitled “Input Polarity and Range” (pages 2-2 through 2-5) of the National
Instruments “DAQ E Series User Manual” (document 370503K-01) and answer the following questions:
Based on the resolution (“precision”) you see listed in Table 2-1 for the NI 6020E data acquisition
module, how many bits does its ADC use?
Based on the resolution (“precision”) you see listed in Table 2-1 for the NI 6052E data acquisition
module, how many bits does its ADC use?
Describe the difference between unipolar and bipolar analog ranges.
Page 2-21 contains a table (2-6) of diagrams showing how to connect various analog signal sources to a
DAQ. Explain why the one connection scheme (middle row, right column) is not recommended.
Suggestions for Socratic discussion
• Why do you suppose the E-series DAQ modules use a PGIA (Programmable Gain Instrumentation
Amplifier) as a front-end to the ADC (Analog-to-Digital Converter)? Why not use a fixed-gain
instrumentation amplifier instead?
• Note the two different ground symbols used in the “Not Recommended” diagram in table 2-6. What
specifically are the authors trying to convey to you by using two different ground symbols?
• Explain the necessity of Rext in some of the diagrams shown in table 2-6.
• Identify the purpose for each function in the block diagram of figure 2-1.
file i02162
Question 44
Read and outline the “Analog Input References and Connections” subsection of the “Analog Signal
Conditioning and Referencing” section of the “Digital Data Acquisition and Networks” chapter in your
Lessons In Industrial Instrumentation textbook. Note the page numbers where important illustrations,
photographs, equations, tables, and other relevant details are found. Prepare to thoughtfully discuss with
your instructor and classmates the concepts and examples explored in this reading.
file i00884
49
Question 45
Sketch connecting wires to allow this data acquisition unit (DAQ) to sense pressure measured by the
loop-powered 4-20 mA pressure transmitter, on input channel #5:
DAQ
±10 VDC
AI0
AI1
AI2
AI3
H
L
AI4
AI5
AI6
AI7
COM
COM
Your circuit should be wired in such a way that greater pressure applied to the transmitter produces
a more positive signal measured by the DAQ. Note that you must add other components to make this a
complete circuit!
Additionally, determine whether this DAQ has single-ended or differential voltage inputs.
Suggestions for Socratic discussion
• A problem-solving technique useful for making proper connections in pictorial circuit diagrams is to
first identify the directions of all DC currents entering and exiting component terminals, as well as the
respective voltage polarity marks (+,−) for those terminals, based on your knowledge of each component
acting either as an electrical source or an electrical load. Discuss and compare how these arrows and
polarity marks simplify the task of properly connecting wires between components.
• Why do you suppose there are two “Common” terminals on the DAQ module?
• How could you test the “Common” terminals to see if they are connected to each other internally to
the DAQ?
• Challenge yourself to design more than one viable circuit for this application.
• After you have sketched your circuit, evaluate the effects of various components failing either open or
shorted, one at a time.
file i04582
50
Question 46
Sketch connecting wires to allow this data acquisition unit (DAQ) to sense strain using quarter-bridge
strain gauge circuits on input channels #1 and #3, such that increasing tension on the strain gauge
(increasing gauge resistance) generates a more positive signal voltage on each channel:
DAQ
±10 VDC
differential
AI0+
AI0AI1+
AI1AI2+
AI2-
Rstrain
Rstrain
AI3+
AI3-
Vexcitation +
−
AI Gnd
Shield
Suggestions for Socratic discussion
• Explain why in order for differential DAQ inputs to work, the power supply must share a common
connection with the DAQ power supply.
• Explain what the “AI Gnd” and “Shield” input terminals are generally used for.
• After you have sketched your circuit, evaluate the effects of various components failing either open or
shorted, one at a time.
• Identify whether or not bias resistors are necessary to connect to the DAQ’s input terminals. If so,
where should those resistors connect, and what should their approximate sizes be?
file i04584
51
Question 47
Shown here is a pair of loop-powered 4-20 mA process transmitters, a process controller with dual
measurement inputs, a 4-20 mA I/P (current-to-pressure) converter used to drive a pneumatically-actuated
control valve, and a DAQ (data acquisition) unit for interfacing to a computer. Both the process controller
and DAQ unit inputs are ranged from 1 to 5 volts DC, not 4-20 mA:
4-20 mA looppowered transmitter
+
−
Process controller
+24 VDC
ADC
X
4-20 mA looppowered transmitter
ADC
Y
Gnd
Output
4-20
mA
Out
Gnd
4-20 mA I/P converter
DAQ analog input unit
In_2
Control valve
In_1
In_0
ADC
ADC
ADC
Com
Show how all three field devices would properly connect to the controller and to the DAQ unit at the
same time, including the placement of resistors to convert the current signals into voltage signals that both
the controller and the DAQ may interpret.
Suggestions for Socratic discussion
• A problem-solving technique useful for making proper connections in pictorial circuit diagrams is to
first identify the directions of all DC currents entering and exiting component terminals, as well as the
respective voltage polarity marks (+,−) for those terminals, based on your knowledge of each component
acting either as an electrical source or an electrical load. Discuss and compare how these arrows and
polarity marks simplify the task of properly connecting wires between components.
• After you have sketched your circuit, evaluate the effects of various components failing either open or
shorted, one at a time.
52
file i02274
Question 48
A technician connects a DAQ (Data Acquisition) module to one phase of a 480 VAC three-phase electric
motor in order to measure and record that motor’s voltage and current simultaneously on a laptop computer.
The DAQ functions as a high-speed data recorder, allowing the computer to display and record a time-based
graph of motor voltage and motor current over time.
Knowing that the phase-to-phase voltage of approximately 480 volts and the line current of
approximately 25 amps will be far too great for the DAQ to directly measure, the technician uses instrument
transformers (a “PT” potential transformer and a “CT” current transformer) to step these voltages and
currents to more reasonable values:
CT
power conductor
100:5 ratio
AI0
PT
50:1 ratio
AI1
DAQ
±10 VDC
AI2
AI3
AI4
AI5
Computer
AI6
AI7
COM
USB
Three-phase 480 volt motor
COM
Unfortunately, as soon as the motor is energized, the DAQ disappears in a bright flash of light and
cloud of smoke. The destruction also propagated to the PC the DAQ was connected to (through the USB
cable)! What went wrong, and how should the technician correct his mistake? Assume we must use the
same instrument transformers shown here, but somehow make them work with another DAQ unit having
the same ± 10 volt input limits.
Suggestions for Socratic discussion
• What exactly does an instrument transformer do?
• Could this system be made to work with a differential-input DAQ? Why or why not?
file i02035
53
Question 49
An analog-to-digital converter has a 12-bit binary output and an analog input voltage range of 0.0 to
+ 5.0 volts. Calculate:
• The digital output (in hexadecimal) at 0.0 volts analog input =
• The digital output (in hexadecimal) at 5.0 volts analog input =
• The digital output (in hexadecimal) at 2.1 volts analog input =
• The analog input corresponding to a digital output of 2D0 =
volts
• The analog input corresponding to a digital output of F14 =
volts
file i03587
Question 50
Sketch connecting wires to allow this data acquisition unit (DAQ) to sense light on input channels #3
and #7, such that increasing light at each photocell generates an increasing positive signal voltage on each
channel. Note that all the analog input channels on this DAQ are single-ended, bipolar:
DAQ
±10 VDC
AI0
AI1
AI2
Photocell
AI3
AI4
AI5
Photocell
AI6
AI7
COM
+
−
COM
5 VDC
Recall that the electrical resistance of a photocell decreases with increasing light.
Suggestions for Socratic discussion
• A good problem-solving technique to apply in cases where we need to determine the direction of a change
for a component’s resistance in order to design a functioning circuit is to consider limiting cases for that
component’s resistance. For example, instead of asking ourselves what would happen if the intensity of
light slightly, we ask ourselves what would happen if light intensity changed dramatically. Explain how
this problem-solving technique applies to this particular system.
• After you have sketched your circuit, evaluate the effects of various components failing either open or
shorted, one at a time.
file i04587
54
Question 51
An analog-to-digital converter has a 16-bit binary output and an analog input voltage range of 0.0 to
+ 10.0 volts. Calculate:
• The digital output (in hexadecimal) at 0.0 volts analog input =
• The digital output (in hexadecimal) at 10.0 volts analog input =
• The digital output (in hexadecimal) at 3.4 volts analog input =
• The analog input corresponding to a digital output of 3D6A =
volts
• The analog input corresponding to a digital output of C005 =
volts
file i02661
55
Question 52
Modern pH and temperature (thermocouple) transmitters are constructed with extremely high input
impedances (typically in the hundreds of megaohms). Explain why a high input impedance voltmeter is
important when measuring the voltage output by a source, when the voltage in question is very small.
In the days before the advent of solid-state digital multimeters with their operational amplifier (high
impedance) inputs, a technique called null-balance was used to accurately measure small voltages such as
those produced by thermocouple junctions and pH probes. This “potentiometric” technique allowed people
to use rather primitive voltmeter technology without incurring the errors that would be experienced if the
voltmeter were directly connected to the signal source.
Examine the circuits shown below, and explain how the two meters (one “galvanometer” and one
voltmeter) plus a power source and a potentiometer would be used to measure voltage from the signal source
(pH probe or thermocouple junction):
Null-balance measurement of pH probe voltage
Electrical model of
a pH electrode pair
400 MΩ
(typical)
Rmeas
Galvanometer
VNernst
+
−
G
Voltmeter
V
Rref
3 kΩ
(typical)
Null-balance measurement of thermocouple voltage
Rwire
Galvanometer
G
Measurement
junction
Rwire
file i00621
56
Voltmeter
V
Question 53
An important concept in education is something called schema: the body of knowledge, expectations,
and assumptions that someone uses to interpret any form of communication they are receiving, whether
that communication be in the form of speech, text, or even something as abstract as art. One does not
approach an action-adventure novel in the same way or with the same expectations that one would approach
instructions for filing tax returns with the IRS. One does not interpret and appreciate a live jazz band in the
same way they would interpret and appreciate choral music. We have different schema for understanding and
appreciating these different forms of communication, even if they occur in the same medium (e.g. printed
text, or audible tones).
Industrial system diagrams also have schema associated with them. One does not interpret a P&ID
in the same manner that one interprets an electronic schematic or a block diagram, despite their many
similarities. This exercise will ask you to identify the meanings of similar symbols used in several types of
diagrams, in order to expose some of the schema you have (or that you are in the process of building).
Reference the following diagrams, and then answer the comparison/contrast questions that follow:
Schematic diagram of a relay circuit
A
G
N
120 VAC 1 A
H
B
H
P/S
E
D
24 VDC
1A
S
C
E
F
DE
57
Schematic diagram of a fuel tank level sensor circuit
Ignition
switch
Current mirror circuit
TP1
Fuel gauge
(voltmeter)
TP4
Q1
Q2
12 V
TP2
TP3
R1
Fuel level
sensor
5 Ω = Empty
260 Ω = Full
440 Ω
Ladder diagram of a solenoid valve control circuit
(-)
(+)
5A
O H A
1
5
S
4
CR1-1
6
1
3
8
Remote stop
Reset
7
9
11
CR1-2
5
7
CR1
3
IL-71
R
10
58
2
P&ID of a solvent storage tank
LAH
234
Set @
10 oz.
press.
PG
364
PSV
14
PG
363
Set @
8 oz.
vac.
LT
305
LSH
234
WirelessHART
2"
4"
Solvent unloading
1-1/2"
thick
S-403
Solvent storage tank
TT
109
1"
TCV
105
PG
365
H
2"
3"
Dwg. 45231
LI
305
TI
109
12"
30 PSI steam
TI
304
Dwg. 11032
PG
361
H
L
24"
MW
WirelessHART
TG
205
LSL
233
T
2"
TT
304
4"
PIR
271
2"
ET
PG
367
TG
209
PT
271
PG
368
Solvent wash
Dwg. 32451
ET
PG
366
Condensate header
PSH
231
Dwg. 11032
I
ET
PSL
232
HC
P-25
Schematic diagram of a hydraulic valve control system
HP gauge
Hand pump
Accumulator
Regulator
Line valve
LP gauge
FC
(test)
Relief, LP
Solenoid trip
Reset
Auto/Man
Relief, HP
59
Pressure pilot
H
Schematic/pictorial diagram of a pressure transmitter
Current
signal
output
−
Amplifier
"Force motor"
(applies force
proportional
to DC current)
S
+
N
Light
source
Flexure
Diaphragm
Closely-spaced
photoresistors
Applied
pressure
Pictorial diagram of an I/P transducer
OFF
% 4 to 20 mA
Coil
Bellows
mA
mA
READ VDC
N
Spring
N
Beam
Pivot
LOOP CALIBRATOR
READ
2-WIRE
TRANSMITTER
SIMULATOR
S
100%
20 mA
Coil
POWER 2-WIRE
TRANSMITTERS
SOURCE
ADJUST
S
4 mA
0%
Relay
Precision
test gauge
Vent
Fisher model 546 I/P
(schematic diagram)
Compressed
air
supply
60
Nozzle
Loop diagram of a compressor surge control system
Loop Diagram: Compressor surge control
Revised by: I. Hate Surge
Field
panel
Field process area
JB
30
0-200 PSID
+
PDT
42
4-20 mA
I
Panel rear
CBL21
JB
1
CBL24
8
-
PR1
P
FY
42b
+
2
10
3
S
FV 42
CBL22
PR2
5
6
4
L1
L2
G
6
G
L2
L1
14
15
CBL23
4-20 mA
-
0-1500 SCFM
4
AS 20 PSI
+
3
CBL26
5
13
FIC
42
2
60 Hz
ES 120VAC
11
12
-
1
CBL25
1
9
PR3
16
7
+
8
-
FY
42a
+
-
CBL27
ES 120VAC
60 Hz
9
0-1500 SCFM
Functional diagram of control loops
FT
FT
FT
D
A
P
A
I D
T
FCV
P
A
A
April 1, 2003
Panel front
4-20 mA
Compressor
FT
42
Date:
T
P
I
T
A
I
T
FCV
FCV
61
A
FOUNDATION Fieldbus function block diagram
TT-101a
OUT_D
AI
OUT
(TV-101)
BKCAL_IN
TT-101b
(TT-101a)
OUT_D
AI
FF_VAL
OUT_D
OUT
OUT
IN
IN_3
TRK_IN_D
IN_4
TRK_VAL
DISABLE_1
TT-101c
AI
IN_1
IN_2
OUT
BKCAL_OUT
CAS_IN
OUT
PID
ISEL
DISABLE_2
SELECTED
TV-101
CAS_IN
DISABLE_3
DISABLE_4
BKCAL_OUT
AO
OP_SELECT
Questions:
•
•
•
•
•
•
•
Identify
Identify
Identify
Identify
Identify
Identify
Identify
the meaning(s) of all dashed lines in these diagrams
the meaning(s) of all arrows in these diagrams
the meaning(s) of all triangles in these diagrams
the meaning(s) of all boxes in these diagrams
the meaning(s) of all circles in these diagrams
how directions of motion are indicated in each diagram (if at all)
how sources of energy are indicated in each diagram (if at all)
file i02683
Question 54
Question 55
Question 56
Question 57
Question 58
Question 59
Question 60
62
OUT
Question 61
Read and outline the introduction of the “Digital Data Communication Theory” section of the “Digital
Data Acquisition and Networks” chapter in your Lessons In Industrial Instrumentation textbook. Note
the page numbers where important illustrations, photographs, equations, tables, and other relevant details
are found. Prepare to thoughtfully discuss with your instructor and classmates the concepts and examples
explored in this reading.
file i04398
Question 62
Read and outline the “Serial Communication Principles” subsection of the “Digital Data Communication
Theory” section of the “Digital Data Acquisition and Networks” chapter in your Lessons In Industrial
Instrumentation textbook. Note the page numbers where important illustrations, photographs, equations,
tables, and other relevant details are found. Prepare to thoughtfully discuss with your instructor and
classmates the concepts and examples explored in this reading.
file i04399
Question 63
Read and outline the “Physical Encoding of Bits” subsection of the “Digital Data Communication
Theory” section of the “Digital Data Acquisition and Networks” chapter in your Lessons In Industrial
Instrumentation textbook. Note the page numbers where important illustrations, photographs, equations,
tables, and other relevant details are found. Prepare to thoughtfully discuss with your instructor and
classmates the concepts and examples explored in this reading.
file i04400
63
Question 64
Decoding a Manchester-encoded waveform is challenging to many students, because it’s not clear at
first how to differentiate “real” signal transitions (i.e. those pulse edges representing actual binary data bits)
from transitions that are merely “reversals” (i.e. those pulse edges that are simply set-up for the next “real”
data pulse). Here, I will show you a practical problem-solving method to gain a deeper understanding.
We will apply the problem-solving technique of working backwards to understand the concept better. If
the part we’re struggling with is how to convert a waveform into a series of bits, then we’ll turn the problem
backwards by starting with a known series of bits and working to convert that series of bits into a waveform:
Here we see a series of bits aligned with a set of grey lines which we know will be pulse edges:
0
0
1
0
1
0
0
0
1
1
1
0
Begin by tracing the rising- and falling-edge pulses for each bit, following the standard of a rising edge
representing a “1” bit and a falling edge representing a “0” bit. Feel free to draw small arrows distinguishing
the rising versus falling transitions. Then, figure out how to connect these rising and falling edges together
to form an actual pulse waveform.
It should quickly become apparent to you where “reversals” are necessary in order to “set up” properly
for the next data pulse.
After you have done this, cover up the “1” and “0” bits so you can only see the waveform you’ve
skeched. Erase any arrow-heads you might have sketched, so there is nothing visible to you except a clean
pulse waveform. Now, explain to yourself how you would interpret this waveform to know which pulse edges
represented real data as opposed to reversals.
file i02128
64
Question 65
Decode the following serial data streams, each one encoded using a different method:
(Manchester encoding)
(NRZ encoding)
65
(FSK encoding)
Suggestions for Socratic discussion
• Students often experience confusion interpreting data streams when viewed like this, especially
Manchester-encoded data. One problem-solving strategy that works well to help interpret waveform
patterns is to work the problem backwards. Start with a known data stream (binary 1’s and 0’s) and
then sketch a waveform representing that data stream. Do this for several different data streams,
experimenting with different pattern combinations of 1’s and 0’s (repeating bits versus alternating bits,
etc.), and then examine the waveforms you sketched to see what general principles you might apply to
reliably interpret any data stream encoded in that manner.
• Explain how these three different encoding methods provide an excellent contrast between bit rate and
baud.
file i04411
Question 66
Read and outline the “Communication Speed” subsection of the “Digital Data Communication Theory”
section of the “Digital Data Acquisition and Networks” chapter in your Lessons In Industrial Instrumentation
textbook. Note the page numbers where important illustrations, photographs, equations, tables, and other
relevant details are found. Prepare to thoughtfully discuss with your instructor and classmates the concepts
and examples explored in this reading.
file i04401
Question 67
Read and outline the “Digital Representation of Text” section of the “Digital Data Acquisition and
Network” chapter in your Lessons In Industrial Instrumentation textbook. Note the page numbers where
important illustrations, photographs, equations, tables, and other relevant details are found. Prepare to
thoughtfully discuss with your instructor and classmates the concepts and examples explored in this reading.
file i04397
66
Question 68
A computer spreadsheet program may be used as a simulator for an analog-digital converter, taking an
analog voltage signal value and converting it into a digital “count” value.
Begin creating your own spreadsheet by following the format shown below, allowing anyone to enter an
analog input value in volts, while the spreadsheet calculates the “count” value and displays it in decimal,
binary, and hexadecimal formats. Note that the yellow and blue shading in this example spreadsheet is
strictly for aesthetic value (distinguishing input values from calculated values) and is not necessary for the
spreadsheet to function:
1
2
1 Input (V)
2
3.5
3
3
4
Counts (decimal) =
179
Counts (binary) =
Counts (hex) =
5
10110011
B3
4
5
Assume a 0 to 5 volt analog input range, and a 8-bit (00 to FF hex) digital output range.
Suggestions for Socratic discussion
• How could you modify the spreadsheet to have its analog input range be user-adjustable? In other
words, allowing anyone to simulate the performance of a 0 to 10 volt range or 0 to 20 volt range without
having to modify any of the formulae in the spreadsheet?
• How could you test your spreadsheet cable-length calculator for accuracy (to verify you haven’t made
any mistakes) once you’ve entered all your equations?
file i04408
67
Question 69
A common analytical sensor used to detect potentially explosive gases (often called a LEL analyzer
in reference to “Lower Explosive Limit”) is the catalytic combustible gas sensor. In this type of sensor, a
fine platinum wire is heated by an electric current, and covered by a catalytic substance. If a mixture of
flammable gas(es) and air comes into contact with the sensor, the ensuing combustion will cause the platinum
wire to heat up, thus increasing the wire’s resistance and signaling the presence of a potentially explosive
gas.
In this particular LEL analyzer, two identical platinum wire sensors are connected in series, one of them
exposed to a steady stream of sample gas and the other sealed where no gas can reach it. The voltages
dropped by these two resistance elements are digitized by a pair of analog-to-digital converters (ADCs) and
interpreted by a microcontroller:
Vdd
C
D
Gas sample in
R3
R2
ADC
B
Gas sample out
R1
E
A
Vdd
ADC
R4
12
12
+
−
Microcontroller
Supposing this circuit is faulty (signaling the presence of explosive gas even when there is no gas present),
where would you begin taking diagnostic measurements to isolate the nature of the fault? Under what sample
gas conditions would you prefer to perform these measurements, and why?
Suggestions for Socratic discussion
• Why do you suppose the two catalytic wire sensors are connected in series?
• What are the values of some electrical measurements you would expect to see in a “healthy” circuit,
and what might you expect to see in a circuit where the active gas sensor has failed?
• What are some component failures that could cause the microcontroller to see a “hotter” signal for R3
than for R4 ? What effect would this have on gas detection?
• What are some component failures that could cause the microcontroller to see a “colder” signal for R3
than for R4 ? What effect would this have on gas detection?
• What would happen if resistor R1 were to fail open?
• What would happen if resistor R1 were to fail shorted?
• What would happen if rheostat R2 were to decrease in resistance?
• What would happen if rheostat R2 were to increase in resistance?
• Why do you suppose the sensor’s platinum wire is coated with a catalyst?
• This type of LEL sensor is dependent upon the amount of oxygen present in the gas sample. Determine
the effect that oxygen concentration will have on this type of analyzer (i.e. will an increased oxygen
concentration make the instrument “think” there is more or less flammable gas present?), and then
devise a method by which this interference may be compensated.
68
file i01592
Question 70
Suppose an ammeter inserted between test point C and the nearest lead of resistor R2 registers 10 mA
in this series-parallel circuit:
R3
C
A
E
1 kΩ
R2
1 kΩ
R1
B
1 kΩ
F
D
10 mA
(24 volts
voltage-limited)
Identify the likelihood of each specified fault for this circuit. Consider each fault one at a time (i.e. no
coincidental faults), determining whether or not each fault could independently account for all measurements
and symptoms in this circuit.
Fault
R1 failed open
R2 failed open
R3 failed open
R1 failed shorted
R2 failed shorted
R3 failed shorted
Current source dead
Possible
Impossible
Suggestions for Socratic discussion
• Identify which fundamental principles of electric circuits apply to each step of your analysis of this
circuit. In other words, be prepared to explain the reason(s) “why” for every step of your analysis,
rather than merely describing those steps.
• This type of problem-solving question is common throughout the Instrumentation course worksheets.
What specific skills will you build answering questions such as this? How might these skills be practical
in your chosen career?
• An assumption implicit in this activity is that it is more likely a single fault occurred than multiple,
coincidental faults. Identify realistic circumstances where you think this would be a valid assumption.
Hint: research the philosophical proverb called Occam’s Razor for more information! Are there any
realistic circumstances where the assumption of only one fault would not be wise?
This question is typical of those in the “Fault Analysis of Simple Circuits” worksheet found in the
Socratic Instrumentation practice worksheet collection (online), except that all answers are provided for
those questions. Feel free to use this practice worksheet to supplement your studies on this very important
topic.
file i04489
69
Question 71
An analog-to-digital converter (ADC) has a calibrated input range of 0 to 10 volts, and a 12-bit output
(0 to 4095 “count” range). Complete the following table of values for this converter, assuming perfect
calibration (no error):
Input voltage
(volts)
Percent of span
(%)
0
25
50
75
100
Counts
(decimal)
Counts
(hexadecimal)
file i03823
Question 72
An analog-to-digital converter (ADC) has a calibrated input range of 0 to 10 volts, and a 16-bit output
(0 to 65535 “count” range). Complete the following table of values for this converter, assuming perfect
calibration (no error):
Input voltage
(volts)
Percent of span
(%)
0
25
50
75
100
Counts
(decimal)
Counts
(hexadecimal)
file i03824
Question 73
A digital pressure transmitter has a calibrated input range of 0 to 75 PSI, and a 14-bit output (0 to 16383
“count” range). Complete the following table of values for this transmitter, assuming perfect calibration (no
error):
Input pressure
(PSI)
Percent of span
(%)
0
36
62
89
95
file i03825
70
Counts
(decimal)
Counts
(hexadecimal)
Question 74
A digital level transmitter has a calibrated input range of 20 to 170 inches of liquid level, and a 10-bit
output (0 to 1023 “count” range). Complete the following table of values for this transmitter, assuming
perfect calibration (no error):
Input level
(inches)
Percent of span
(%)
11
28
55
73
92
Counts
(decimal)
Counts
(hexadecimal)
file i03827
Question 75
An analog-to-digital converter (ADC) has a calibrated input range of 0 to 5 volts, and a 12-bit output.
Complete the following table of values for this converter, assuming perfect calibration (no error):
Input voltage
(volts)
1.6
Percent of span
(%)
Counts
(decimal)
Counts
(hexadecimal)
3022
40
A2F
Suggestions for Socratic discussion
• Calculate the resolution of this ADC in percent of full-scale range. In other words, what is the smallest
percentage of input signal change it is able to resolve?
file i03822
71
Question 76
The following schematic diagram shows two four-bit universal shift registers used to communicate data
serially over a coaxial cable of unspecified length:
Parallel data in
PL
DS
CE
Clk
D0
D1
D2
D3
SRG
VSS
Q0
Q1
Q2
Coaxial data cable
...
...
...
Q3
PL
DS
CE
Clk
D0
D1
D2
D3
Q1
Q2
Q3
SRG
VSS
Q0
Parallel data out
Explain how both registers would be used to transmit four bits of parallel data in serial form over the
coaxial data cable.
file i02163
Question 77
An important integrated circuit (IC) used in digital data communication is a UART. Describe what this
acronym stands for, and explain the purpose of this circuit.
file i02172
72
Question 78
Decode the following serial data streams, each one encoded using a different method:
(Manchester encoding)
(FSK encoding)
file i02917
73
Question 79
Decode the following serial data streams, each one encoded using a different method:
(Manchester encoding)
(FSK encoding)
Suggestions for Socratic discussion
• Assuming a common time scale for both data streams shown, which of the two has the highest bit rate?
• Assuming a common time scale for both data streams shown, which of the two has the highest baud
rate?
file i02919
Question 80
Decode this set of ASCII characters, to reveal a secret message (all codes given in hexadecimal format):
49 20 4C 6F 76 65 20 49 6E 73 74 72 75 6D 65 6E 74 61 74 69 6F 6E 21
file i02176
74
Question 81
Explain why the following wiring practices are standard:
Separating power wiring from signal wiring in an enclosure:
Using wire duct and/or wire “looms” to organize wires in electrical enclosures:
file i02288
75
Question 82
This resistor circuit is supposed to function as a precision resistance and voltage divider, for use in a
4-20 mA analog current circuit where one device has a 1-5 volt DC signal input range, and another device
has a 0.4-2 volt signal range:
Resistor network
1-5 VDC
1k
1k
4-20 mA
transmitter
Adjust for proper
1 to 5 volt output
270
1k
1k
0.4-2 VDC
Adjust for proper
0.4 to 2 volt output
Gnd
Assume the resistor values shown in the schematic are exact, calculate the required settings for both
potentiometers to yield the desired output voltages given a 4 to 20 mA DC input signal range. Also,
determine which of these calibrations should be made first, because one of these potentiometer adjustments
affects the other (but not vice-versa)!
file i02277
76
Question 83
Try to interpret this Manchester-encoded digital signal as viewed on an oscilloscope display, and explain
why the task is difficult (or impossible) without further information:
file i02415
77
Question 84
An analog-to-digital converter (ADC) circuit takes an analog input voltage and converts it to an
equivalent digital number output. In the following diagram, the ADC inputs an analog voltage between
0 and 5 volts DC and outputs a 10-bit binary value between 0000000000 (at exactly 0 volts input) and
1111111111 (at exactly 5 volts input). Expressing these digital output values in decimal form, the output
is 0 “counts” at 0 volts DC input, and 1023 “counts” at 5 volts DC input:
+Vsupply
Vinput
(0 to 5 VDC)
ADC
(10 bit)
10-bit
binary
output
Determine the output of this ADC when it sees an input voltage of 2.502 volts. Express your answer in
binary, decimal, and hexadecimal forms. Be sure to show all your work!
Counts (binary) =
Counts (decimal) =
Counts (hexadecimal) =
file i03299
78
Question 85
Identify suitable input terminals, proper modes, and necessary connecting wires to allow this National
Instruments E-series data acquisition unit (DAQ) to independently sense the voltages of the three seriesconnected solar cells shown:
National Instruments
DAQ E Series
AI0
NI 6011E
AI1
AI2
AI3
AI4
Data cable
AI5
Cell 1 +
−
AI6
AI7
AI8
AI9
Cell 2 +
−
AI10
AI12
Cell 3 +
−
AI13
AI14
AI15
AI SENSE
AI GND
The available modes for the input channels are RSE, NRSE, and DIFF:
Channel
0
1
2
Mode
First terminal
file i01616
79
Second terminal
...
AI11
To computer
Question 86
The resolution of an analog-to-digital or digital-to-analog converter circuit is a function of how many
bits of binary data it inputs or outputs. For example, an 8-bit converter resolves the signal into 256 discrete
states (counts). The formula for determining the number of counts (M ) from the number of binary bits (n)
is as follows:
M = 2n
In order to calculate the resultion of a converter circuit in units of volts (i.e. how many volts of analog
signal each digital “count” value represents), we divide the analog span by the number of digital counts less
one:
Resolution =
Span
Counts − 1
Based on this knowledge, write a single mathematical formula solving for the resolution of an
analog/digital converter circuit given the analog span and number of bits. Use only the following variables
in your formula:
VS = Analog span (volts)
VR = Resolution (volts)
n = Number of digital bits
Next, manipulate this formula to solve for the number of bits needed given a specified resolution and
span.
file i03618
80
Question 87
Complete the table of values for this circuit. Be sure to show all your work!
+15 V
R1
18 kΩ
R2
9.1 kΩ
R1
R2
18 kΩ
9.1 kΩ
R3
R3
5.5 kΩ
Total
V
I
R
5.5 kΩ
P
As you solve this problem, be sure to store all intermediate calculations (i.e. answers given to you by
your calculator which you will use later in the problem) in your calculator’s memory locations, so as to avoid
re-entering those values by hand. Re-entering calculated values unnecessarily introduces rounding errors
into your work, as well as invites keystroke errors. Avoiding the unnecessary introduction of error is a very
important concept in Instrumentation!
If your final answers are rounded as a result of not doing this, you will only receive half-credit for your
work. This is a general policy for all your mathematical work in this program, not just this particular
problem!
Note: the task of analyzing any series-parallel resistor network is greatly simplified by an approach
outlined in the online textbook Lessons In Electric Circuits, in the “Series-Parallel Combination Circuits”
chapter. There, a technique is demonstrated by which one may reduce a complex series-parallel network
step-by-step into a single equivalent resistance. After this reduction, Ohm’s Law and Kirchhoff’s Laws of
voltage and current are applied while “expanding” the circuit back into its original form. Even though the
current notation in this textbook is electron flow rather than conventional flow, the series-parallel analysis
technique works all the same.
file i03147
81
Question 88
Suppose an ammeter inserted between test points E and D registers 24 mA in this circuit:
Current mirror
A
R2
B
C
5 mA
1 kΩ
24 volts
(0.5 amps
current-limited)
+
−
R1
Q1
1 kΩ
R3
D
E
1 kΩ
F
(Q1 regulates
current at 5 mA)
Identify the likelihood of each specified fault for this circuit. Consider each fault one at a time (i.e. no
coincidental faults), determining whether or not each fault could independently account for all measurements
and symptoms in this circuit.
Fault
R1 failed open
R2 failed open
R3 failed open
Q1 failed open
R1 failed shorted
R2 failed shorted
R3 failed shorted
Q1 failed shorted
Voltage source dead
Possible
file i03193
82
Impossible
Question 89
Small relays often come packaged in clear, rectangular, plastic cases. These so-called “ice cube” relays
have either eight or eleven pins protruding from the bottom, allowing them to be plugged into a special
socket for connection with wires in a circuit. Note the labels near terminals on the relay socket, showing the
locations of the coil terminals and contact terminals:
coil
Com #1
Com #2
coil
N.O. #1
N.C. #1
N.C. #2
N.O. #2
(top views)
Relay
socket
Relay
Draw the necessary connecting wires between terminals in this circuit, so that actuating the normallyopen pushbutton switch sends power from the battery to the coil to energize the relay:
+
-
N.O.
switch
Battery
Relay
(plugged into socket)
file i03208
83
Question 90
A technician brings a control power transformer into your repair shop for diagnosis. It is a dual-voltage
primary unit, and was used on the job site to step 480 volts down to 120 volts:
Schematic diagram
240 × 480 primary
H1
H3
X1
H2
H1
H4
H3
H2
H4
X2
X1
X2
120 secondary
According to the person who did the field troubleshooting, the transformer is simply “bad.” As is
typical, you were given no other information to help diagnose the precise fault. Describe how you would test
this transformer in your shop for the following faults, noting the transformer terminals you would connect
your multimeter to and the type of meter measurement you would expect to see for each specified fault.
First (left) primary winding failed open
• Meter connected between:
• Measurement expected for this type of fault:
Second (right) primary winding failed open
• Meter connected between:
• Measurement expected for this type of fault:
First (left) primary winding shorted to iron core
• Meter connected between:
• Measurement expected for this type of fault:
Secondary winding shorted to iron core
• Meter connected between:
• Measurement expected for this type of fault:
file i03173
84
Question 91
Lab Exercise – introduction
Your task is to build, document, and troubleshoot a telemetry system consisting of an analog sensor
connected to a data acquisition (DAQ) module, which then sends the data over Ethernet to a personal
computer. Temperature and pressure are suggested process variables to measure. Electric current (measured
using a shunt resistor or a current transformer) is another excellent process variable to measure, and this
works well to introduce the specialized topic of electric power metering and protection. In fact, setting up an
electronic protective relay to sense AC current and initiate a breaker “trip” signal is an excellent alternative
to using a generic DAQ. Other process variables are open for consideration, though.
The following table of objectives show what you and your team must complete within the scheduled
time for this lab exercise. Note how some of these objectives are individual, while others are for the team as
a whole:
Objective completion table:
Performance objective
Team meeting and prototype sketch (do first!)
Circuit design challenge
Final documentation and system inspection
Demonstrate IP “ping” utility
Demonstrate use of a “knockout punch” tool
Accurate measurement of variable (± 1% of span)
Data communicated via Ethernet
Troubleshooting
Lab question: Instrument connections
Lab question: Commissioning
Lab question: Mental math
Lab question: Diagnostics
Decommission and lab clean-up
Grading
mastery
mastery
mastery
mastery
mastery
mastery
mastery
mastery
proportional
proportional
proportional
proportional
mastery
1
–
2
–
3
–
4
–
Team
––––
––––
–
–
–
–
–
–
–
–
–
–
–
–
–
–
–
–
–
–
–
–
–
–
–
–
–
–
–
–
–
–
–
–
–
–
–
–
–
–
–
–
The only “proportional” scoring in this activity are the lab questions, which are answered by each student
individually. A listing of potential lab questions are shown at the end of this worksheet question. The lab
questions are intended to guide your labwork as much as they are intended to measure your comprehension,
and as such the instructor may ask these questions of your team day by day, rather than all at once (on a
single day).
It is essential that your team plans ahead what to accomplish each day. A short (10
minute) team meeting at the beginning of each lab session is a good way to do this, reviewing
what’s already been done, what’s left to do, and what assessments you should be ready for.
There is a lot of work involved with building, documenting, and troubleshooting these working
instrument systems!
As you and your team work on this system, you will invariably encounter problems. You should always
attempt to solve these problems as a team before requesting instructor assistance. If you still require
instructor assistance, write your team’s color on the lab whiteboard with a brief description of what you
need help on. The instructor will meet with each team in order they appear on the whiteboard to address
these problems.
85
Lab Exercise – team meeting, prototype sketch, and instrument selection
An important first step in completing this lab exercise is to meet with your instructor as a team
to discuss safety concerns, team performance, and specific roles for team members. If you would like to
emphasize exposure to certain equipment (e.g. use a particular type of control system, certain power tools),
techniques (e.g. fabrication), or tasks to improve your skill set, this is the time to make requests of your
team so that your learning during this project will be maximized.
An absolutely essential step in completing this lab exercise is to work together as a team to sketch a
prototype diagram showing what you intend to build. This usually takes the form of a simple electrical
schematic and/or loop diagram showing all electrical connections between components, as well as any tubing
or piping for fluids. This prototype sketch need not be exhaustive in detail, but it does need to show enough
detail for the instructor to determine if all components will be correctly connected for their safe function.
For example, if you intend to connect field devices to a PLC (Programmable Logic Controller), your
prototype sketch must show how those devices will connect to typical input/output terminals on the PLC,
where electrical power will be supplied, etc. Prototype sketches need not show all intermediary connections
between components, such as terminal blocks in junction boxes between the field device and the controller.
You should practice good problem-solving techniques when creating your prototype sketch, such as
consulting equipment manuals for information on component functions and marking directions of electric
current, voltage polarities, and identifying electrical sources/loads. Use this task as an opportunity to
strengthen your analytical skills! Remember that you will be challenged in this program to do all of this
on your own (during “capstone” assessments), so do not make the mistake of relying on your teammates to
figure this out for you – instead, treat this as a problem you must solve and compare your results with those
of your teammates.
Your team’s prototype sketch is so important that the instructor will demand you provide this plan
before any construction on your team’s working system begins. Any team found constructing their system
without a verified plan will be ordered to cease construction and not resume until a prototype plan has
been drafted and approved! Similarly, you should not deviate from the prototype design without instructor
approval, to ensure nothing will be done to harm equipment by way of incorrect connections. Each member
on the team should have ready access to this plan (ideally possessing their own copy of the plan) throughout
the construction process. Prototype design sketching is a skill and a habit you should cultivate in school
and take with you in your new career.
Each lab team locker has its own data acquisition unit (DAQ), and other DAQ units are available from
the instructor. You will need to install software on a personal computer in order for that computer to gather
analog data from the DAQ unit.
It is recommended that you test your DAQ before connecting it to any external circuitry. For a simple
test of an analog input, set your multimeter to “Diode Test” so that it outputs a small voltage, then connect
your meter leads to one of the analog input channels on the DAQ: the software should register a small voltage
on that channel, letting you know the DAQ is functioning.
You will need to choose a suitable sensor to connect to one of the DAQ analog inputs. For greatest
accuracy, I recommend using a standard 4-20 mA loop-powered pressure or temperature transmitter, with
a 250 ohm resistor connected to the DAQ so it can read a 1-5 volt signal:
Ain1
Ain2
L
250 Ω
Ain3
Ain4
Com
24 VDC
+
−
H
86
DAQ
...
To personal computer
You are also welcome to be more creative and build yourself a simpler analog sensing circuit such as
this:
Thermistor
Ain1
-To
Ain2
+
−
Ain3
...
DAQ
To personal computer
Ain4
Com
The challenge with a circuit such as this is that it will not output a signal that is linearly proportional to
temperature like the loop-powered transmitter will. In order to make this work, you will have to program a
formula into the DAQ software to “linearize” the voltage signal into a proportional temperature value. This
will require extra work on your part to characterize the sensor, then develop a formula describing the signal
voltage value as a function of the measured variable. You may find a computer spreadsheet program to be
helpful, plotting a curve of voltage versus sensor stimulus (e.g. temperature), then using the curve-fitting
utility in the spreadsheet to develop an equation relating voltage to the measurement.
Ain1
Bipolar
input
Ain2
Ain3
Current
transformer
Ain4
Rshunt
DAQ
...
To personal computer
Com
AC load current
If you choose to build a system to measure AC current using a current transformer (CT, shown above),
you will need to select a suitable shunt resistor to drop voltage generated by current output by the CT. This
is done by researching the “burden” rating of the CT, which will tell you how large that load resistor may be.
CTs act as current sources, and so “want” to drive a low-resistance load (e.g. an ammeter to measure the CT
secondary current). However, the DAQ needs to see a strong enough voltage drop across the shunt resistor
to use a reasonable percentage of its range, in order to make good use of its resolution. If you build this
circuit, you must be sure to do so in a way that the CT’s secondary winding will never become open-circuited
when load current goes through it! Open-circuited current transformers are capable of generating dangerously
high voltages!!!
Planning a functioning system should take no more than an hour if the team is working
efficiently, and will save you hours of frustration (and possible component destruction!).
87
Lab Exercise – circuit design challenge
Build a simple circuit using either a light sensor (photocell) or a temperature sensor (thermistor)
connected to a fixed-value resistor and a battery such that a variable output voltage will be generated
as the sensor is stimulated. Your circuit must either make the voltmeter indication increase with increasing
sensor stimulus (more voltage for more light or heat – direct action), or do the exact opposite (reverse
action), as specified by the instructor. All electrical connections must be made using a terminal strip (no
twisted wires, crimp splices, wire nuts, spring clips, or “alligator” clips permitted). You will also need to
demonstrate how to record and display the lowest and highest voltages output by this circuit using your
digital multimeter’s “min/max” recording function function.
This exercise tests your ability to properly identify the operating characteristics of a light or temperature
sensor, properly size a resistor to form a voltage divider circuit with the sensor, properly connect a voltmeter
into the circuit to achieve the specified response direction, properly use a DMM to capture minimum and
maximum voltage values, and use a terminal strip to organize all electrical connections.
DMM (you provide)
Photocell
Resistor
+
Thermistor
V
Terminal strip
-
A
V
OFF
A
A
COM
Battery
The following components and materials will be available to you: assorted CdS photocells and
thermistors ; an assortment of resistors ; terminal strips ; lengths of hook-up wire ; battery clips
(holders).
You will be expected to supply your own screwdrivers and digital multimeter (DMM) for assembling
and testing the circuit at your desk. The instructor will supply the battery(ies) to power your circuit when
you are ready to see if it works. Until that time, your circuit will remain unpowered.
Meter response (instructor chooses):
Direct
Captured value (instructor chooses):
Vminimum
Sensor type (instructor chooses):
Photocell
88
Reverse
Vmaximum
Thermistor
Lab Exercise – building the system
The Instrumentation lab is set up to facilitate the construction of working instrument “loops,” with over
a dozen junction boxes, pre-pulled signal cables, and “racks” set up with 2-inch vertical pipes for mounting
instruments. The only wires you should need to install to build a working system are those connecting the
field instrument to the nearest junction box, and then small “jumper” cables connecting different pre-installed
cables together within intermediate junction boxes.
After getting your prototype sketch approved by the instructor, you are cleared to begin building your
system. All wire connections should be made using terminal blocks. No twisted or taped wire connections
will be allowed.
You will need to configure the DAQ software to “scale” the 1-5 VDC signal into an actual measurement
of your process variable (e.g. temperature, pressure). A requirement of this lab is that the DAQ software
accurately register the process variable you are measuring, rather than merely displaying a voltage value
from the sensor.
The personal computer attached to the DAQ may be your own laptop, or one of the lab’s computers.
Regardless of which computer you use, it needs to be connected to the lab’s Ethernet network so that another
computer in the lab may acquire the data from it.
Your chosen system may require its own electrical enclosure to house the DAQ and/or other components,
not already a part of the lab’s permanently-installed loop system. If you need to punch a hole in the side
of a custom enclosure as part of your system, you must use a special tool called a knockout punch to make
these holes (rather than use a hole saw on a drill). The Greenlee company manufactures a line of knockout
punches called the Slug Buster, which you may wish to research in preparing to use this tool.
Common mistakes:
• Starting to build the circuit before planning its construction on paper with a proposed circuit sketch.
• Failing to heed signal voltage limits for the DAQ analog input channels. Be careful not to over-power
the DAQ with signal voltages exceeding its measurement limits!
• Failing to tug on each and every wire where it terminates to ensure a mechanically sound connection.
• Students working on portions of the system in isolation, not sharing with their teammates what they
did and how. It is important that the whole team learns all aspects of their system!
Building a functioning system should take no more than one full lab session (3 hours) if
all components are readily available and the team is working efficiently!
89
Lab Exercise – advanced multimeter usage
Part of this lab exercise is learning how to use an incredibly powerful feature of your digital multimeter:
its ability to capture and record minimum and maximum measurements. On Fluke-brand multimeters, this
mode is engaged by pressing a button labeled “Min/Max”. Once engaged, the meter will store in its memory
the lowest, highest, and average values of that measurement from the time the mode is engaged until the
time you read those captured values.
Some digital multimeters (DMMs) have even more advanced functionality, whereby they record multiple
data points over time, more like a data recorder. Additionally, other advanced features such as high-speed
Min/Max, high-resolution measurement, and low-pass filtering are provided by Fluke-brand multimeters.
Take the time to try all of these measurement features while using your multimeter in this lab exercise.
These functions are important when diagnosing intermittent faults in a system. The multimeter’s ability
to capture and remember measurement values over long spans of time gives the technician the flexibility to
set the multimeter as a recording device, leave to do other tasks, then return to see what the meter recorded
during that span of time.
It should be noted that your multimeter may not retain its automatic ranging capability when set to
record data. If your meter is like this and you engage this mode while the measurement value is low, the
meter may respond with an “overload” indication should the measurement value exceed the range locked
in at the time the record mode was engaged. In this case, the you are advised to manually set the meter’s
measurement range before engaging the recording mode.
It should also be noted that some DMMs provide multiple sampling times for their record function. In
other words, your meter might provide a “slow” recording mode plus a “fast” recording mode. The trade-off
for faster sampling time is – as always for DAQ hardware – less measurement resolution. In other words,
you might not be able to record data as precisely as you would like in the fast speed. Conversely, if you
desire maximum resolution, you may have to settle for a slower sampling rate.
Common mistakes:
•
•
•
•
Failing to consult the multimeter’s instruction manual.
Note: this repetition is not a typographical error. I really want you to consult the instruction manual
that came with your multimeter!
90
Lab Exercise – documenting the system
Each student must sketch their own system diagram for their team’s data acquisition system. This
will not be an ISA-standard loop diagram, but rather a combination of schematic diagram (showing the
sensor and DAQ connections) and block diagram (showing the computer Ethernet network complete with IP
addresses). Your diagram must be comprehensive and detailed, showing every wire connection, every cable,
every terminal block, range points, network addresses, etc.
An example system diagram is shown here:
Red
Red
1 kΩ
1.20 VDC
Ain1
Ain2
+
−
Ain3
RTD
Blk
R0 = 100 Ω
α = 0.00385
DAQ
Ain4
Com
USB
Blk
(Located near
JB-11)
PC
IP = 169.254.3.1
PC
IP = 169.254.5.7
Mask = 255.255.255.0
Ethernet
Mask = 255.255.255.0
Port 2
Hub
Ethernet
(Located at column 8)
Port 11
(Located in CP-3)
Power from breaker #5
When your entire team is finished drafting your individual diagrams, call the instructor to do an
inspection of the system. Here, the instructor will have students take turns going through the entire system,
with the other students checking their diagrams for errors and omissions along the way. During this time
the instructor will also inspect the quality of the installation, identifying problems such as frayed wires,
improperly crimped terminals, poor cable routing, missing labels, lack of wire duct covers, etc. The team
must correct all identified errors in order to receive credit for their system.
After successfully passing the inspection, each team member needs to place their system diagram in
the diagram holder located in the middle of the lab behind the main control panel. When it comes time to
troubleshoot another team’s system, this is where you will go to find a diagram for that system!
Common mistakes:
•
•
•
•
•
Forgetting to label all signal wires.
Forgetting to note all wire colors.
Forgetting to put your name on the diagram!
Basing your diagram off of a team-mate’s diagram, rather than closely inspecting the system for yourself.
Not placing instruments in the correct orientation (field instruments on the left, control room instruments
on the right).
91
Lab Exercise – DAQ signal scaling/linearization
Each team must configure the DAQ system to ensure it accurately measures and reports the measured
variable. The measurement accuracy will be checked by the instructor by applying random stimuli to the
sensor while the team verifies the remote indication (on a computer connected through the network to the
DAQ module).
If your system uses a loop-powered 4-20mA transmitter, the only DAQ configuration you will need
to do is “scale” the DAQ so that it converts the linear 1-5 VDC signal into a linear representation of the
measured variable. However, you will need to rely on those teammates who have taken the INST24X courses
to calibrate the transmitter so that it accurately outputs the 4-20 mA signal.
If your system reads a raw voltage signal from a resistive sensor in a bridge or other voltage-divider
network, you will need to program the DAQ software to “linearize” the signal so that it will register the
actual process variable and not just a plain signal voltage. The following screenshot shows how a computer
spreadsheet may be used to generate a linearizing equation from published sensor data:
In this particular example, the sensor is a negative temperature coefficient (NTC) thermistor, model
44004, manufactured by Omega. The formula entered into cells R4C1 through R9C1 calculates the voltage
dropped across a fixed resistor (2700 Ω) connected in series with the thermistor and powered by a 1 volt
R
). The thermistor resistance values seen
DC source, using the voltage divider equation (VR = Vsource Rtotal
in column 3 were taken from an Omega-published table for the model 44004 thermistor. A “scatter” plot
graphs temperature as a function of voltage, and a “trendline” plotted by the spreadsheet program attempts
to match the data points to a mathematical formula. In this particular case, the fitted formula happens to
be Temp = 168.2 * (Voltage) − 13.6. It is this formula you must enter into the DAQ software, so it knows
how to translate the measured voltage signal into a temperature value.
92
If the sensor you choose does not have a data table describing its characteristics, you may generate your
own by subjecting it to known stimuli and measuring its resistance at those known values. Then, you may
use a spreadsheet to plot the voltage response and derive an equation to fit the data.
Another huge advantage of using a computer spreadsheet to model the signal voltage as a function of
temperature is that it allows you to “experiment” with different values of fixed resistance, to see the effect
it has on linearity. By entering a new fixed-resistor value into the spreadsheet, you may immediately see the
effect that value change has on the curvature of the scatter plot, as well as the effect it has on the signal
voltage strength.
Common mistakes:
• Choosing a poor-accuracy calibration standard (e.g. trying to calibrate your $1500 precision Rosemount
pressure transmitter to ± 0.1 PSI using a $30 pressure gauge that only reads to the nearest 5 PSI!).
• Improperly configuring the spreadsheet scatter plot to generate a fitted equation (e.g. having variables
on wrong axes)
Characterizing your sensor and scaling the DAQ software should take no more than one
full lab session (3 hours) if the team is working efficiently!
93
Lab Exercise – Ethernet data transfer
An essential part of this lab exercise is to have the acquired data transported over an Ethernet network.
Unless the DAQ software is quite sophisticated, this feature is not likely to be directly supported. A suitable
alternative is to have one computer acquiring data from the DAQ module, and use another computer to
remotely view the display of the first computer. This remote viewing may be done using “Remote Desktop” in
Microsoft Windows operating systems, or by installing free remote-administration software such as RealVNC.
Not only will remote access allow you to view the live DAQ data from another computer over the
Ethernet network, but it also allows you do operate the DAQ computer remotely. Knowing how to use
remote-viewing software, therefore, is a very useful skill.
Another Ethernet-related objective in this lab exercise is using the ping utility to test for network
connections. When two personal computers have been successfully connected to a common Ethernet network,
you should be able to “ping” one computer from the other by invoking the ping utility with the IP address
of the destination computer as an argument to the ping command. You may run the ping command from
a command-line window on a Microsoft Windows operating system. More detailed instructions on the use
of ping may be found in your Lessons In Industrial Instrumentation textbook.
A successful “ping” from one computer to another is a necessary condition for remote viewing of that
computer’s display, but it is not a sufficient condition. That is to say, although a computer that refuses to
“ping” is definitely not ready to be logged into remotely, a computer that does “ping” without trouble may
not necessarily be ready for remote login. Getting a successful “ping” from a computer is merely the first
step in establishing full communication with it.
If a “ping” attempt proves unsuccessful, it means something is inhibiting communication between that
device and the computer you’re using to issue the ping. A good test to do in this circumstance is try
“pinging” other devices on that same network. Any successful ping attempts will definitively prove OSI
layers 1, 2, and 3 are all functional between those two points, since “ping” requires those three layers to
function. Once you know which portion(s) of the network are functional, you may narrow the field of fault
possibilities.
Network functions above OSI layer 3 (e.g. “firewall” software running on personal computers) are capable
of inhibiting communication between devices on the lab’s Ethernet network, including “ping” messages. If
you decide to connect your own personal computer (laptop) to the lab’s Ethernet network, you may find
it easier to temporarily disable all security features on your personal computer to enable free and open
communication between your computer and all other devices on the network. Just be sure to re-enable the
security features when you are done, so your computer will not be unprotected the next time you connect
to the Internet!
94
Lab Exercise – troubleshooting
The most challenging aspect of this lab exercise is troubleshooting, where you demonstrate your ability
to logically isolate a problem in the system. All troubleshooting is done on an individual basis (no team
credit!), and must be done on a system you did not help build, so that you must rely on loop diagrams to
find your way around the system instead of from your own memory of building it.
Each student is given a limited amount of time to identify both the general location and nature of the
fault, logically justifying all diagnostic steps taken. All troubleshooting activities will take place under direct
instructor supervision to ensure students are working independently and efficiently.
Failure to correctly identify both the general location and nature of the fault within the allotted time,
and/or failing to demonstrate rational diagnostic procedure to the supervising instructor will disqualify the
effort, in which case the student must re-try with a different fault. Multiple re-tries are permitted with no
reduction in grade.
A standard multimeter is the only test equipment allowed during the time limit. No diagnostic circuit
breaks are allowed except by instructor permission, and then only after correctly explaining what trouble
this could cause in a real system.
The instructor will review each troubleshooting effort after completion, highlighting good and bad points
for the purpose of learning. Troubleshooting is a skill born of practice and failure, so do not be disappointed
in yourself if you must make multiple attempts to pass! One of the important life-lessons embedded in this
activity is how to deal with failure, because it will eventually happen to you on the job! There is no dishonor
in failing to properly diagnose a fault after doing your level best. The only dishonor is in taking shortcuts
or in giving up.
Common mistakes:
• Neglecting to take measurements with your multimeter.
• Neglecting to check other measurements in the system (e.g. pressure gauge readings).
• Incorrectly interpreting the diagram (e.g. thinking you’re at the wrong place in the system when taking
measurements).
• Incorrect multimeter usage (e.g. AC rather than DC, wrong range, wrong test lead placement). This is
especially true when a student comes to lab unprepared and must borrow someone else’s meter that is
different from theirs!
Remember that the purpose of the troubleshooting exercise is to foster and assess your
ability to intelligently diagnose a complex system. Finding the fault by luck, or by trialand-error inspection, is not a successful demonstration of skill. The only thing that counts as
competence is your demonstrated ability to logically analyze and isolate the problem, correctly
explaining all your steps!
Troubleshooting takes a lot of lab time, usually at least two 3-hour lab sessions for everyone
in a full class to successfully pass. Be sure your team budgets for this amount of time as you
plan your work, and also be sure to take advantage of your freedom to observe others as they
troubleshoot, to better learn this art.
95
Lab questions
• Instrument connections
• Determine correct wire connections between a DAQ module and an electrical sensor, based on diagrams
of instruments with terminals labeled
• Correctly determine all electrical sources and loads, as well as all voltage polarities and current directions
in a DAQ/sensor circuit, based on diagrams of instruments with terminals labeled
• Commissioning and Documentation
• Explain the operating principle of the sensor used in your system
• Explain the difference between a single-ended input channel and a differential input channel on an analog
DAQ module
• Describe the use of some of the advanced functions of your multimeter besides record (“Min/Max”)
mode
• Explain why power and signal wiring should not be run together in conduit or in a panel
• Explain why it is necessary to use a bushing to protect electrical wires that enter and exit an electrical
enclosure through a hole in the side of that enclosure
• Mental math (no calculator allowed!)
• Determine allowable calibration error of instrument (e.g. +/- 0.5% for an instrument ranged 200 to 500
degrees)
%)
• Convert 1-5 V signal into a percentage of span (e.g. 3.5 V =
• Convert percentage of span into a 1-5 V signal value (e.g. 70% =
V)
• Calculate resolution of ADC given number of bits and input signal range
• Diagnostics
• Explain how to distinguish an “open” cable fault from a “shorted” cable fault using only a voltmeter
(no current or resistance measurement, but assuming you are able to break the circuit to perform the
test)
• Determine whether or not a given diagnostic test will provide useful information, given a set of symptoms
exhibited by a failed system
• Identify at least two plausible faults given the results of a diagnostic test and a set of symptoms exhibited
by a failed system
• Propose a diagnostic test for troubleshooting a failed system and then explain the meanings of two
different test results
96
Lab Exercise – decommissioning and clean-up
The final step of this lab exercise is to decommission your team’s entire system and re-stock certain
components back to their proper storage locations, the purpose of which being to prepare the lab for the
next lab exercise. Remove your system documentation (e.g. loop diagram) from the common holding area,
either discarding it or keeping it for your own records. Also, remove instrument tag labels (e.g. FT-101)
from instruments and from cables. Perform general clean-up of your lab space, disposing of all trash, placing
all tools back in their proper storage locations, sweeping up bits of wire off the floor and out of junction
boxes, etc.
Leave the following components in place, mounted on the racks:
•
•
•
•
•
•
•
Large control valves and positioners
I/P transducers
Large electric motors
Large variable-frequency drive (VFD) units
Cables inside conduit interconnecting junction boxes together
Pipe and tube fittings (do not unscrew pipe threads)
Supply air pressure regulators
Return the following components to their proper storage locations:
•
•
•
•
•
•
Sensing elements (e.g. thermocouples, pH probes, etc.)
Process transmitters
“Jumper” cables used to connect terminal blocks within a single junction box
Plastic tubing and tube fittings (disconnect compression-style tube fittings)
Power cables and extension cords
Adjustment (loading station) air pressure regulators
Finally, you shall return any control system components to their original (factory default) configurations.
This includes controller PID settings, function block programs, input signal ranges, etc.
file i00350
97
Answers
Answer 1
Answer 2
Cut the length of the new wire so it is long enough to relocate to any terminal in the strip if it later
must be moved:
Enclosure
new wire
Answer 3
Answer 4
Answer 5
The best installation is the one without a ground loop.
When choosing between the other two shield-grounding strategies, it is best to imagine an installation
where many shielded cables terminate at a single enclosure on one end, and terminate at far-flung field
locations at the other ends. What we must try to avoid here is the possibility of electric shock hazard to any
technicians working on these cables, resulting from large differences in earth ground potential at different
locations.
Answer 6
Answer 7
98
Answer 8
Here is a comprehensive list of faults, each one individually capable of accounting for the symptom (no
light) and the measurement of 24 volts between C and D:
• Lamp burned out (failed open)
• Wire failed open between A and C
• Wire failed open between B and D
Based on this short list of possible faults – assuming only one of them is actually true – the value of
each proposed test is as follows:
Diagnostic test
Measure VCF
Measure VED
Measure VAB
Measure VAD
Measure VCB
Measure VEF
Measure current through wire connecting A and C
Jumper A and C together
Jumper B and D together
Jumper A and B together
Yes
√
√
√
√
√
No
√
√
√
√
√
A good rule to apply when evaluating proposed tests is to ask the question: “Will this test give me the
exact same result no matter which one of the possible faults is true?” If so, the test is useless. If not (i.e.
the results would differ depending on which of the possible faults was true), then the test has value because
it will help narrow the field of possibilities.
Answer 9
Here is a hint:
Answer 10
Partial answer:
• NEMA 4: Intended for indoor or outdoor use, including “washdown” with a water hose.
• NEMA 6: Same as NEMA 4, but also protects against temporary submersion at a limited depth.
Answer 11
Answer 12
“Phantom” AC voltage measurements are caused by capacitive coupling between adjacent wires, which
along with the DMM’s extremely large input impedance (millions of ohms) forms a voltage divider so that
the meter will register a substantial fraction of the AC line voltage.
99
Answer 13
The grey plastic piece is a conduit bushing:
Bushings protect wires from chafing against sharp corners on the conduit connector, as the wires exit
the connector and go in different directions inside an enclosure. There are some cases where bushings may
serve double-duty as wire protectors and locknuts, but their best application is purely to cover sharp edges
and not to bear mechanical load.
Answer 14
•
•
•
•
•
•
Ease of assembly: Plastic
Resistance to corrosive gases/liquids: Plastic
Minimal material cost (assuming other factors do not take precedence): Plastic
Best shielding from electromagnetic interference: Metal
Maximum physical strength: Metal
Tightest sealing against vapor/liquid intrusion: Plastic
Answer 15
• Covers left off of many wire ducts.
• It looks like someone didn’t even attempt to put some of the wires inside wire ducts, but instead left
them draped directly over components.
• In areas where there are no wire ducts, the wires should have been “loomed” together instead of randomly
strewn.
• Junk items left on the bottom of the cabinet.
• Colored stains on the wire duct (on the left-hand side of the photograph, on the cabinet door) suggest
liquid intrusion into the cabinet, most likely from a lack of proper door-to-cabinet sealing.
Answer 16
The ground wire connection makes the metal case of the appliance electrically common with earth
ground.
100
Answer 17
Right now the circuit consists of two electrical loads and no source(s). Since both the controller (with
a 250 ohm resistor) and the transmitter require an external power supply, we must connect a DC voltage
source in series with both to provide the power necessary to generate a 4-20 mA current signal:
Honeywell model UDC2500 controller
Rosemount model 1151
loop-powered pressure transmitter
L1
Output
relay #1
Load
L2/N
H
Alarm
relay #2
Alarm
relay #1
Analog
input #2
250 Ω
Load
+
−
L
24 VDC
Source
3-valve isolation
manifold
Analog
input #1
250 Ω
Answer 18
Answer 19
Answer 20
Answer 21
Answer 22
Answer 23
Partial answer:
Unsigned:
• FFFF (hexadecimal) = 65535 (decimal)
Signed:
• FFFF (hexadecimal) = −1 (decimal)
Answer 24
Answer 25
Count = 180 (rounding low) or 181 (rounding high)
101
Answer 26
Partial answer:
DC input voltage
0.0 volts
1.0 volts
2.2 volts
3.51 volts
4.0 volts
5.0 volts
Binary count
00000000
00110011
01110000
10110011
11001100
11111111
Hex count
70
B3
CC
FF
Decimal count
51
112
179
204
Answer 27
Partial answer:
Pages 28 and 29: this card may connect to loop-powered (2-wire) 4-20 mA devices as well as self-powered
(4-wire) devices. Three connection terminals are provided per channel: a positive voltage terminal (VOUT),
an input terminal (IN), and a ground (RTN).
3106.8 counts per mA (equivalent to 0.3 microamps per count).
Answer 28
Partial answer:
The ADC circuit was designed to output a signed 16-bit integer value where 4.00 mA would be converted
into a value of 0000h and 20.00 mA would be converted into a value of FFFFh. The control instructions
running in the PLC program, meanwhile, interpreted this count value as an unsigned 16-bit binary quantity.
The problem didn’t reveal itself until the fateful day when the flow transmitter’s calibration drifted enough
to make the current signal 3.99 mA at zero flow rather than 4.00 mA at zero flow. Recognizing the way
the ADC inside the analog input card interpreted this 3.99 mA signal is the key to understanding why the
system failed.
Follow-up question: explain why it would be prudent to adjust the flow transmitter’s zero slightly higher
than 4.00 mA at zero flow to help avoid this problem in the future.
102
Answer 29
Binary
Octal
Decimal
10010
22
18
12
1011100
134
92
5C
11010
32
26
1A
110111
67
55
37
1100101
145
101
65
100100010
442
290
122
1111101000
1750
1000
3E8
11011110
336
222
DE
1011010110
1326
726
2D6
Answer 30
• 102 = 210
• 10102 = 1010
• 100112 = 1910
• 111002 = 2810
• 101112 = 2310
• 1010112 = 4310
• 111001102 = 23010
• 100011010112 = 113110
Answer 31
• 710 = 1112
• 1010 = 10102
• 1910 = 100112
• 25010 = 111110102
• 51110 = 1111111112
• 82410 = 11001110002
• 104410 = 100000101002
• 924110 = 100100000110012
103
Hexadecimal
Answer 32
There are only eight valid ciphers in the octal system (0, 1, 2, 3, 4, 5, 6, and 7), with each successive
place carrying eight times the “weight” of the place before it.
• 358 into decimal: 2910
• 1610 into octal: 208
• 1100102 into octal: 628
• 518 into binary: 1010012
Answer 33
There are sixteen valid ciphers in the hexadecimal system (0, 1, 2, 3, 4, 5, 6, 7, 8, 9, A, B, C, D, E, and
F), with each successive place carrying sixteen times the “weight” of the place before it.
• 3516 into decimal: 5310
• 3410 into hexadecimal: 2216
• 111000102 into hexadecimal: E216
• 9316 into binary: 100100112
Follow-up question: why is hexadecimal considered a “shorthand” notation for binary numbers?
Answer 34
Step
Step
Step
Step
Step
Step
Step
Step
1:
2:
3:
4:
5:
6:
7:
8:
1016
3016
2016
6016
4016
C016
8016
9016
Follow-up question: write the same sequence in decimal rather than hexadecimal:
Step
Step
Step
Step
Step
Step
Step
Step
1:
2:
3:
4:
5:
6:
7:
8:
104
Answer 35
Binary place-weights
1001.10112 = 9.687510
1
0
3
2
0
2
2
1
1
2
0
2
1
0
1
1
-1
-2
-3
2-4
2
2
2
Octal place-weights
4027.36128 = 2071.47119140610
4
3
8
0
2
2
8
1
8
7
0
8
3
6
1
2
-1
-2
-3
8-4
8
8
8
Hexadecimal place-weights
C1A6.32B916 = 49574.19813537610
C
16
3
1
A
16
2
16
1
6
3
16
0
-1
16
105
2
16
-2
B
16
-3
9
16-4
Answer 36
Binary
Octal
Decimal
101.011
5.3
5.375
5.6
11001.001
31.146
25.2
19.333
100.101
4.54
4.687
4.B
72.52
58.656
3A.A8
13.5
11.625
B.A
AC.11
111010.101
1011.101
Hexadecimal
10101100.000
254.042
172.066
1110100110.110
1646.624
934.79
3A6.CA3
110100001.111
641.7
417.875
1A1.E
101100.1
54.4
44.5
2C.8
Answer 37
• byte = 8 bits
• nybble = 4 bits
• word = depends on the system
The term “word,” is often used to represent 16 bits, but it really depends on the particular system being
spoken of. A binary “word” is more accurately defined as the default width of a binary bit grouping in a
digital system.
Follow-up question: what binary grouping corresponds to a single hexadecimal character?
Answer 38
−1.00001110000001100000000 × 2−83
+1.11010110000000000000000 × 277
+0.11111100000110001000000 × 2−126
The number 1 is represented as follows (literally, 1.0 × 2127−127 ):
Sign
0
Exponent (E)
01111111
Mantissa (m)
00000000000000000000000
106
Answer 39
Calibration table for process variable signal (ADC)
Measurement
0 GPM
100 GPM
200 GPM
Digital output
$0000
$8000
$FFFF
Calibration table for output signal (DAC)
Measurement
$0000
$2666
$3FFF
Digital output
0 PSI
9 PSI
15 PSI
Answer 40
Answer 41
Answer 42
RG = 1.724 kΩ for a gain of 30 = 29.54 dB
RG =
50000
Av − 1
Answer 43
The NI 6020E DAQ uses 12-bit (4096 count) conversion. The NI 6052E uses 16-bit (65,536 count)
conversion.
Answer 44
Answer 45
Partial answer:
This DAQ uses single-ended inputs.
107
Answer 46
Partial answer:
DAQ
±10 VDC
differential
AI0+
AI0AI1+
AI1AI2+
AI2-
Rstrain
Rstrain
AI3+
AI3-
Vexcitation +
−
AI Gnd
Shield
108
Answer 47
Partial answer:
4-20 mA looppowered transmitter
+
−
Process controller
+24 VDC
ADC
X
4-20 mA looppowered transmitter
ADC
Y
Gnd
Output
4-20
mA
Out
Gnd
4-20 mA I/P converter
DAQ analog input unit
In_2
Control valve
In_1
In_0
ADC
ADC
ADC
Com
Note that shielded cables and shield grounds are omitted from this diagram for the same of simplicity.
Answer 48
There are problems with both the PT circuit and the CT circuit, although the more severe of the two
by far is the CT circuit.
Hint: from the DAQ’s perspective, the PT acts as an AC voltage source while the CT acts as an AC
current source. The DAQ itself acts like a voltmeter, having an extremely high input impedance (in the
millions of ohms).
109
Answer 49
• The digital output (in hexadecimal) at 0.0 volts analog input = 000
• The digital output (in hexadecimal) at 5.0 volts analog input = FFF
• The digital output (in hexadecimal) at 2.1 volts analog input = 6B7 or 6B8
• The analog input corresponding to a digital output of 2D0 = 0.8791 volts
• The analog input corresponding to a digital output of F14 = 4.713 volts
Answer 50
If we need the signal voltage to increase with increasing light intensity, and we know a photocell’s
resistance decreases with increasing light intensity, we need the DAQ to sense voltage across the fixed
resistor and not across the photocell.
DAQ
±10 VDC
AI0
AI1
AI2
Photocell
AI3
AI4
AI5
Photocell
AI6
AI7
COM
+
−
COM
5 VDC
Answer 51
• The digital output (in hexadecimal) at 0.0 volts analog input = 0000
• The digital output (in hexadecimal) at 10.0 volts analog input = FFFF
• The digital output (in hexadecimal) at 3.4 volts analog input = 5709 or 570A
• The analog input corresponding to a digital output of 3D6A = 2.399 volts
• The analog input corresponding to a digital output of C005 = 7.501 volts
110
Answer 52
The problem may be summarized using just one word: loading. All voltmeters draw some current from
the signal under test, but analog-style voltmeters drew signficantly more current than their modern DMM
equivalents. This is a problem because the current drawn by a voltmeter tends to “load down” the voltage
output by the signal source, resulting in a negative error (reading less voltage than the source is actually
trying to output).
The “null-balance” technique works like this:
• Adjust the potentiometer until the sensitive galvanometer registers zero current
• Read the voltmeter’s indication – this will be precisely equal to the signal source
Galvanometers are nothing more than hyper-sensitive ammeters. When the galvanometer reads zero,
you know the potentiometer’s output voltage is precisely equal to the signal source voltage. This is why the
voltmeter’s reading in this condition is precisely equal to the signal source voltage. However, the current
required by the voltmeter to allow it to function is being supplied by the battery, not by the signal source.
This “unloads” the signal source so that it does not have to power the voltmeter.
Answer 53
Answer 54
Answer 55
Answer 56
Answer 57
Answer 58
Answer 59
Answer 60
Answer 61
Answer 62
Answer 63
111
Answer 64
The “clean” waveform, with no bit markings:
Hint: all the pulse edges representing “real” data bits are evenly spaced! All “reversal” pulse edges are
out-of-step with the regular pattern of data bit pulse edges.
112
Answer 65
(Manchester encoding)
0
1
1
1
0
1
0
0
1
(NRZ encoding)
1
0
1
0
0
0
113
1
1
0
1
(FSK encoding)
1
0
0
1
0
0
1
1
1
0
Answer 66
Answer 67
Answer 68
• Formula for cell R1C4: ROUND((R2C1 / 5) * 255)
• Formula for cell R2C4: DEC2BIN(R1C4)
• Formula for cell R3C4: DEC2HEX(R1C4)
Answer 69
In a properly operating circuit with no explosive gas present, VR3 = VR4 or VD = 2VE . I will leave it to
you to identify good diagnostic tests!
Answer 70
The ammeter shows R2 carrying all the current, therefore either R2 must be shorted or R1 must be
open.
Fault
R1 failed open
R2 failed open
R3 failed open
R1 failed shorted
R2 failed shorted
R3 failed shorted
Current source dead
Possible
√
√
114
Impossible
√
√
√
√
√
Answer 71
Input voltage
(volts)
0
2.5
5.0
7.5
10
Percent of span
(%)
0
25
50
75
100
Counts
(decimal)
0
1023 or 1024
2047 or 2048
3071 or 3072
4095
Counts
(hexadecimal)
000
3FF or 400
7FF or 800
BFF or C00
FFF
Answer 72
Input voltage
(volts)
0
2.5
5.0
7.5
10
Percent of span
(%)
0
25
50
75
100
Counts
(decimal)
0
16383 or 16384
32767 or 32768
49151 or 49152
65535
Counts
(hexadecimal)
0000
3FFF or 4000
7FFF or 8000
BFFF or C000
FFFF
Input pressure
(PSI)
0
27
46.5
66.75
71.25
Percent of span
(%)
0
36
62
89
95
Counts
(decimal)
0
5897 or 5898
10157 or 10158
14580 or 14581
15563 or 15564
Counts
(hexadecimal)
000
1709 or 170A
27AD or 27AE
38F4 or 38F5
3CCB or 3CCC
Answer 73
Answer 74
Input level
(inches)
36.5
62.0
102.5
129.5
158.0
Percent of span
(%)
11
28
55
73
92
115
Counts
(decimal)
112 or 113
286 or 287
562 or 563
746 or 747
941 or 942
Counts
(hexadecimal)
070 or 071
11E or 11F
232 or 233
2EA or 2EB
3AD or 3AE
Answer 75
Partial answer:
Input voltage
(volts)
1.6
Percent of span
(%)
32
73.8
40
Counts
(decimal)
1310 or 1311
3022
3.18
Counts
(hexadecimal)
666
A2F
Answer 76
I won’t give you all the details here, but I will get you started with a few steps:
•
•
•
•
•
•
De-activate the clock enable (CE) inputs of both shift registers.
Apply the four desired bits (logic levels) to the D0 through D3 inputs of the left-hand shift register.
Briefly activate the parallel load (PL) input of the left-hand shift register.
Activate the clock enable (CE) inputs of both shift registers simultaneously for four clock pulses.
etc.
etc. . . .
Answer 77
“UART” stands for Universal Asynchronous Receiver Transmitter, and its job is to act as an interface
between two parallel-data devices, managing communications in serial format along a communication line of
some sort.
Follow-up question: research an example of a UART IC available for purchase today.
Answer 78
This is a graded question – no answers or hints given!
116
Answer 79
(Manchester encoding)
1
1
0
1
0
1
1
1
1
(FSK encoding)
0 0
1
0
1
0
Answer 80
I’ll let you decode this message on your own!
Answer 81
This is a graded question – no answers or hints given!
Answer 82
This is a graded question – no answers or hints given!
Answer 83
This is a graded question – no answers or hints given!
Answer 84
This is a graded question – no answers or hints given!
Answer 85
This is a graded question – no answers or hints given!
Answer 86
This is a graded question – no answers or hints given!
117
1
1
0
1
Answer 87
This is a graded question – no answers or hints given!
Answer 88
This is a graded question – no answers or hints given!
Answer 89
This is a graded question – no answers or hints given!
Answer 90
This is a graded question – no answers or hints given!
Answer 91
There exist some inexpensive data acquisition modules on the market for personal computers, including
some with USB interfaces (and most with RS-232 serial interfaces). If all you have is a serial-interface module
and a USB-only computer (as most laptop computers are!), you may use a USB-to-serial adapter to connect
the serial DAQ device to the personal computer. Within Microsoft Windows, you may force the operating
system to recognize the USB adapter as an old-style COM 1 or COM 2 RS-232 serial device, at which time
the DAQ software should “talk” through the adapter to the DAQ module seamlessly.
118