1
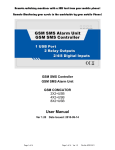
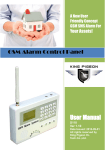
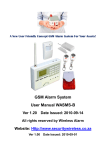
 HitecWeatherUSB User Manual http://www.hitecastro.co.uk [email protected] Congratulations on your purchase of the ‘Hitecastro’ HitecWeatherUSB. We hope your device will provide for many years of service. HitecWeatherUSB is a high quality digital cloud and temperature sensor. VERY IMPORTANT NOTE: This product is NOT designed to be water/rain proof. If the device gets wet unplug it immediately. Following an external drying with a towel, place the product in a warm dry place (e.g. airing cupboard) with the sensor pointing upwards for at least 24 hours before attempting to use it again. There are no user serviceable parts inside this device and any attempt to open the product case will invalidate the following warranty. This device may not be used in any safety critical application or where its use/malfunction or otherwise might endanger personal safety. Warranty Hitecastro warrants that this product will be free from defects for a period of 12 months following purchase. This warranty is in addition to any statutory rights which may exist in your jurisdiction. This warranty only applies to use as described in this document and also for use as a cloud/temperature sensor. No other use is recommended or supported by Hitecastro. Any user repair attempt other than described in the troubleshooting section of this document or directed by Hitecastro will invalidate your warranty. Hitecastro and its affiliates disclaim any responsibility for any consequential damage or injury which may result from use of this device except as described in this document. Should your product fail within the first year of ownership we will repair/replace the unit at no cost to you. Page 2
Cloud Sensing VERY IMPORTANT – Please read the following before using the device so that by understanding how HitecWeather USB works, you may use it to best effect and get the most accurate detection of cloud possible. HitecWeatherUSB is designed to attach to the end of any telescope and provide information on the status of the sky in front of the telescope. The sensor provides a field of view of 10 °, which is large enough to cover more than the field of view of most telescopes. The point of HitecWeatherUSB is to tell you what the sky is like WHERE YOUR TELESCOPE is looking. If you wish for a more general overview of the sky we recommend its sister product HitecWeather Deluxe. HitecWeatherUSB incorporates two sensors, a high precision Infra‐Red (IR) measuring device and a digital temperature sensor. By combining the input received from these two sensors it is possible to compute the condition of the sky in front of the IR sensor. At all times the ground radiates IR radiation (heat) upwards. Under a cloudy sky much of this radiation is reflected from the clouds back towards the ground. If the sky is clear, this radiation mostly escapes out into space. By measuring the temperature of the sky we can see how much radiation is being reflected back and by combining this with the ambient temperature, we can detect whether the sky is cloudy or not. Moreover, given that thicker cloud reflects more radiation than thinner cloud, we can even make an estimation as to how cloudy the sky is. HitecWeatherUSB produces a key figure. We call this value ‘Delta’. This is the difference between the measured temperature of the sky and the ambient temperature. A high value of ‘Delta’ indicates a clear sky. A lower value indicates a progressively cloudier picture. In order to determine the density of cloud we need to establish a set of bands which we can use to categorise the cloud level. The software included with the product contains a default set of values which we have found to work well with the type of climate typically found around the United Kingdom. However your local climate may vary significantly. If you find that the default values do not provide accurate readings you will need to determine your own values and input these settings. We will describe a process Page 3
later in this document which allows you to empirically determine these values if the defaults do not suit. Attaching the Device to your Telescope Use the strip of velcro provided to attach the unit to the front of your telescope or dewshield. It is vital that the sensors at the front of the unit are pointing along the same axis as the optical axis of your telescope. You do not need to be utterly precise with this. As long as they are lined up visually this will work just fine. Always ensure that the sensor at the front of the unit has a clear unobstructed view of the sky in front of it. Any local object which comes into the field of view will cause inaccurate readings from the sensor. The following illustrates the correct and incorrect mounting position on the dewshield of a SCT telescope. Note the incorrect position allows the dewshield to partially obstruct the field of view of the sensor. In short it you ensure that the sensors slightly protrude the front of your telescope/dewshield you have mounted the device correctly. Connecting the device The device is powered from a USB 2.0 port. It does not require external power. Connect a high quality USB cable to the USB port on the device and connect the other end to a free USB port on your computer. You may use any USB 2.0 port. No matter which version of windows you use, unit should be recognised as a ‘HID device’ without any further input from you. Connecting Your Own Motor Page 4
Installing the Application Software. Download the latest release of HitecWeather USB from the support area of our website. Double click on the file HitecWeatherUSB_Setup.exe Follow the on screen instructions. There are no user definable settings during the install process. Note: In some circumstances it may be necessary to reboot the computer following the install. Running the software Double click on the icon on your desktop or select HitecWeather USB from the start menu. The initial screen may look something like the following; Page 5
Allow approx 2 minutes for the values to stabilize before expecting accurate results. If the unit has stabilized (the graph is a flat line) and the indicated cloud state does not match the sky in front of your telescope you may need to adjust the band settings. This process is described later in the document. So let’s have a quick tour of the software highlighting some features; Note there are three tabs, Summary, Monitor and Settings. Let’s take a look at the settings tab first Note this page is broken up into four major areas, Thresholds, General Settings, Alerts and Temperature Scale. Thresholds These are the ‘Delta’ bands which are used to determine the cloudiness or otherwise of the sky. Remember our discussion earlier in this document. ‘Delta’ represents the difference between the measured sky temperature and the Page 6
ambient temperature. If this value falls between the values defined in the Threshold area then the level of cloud to the left will be indicated. E.g. in the above screen shot a measured ‘Delta’ of 4 would indicate an ‘Overcast’ sky or a value of 15 would represent ‘Some Clouds’. A delta value of 23 would indicate a clear sky and a delta value of 0 would indicate ‘Thick Cloud’. The actual descriptions (i.e. ‘Clear’, ‘Overcast’ etc.) are definable. Click into the text field above the numeric entry field and edit these if you wish. You may edit any of the numeric entry fields under thresholds. It might be a good idea to note down the current values just in case you need to revert to them. Note: Although changes to the threshold values are effective immediately, you must click ‘Save Settings’ to ensure they are saved for later sessions. General Settings Update Frequency – A value (in seconds) which determines how often the software will poll the unit for measurements Graph Range The total number of updates which will be displayed on the graph. In the above screenshot the Update frequency of 2seconds combined with the graph range of 120 will mean the graph displayes (2x120) seconds worth of data, i.e. 4minutes. You may adjust these values to your preference. Data Logging The software is capable of logging the measured data to a text file for later analysis. To enable this check the ‘Log Data To File’ checkbox. By default the file is saved in the users ‘My Documents’ folder. You can override this and choose a file location yourself by clicking the browse button and choosing another folder. You must have permission to write to the folder you choose otherwise an error will be generated. Page 7
Note also the input field ‘Only log every Nth item’. This is fairly self explanatory. A value of 5 here would ensure that only every 5th item is written to the log file. This might come in handy to prevent really large text files being generated. Alerts. This is a major feature of HitecWeatherUSB. Here you can define criteria which will cause an audio/visual alert to be displayed if the sky gets clear or cloudy or if the temperature rises or falls past a defined value. Although these are again fairly self explanatory lets highlight an example. If you checked the Alert when sky clears’ checkbox and put the value 10 in the input field ‘and remains that way for X minutes’ HitecWeather will monitor the sky until it reaches either the ‘Haze’ or the ‘Clear’ state. As long as the sky does not deteriorate past ‘Haze’ for the period specified (e.g. 10 minutes) the alarm will be sounded and a sound will be played. If the sky briefly clouded during those 10 minutes the timer is reset. The idea here is not to be sounding alerts for every crack in the cloud and annoying you un‐
necessarily. It is likely you will only be interested if the sky state is stable for the period of time you specify. Think of a sky with scattered clouds and you will quickly see why you need to specify a value for the ‘and remains that way for’ field. You can choose to alert on either the sky clearing or clouding, or both. The period you specify is applicable to both the clouding and clearing event. The clouding event is activated if the sky clouds past the ‘Haze’ state. Temperature Scale Changes between displaying values in degrees Fahrenheit (F) or Celsius (C) Remember that whichever temperature scale you choose, your threshold values must also be represented in the same scale. Page 8
Monitor Page This page provides detailed information on the current sky conditions and provides three graphical representations of the important key figures. Along the top we see the last measured values displayed for Current Sky Temperature, Current Ambient Temperature and Current Delta (Sky Clarity). The last measured sky condition is also displayed. Three graphs show the history over the measurement period (defined by Update Interval x Graph Range) Summary Page. This page provides just the details you need. The sky condition along with the most recent values for the three key figures, ambient temperature, sky temperature and delta (clarity). A graphical representation of the sky is shown at left. Page 9
The graph shown above was recorded on a night with rapidly moving passing clouds. We can see a clear spell around 21:26. The sky slowly deteriorates until 21:39 when a passing cloud is seen. Once this passes the sky clears again but slowly deteriorates again until a passing small cloud at 21:54. The sky becomes Hazy after this event. Minimising the Software We recognize that screen real estate is a valuable commodity, therefore we present two options for reducing the impact of our software on your screen. Press the
button towards the top of the screen reduces the software screen to a very small size indeed (see below). Page 10
While in this state the window remains ‘Always on Top’ preventing it being hidden by other applications. Press the button at any time to return the window to its normal maximised state. There is a second option to reduce the impact of the software on your screen. Press the as if you were closing the application. The application does not in fact close, but minimizes to the notification area in windows. Hovering the mouse over the Hitecastro icon, displays the current sky status and temperature in a text area above the icon itself To completely exit the application. Right click on the icon in the notification area and click ‘exit’. Maintaining your HitecWeatherUSB unit. There is little maintenance involved in owning a HitecWeather USB device however you must take care of just as you would with any precision digital device. In particular the IR sensor is crucial. Under no circumstances allow anything to ingress into the recess at the top of the sensor. If anything should get in there, turn the unit upside‐down and shake out the foreign body immediately. DO NOT insert anything inside to help remove a foreign body or you run the risk of scratching the delicate sensor at the bottom of this recess. Should moisture ingress here (rain for example) see the procedure for drying it on page 2 of this document. When not in use we recommend storing the unit inside a small plastic bag in a cool and dry area. Page 11
Troubleshooting Q: I cannot install the software application or ASCOM driver. A: Ensure that you have dot net framework v4 and ASCOM platform v5.5.1 (at least) installed. Q: My HitecWeatherUSB unit does not connect to my computer A: Ensure that your version of windows has all the latest updates and service packs. Please note any error message you are given and contact support ([email protected]) If the above does not solve your problem first check our support area on our website http://www.hitecastro.co.uk We will add knowledge base articles as they arise. Failing that please contact us by e‐mailing [email protected] or by contacting your retailer. Page 12
Declaration of Conformity for CE Marking. EU Declaration of Conformity This product carries the CE Mark in accordance with relevant European Union Directives. CE Marking is the responsibility of; David A. Jackson and David M. Grennan, Hitecastro, 30 Waverley Place, Worksop, Nottinghamshire, S802SX, United Kingdom. This product is designed for recreational use only and must not be used in any application where safety or personal injury may result from its failure. This product is not a toy. This product may cause unwanted interference in a domestic environment. The user may be required to take remedial measures. Disposal This product may not be disposed of along with domestic waste. To dispose of this item, take it to a local facility authorised to dispose of electrical waste covered under Electrical and Electronic Equipment (WEEE) regulations. Page 13
Links Requirements for using our software Dot Net Platform Version 4 http://www.microsoft.com/downloads/ ASCOM Platform http://www.ascom‐standards.org/ Page 14