1
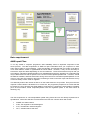
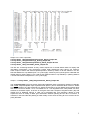
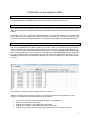
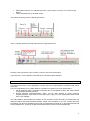
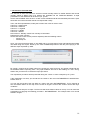
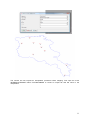
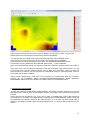
You can start by clicking on the ‘New run’ button. Enter the name you want to give to this run. Choose
the list with the stations where you want the water balance to be done. Select the starting year for the
run and give the name of the crop you want to simulate. For this exercise we will call this run
“Armenia-wheat_2009”. We’ll work with the 3 stations of the 3 provinces with 2008 as starting year and
we’ll do the simulation for wheat.
After validation, a table to fill will be presented. You will have to choose for each station in the selected
list,
- the dekad of sowing,
- the cycle length,
- the water holding capacity,
- the percentage of rainfall that will be effective for the soil-plant system,
- the pre-season coefficient that represents the amount of water lost by bare soil and weeds
before the sowing date when compared to the reference evapotranspiration,
- the irrigation application : 3 possible options : no irrigation (rainfed crops), irrigation
applications calculated by AMS for keeping the Water Satisfaction Index to 100% during all
the crop cycle or irrigation applications according to information provided as input data for the
different stations. In this last case, input data should be incoded into the AMS database using
the ‘actual 10-day data’ button and choosing the parameter ‘irrigation’.
- The bund height of the plot when irrigation consists on plot water ponding.
This table can be filled record by record. In this particular exercise, we will use the button that will set
the same value for all the column. Values for the different parameters of this table will be choosen
during the course. Note that in all the table, a cell, a line or a column may be selected as the default
one if you activate one of the 4 ‘set default’ buttons above the table. Check it.
You may then either just save this set of parameters or save and run the water balance. Select this
last option and run the water balance model. This run a water balance for all stations with actual
dekadal rainfall and actual dekadal potential evapotranspiration. This means that you must absolutely
have these two informations if you want AMS to calculate the water balance. When data are missing,
they are replaced by normal data. Check it by doing the same simulation but this time for the
campaign 2003. This will allow to simulate what happens when actual data are missing (we have no
ET0 data in 2003 for Merdzavan). What happens with the output ? Are there problems with some
stations ? Can you explain why ?
All the output files of the waterbalance calculation are available in the output directory you selected in
the running process. Go to this directory and open all the output files et check that you understand
their content.
In a first step, run the water balance calculation with no irrigation application (Option 0). During the
run, all the results are saved in different files. The definition of each output variable is given in the
AMS user manual. Take ten minutes to read it carrefuly.
You clearly see that the Water Satisfaction Index in Armenia when starting crop in the first dekad of
May fall to very bad values in some districts. This simply means that, in these areas, acceptable yields
may only be obtained with irrigation or in soil with very high water holding capacity. The second option
(Option 2) for the irrigation application may then be applied. AMS will calculate the amount of water to
apply on the field to keep the WSI to 100%. Compare the amount of ETA of the two different
simulations. Do it for the 3 stations.
Finally, use your own data of irrigation schedule according to your personal experience or the one
from your colleagues (Option 1) and apply it to the 3 stations.
Make an image of the water balance results using WATER BALANCE\MAKE IMAGE FROM
RESULTS. This option of AMS allows you to draw maps of all the outputs of the summary output file,
the most important output file that gives the essential information. In the present case, draw a map of
the ETA(total), WSI (Last index) and Water deficit at flowering stage.
Once you have calculated the waterbalance for 2004, do it for the different years you have in your
database, especially for the period where agricultural statistics are available.
16