1
Crop Information Portal Admin Manual
Release 1.0.x
GeoSolutions
January 23, 2014
CONTENTS
1
Overview
2
Administation of Crop Information Portal
2.1 The Administration Interface . . . . .
2.2 Architecture . . . . . . . . . . . . . .
2.3 User Management page . . . . . . . .
2.4 Crops and Agromet factors . . . . . . .
2.5 CSV Browser . . . . . . . . . . . . . .
2.6 NDVI Browser . . . . . . . . . . . . .
2.7 NDVI Statistics . . . . . . . . . . . . .
2.8 Flow Status . . . . . . . . . . . . . . .
2.9 Operation List . . . . . . . . . . . . .
Python Module Index
1
.
.
.
.
.
.
.
.
.
.
.
.
.
.
.
.
.
.
.
.
.
.
.
.
.
.
.
.
.
.
.
.
.
.
.
.
.
.
.
.
.
.
.
.
.
.
.
.
.
.
.
.
.
.
.
.
.
.
.
.
.
.
.
.
.
.
.
.
.
.
.
.
.
.
.
.
.
.
.
.
.
.
.
.
.
.
.
.
.
.
.
.
.
.
.
.
.
.
.
.
.
.
.
.
.
.
.
.
.
.
.
.
.
.
.
.
.
.
.
.
.
.
.
.
.
.
.
.
.
.
.
.
.
.
.
.
.
.
.
.
.
.
.
.
.
.
.
.
.
.
.
.
.
.
.
.
.
.
.
.
.
.
.
.
.
.
.
.
.
.
.
.
.
.
.
.
.
.
.
.
.
.
.
.
.
.
.
.
.
.
.
.
.
.
.
.
.
.
.
.
.
.
.
.
.
.
.
.
.
.
.
.
.
.
.
.
.
.
.
.
.
.
.
.
.
.
.
.
.
.
.
.
.
.
.
.
.
.
.
.
.
.
.
.
.
.
.
.
.
.
.
.
.
.
.
.
.
.
.
.
.
.
.
.
.
.
.
.
.
.
.
.
.
.
.
.
.
.
.
.
.
.
.
.
.
.
.
.
.
.
.
.
.
.
.
.
.
3
3
4
8
13
21
27
30
33
34
37
i
ii
CHAPTER
ONE
OVERVIEW
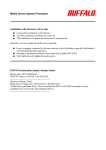
Crop Information Portal is a web portal with reliable data and information on historical and current crop data
anda agro-metereological condition in Pakistan. It allows users to extract statistics and detect conditions affecting
production of major Rabi and Kharif crops.
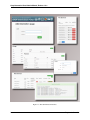
This document is an extension for the system administrators to explain how to use the Crop Information Portal’s
admin interface. If you need want to learn something about the user interface, please, use the User Manual instead
this document.
1
Crop Information Portal Admin Manual, Release 1.0.x
Figure 1.1: The administration interface.
2
Chapter 1. Overview
CHAPTER
TWO
ADMINISTATION OF CROP
INFORMATION PORTAL
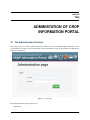
2.1 The Administration Interface
The portal provides a lot of data to facilitate the analysis of the state of the crops in Pakistan.These data must be continuously updated, and, where possible, automatically. To allow mantainence operations, the portal has an administration
interface for admin users:
Figure 2.1: Login Page.
The default credentials for this application are
• user:admin
3
Crop Information Portal Admin Manual, Release 1.0.x
• password:admin
Note: Only the users with the ADMIN role can access to the administration interface.
Once you login you will be automatically redirected to the Users List.
Figure 2.2: The page on first access.
Below the banner, the Navigation bar provides links to the available sections of the administration interface. The
available links are:
• Crops : allows to create/edit/delete the crops available in the portal.
• Agromet Factors : allows to create/edit/delete the factors available in the portal.
• NDVI Statistics : allows to generate statistics for the NDVI from the raster data published on the portal.
• Users : Allow to add/edit/delete users. is the default landing page after login.
• File Browser NDVI : allows you to upload images of NDVI and publishing it on the portal.
• File Browser CSV : allows you to upload CSV files and use them to update the database of crop data, agrometeorological conditions and thresholds. Allow also to download CSV files generated by the statistics module.
• Operations List : A list of available operations for this installation of the administration interface.
• Check Flow Status : Allow to monitor the status of the execution of process launched in geobatch.
• Help : a dummy link for help. Can be customized.
• Logout : logout from the administration interface.
To better understand what these sections does, you should do a deeper look to the global architecture.
2.2 Architecture
The portal is composed of several web applications that interact with each other. Some of them are used directly by
the users (MapStore, Administration Interface).
2.2.1 Components
The following are the components of the architecture of the Crop Information Portal.
4
Chapter 2. Administation of Crop Information Portal
Crop Information Portal Admin Manual, Release 1.0.x
• MapStore: The main front-end to generate charts, maps and reports inferring agro-metereological data. Interacts with GeoServer to allow this kind of processing.
• Administration Interface: The administrator front-end to update published data and generate statistics from
raster images interacting with GeoBatch. Provides also user management functionalities.
• GeoStore: a non-sql REST access database used to store users data and to log their operations.
• GeoServer is an open source software server that allows users to share and edit geospatial data. Designed for
interoperability, it publishes data from any major spatial data source using open standards.
• GeoBatch is an Open Source application for the collection, processing and publication of geospatial data in real
time.
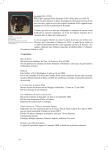
2.2.2 General Architecture
Figure 2.3: Architecture of Crop Information Portal.
The administrator interface interacts directly with the file system, with the database and with GeoBatch. Allows to
upload and download files and launch some GeoBatch flows on them. Provides also a direct interaction with the
database to customize the agrometeorological factors and crops to show inside MapStore.
GeoBatch runs flows using files from the filesystem. Depending on the type of flow geobatch interacts with the other
components (publish data in geoserver, update database, create csv files...).
MapStore uses the capabilities of GeoServer to show aggregated data and maps. The filtering and aggregation functionalities are implemented as parametric views on GeoServer. All the parametric views in GeoServer are optimized
to aggregate and filter the data in the fastest way. MapStore requires the proper output format to geoserver in order to
show tabular data, maps, charts or download CSV files.
GeoStore is used to manage user data that are not directly connected with the model.
2.2. Architecture
5
Crop Information Portal Admin Manual, Release 1.0.x
There are other small web applications non present in the schema:
• highcharts-export: An application that allows to rasterize charts in various formats (pdf, svg, png, jpeg).
• http_proxy : A secure proxy that can allow MapStore to get maps from other qualified WMS sources.
• xmlJsonTranslate : a container of services required by MapStore grouped in a separated application.
A more detailed description about the model is available here:
Model
The NRL database contains the main model
Name
agromet
agrometdescriptor
cropdata
cropdescriptor
cropstatus
district_boundary
district_crop
Description
data about agrometeorological factors
information about specific factors
data about crops (area,production,yield)
information about specific crop
thresholds for factor values related to a specific period of the year and crop
districts in Pakistan
districts in Pakistan with some differences in districts that matches with provided data about
crops.
national boundary Pakistan.
national_boundary
province_boundary provinces in Pakistan
province_crop
provinces in Pakistan to generate crop maps.
List of relations
cropdescriptor Contains informations about specific crops.
schema
Column
id
label
seasons
Description
the identifier for the crop
the label to display for this crop
the season(s) of this crop
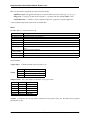
Sample Content here some sample rows from the cropdescriptor table
id
rice
cotton
maize
fodder
wheat
sugarcane
label
Rice
Cotton
Maize
Fodder
Wheat
Sugarcane
seasons
KHARIF
KHARIF
KHARIF
RABI,KHARIF
RABI
KHARIF
cropdata Contains the data about production, cultivated area and yield of every year. This table can be populated
ingesting the csv files.
6
Chapter 2. Administation of Crop Information Portal
Crop Information Portal Admin Manual, Release 1.0.x
Sample Content here some sample rows from the cropdata table
crop
rice
rice
rice
rice
district
Bahawalnagar
Bahawalpur
Bhakkar
Chiniot
province
PUNJAB
PUNJAB
PUNJAB
PUNJAB
year
2010
2010
2010
2010
years
2010-11
2010-11
2010-11
2010-11
area
63.13
6.07
1.21
32.37
production
127.35
10.34
1.83
63.55
yield
2017
1703
1512
1963
The crop column have to be the same of the id in cropdescriptor table. district and province columns must match
with district and province fields in the district_crop and province_crop tables. Yield column is redoundant for
compatibility reasons. the yield is calculated at runtime getting values from area and production fields.
Note: Unit of measure are not uniform to mantain the original format of the CSV files.
• production is expressed in thousands of tons for all crops except cotton which is expressed in thousands of
bales.
• area is always expressed in thousands of hectares (ha)
• yield is always expressed in kg/ha.
agrometdescriptor The agrometdescriptor is a table that contains the list of the available factors.
schema
Column
factor
label
aggregation
unit
Description
this is the string that identify the factor.
this is the label that represents the factor in the application
this is the kind of aggregation method to apply. can be avg (average) or sum.
the unit of measure for the factor
Sample Content here some sample rows from the agrometdescriptor table
factor
Tmax_avg
NDVI_avg
ppt_sum_mm
Daylen_avg
Tmin_avg
label
Max Temperature
NDVI
Precipitation
Day length
Min Temperature
aggregation
avg
avg
avg
avg
avg
unit
°C
mm
hr
°C
agromet Contains agro-metereological data for each district of Pakistan for each :term:dekad.
Column
district
province
year
month
dec
factor
value
s_yr
s_dec
Description
the district for this value
the province for this value
the year for this value
the month for this value
the dekad for this value
the factor for this value
the factor for this value
the year of the start of the Rabi Season
the dekad starting from the start of the Rabi Season
2.2. Architecture
7
Crop Information Portal Admin Manual, Release 1.0.x
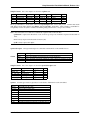
Sample Content here some sample rows from the agromet table
district
Malakand
Mansehra
Mardan
Nowshera
Peshawar
Shangla
Swabi
Swat
Tank
province
KPK
KPK
KPK
KPK
KPK
KPK
KPK
KPK
KPK
year
2012
2012
2012
2012
2012
2012
2012
2012
2012
month
Oct
Oct
Oct
Oct
Oct
Oct
Oct
Oct
Oct
dec
2
2
2
2
2
2
2
2
2
factor
Tmin_avg
Tmin_avg
Tmin_avg
Tmin_avg
Tmin_avg
Tmin_avg
Tmin_avg
Tmin_avg
Tmin_avg
value
10.9563
10.999
11.3221
11.3808
9.0622
11.4006
12.7756
10.5381
16.1516
s_yr
2012
2012
2012
2012
2012
2012
2012
2012
2012
s_dec
35
35
35
35
35
35
35
35
35
Note:
• The factor column have to be the same of the id in agrometdescriptor table.
• district and province columns must match with district and province columns in the district_boundary and
province_boundary tables.
• s_dec and s_yr are redoundant field used to simplify queries to the database and make them faster.
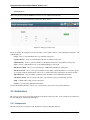
2.3 User Management page
This section illustrates how manage users from the User management page.
By clicking on the section Users the administrators of the system can access to the User management page
Figure 2.4: Access to User Management page.
Figure 2.5: User Manage page.
From this page you can see the list of users and their ROLE. The users with ROLE ADMIN can access to the
administration interface. The users with ROLE USER are only allowed to use Data output type in the tools in
mapstore (See tabular data and download aggregated data in CSV format).
8
Chapter 2. Administation of Crop Information Portal
Crop Information Portal Admin Manual, Release 1.0.x
By clicking on Create User button you can create new users. From the form shown below you must insert an User
Name, its ROLE (USER or ADMIN) and a password for the created user.
Figure 2.6: Create User button.
2.3. User Management page
9
Crop Information Portal Admin Manual, Release 1.0.x
By clicking on Create button you submit the creation of new user. If ok an alert like shown below appears.
Figure 2.7: Create User form.
Figure 2.8: Success User creation alert.
10
Chapter 2. Administation of Crop Information Portal
Crop Information Portal Admin Manual, Release 1.0.x
Now the list of users shows the new user
Figure 2.9: User added.
2.3. User Management page
11
Crop Information Portal Admin Manual, Release 1.0.x
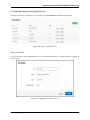
You can also edit or delete the users as shown by the forms below. From the Edit User form you can only change the
ROLE and the password of the user.
Figure 2.10: User edit.
12
Chapter 2. Administation of Crop Information Portal
Crop Information Portal Admin Manual, Release 1.0.x
You can remove the user clicking on the Delete button.
Figure 2.11: User delete.
A popup will appear to confirm the operation.
2.4 Crops and Agromet factors
2.4.1 Manage Crops
To manage Crops you must click on the Crops link in the navigation bar:
Figure 2.12: The list of available crops
2.4. Crops and Agromet factors
13
Crop Information Portal Admin Manual, Release 1.0.x
Create a new Crop
To create a new crop, click on the Create button. A form with the information to set will be displayed. complete the
form as follows:
Figure 2.13: Sample Soybean crop
The new crop will be shown in the Crops list.
Figure 2.14: The new crop is added to the list
Anyway the new crop will not be available in MapStore until some data about the crop is ingested.
How to allow map generation for new Crops
To generate maps you must add 6 new styles to geoserver with a specific name:
14
Chapter 2. Administation of Crop Information Portal
Crop Information Portal Admin Manual, Release 1.0.x
<province|district>_<crop_id_lower_case>_<area|prod|yield>_style
In the case above the styles to add will have the following names:
• province_soybean_area_style
• province_soybean_prod_style
• province_soybean_yield_style
• district_soybean_area_style
• district_soybean_prod_style
• district_soybean_yield_style
Note: This styles are needed to generate maps in the Crop Data module of MapStore.
• Area Type: National(Province)
– province_soybean_area_style.xml: style to generate maps for area.
– province_soybean_prod_style.xml: style to generate maps for production.
– province_soybean_yield_style.xml: style to generate maps for yield.
• Area Type: National(District) or Province(District)
– district_soybean_area_style.xml: style to generate maps for area .
– district_soybean_prod_style.xml: style to generate maps for production.
– district_soybean_yield_style.xml: style to generate maps for yield.
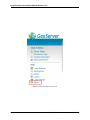
Add a SLD style You can access to the style layer descriptor (SLD) definition page on GeoServer selecting Styles
module on GeoServer:
2.4. Crops and Agromet factors
15
Crop Information Portal Admin Manual, Release 1.0.x
Figure 2.15: Styles module on GeoServer
16
Chapter 2. Administation of Crop Information Portal
Crop Information Portal Admin Manual, Release 1.0.x
and press on add a new style
Figure 2.16: Add a new style button
Now, you have to fill the form with the new name,
for this exercise you can copy a style from the existing ones. :
Figure 2.17: Copy province_cotton_area_style
change the style with the new name and modify filters as you want:
copy from one of the present one:
Figure 2.18: Edit the style
2.4. Crops and Agromet factors
17
Crop Information Portal Admin Manual, Release 1.0.x
validate and submit the new style:
Figure 2.19: Styles submit
Edit/Delete Crops
You can edit/delete the crops clicking on the Edit and Delete buttons on the right of each row.
18
Chapter 2. Administation of Crop Information Portal
Crop Information Portal Admin Manual, Release 1.0.x
2.4.2 Manage Agrometeorological Factors
To manage Agrometeorological Factors you can click on the Agromet Factors link in the navigation bar.
Figure 2.20: The list of available factors
Create a new Factor
To create a new factor, click on the Create button. A form with the information to set will be displayed. complete the
form as follows:
Figure 2.21: Sample Evapotranspiration factor
2.4. Crops and Agromet factors
19
Crop Information Portal Admin Manual, Release 1.0.x
The new factor will be shown in the Crops list.
Figure 2.22: The new factor is added to the list
Anyway the new factor will not be available in MapStore until some data about the factor is ingested.
Edit/Delete Factors
You can edit/delete the factor clicking on the Edit and Delete buttons on the right of each row.
20
Chapter 2. Administation of Crop Information Portal
Crop Information Portal Admin Manual, Release 1.0.x
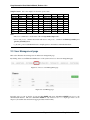
2.5 CSV Browser
This section explain how to use CSV Browser to allow:
• Create
• Update
• Delete
records on agromet, crop data and crop status tables. This allows to publish dekadal values for Agromet module, yearly
values for Crop Data module and thresholds to use in the Crop Status module.
To access to this module you need to click on the navigation bar button ‘File Browser CSV’
Figure 2.23: CSV Browser on navigation bar.
Now you can upload your files to launch the ingestion. The file operation and the target table depends on the CSV
files you upload.
2.5.1 Known CSV formats
The target table depends on header row of the CSV file to be ingested and can be:
• Agromet
• Crop data
• Crop status
Agromet
The header for an agromet operation must be:
*,distr,prov,year,mon,dec,factor,*
and the values must be correct values for the database. For example:
rowId,distr,prov,year,mon,dec,factor,NDVI_avg
,Bolan,BALOCHISTAN,2013,Jan,1,fake_arg,100
2,Bolan,BALOCHISTAN,2013,Feb,1,fake_arg,200
2.5. CSV Browser
21
Crop Information Portal Admin Manual, Release 1.0.x
Note: The value element is the measured value in that region during the period of time indicated expressed in the
unit of measurement provided in the agromet_descriptor
The first column is ignored, the columns ‘distr’, ‘prov’, ‘year’, ‘mon’, ‘dec’ and ‘factor’ are the composed primary
key of the database and the last column is the value of the agromet factor.
Crop Data
The header for a crop data operation must be:
*,crop,distr,prov,year,years,area,prod,yield
and the values must be correct values for the database. For example:
id,crop,distr,prov,year,years,area,prod,yield
dummy,rice,fake_dist,fake_prov,2000,2000-2005,1,1,1
Note:
• area: planted area for that region during the year and for the commodity indicated
• prod: production for that region during the year and for the commodity indicated
• yield: yield of the crop for that region during the year
The first column is ignored and the other columns are the cropdata table columns. The primary key is composed by
columns: ‘crop’, ‘district’, ‘province’ and ‘year’.
Crop status
The header for a crop status operation must be:
*,factor,crop,month,dec,max,min,opt,
and the values must be correct values for the database. For example:
rowid,factor,crop,month,dec,max,min,opt,
1,"Tmax_avg","fake_crop_2","Apr",1,16,42,15,20
1,"Tmax_avg","fake_crop_2","May",1,16,42,15,20
Note:
• max: the maximum value to show in Crop Status module for the dekad and the crop
• min: the minimum value to show in Crop Status module for the dekad and the crop
• opt: optimal value (dashed in Crop Status charts)
The first column is ignored and the other columns are the cropdata table columns. The primary key of this table is
composed by: ‘crop’, ‘month’, ‘factor’ and ‘dec’ columns.
22
Chapter 2. Administation of Crop Information Portal
Crop Information Portal Admin Manual, Release 1.0.x
2.5.2 Operations
To apply changes to the data (insert, update, delete) you have do run the CSV operation to a csv file :
1). Upload the file: Select a file from your file system and click on Upload
Figure 2.24: Upload a file.
2.5. CSV Browser
23
Crop Information Portal Admin Manual, Release 1.0.x
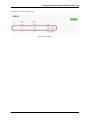
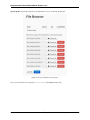
2). Execute the ingestion: Click on CSV button.
Figure 2.25: CSV button.
3). Update the file browser status: If you want, you can see the ingestion status, but if the file is big, you won’t be
able to view the resume before the ingestion will be finished. In this case, you will be able to update the file browser
status and wait for a ‘SUCCESS‘ or ‘FAIL‘ message on the file.
Figure 2.26: Update button.
24
Chapter 2. Administation of Crop Information Portal
Crop Information Portal Admin Manual, Release 1.0.x
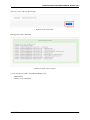
4). See the log: Click on ‘SUCCESS‘ or ‘FAIL‘ message on the file
Figure 2.27: SUCCESS button.
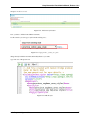
and on ‘Get status‘ button on the next page.
Figure 2.28: Get status button.
Then the log of the execution will be shown in the page. If the message is ‘SUCCESS‘ should appear a resume with
the status of the CSV ingestion:
***************************************************
********** SUCCESS: CSV ingestion resume **********
***************************************************
* Records inserted: 1
* Records updated: 0
* Records removed: 0
* Failed records: 0
***************************************************
We have attached examples for each operation and for each table.
2.5. CSV Browser
25
Crop Information Portal Admin Manual, Release 1.0.x
Create
You need to create a CSV file with the new entry inside.
Examples:
• Agromet insert
• Crop data insert
• Crop status insert
Update
You need to create a CSV file with the primary key of the row to be updated and change the value to be updated.
Examples:
• Agromet update
• Crop data update
• Crop status update
Delete
You need to create a CSV file with the primary key of the row to be deleted and leave all the other columns empty.
Examples:
• Agromet delete
• Crop data delete
• Crop status delete
26
Chapter 2. Administation of Crop Information Portal
Crop Information Portal Admin Manual, Release 1.0.x
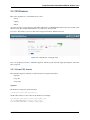
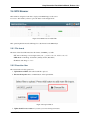
2.6 NDVI Browser
This module is designed to learn how to deploy new NDVI images on the server.
To access to this module you have to press the button on the navigation bar:
Figure 2.29: NDVI browser module link.
This operation publish a new Geotiff image for a date interval on the NDVI layer.
2.6.1 File format
The name of the Geotiff file must have this format: dvYYMMD_*.tif with:
• YY: Year of the image: two last digits of the year. e.g.1998 becomes 98; 2000 becomes 00.
• MM: Month of the image: between 01 (January) and 12 (December)
• D: Dekad of the image: 1, 2 or 3
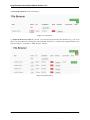
2.6.2 Execution flow
The execution flow for this operation is:
1. Upload the new NDVI: Select the Geotiff file to upload.
2. Execute the ingestion: Press on NDVI button on the uploaded file.
Figure 2.30: Upload button.
3. Update the file browser status: If you want, you can see the ingestion status,
2.6. NDVI Browser
27
Crop Information Portal Admin Manual, Release 1.0.x
Figure 2.31: Get status after execution.
Note: If the file is too big, you will not be able to resume the status of the ingestion flow until the ingestion is finished.
In this case, you will have to update the file browser status and wait for a ‘SUCCESS‘ or ‘FAIL‘ message about the
ingested file.
Figure 2.32: Update button.
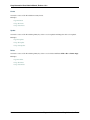
4. See the log: Click on ‘SUCCESS‘ or ‘FAIL‘ message on the file
Figure 2.33: SUCCESS button.
28
Chapter 2. Administation of Crop Information Portal
Crop Information Portal Admin Manual, Release 1.0.x
and on ‘Get status‘ button on the next page.
Figure 2.34: Get status button.
If the ingestion status is SUCCESS,
Figure 2.35: Status of the execution.
you can view the new granule on the different NDVI selectors:
• NDVI statistics
• NDVI tool (see user manual).
2.6. NDVI Browser
29
Crop Information Portal Admin Manual, Release 1.0.x
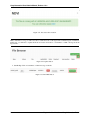
2.7 NDVI Statistics
This browser module allow you to generate a CSV with NDVI statistics.
To access it you have to press the button on the navigation bar:
Figure 2.36: NDVI statistics module link.
Now you must complete the form:
Region: indicates if the statistics will be generated for each province or for each district. The default selection is
district boundary
Figure 2.37: Regions selector
Mask: select a mask to be applied on the NDVI statistics generation. You can select the default Crop Mask (default),
disable it or a Custom crop mask.
Figure 2.38: Masks selection.
30
Chapter 2. Administation of Crop Information Portal
Crop Information Portal Admin Manual, Release 1.0.x
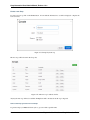
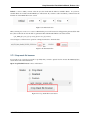
Dekad: to select a dekad you must select the year, the month and the dekad of available dekads. As you know,
avilable dekads are loaded from the NDVI layer on GeoServer. If you want to add a new dekad, you must follow the
instructions of the NDVI file browser section.
Figure 2.39: Dekad selection.
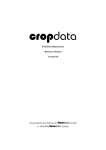
Then you must press on Generate statistics. When the the process will succeed, it will appear the generated CSV with
the syntax on the CSV browser module on generated folder with the name linked to the selected form:
• pak_NDVI_${region}_${crop mask}_${start date}_${end date}
You can ingest as a CSV browser operation or simply download it to check the data.
Figure 2.40: Generated CSV.
2.7.1 Crop mask file browser
If you want to use a custom crop mask, it’s probably that you need to upload it before execute the NDVI statistics
action. Please follow this instructions:
Open ‘Crop Mask file browser’: Press on this button
Figure 2.41: Crop mask file browser button.
2.7. NDVI Statistics
31
Crop Information Portal Admin Manual, Release 1.0.x
Upload shp files: Upload the shape file and it dependencies one by one with the file uploader.
Figure 2.42: Crop mask file browser upload.
Now you can select the new crop mask as custom mask on the NDVI statistics form.
32
Chapter 2. Administation of Crop Information Portal
Crop Information Portal Admin Manual, Release 1.0.x
2.8 Flow Status
When you execute CSV ingestion, NDVI publishing or statistics generation, you start a flow execution on GeoBatch.
Wile running, an identifier will be associated to that flow execution. We call this identifier the Consumer ID
Figure 2.43: CSV execution. the Consumer ID is: 76c4bc6a-8906-4575-84c7-366ef5c70666
Clicking on the link (here), you will be redirected to the Flow Status page. You can see the Consumer ID in the textbox
and the Get Status button.
Figure 2.44: Get status button.
Clicking on the ‘Get status‘ button you will see the current log for the flow execution you started:
Figure 2.45: Message log.
The id of the flow is volatile. It means that if you switch the page after the execution, you must save the id if you want
to access again to the log page for that flow execution.
2.8. Flow Status
33
Crop Information Portal Admin Manual, Release 1.0.x
Note: In the file browsers (CSV or NDVI), when you launch an operation for a file (e.g. CSV ingestion, NDVI
publish), the application will save the last execution of a process for that file ( last execution and Status columns).
Than you can resume the log clicking on the status button. For more complex operations like NDVI Statistics you
have to save the Consumer ID manually to recover the status of the process. Anyway, the full log for the operations
execution is not stored forever.
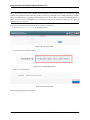
If you have saved a Consumer ID and you want to see the log, you have to
1. press on Check Flow Status on the navigation bar,
Figure 2.46: Get status module.
2. paste the Consumer ID in the textbox
Figure 2.47: Consumer ID parameter.
3. Press on Get Status button.
Figure 2.48: Get status button.
The log will appear again on your browser.
34
Chapter 2. Administation of Crop Information Portal
Crop Information Portal Admin Manual, Release 1.0.x
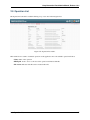
2.9 Operation List
The Operation List module is available clicking on Operation List in the navigation bar.
Figure 2.49: Operation list module.
This module show a resume of available operations on the application. For each available operation will show:
• Name: Name of the operation
• REST path: Used to access to the view of the operation and interact with this.
• File Action: Indicates if the file can be executed with a file.
2.9. Operation List
35
Crop Information Portal Admin Manual, Release 1.0.x
36
Chapter 2. Administation of Crop Information Portal
PYTHON MODULE INDEX
c
cippak.admin, 1
cippak.admin.arch, 4
cippak.admin.arch.model, 6
cippak.admin.crop_agro, 13
cippak.admin.csv, 20
cippak.admin.intro, 3
cippak.admin.misc, 32
cippak.admin.ndvi, 26
cippak.admin.stats, 29
cippak.admin.use_man, 8
cippak.overview, 1
37