1
BMC Bioinformatics 2007, 8:288
http://www.biomedcentral.com/1471-2105/8/288
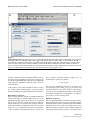
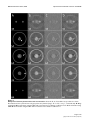
Figure 2 between phantom data and reconstruction
Comparison
Comparison between phantom data and reconstruction. Slices 44, 54, 64, 74, and 84 of every volume are shown.
Reconstructions were performed on noisy projections of a phantom (range: -50° to +50°, every 1°, vertical tilt axis). A: Original phantom. B: Reconstruction using the ART with 10 iterations and a relaxation coefficient of 0.01. C: Reconstruction using
WBP. D: Reconstruction using the SIRT with 10 iterations and a relaxation coefficient of 1.
Page 7 of 9
(page number not for citation purposes)