1
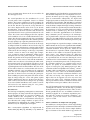
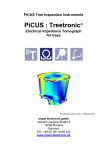
BMC Bioinformatics
BioMed Central
Open Access
Software
TomoJ: tomography software for three-dimensional reconstruction
in transmission electron microscopy
Cédric MessaoudiI1,2, Thomas Boudier1,2, Carlos Oscar Sanchez Sorzano3 and
Sergio Marco*1,2
Address: 1Institut Curie. Section Recherche. Laboratoire d'Imagerie Intégrative. Centre Universitaire d'Orsay, 91405 Orsay CEDEX, France,
2INSERM U 759. Centre Universitaire d'Orsay. Bât 112. 91405 Orsay CEDEX, France and 3Bioengineering Lab, Escuela Politécnica Superior. Univ.
San Pablo – CEU. Campus Urb. Montepríncipe s/n. 28668. Boadilla del Monte, Madrid, Spain
Email: Cédric MessaoudiI - [email protected]; Thomas Boudier - [email protected]; Carlos Oscar
Sanchez Sorzano - [email protected]; Sergio Marco* - [email protected]
* Corresponding author
Published: 6 August 2007
BMC Bioinformatics 2007, 8:288
doi:10.1186/1471-2105-8-288
Received: 13 February 2007
Accepted: 6 August 2007
This article is available from: http://www.biomedcentral.com/1471-2105/8/288
© 2007 MessaoudiI et al; licensee BioMed Central Ltd.
This is an Open Access article distributed under the terms of the Creative Commons Attribution License (http://creativecommons.org/licenses/by/2.0),
which permits unrestricted use, distribution, and reproduction in any medium, provided the original work is properly cited.
Abstract
Background: Transmission electron tomography is an increasingly common three-dimensional
electron microscopy approach that can provide new insights into the structure of subcellular
components. Transmission electron tomography fills the gap between high resolution structural
methods (X-ray diffraction or nuclear magnetic resonance) and optical microscopy. We developed
new software for transmission electron tomography, TomoJ. TomoJ is a plug-in for the now
standard image analysis and processing software for optical microscopy, ImageJ.
Results: TomoJ provides a user-friendly interface for alignment, reconstruction, and combination
of multiple tomographic volumes and includes the most recent algorithms for volume
reconstructions used in three-dimensional electron microscopy (the algebraic reconstruction
technique and simultaneous iterative reconstruction technique) as well as the commonly used
approach of weighted back-projection.
Conclusion: The software presented in this work is specifically designed for electron tomography.
It has been written in Java as a plug-in for ImageJ and is distributed as freeware.
Background
Elucidation of the three-dimensional (3D) arrangement
of subcellular components facilitates understanding of
their structure-function relationships and as such is one of
the greatest assets of modern biology. With the newest
electron microscopes and well-established techniques for
sample preparation [1-3], it is increasingly possible to
achieve 3D-visualization of subcellular structures in their
near-native state at a nanometer resolution [4].
Most 3D-TEM techniques, such as single particle analysis
[5] and methods for reconstruction of periodic structures
[6] require structurally homogeneous or periodic objects.
However, identical molecular conformations are not guaranteed due to the intrinsic and extrinsic variability of biological objects. In addition, although the sizes of
crystallized objects are increasing, a large number of macromolecular complexes remain inaccessible to crystallization. Transmission electron tomography (ET) circumvents
these limitations, enabling the 3D reconstruction of
objects with unique topologies, including most cellular
Page 1 of 9
(page number not for citation purposes)
BMC Bioinformatics 2007, 8:288
organelles. In addition, ET offers a resolution between
that of optical microscopy and that of single particle or
periodic structures reconstruction methods [7]. This enables correlative microscopy approaches [8] that combine
information from the level of atoms to the level of cells
[9].
http://www.biomedcentral.com/1471-2105/8/288
such, it leverages the extensive capabilities of this freeware
for image analysis, such as filters, denoising, and visualization. TomoJ is freely downloadable [49] and has been
successfully applied to a variety of biological data sets
[34,35].
Implementation
Computing a volume (tomogram) by ET requires four
main steps: acquisition of a series of projections at different tilt angles (tilt series), image alignment, reconstruction, and visualization. The acquisition of tilt series can be
performed using different geometries: single-axis [10],
dual-axis [11,12], multiple-axis [13], or conical [14,15].
One of the major inconveniences during the acquisition
process is specimen shift due to instrumental limitations
such as thermal or mechanical instability. These shifts
require alignment of the tilt series before reconstruction.
Shift correction is accomplished with two types of algorithms, automatic and semiautomatic. Automatic alignment is performed by cross-correlation [16,17], and semiautomatic alignment is performed using fiducial markers
[18]. Fiducial markers (frequently gold particles) can also
be used to determine the tilt-axis direction around which
the tilt series is rotated. Knowledge of the tilt-axis is strictly
required for reconstruction. The tomogram is commonly
reconstructed using weighted back-projection (WBP)
[19], although other algorithms such as the algebraic
reconstruction technique (ART) [20] and simultaneous
iterative reconstruction technique (SIRT) [21,22] can be
used for tomographic reconstruction. Visualization of the
computed tomogram is difficult due to the complexity of
the data, which necessitates subjective manual segmentation. In order to develop a more objective semiautomatic
or automatic segmentation, efforts are underway to
denoise data, mostly by application of anisotropic diffusion algorithms [23].
Tomographic reconstructions can be performed using
software dedicated for single-particle analysis (such as
Spider [24], Imagic [25], Xmipp [26], or EMAN [27]).
However, the development of ET [7,28] has been facilitated by freeware specifically designed for ET (first IMOD
[18], then TOM [29], EM3D [30], and UCSF tomography
[31]. The major limitation of these freeware is that they
lack the most powerful reconstruction algorithms, such as
ART or SIRT, which are used for reconstruction in singleparticle analysis. Here, we present new software for electron tomography, TomoJ, which was developed with the
specific intent of offering both an extremely simple interface and a powerful range of algorithms, including automatic and semiautomatic alignment, statistical
determination of the tilt axis, and ART and SIRT, as well as
the classic WBP, for reconstruction. TomoJ was developed
as a Java plug-in for ImageJ [32,33], one of the most frequently used software programs for image analysis. As
TomoJ was implemented as a plug-in for ImageJ software
[32]. ImageJ is a well known Java software program developed by the National Institutes of Health; it offers a large
number of image analysis capabilities including analysis
of electrophoretic bands and multicolor combination of
images from confocal microscopy. TomoJ offers the same
advantages as ImageJ regarding image analysis, with the
addition of easy installation, portability (as a Java-based
program, it runs on all operating systems), and simplicity
at the user-interface level (Figure 1). In addition, TomoJ
can read and write all file formats available in ImageJ as
well as the standard electron microscopy image formats
MRC [6] and SPIDER [24].
As a plug-in for ImageJ, TomoJ requires this software to be
installed from the web [33]. The main limitation of
ImageJ, as with any other Java software, is the RAM memory management. ET requires high memory usage, which
is limited with 32-bit JAVA processors. Working with large
data sets requires 64-bit processors and at least 4 Gigabytes of RAM memory (the procedure for large memory
allocation is described in the ImageJ documentation).
Once ImageJ installation is complete, it is simply necessary to copy the distribution file (TomoJ_.jar; downloadable[49] ) to the ImageJ plug-in directory. At this point, for
each new execution of ImageJ, a submenu "TomoJ",
including two main options, will be available in the plugin menu. The first option, "TomoJ interface", is used to
launch the interface for reconstruction of single-axis tilt
series. The second option, "TomoJ average", enables combination of multiple volumes for multiple-axis tomography [13]. TomoJ can also be run from the command line.
TomoJ workflow
Computation of a single-axis tomogram in TomoJ
requires: 1) tilt-angle assignment, 2) tilt-series normalization, 3) tilt-series alignment, 4) tilt-axis determination,
and 5) volume reconstruction. All these steps are accessible from a unique interface (Figure 1).
Assignment of tilt angle
Once a tilt series is loaded into ImageJ, the user is
prompted to provide the tilt angle corresponding to the
first image and the angular increment used for image
recording. Based on these parameters, tilt angles are computed for each image by applying the two most commonly used angular schemes for acquisition: linear or
Page 2 of 9
(page number not for citation purposes)
BMC Bioinformatics 2007, 8:288
http://www.biomedcentral.com/1471-2105/8/288
Figureinterface
TomoJ
1
TomoJ interface. A: ImageJ user interface as presented after launching TomoJ. Note that the toolbar differs from the standard ImageJ toolbar. The standard toolbar can be regained by using the "switch toolbar" button on the TomoJ interface. B:
TomoJ interface divided into four regions. Top: global menus. Bottom (left to right): the regions devoted to automatic alignment, tools that require point selections, and 3D reconstruction. C: Data set window. The header includes the tilt-series
name, the number of the visualized image in the total stack, the total number of images in the stack, the tilt angle corresponding to the visualized image, the image byte type, and the total memory occupied by the stack.
Saxton [36] models. If other acquisition models are used,
tilt angles can be provided by a text file. The tilt angles can
then be manually modified, if required, for any individual
image using the command "assign tilt angle" from the
menu of TomoJ.
A single image can be removed from the tilt series using
the "remove image" button (Figure 1). This operation
does not modify the tilt-angle assignment of other images.
Normalization of tilt series
Tilt-series images must be placed in a common numerical
framework in order to eliminate differences between the
individual dynamic ranges. These differences are mainly
due to the fact that the electron beam crosses different
sample thicknesses as a function of the tilt angle. Normalization also facilitates visualization of the tilt series. Each
image (8, 16, or 32 bits) from a tilt series is expanded to a
32-bit real number and normalized to have a mean of 0
and a constant standard deviation (equal to 1), as
described in [37] using the equation:
In = (Im - Îm)/σm
where In is the normalized pixel value of an image, Im is
the original pixel value, and Îm and σm are the average and
standard deviation of the pixels from the whole image,
respectively. The normalization procedure is launched by
the TomoJ "normalization" button (Figure 1). Output is
generated as a 32-bit real image stack.
Alignment of tilt series
Correct registration (shift and rotation correction) of the
images from the tilt series is necessary to produce a quality
tomogram. TomoJ enables automatic and semiautomatic
alignment. If the data set has a low signal-to-noise ratio,
shift and rotation corrections can be computed from filtered data ("band pass filter" button in the TomoJ inter-
Page 3 of 9
(page number not for citation purposes)
BMC Bioinformatics 2007, 8:288
face or any other ImageJ filter) and then applied to the
original data set ("save transform" and "load transform"
buttons).
Automatic shift correction ("correct shift" button, Figure
1) is performed by computing the cross-correlation coefficient (CCC) between every 2 consecutive images and then
moving one of the images by the number of pixels
required to maximize the CCC. This step is carried out in
the frequency domain using the correlation property of
the Hartley transform (HT) [38]. The advantage of using
the HT is that it requires only half the memory of the most
frequently used Fourier transform (FT). In order to preserve the maximum amount of information, the common
region is maximized by subtracting the average of all computed shifts between every 2 consecutive images. To
improve alignment, a region of interest containing features with high signal-to-noise ratio can be selected. If this
region has side lengths of a power of 2, the alignment
process is accelerated by using the fast HT. The computed
shifts will be applied to the whole stack and can be saved
to a text file.
The problem of performing pair-wise comparisons is that,
in theory, the final alignment can be quite prone to bias
(although in practice this is not always true). Winkler and
Taylor [17] have proposed a method for automatic alignment whereby the central image of the tilt series is compared in a pair-wise fashion to its immediate neighbors.
Once the neighbors are aligned, they serve as templates
for their respective neighbors. This procedure is repeated
until all images are aligned. Although this procedure
tends to avoid bias, it does not guarantee an unbiased
final result. We are currently working on an alignment
procedure that avoids alignment bias by considering all
images at the same time.
Rotations can be automatically corrected using an equivalent procedure ("correct rotation" button, Figure 1), but if
the tilt series was acquired with an automated electron
microscope this is usually not required. However, it may
be necessary if the tilt series was manually recorded. Rotations between consecutive images are determined by maximizing the CCC in real space or by using the HT power
spectrum ("File" menu in Figure 1 and then "options"
submenu). Similar to the method for shifts, the average of
the computed rotations is subtracted from all rotations.
In the case of important shifts, semiautomatic prealignment ("center feature" button, Figure 1) may be required
before automatic alignment. Prealignment requires the
user to select point coordinates that correspond to recognizable features present in every image. Selection is performed using the PointPicker's toolbar [39], which
replaces the standard ImageJ toolbar on the ImageJ win-
http://www.biomedcentral.com/1471-2105/8/288
dow after launch of the TomoJ interface. The "switch toolbar" button (Figure 1) enables exchange between these
toolbars. PointPicker provides a user friendly interactive
tool to manually assign coordinates. Once the points are
selected, each image is moved so that the barycenter of the
feature coordinates is placed at the image center. These
precentered images are used as the input for automatic
alignment.
If the results of automatic alignment are unsatisfactory,
semiautomatic alignment is possible. This method is
based on the fact that points belonging to an object
rotated along a single axis in 3D space follow arcs around
the axis. The 2D projection of the points belonging to
these arcs determines parallel lines perpendicular to the
tilt axis. As transmission electron microscopy images are
projections of 3D objects, the trajectories of any projected
point of the 3D object follows lines in the tilt series. The
equations of these lines are determined by linear regression of coordinates of recognizable features. Each image is
then aligned using the average of the translations needed
to project each feature coordinate on its line. The semiautomatic alignment procedure requires knowledge of the
feature coordinates on a prealigned tilt series.
Determination of tilt axis
If the tilt axis is known, then tomogram reconstruction
requires only typing the value into the reconstruction
panel of the TomoJ window, vertically placing the tilt axis
using the corresponding button, and running the chosen
reconstruction algorithm. If the image size surpasses the
available computer memory, it is possible to obtain a
smaller region of interest for reconstruction using selection tools and the "Image->Crop" options from the
ImageJ window. This operation requires vertical placement of the tilt axis and switching to the ImageJ toolbar.
The cropped region can be located at any position in the
stack. After cropping, the user must update the TomoJ
image series by clicking the "update series" button (Figure
1). Shift correction in the cropped series is recommended
before running the reconstruction algorithms on the
cropped region.
If the tilt axis is unknown, it can be determined by 2 procedures. The simplest one, based on the FT of the projected aligned stack, requires discrete and well defined
fiducial markers, such as gold particles. In this case, the
ImageJ option "Z-project" from the "Image-->Stack"
menu enables computation of a projection of the stack
using the "min projection" option. From this image it is
possible to compute the FT using the "Analysis-->FFT"
menu from ImageJ. Finally, the tilt angle can be measured
using the angle tool of the ImageJ window. The tilt angle
is defined by the vertical line crossing the center of the FT
Page 4 of 9
(page number not for citation purposes)
BMC Bioinformatics 2007, 8:288
power spectrum image shown on the screen and the tilt
line that appears on it.
The second procedure uses the coordinates of a set of
selected points from recognizable features or fiducial
markers. The features coordinates are used to compute by
linear regression the equation of the line perpendicular to
the tilt axis. This line represents the average direction of
the features displacements. Before their use for tilt-axis
determination, features coordinates are validated using
the Pearson test to fit linear trajectories. The Pearson test
is performed on the linear regression coefficients for each
feature. The features not belonging to their line equation
with a confidence of 0.95 are excluded from further calculations. The tilt axis is computed as the line perpendicular
to the average feature displacement. The software provides
the angle (in degrees) required to position the tilt axis vertically. In addition, a confidence interval for the tilt angle
is computed from the confidence interval for the slope of
the average feature displacement equation. This method
requires the presence of at least three recognizable features
in most of the tilt-series images. At this stage, it is possible
to mark a feature in some of the images (for example,
every 10 images) using the PointPicker toolbar and to
interpolate the rest of the points using the "interpolate"
button. The position of the interpolated points can be corrected with the "move crosses" tool from the PointPicker
toolbar. Once one object is selected along the whole stack,
the operation can be repeated with the next object. At any
step, the tilt axis can be computed by clicking on the corresponding button of the TomoJ window. The value of the
tilt axis will be shown in a results window with its corresponding statistical error. Depending on the computed
error, the user can complete the tilt-axis determination
procedure or choose between correcting the point positions or adding new points. The points can also be used to
align the images using the "center with points" option
from the TomoJ menu. However, in most cases this operation is unnecessary because the images have previously
been centered. Point coordinates can be saved as a text file
and retrieved at any moment using the "save points"
option from the PointPicker toolbar.
Reconstruction
The final step in computing a tomogram is reconstruction.
For this purpose, the image stack must be aligned and the
tilt axis determined. Then, it is necessary to indicate the
volume thickness that corresponds to the expected
number of voxels that the reconstruction will occupy in
the Z-direction. The sample thickness in pixels can be
approximated by multiplying the sample thickness in
nanometers by the sampling size in nm/pixel.
Three reconstruction algorithms are implemented in
TomoJ: WBP [40], ART [20], and SIRT [21,22]. WBP is the
http://www.biomedcentral.com/1471-2105/8/288
most commonly used algorithm for reconstruction in ET.
This method compensates for overemphasis of low frequencies in Fourier space by using a weighting scheme
prior to reconstruction. Subsequently, the aligned and
weighted projections are back-projected into a 3D volume
using bilinear interpolation. ART and SIRT are performed
in an iterative manner so that the projections of the reconstructed volume computed through an image formation
model resemble the experimental projections obtained by
the microscope. A linear projection model with additive
Gaussian noise is assumed [21]. The linear projection
model is a first-order approximation of the nonlinear
image formation process occurring in the microscope
[41,42]. Furthermore, despite the fact that the noise is not
white [43], the SIRT formula for white noise is known to
produce good estimates of the underlying structures [44].
No special inputs are required to compute a volume using
WBP in TomoJ. For the iterative algorithms ART and SIRT,
it is necessary to provide the number of iterations and the
relaxation coefficient. In our experience, usually at least
four iterations are required to obtain a good tomogram.
The choice of the number of iterations depends on the
mean square error computed from the differences
between the projections of the reconstructed volume and
the experimental data. An error curve showing the error as
a function of the iteration number is displayed after completing the reconstruction process. The second parameter,
the relaxation coefficient, is a weighting factor used to
improve the quality of reconstruction, usually at the
expense of convergence [45]. TomoJ proposes for ART a
relaxation coefficient of (Number of iterations)-1, and of 1
for SIRT, which experimentally are good values for most
cases. However, these values can be manually modified.
In general, lower relaxation coefficients should be used
with data sets having a low signal-to-noise ratio, and
higher values in the opposite case. The error curve also
assists in the choice of the relaxation coefficient: rapid
convergence indicates that the relaxation coefficient is too
high and slow convergence indicates that it is too low.
Use of all the TomoJ tools is not strictly required to obtain
a tomogram. For instance, the tilt-axis angle is provided
by most microscope acquisition software. Thus, it can be
directly provided by the user. In addition, rotations are
normally negligible in an automatic acquisition procedure. Therefore, in most cases only the "normalize", "correct shift", "put tilt axis vertical", and "reconstruction"
steps are needed.
Volume combination in multiple-axis tomography
The inability to record projections at all tilt angles during
acquisition results in incomplete information. This inability is due to the increase in the effective sample thickness
(T) as a function of the initial thickness (t) and the tilt
Page 5 of 9
(page number not for citation purposes)
BMC Bioinformatics 2007, 8:288
angle (α): T =
t
, implying an infinite thickness to
cos(α )
traverse at α = 90°. This lack of information is known as
the missing wedge [10]. The missing wedge induces reconstruction artifacts (such as the elongation of patterns) in
the reconstructed volume perpendicular to the horizontal
plane. To compensate for this lack of information, it is
possible to rotate the sample in the horizontal plane,
recovering a portion of the missing projections. In this
way, if two rotations (usually 0° and 90°) are used to
record two tomographic series (each series with its own
maximum tilt angle), and the two reconstructed volumes
are combined in a merged tomogram, then the missing
wedge is transformed into a missing pyramid. This
approach is referred to as dual-axis tomography [11,12].
An extension of this approach is to record tomographic
series at the maximum possible number of rotations in
the horizontal plane, which results in a missing cone. This
approach is referred to as multiple-axis tomography [13].
Both dual- and multiple-axis reconstructions require
alignment of volumes before computing a final average.
TomoJ provides a second user friendly plug-in for combining the different single-axis reconstructions by simply
averaging volumes after registration.
Running TomoJ in batch mode
Some of the tasks for computing or merging tomograms
are greatly time consuming, depending on the processor
and memory used. As a plug-in for ImageJ, TomoJ runs in
the user window, which can block the computer from performing other interactive tasks. To overcome this problem, TomoJ can be run in batch mode. This can be
accomplished using various commands from the terminal; the full set is provided in the user manual (available
from the TomoJ web page).
Results and Discussion
TomoJ enables 3D reconstruction from tilt-series recorded
around a tilt axis, as in ET. The main advantage of this
software is the availability of different algorithms for
reconstruction. Thus, unlike other public domain software for electron tomography reconstruction (IMOD
[18], TOM [29], EM3D [30], and USCF tomography [31])
TomoJ can perform 3D reconstruction using the ART [20]
and SIRT [21]. The use of the ART and SIRT provides better
results than standard WBP [40] implemented in other
software. This is due to the fact that the two main limitations of electron tomography are the missing wedge and
the low signal-to-noise ratio of the images (this is mainly
the case with cryo-tomography). The robustness of WBP,
ART and SIRT has been evaluated by comparison of the
3D reconstructions computed by these three methods to
http://www.biomedcentral.com/1471-2105/8/288
an original phantom. Such comparison can be performed
using the coefficient of determination (COD) [22,46].
The COD is nearer to 1 when objects are more similar and
nearer to 0 when objects are more different. Running
TomoJ on the projections of the phantom shown in Figure
2a, after addition of Gaussian noise to the projections
(standard deviation of 25 in order to better simulate the
images obtained at the electron microscope), we obtained
a COD of 1.5%, 25.4%, and 25.6% for WBP, ART, and
SIRT, respectively. The COD obtained using WBP and
IMOD (2.2%) was equivalent to that for TomoJ WBP
(1.5%). Figure 2 shows the greater accuracy with ART and
SIRT versus WBP.
In addition to offering different reconstruction algorithms, TomoJ leverages the capabilities of ImageJ for preprocessing and denoising images. Different image filters
and denoising procedures, such as anisotropic diffusion,
can be used by downloading the corresponding plug-ins
from the ImageJ web page. These features are unavailable
in other tomographic freeware.
ImageJ also provides tools for visualization (such as the
plug-in VolumeViewer). Therefore, the development of
specific visualization tools inside TomoJ is not required.
In addition, ImageJ offers segmentation tools such as
manual tools and snake or watershed algorithms to assist
interpretation of complex volumes, which requires segmentation before visualization. Using the TomoJ export
options (MRC and SPIDER, appearing in the "save as"
menu of ImageJ after TomoJ installation), the segmented
volumes can also be exported to optimized freeware, such
as Chimera [47], for visualization. The main advantage of
Chimera is that it provides the required functionality for
visualization of volumes and is the standard for visualization of macromolecular 3D reconstructions from electron
microscopy data.
As Java-based public domain software implemented as a
plug-in for ImageJ, TomoJ can be used for research as well
as instruction. Increasingly, cell biology laboratories are
becoming interested in electron tomography. The userfriendly interface of ImageJ, the easy installation of
TomoJ, and the multiplatform capability (TomoJ has
been successfully tested on different architectures: BiOpteron 250, with 8 or 16 Gb RAM running Linux fedora
core; Windows XP 64; and PCs with Intel Pentium IV and
Centrino Core 2 duo with 1–2 Gb RAM) facilitate use of
TomoJ in biology laboratories. In addition, TomoJ
includes algorithms for multiple-axis tomography [13],
which allows tomographic reconstruction without electron microscopes equipped with high-tilt devices. These
microscopes, which are not devoted to tomography, are
available in most electron microscopy services in research
centers and universities. In addition, TomoJ will be
Page 6 of 9
(page number not for citation purposes)
BMC Bioinformatics 2007, 8:288
http://www.biomedcentral.com/1471-2105/8/288
Figure 2 between phantom data and reconstruction
Comparison
Comparison between phantom data and reconstruction. Slices 44, 54, 64, 74, and 84 of every volume are shown.
Reconstructions were performed on noisy projections of a phantom (range: -50° to +50°, every 1°, vertical tilt axis). A: Original phantom. B: Reconstruction using the ART with 10 iterations and a relaxation coefficient of 0.01. C: Reconstruction using
WBP. D: Reconstruction using the SIRT with 10 iterations and a relaxation coefficient of 1.
Page 7 of 9
(page number not for citation purposes)
BMC Bioinformatics 2007, 8:288
http://www.biomedcentral.com/1471-2105/8/288
expanded to compute 3D chemical mapping. This will
enable calculation of the spatial distribution of chemical
elements from tilt series acquired with the electron microscope at different energy-loss values [48]. Calculation of
these chemical maps requires background subtraction
using specific software (EFTETJ) [49], which has already
been developed as a plug-in for ImageJ in a preliminary
version. The EFTETJ output can be used as an input for
TomoJ to compute the 3D chemical map.
4.
Conclusion
7.
In this paper, we present new software for electron tomography. This software was specifically designed to be userfriendly, and it encompasses all algorithmic steps needed
for tomographic reconstruction. It also implements the
most recent algorithms for tomographic reconstructions.
The package has been written as a plug-in for ImageJ and
benefits from all the possibilities offered by this freeware.
As a Java program, it runs on all JAVA platforms. TomoJ
can be freely downloaded [49].
2.
3.
5.
6.
8.
9.
10.
11.
12.
Availability and requirements
Project name: TomoJ
Project
home
page:
softwaresu759.html
13.
http://u759.curie.u-psud.fr/
Operating system: platform independent
Programming language: Java
14.
15.
16.
Other requirements: Java 1.5.0 or higher
17.
License: Cecill
Any restrictions to use by non-academics: licence
needed
18.
19.
Authors' contributions
CM carried out the design and implementation of the software. TB participated in the design and implementation
of the reconstruction algorithms. COSS participated in the
design of the reconstruction algorithms. SM conceived
and coordinated the study, and participated in its design.
All authors read and approved the final manuscript.
Acknowledgements
20.
21.
22.
23.
This work was financed by the 3D EM European network (LSHG-CT-2004502828) and by the Institut Curie (PIC Physique du vivant). We would like
to thank the developers of ImageJ and PointPicker.
24.
References
25.
1.
Studer D, Graber W, Al-Amoudi A, Eggli P: A new approach for
cryofixation by high-pressure freezing.
J Microsc 2001,
203:285-294.
26.
Al-Amoudi A, Norlen LP, Dubochet J: Cryo-electron microscopy
of vitreous sections of native biological cells and tissues. J
Struct Biol 2004, 148:131-135.
Al-Amoudi A, Chang JJ, Leforestier A, McDowall A, Salamin LM, Norlen LP, Richter K, Blanc NS, Studer D, Dubochet J: Cryo-electron
microscopy of vitreous sections. EMBO J 2004, 23:3583-3588.
Lucic V, Forster F, Baumeister W: Structural studies by electron
tomography: from cells to molecules. Annu Rev Biochem 2005,
74:833-865.
Frank J: Three-Dimensional Electron Microscopy of Macromolecular
Assemblies: Visualization of Biological Molecules in Their Native State
Oxford University Press, USA; 2006.
Gipson B, Zeng X, Zhang ZY, Stahlberg H: 2dx – user-friendly
image processing for 2D crystals. J Struct Biol 2007, 157:64-72.
Frank J: Electron tomography. Three-dimensional imaging with the transmission electron microscope Plenum Press. New York; 1992.
Gué M, Marco S, Croisy A, Rigaud JL, Boudier T: Integrative Imaging: a new challenge for cell biology. Imaging and microscopy
2005, 7:51-53.
Baumeister W: Electron tomography: towards visualizing the
molecular organization of the cytoplasm. Curr Opin Struct Biol
2002, 12:679-684.
Hoppe W, Hegerl R: Three-dimensional structure determination by electron microscopy. In computer processing of electron
microscope images Edited by: Hawkes PW. Heidelberg: Springer-Verlag; 1980:127-186.
Penczek P, Marko M, Buttle K, Frank J: Double-tilt electron tomography. Ultramicroscopy 1995, 60:393-410.
Mastronarde DN: Dual-axis tomography: an approach with
alignment methods that preserve resolution. J Struct Biol 1997,
120:343-352.
Messaoudi C, de Loubresse NG, Boudier T, Dupuis-Williams P,
Marco S: Multiple-axis tomography: applications to basal bodies from Paramecium tetraurelia. Biol Cell 2006, 98:415-425.
Lanzavecchia S, Cantele F, Bellon PL, Zampighi L, Kreman M, Wright
E, Zampighi GA: Conical tomography of freeze-fracture replicas: a method for the study of integral membrane proteins
inserted in phospholipid bilayers. J Struct Biol 2005, 149:87-98.
Zampighi GA, Zampighi L, Fain N, Wright EM, Cantele F, Lanzavecchia S: Conical tomography II: A method for the study of cellular organelles in thin sections. J Struct Biol 2005, 151:263-274.
Liu Y, Penczek PA, McEwen BF, Frank J: A marker-free alignment
method for electron tomography.
Ultramicroscopy 1995,
58:393-402.
Winkler H, Taylor KA: Accurate marker-free alignment with
simultaneous geometry determination and reconstruction
of tilt series in electron tomography. Ultramicroscopy 2006,
106:240-254.
Kremer JR, Mastronarde DN, McIntosh JR: Computer visualization of three-dimensional image data using IMOD. J Struct Biol
1996, 116:71-76.
Radermacher M: Three-dimensional reconstruction of single
particles from random and nonrandom tilt series. J Electron
Microsc Tech 1988, 9:359-394.
Herman GT, Lent A, Rowland SW: ART: mathematics and applications. A report on the mathematical foundations and on
the applicability to real data of the algebraic reconstruction
techniques. J Theor Biol 1973, 42:1-32.
Gilbert P: Iterative methods for the three-dimensional reconstruction of an object from projections. J Theor Biol 1972,
36:105-117.
Tong J, Arslan I, Midgley P: A novel dual-axis iterative algorithm
for electron tomography. J Struct Biol 2006, 153:55-63.
Fernandez JJ, Li S: An improved algorithm for anisotropic nonlinear diffusion for denoising cryo-tomograms. J Struct Biol
2003, 144:152-61.
Frank J, Radermacher M, Penczek P, Zhu J, Li Y, Ladjadj M, Leith A:
SPIDER and WEB: processing and visualization of images in
3D electron microscopy and related fields. J Struct Biol 1996,
116:190-199.
van Heel M, Harauz G, Orlova EV, Schmidt R, Schatz M: A new generation of the IMAGIC image processing system. J Struct Biol
1996, 116:17-24.
Sorzano CO, Marabini R, Velazquez-Muriel J, Bilbao-Castro JR,
Scheres SH, Carazo JM, Pascual-Montano A: XMIPP: a new gener-
Page 8 of 9
(page number not for citation purposes)
BMC Bioinformatics 2007, 8:288
27.
28.
29.
30.
31.
32.
33.
34.
35.
36.
37.
38.
39.
40.
41.
42.
43.
44.
45.
46.
47.
48.
49.
ation of an open-source image processing package for electron microscopy. J Struct Biol 2004, 148:194-204.
Tang G, Peng L, Baldwin PR, Mann DS, Jiang W, Rees I, Ludtke SJ:
EMAN2: an extensible image processing suite for electron
microscopy. J Struct Biol 2007, 157:38-46.
McEwen BF, Frank J: Electron tomography and other
approaches for imaging molecular machines. J Curr Opin Neurobiol 2001, 11:594-600.
Nickell S, Forster F, Linaroudis A, Net WD, Beck F, Hegerl R, Baumeister W, Plitzko JM: TOM software toolbox: acquisition and
analysis for electron tomography.
J Struct Biol 2005,
149:227-234.
Harlow ML, Ress D, Stoschek A, Marshall RM, McMahan UJ: The
architecture of active zone material at the frog's neuromuscular junction. Nature 2001, 409:479-484.
Zheng SQ, Keszthelyi B, Branlund E, Lyle JM, Braunfeld MB, Sedat JW,
Agard DA: UCSF tomography: an integrated software suite
for real-time electron microscopic tomographic data collection, alignment, and reconstruction. J Struct Biol 2007,
157:138-147.
Abramoff M, Magelhaes P, Ram S: Image Processing with ImageJ.
Biophotonics International 2004, 11:36-42.
ImageJ [http://rsb.info.nih.gov/ij/]
Messaoudi C: Développements en tomographie électronique
et application à l'étude du centrosome. In PhD thesis Université
Pierre et Marie Curie; 2006.
Hurbain I, Boudier T, Thomas D, Marks M, Raposo G, Marco S:
Describing the internal morphology of melanosomes by
electron tomography. Proceedings of the International Microscopy
Congress: 4–8 September 2006; Sapporo. Japan .
Saxton WO, Baumeister W, Hahn M: Three-dimensional reconstruction of imperfect two-dimensional crystals. Ultramicroscopy 1984, 13:57-70.
Sorzano COS, de la Fraga LG, Clackdoyle R, Carazo JM: Normalizing projection images: a study of image normalizing procedures for single particle three-dimensional electron
microscopy. Ultramicroscopy 2004, 101:129-138.
Bracewell R: The Hartley Transform Oxford University Press; 1986.
PointPicker plug-in [http://bigwww.epfl.ch/thevenaz/pointpicker/]
Radermacher M: Weighted backprojection methods. In Electron
tomography Edited by: Frank J. New York, Plenum Press; 1992:91-115.
Lawrence A, Bouwer JC, Perkins G, Ellisman MH: Transform-based
backprojection for volume reconstruction of large format
electron microscope tilt series. J Struct Biol 2006, 154:144-167.
Philippsen A, Engel HA, Engel A: The contrast-imaging function
for tilted specimens. Ultramicroscopy 2007, 107:202-212.
Velázquez-Muriel JA, Sorzano COS, Fernández JJ, Carazo JM: A
method for estimating the CTF in electron microscopy
based on ARMA models and parameter adjusting. Ultramicroscopy 2003, 96:17-35.
Penczek P, Radermacher M, Frank J: Three-dimensional reconstruction of single particles embedded in ice. Ultramicroscopy
1992, 40:33-53.
Kak AC, Slaney M: Principles of Computerized Tomographic Imaging IEEE
Press; 1988.
Draper NR, Smith H: Applied Regression Analysis second edition. Wiley,
New York; 1981.
Pettersen EF, Goddard TD, Huang CC, Couch GS, Greenblatt DM,
Meng EC, Ferrin TE: UCSF Chimera – A Visualization System
for Exploratory Research and Analysis. J Comput Chem 2004,
25:1605-1612.
Boudier T, Lechaire JP, Frébourg G, Messaoudi C, Mory C, Colliex C,
Gaill F, Marco S: A public software for energy filtering transmission electron tomography (EFTET-J): application to the
study of granular inclusions in bacteria from Riftia pachyptila. J Struct Biol 2005, 151:151-159.
TOMOJ
/
EFTETJ
[http://u759.curie.u-psud.fr/
softwaresu759.html]
http://www.biomedcentral.com/1471-2105/8/288
Publish with Bio Med Central and every
scientist can read your work free of charge
"BioMed Central will be the most significant development for
disseminating the results of biomedical researc h in our lifetime."
Sir Paul Nurse, Cancer Research UK
Your research papers will be:
available free of charge to the entire biomedical community
peer reviewed and published immediately upon acceptance
cited in PubMed and archived on PubMed Central
yours — you keep the copyright
BioMedcentral
Submit your manuscript here:
http://www.biomedcentral.com/info/publishing_adv.asp
Page 9 of 9
(page number not for citation purposes)