1
BMC Bioinformatics 2007, 8:288
power spectrum image shown on the screen and the tilt
line that appears on it.
The second procedure uses the coordinates of a set of
selected points from recognizable features or fiducial
markers. The features coordinates are used to compute by
linear regression the equation of the line perpendicular to
the tilt axis. This line represents the average direction of
the features displacements. Before their use for tilt-axis
determination, features coordinates are validated using
the Pearson test to fit linear trajectories. The Pearson test
is performed on the linear regression coefficients for each
feature. The features not belonging to their line equation
with a confidence of 0.95 are excluded from further calculations. The tilt axis is computed as the line perpendicular
to the average feature displacement. The software provides
the angle (in degrees) required to position the tilt axis vertically. In addition, a confidence interval for the tilt angle
is computed from the confidence interval for the slope of
the average feature displacement equation. This method
requires the presence of at least three recognizable features
in most of the tilt-series images. At this stage, it is possible
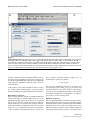
to mark a feature in some of the images (for example,
every 10 images) using the PointPicker toolbar and to
interpolate the rest of the points using the "interpolate"
button. The position of the interpolated points can be corrected with the "move crosses" tool from the PointPicker
toolbar. Once one object is selected along the whole stack,
the operation can be repeated with the next object. At any
step, the tilt axis can be computed by clicking on the corresponding button of the TomoJ window. The value of the
tilt axis will be shown in a results window with its corresponding statistical error. Depending on the computed
error, the user can complete the tilt-axis determination
procedure or choose between correcting the point positions or adding new points. The points can also be used to
align the images using the "center with points" option
from the TomoJ menu. However, in most cases this operation is unnecessary because the images have previously
been centered. Point coordinates can be saved as a text file
and retrieved at any moment using the "save points"
option from the PointPicker toolbar.
Reconstruction
The final step in computing a tomogram is reconstruction.
For this purpose, the image stack must be aligned and the
tilt axis determined. Then, it is necessary to indicate the
volume thickness that corresponds to the expected
number of voxels that the reconstruction will occupy in
the Z-direction. The sample thickness in pixels can be
approximated by multiplying the sample thickness in
nanometers by the sampling size in nm/pixel.
Three reconstruction algorithms are implemented in
TomoJ: WBP [40], ART [20], and SIRT [21,22]. WBP is the
http://www.biomedcentral.com/1471-2105/8/288
most commonly used algorithm for reconstruction in ET.
This method compensates for overemphasis of low frequencies in Fourier space by using a weighting scheme
prior to reconstruction. Subsequently, the aligned and
weighted projections are back-projected into a 3D volume
using bilinear interpolation. ART and SIRT are performed
in an iterative manner so that the projections of the reconstructed volume computed through an image formation
model resemble the experimental projections obtained by
the microscope. A linear projection model with additive
Gaussian noise is assumed [21]. The linear projection
model is a first-order approximation of the nonlinear
image formation process occurring in the microscope
[41,42]. Furthermore, despite the fact that the noise is not
white [43], the SIRT formula for white noise is known to
produce good estimates of the underlying structures [44].
No special inputs are required to compute a volume using
WBP in TomoJ. For the iterative algorithms ART and SIRT,
it is necessary to provide the number of iterations and the
relaxation coefficient. In our experience, usually at least
four iterations are required to obtain a good tomogram.
The choice of the number of iterations depends on the
mean square error computed from the differences
between the projections of the reconstructed volume and
the experimental data. An error curve showing the error as
a function of the iteration number is displayed after completing the reconstruction process. The second parameter,
the relaxation coefficient, is a weighting factor used to
improve the quality of reconstruction, usually at the
expense of convergence [45]. TomoJ proposes for ART a
relaxation coefficient of (Number of iterations)-1, and of 1
for SIRT, which experimentally are good values for most
cases. However, these values can be manually modified.
In general, lower relaxation coefficients should be used
with data sets having a low signal-to-noise ratio, and
higher values in the opposite case. The error curve also
assists in the choice of the relaxation coefficient: rapid
convergence indicates that the relaxation coefficient is too
high and slow convergence indicates that it is too low.
Use of all the TomoJ tools is not strictly required to obtain
a tomogram. For instance, the tilt-axis angle is provided
by most microscope acquisition software. Thus, it can be
directly provided by the user. In addition, rotations are
normally negligible in an automatic acquisition procedure. Therefore, in most cases only the "normalize", "correct shift", "put tilt axis vertical", and "reconstruction"
steps are needed.
Volume combination in multiple-axis tomography
The inability to record projections at all tilt angles during
acquisition results in incomplete information. This inability is due to the increase in the effective sample thickness
(T) as a function of the initial thickness (t) and the tilt
Page 5 of 9
(page number not for citation purposes)