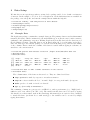
1
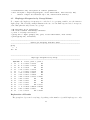
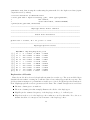
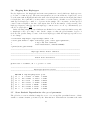
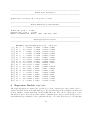
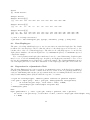
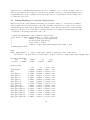
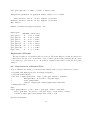
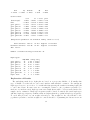
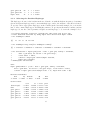
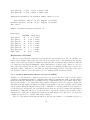
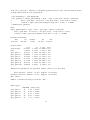
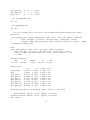
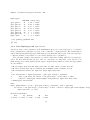
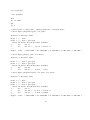
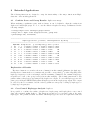
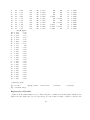
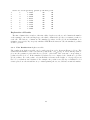
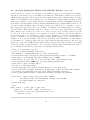
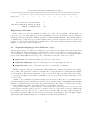
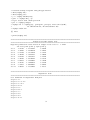
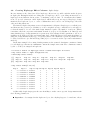
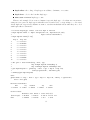
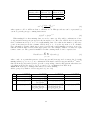
a portion of the output is illustrated above (limited again by nlines). The first section gives a short summary of how many subjects appear in each of the groups. The second section is a table with the following columns: The first column gives row numbers. The next columns (3 in this example) illustrate the alleles of the haplotypes. Total are the estimated haplotype frequencies for the entire data set. The last columns are the estimated haplotype frequencies for the subjects in the levels of the group variable (y.bin=0 and y.bin=1 in this example). Note that some haplotype frequencies have an NA, which appears when the haplotypes do not occur in the subgroups. 4 Power and Sample Size for Haplotype Association Studies It is known that using haplotypes has greater power than single-markers to detect genetic association in some circumstances. There is little guidance, however, in determining sample size and power under different circumstances, some of which include: marker type, dominance, and effect size. The haplo.stats package now includes functions to calculate sample size and power for haplotype association studies, which is flexible to handle these multiple circumstances. Based on work in Schaid 2005[2], we can take a set of haplotypes with their population frequencies, assign a risk to a subset of the haplotypes, then determine either the sample size to achieve a stated power, or the power for a stated sample size. Sample size and power can be calculated for either quantitative traits or case-control studies. 4.1 Quantitative Traits: haplo.power.qt We assume that quantitative traits will be modeled by a linear regression. Some well-known tests for association between haplotypes and the trait include score statistics[3] and an F-test[4]. For both types of tests, power depends on the amount of variance in the trait that is explained by haplotypes, or a multiple correlation coefficient, R2 . Rather than specifying the haplotype coefficients directly, we calculate the vector of coefficients based on an R2 value. In the example below, we load an example set of haplotypes that contain 5 markers, and specify the indices of the at-risk haplotypes; in this case, whichever haplotype has allele 1 at the 2nd and 3rd markers. We set the first haplotype (most common) as the baseline. With these values we calculate the vector of coefficients for haplotype effects from find.haplo.beta.qt using an R2 = 0.01. Next, we use haplo.power.qt to calculate the sample size for the set of haplotypes and their coefficients, type-I error (alpha) set to 0.05, power at 80%, and the same mean and variance used to get haplotype coefficients. Then we use the sample size needed for 80% power for un-phased haplotypes (2, 826) to get the power for both phased and un-phased haplotypes. > > > > > # load a set of haplotypes (hap-1 from Schaid 2005) data(hapPower.demo) #### an example using save.em hla markers may go like this. # keep <- which(save.em$hap.prob > .004) # get an index of non-rare haps 14